Interstitial segregation has the potential to mitigate liquid metal embrittlement in iron
Abstract
The embrittlement of metallic alloys by liquid metals leads to catastrophic material failure and severely impacts their structural integrity. The weakening of grain boundaries by the ingress of liquid metal and preceding segregation in the solid are thought to promote early fracture. However, the potential of balancing between the segregation of cohesion-enhancing interstitial solutes and embrittling elements inducing grain boundary decohesion is not understood. Here, we unveil the mechanisms of how boron segregation mitigates the detrimental effects of the prime embrittler, zinc, in a tilt grain boundary in Fe ( Al). Zinc forms nanoscale segregation patterns inducing structurally and compositionally complex grain boundary states. Ab-initio simulations reveal that boron hinders zinc segregation and compensates for the zinc induced loss in grain boundary cohesion. Our work sheds new light on how interstitial solutes intimately modify grain boundaries, thereby opening pathways to use them as dopants for preventing disastrous material failure.
Introduction
Grain boundary (GB) properties such as cohesive strength or mobility can be significantly altered through segregation of alloying elements or impurities 1. One of the most detrimental elements impacting the properties of GBs in iron (Fe) and steel is zinc (Zn), which promotes brittle intergranular fracture of the material through liquid metal induced embrittlement (LMIE) 2, 3, 4, 5, 6, 7, 8, 9.
Several models were proposed to explain the underlying mechanisms leading to LMIE 10. The Stoloff–Johnson–Westwood–Kamdar (SJWK) model considers that the liquid metal adsorbed at the crack tip promotes crack propagation under an applied stress by weakening the strength of the interatomic bonds 11, 12. In contrast, stress-assisted GB diffusion preceding the crack initiation is assumed to be the root cause for the increase in grain boundary brittleness in the Krishtal-Gordon-An model13. DiGiovanni et. al 14 investigated the diffusion of Zn in Fe by means of electron-probe microanalysis (EPMA) before and after mechanical loading. Their observations confirmed that stress-assisted diffusion in the vicinity of the crack tip is one of the dominant mechanisms. There are various explanations on the origin of the segregation induced GB embrittlement process. Atomic size differences in Cu-Bi, also an LMIE system, were shown to cause local strain fields, which facilitate a reduction in GB cohesion 15. However, the size differences between Fe and Zn are not large enough to play a major role. Instead electronic effects such as bonding type 16 and mobility 17, 18, 19 can be made responsible for GB embrittlement. Peng et al. 20 performed first-principles tensile tests on a Zn segregated GB in ferritic Fe. They found a weakening of the GB because of covalent bonding between Zn and Fe, which ultimately reduces the charge density between the Fe atoms and hence their bond strength.
In order to prevent LMIE, it was proposed to introduce cohesion enhancing alloying elements to GBs. Scheiber et al. 9 concluded from ab-initio and thermodynamic modelling that the embrittling effect of Zn at different symmetrical bcc-Fe tilt GBs can be reduced by Al and Si, which is related to site-competition as well as repulsive interactions between the solutes and Zn. Although a large body of experimental and theoretical studies on LMIE exist 21, 22, 23, a fundamental understanding on the relationships between the GB structure, Zn segregation and its impact on embrittlement is lacking. Especially, the role of interstitial solutes on the embrittlement of GBs by Zn has not been considered, while for example C and B are known to act as GB cohesion enhancers in Fe-based alloys 24, 25, 26, 27, 28, 29. Miyazawa et al. 28 have shown by first-principles based calculations that segregation of C would increase the GB cohesion in Fe. In contrast to C, B can occupy substitutional as well as interstitial positions in -Fe 30 and would enhance the cohesion strength of the GB when taking up interstitial positions 18. Therefore, it is of great interest to understand how cohesion enhancing solutes such as B and C impact the segregation behavior of Zn and how their interplay affects the detrimental effect of Zn on GB cohesion on an atomistic level.
Here, we study the local atomic structure and composition of a (3 1 0)[0 0 1] tilt GB in a bicrystal of body centered cubic (bcc) Fe at different levels of Zn segregation. By atomically resolved microscopic probing techniques, we find that Zn forms nanometer sized segregation lines in a region preceding the former solid-liquid interface. However, both B and C are homogeneously distributed across the GB plane. The Zn-segregation pattern formation is explained by density-based phase-field simulations revealing a miscibility gap of the GB, which promotes a GB phase decomposition. Furthermore, our ab-initio calculations show that the presence of B and C significantly reduces the segregation energy of Zn due to strong repulsive interactions, which also leads to a reduction of the maximum Zn concentration at the GB. Interestingly, B is capable to compensate for the reduction in the work of separation through Zn even for high Zn GB concentrations. Our work suggests that interstital solutes such as B and C have the potential to mitigate the embrittling tendency of Zn. These insights provide pathways to prevent liquid metal embrittlement in Fe by controlled addition of cohesion enhancing elements.
Results
Global grain boundary structure
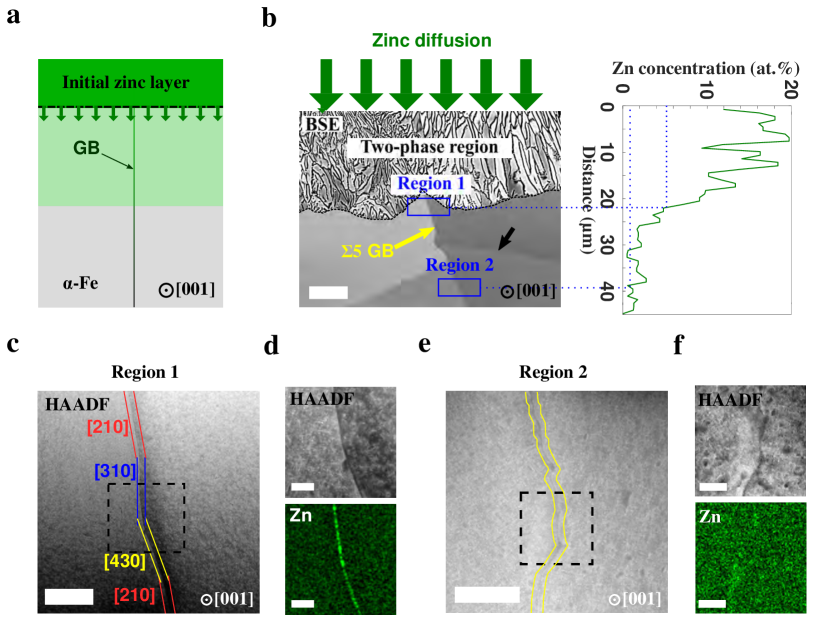
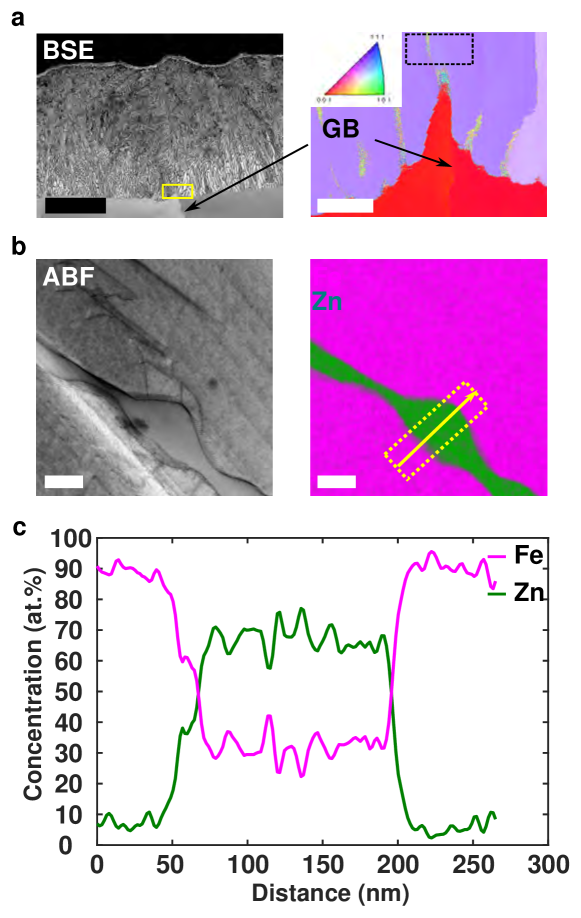
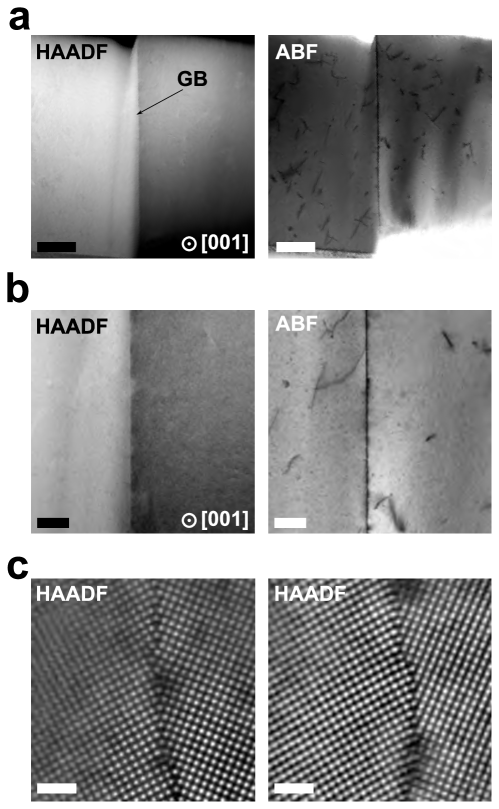
We use a bicrystal containing a (3 1 0)[0 0 1] tilt GB with trace amounts of B and C to study Zn segregation from the liquid state into the GB and the interaction of Zn with the interstitial solutes. We formed a diffusion couple of Zn and the bicrystal, and subsequently annealed it at C to liquefy the Zn reservoir and enable diffusion of Zn into the solid Fe bicrystal as schematically shown in Fig. 1a. The detailed experimental procedure is described in the Methods and Extended Data sections. The backscattered electron (BSE) secondary electron microscopy (SEM) image in Fig. 1b shows a two-phase region at the interface between the former liquid Zn reservoir and the Fe bicrystal consisting of Fe (bcc) and Zn (see Extended Data). Here, we limit our observations to the GB below this two-phase region. We specifically focus on two different GB areas indicated as "Region ", which is Zn-rich with an average concentration of Zn determined by energy-dispersive X-ray spectroscopy (EDS) in the SEM of 5 at., and "Region " with an average Zn content of 0.5 at. (see Fig. 1b ). Region is 5 below the two-phase region and high angle annular dark-field (HAADF) imaging along the tilt axis in the scanning transmission electron microscope (STEM) reveals that the GB inclination is locally deviating from the exact (310) habit plane (see Fig. 1c). Corresponding STEM-EDS measurements shown in Fig. 1d demonstrate strong segregation of Zn to the GB and suggest that it is inhomogeneously distributed along the GB. The GB in Region , which is 30 away from the two-phase region, is curved and exhibits a high density of local kinks as shown in Fig. 1e. Zinc is only slightly enriched at the GB as shown in the elemental map in Fig. 1f.
.
Near atomic scale zinc segregation
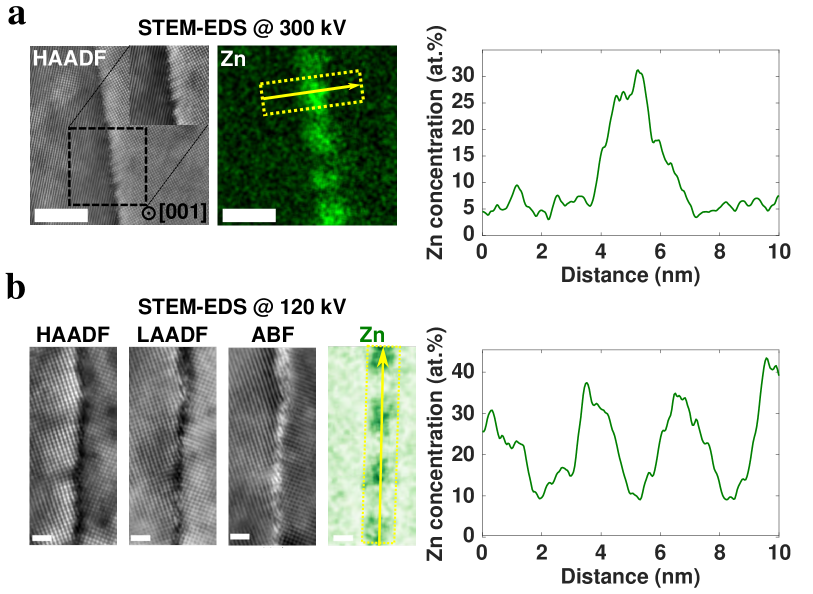
We performed near atomic resolution STEM-EDS elemental mapping in the Zn-rich Region of the bicrystal. Figure 2 shows atomic resolution STEM images and the associated Zn distribution along the GB at acceleration voltages of and , respectively. The HAADF-STEM images in Fig. 2a and b reveal that the GB structure appears disrupted by a high density of GB defects. Measurements at shown in Fig. 2b clearly demonstrate clustering of Zn at the GB into Zn-rich (35 ) and Zn-lean (10 ) regions having a width of 1 nm and a regular spacing of 3-4 nm. Although Zn has a slightly higher atomic number than Fe (Z=4), the corresponding HAADF-STEM images do not show any indication of regions with higher intensity. More information on the STEM-EDS measurements will be discussed later.
To obtain further insights into the 3D arrangement of the Zn segregation and its correlation to the distribution of the impurity elements B and C, we performed atom probe tomography (APT) experiments from the same regions as our STEM investigations.
Grain boundary composition
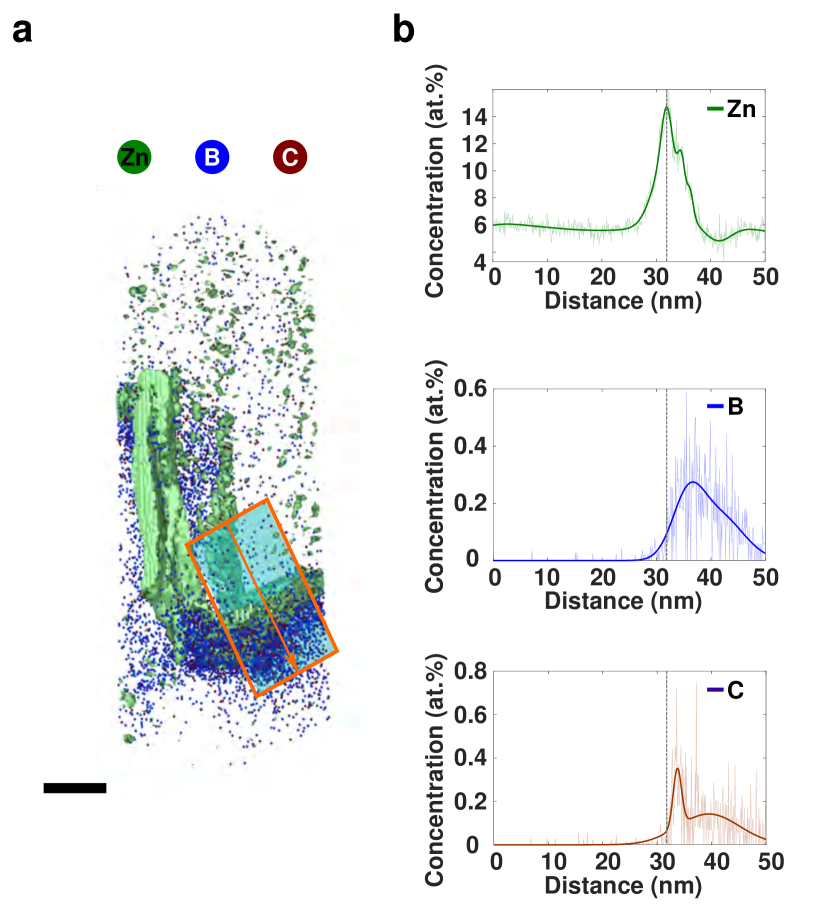
Figure 3a presents the reconstructed D-volume of the needle-shaped specimen viewed along the tilt axis extracted from Region (Zn-rich), where the GB is positioned at a 45∘ angle 100 nm away from the apex. Besides the segregation of Zn, B and C are also observed to segregate to the GB. The 3D atom map of B shows a rather unusual behavior in the form of a tail that extends into the lower grain for nearly 50 nm, although it has been recognized that anomalies in the field evaporation of solutes can lead to asymmetric solute distribution at GBs 31. The concentration profile of B extracted across the GB in Fig. 3b verifies this observation, which will be discussed later. The bulk Zn concentration of 5.5 from APT agrees with STEM-EDS measurements (Fig. 2). The averaged GB concentration of Zn reaches a value of 10 . As we have seen before, the Al concentration decreases to 2.7 at the GB due to the presence of B and C 24. Both concentration profiles of B and C show a broadened and asymmetric shape with a tail towards the left side corresponding to the lower grain in the reconstruction (Fig. 3a). The peak concentration of B and C in the initially investigated GB before Zn segregation was and 24, which is reduced by a factor of 4 and 10, respectively. A close inspection of the peak locations of the concentration profiles reveals an offset of the B peak of 1 nm with respect to that of the Zn concentration peak. A similar behavior was obtained in a different APT specimen as shown in the Extended Data Figure 4.
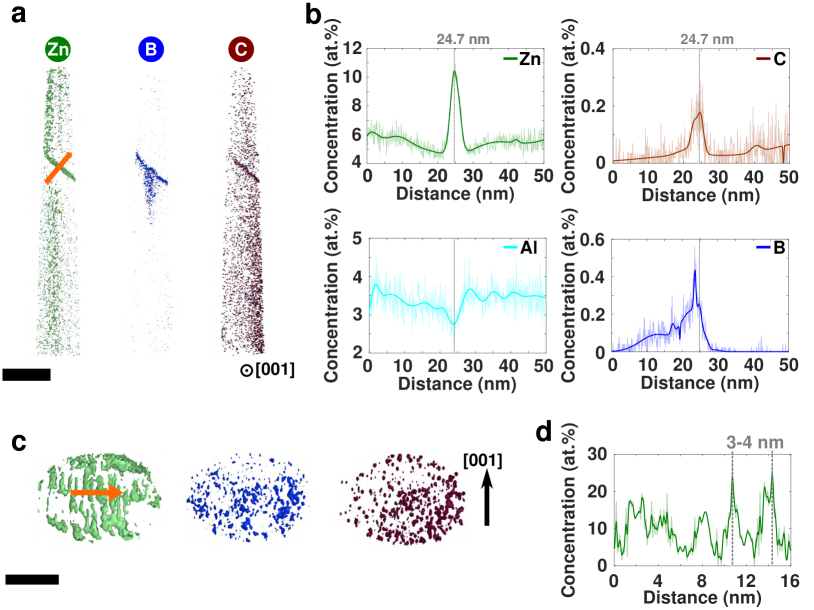
Observations of the in-plane distribution of Zn within the GB obtained by APT reveals that Zn is arranged in the form of segregation lines which are aligned along the [001] tilt axis (see Figs. 3c and d). However, B and C show a homogeneous distribution within the GB plane as shown in Fig. 3c. A similar modulation in Zn concentration was observed by STEM-EDS shown in Fig. 2.
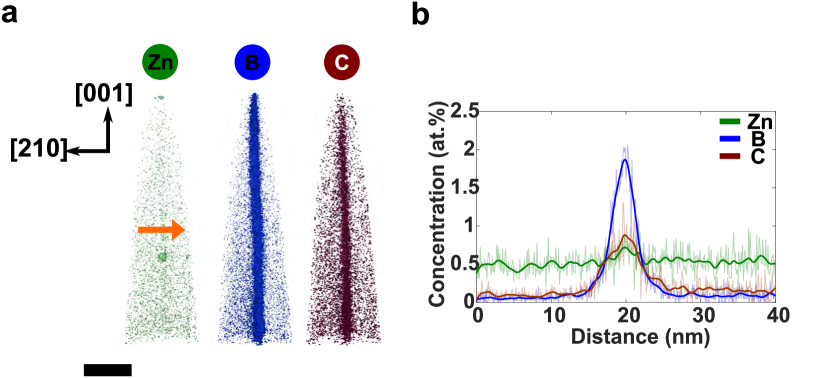
APT investigations were also performed in Region (see Extended Figure 5), revealing a lower average bulk Zn content of 0.5 . Interestingly, no clear indication for Zn segregation to the GB containing B and C with peak concentration values of 1.8 and 0.8 , respectively (shown in Extended Figure 5b), is found. In comparison to the Zn-rich Region of Fig. 3b, the peak B and C concentration at the GB in the Zn-lean Region is nearly a factor of 4 higher, similar to values obtained in the as-grown bicrystal 24. Furthermore, the concentration profiles of B and C adopt a symmetric shape, in contrast to that observed in Region (Fig. 3b).
Atomic grain boundary structure
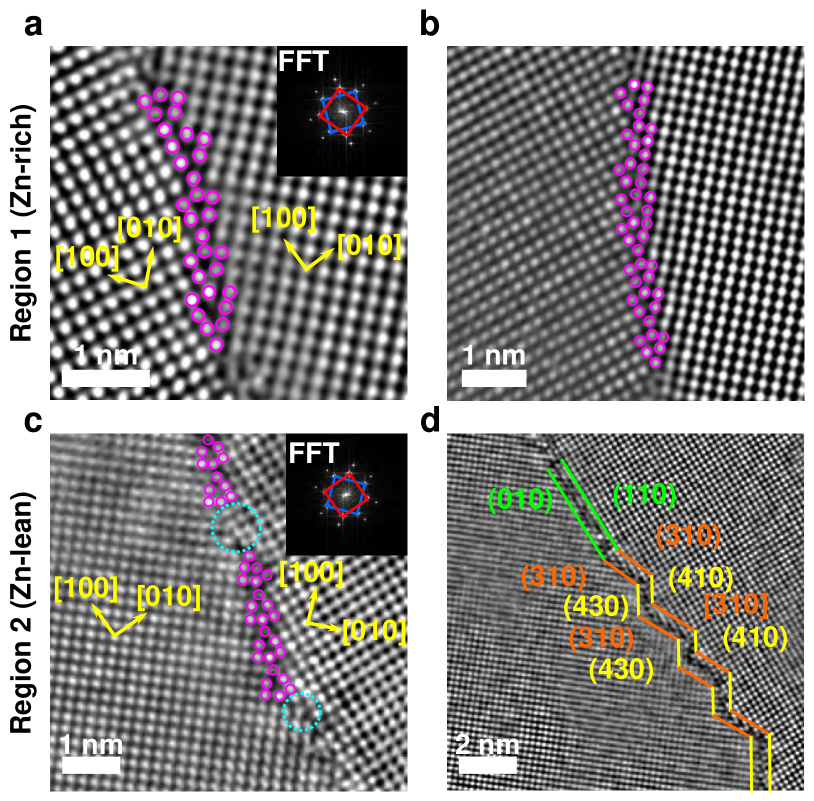
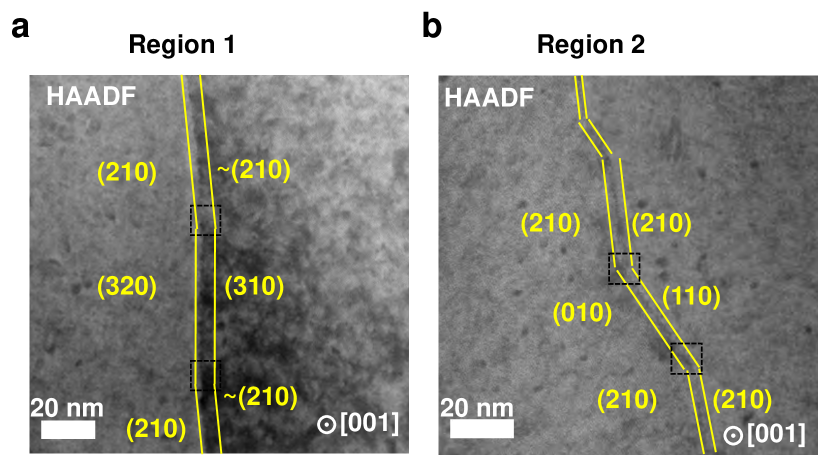
To explore the underlying atomic GB structure in both Region (Zn-rich) and (Zn-lean), we used atomic resolution HAADF-STEM imaging as shown in Fig. 4. The HAADF-STEM overview image of the GB in Region shown in the Extended Figure 4 a reveals a slight curvature of the GB, which leads to the formation of different nanoscale GB facets with varying GB planes close to . The atomic resolution images of Fig. 4 a and b show that the GB structure is composed of kite-type structural units, which are disrupted by GB defects. Locally, the GB habit plane is varying between - and -type as well as asymmetric GB segments.
The GB in Region (Zn-lean) is composed of nanofacets with different GB plane inclinations (see Fig. 1 e and Supplementary Figure 4 b). Figure 4 b shows a magnified HAADF-STEM image of the GB in Region , where the GB alternates between symmetric and asymmetric segments. The atomic GB structure in Fig. 4 c shows a near GB with kite-type structural units, which are interrupted by GB steps or disconnections (highlighted by dashed cyan circles) to compensate for deviations in GB inclination. In other areas in Region the GB is dissociating into a nanofaceted structure (see Fig. 4 d).
Grain boundary decomposition
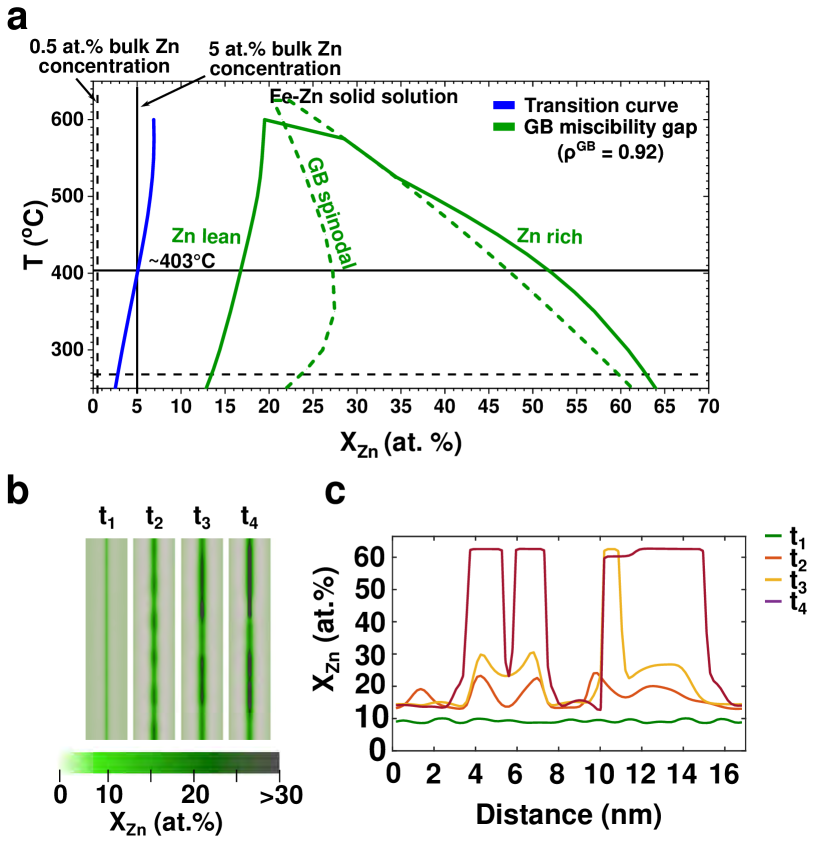
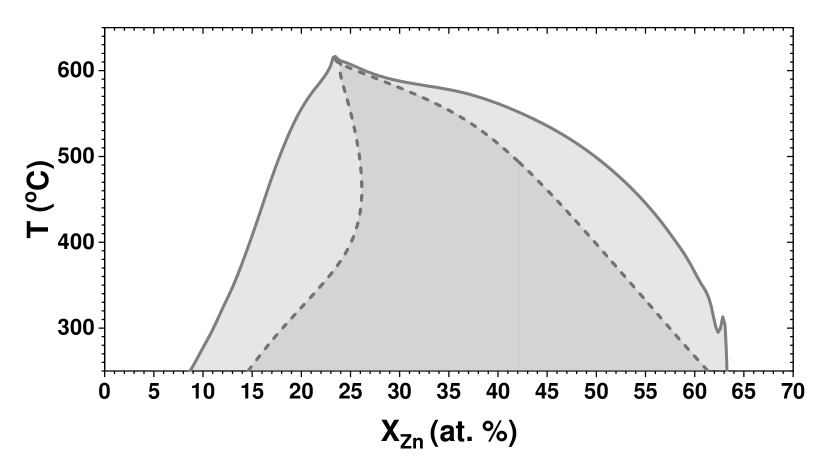
The phase decomposition behavior of the GB was further explored by density-based phase-field (DPF) modeling and simulation. The computational details are given in the Methods section. In a first step, we modelled the GB phase diagram in the Fe-Zn system, which is shown in Fig. 5 a. Following this thermodynamic assessment, the GB exhibits a miscibility gap, which separates Zn-lean and Zn-rich phase regions, comparable to the Fe-Zn bulk phase diagram (see Extended Data Figure 8). The origin of this phase separation in the -Fe-Zn system is related to magnetic ordering 32. The transition curve (blue) in Fig. 5 a represents the critical temperature dependent bulk concentration at which the GB is expected to decompose into Zn-rich and Zn-lean domains. This also means that crossing the blue curve from left to right, e.g., via a change in temperature, a low-to-high Zn segregation transition is expected within the GB.
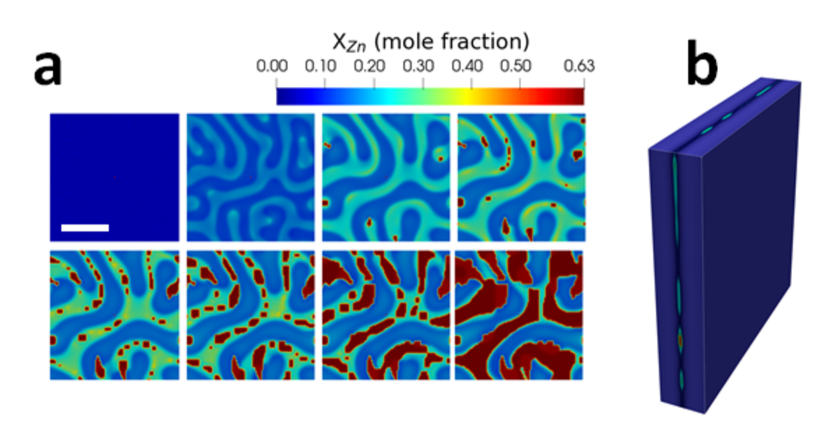
Interestingly, for a bulk Zn concentration of 5 at.% as observed in Region 1 in the experiment (see Fig. 1 b and 2 a) the DPF modeling predicts a GB phase decomposition at 403∘C (highlighted by the horizontal line in Fig. 5 a) and the GB is expected to decompose into a two-phase structure with Zn concentrations of (Zn-lean) and (Zn-rich), respectively. With decreasing temperature, the Zn-rich domains further enrich in Zn up to at 275∘C and the concentration of the Zn-lean regions reduces slightly to (shown by the dashed horizontal line). The time dependent GB phase evolution was investigated by 3D DPF simulations at 300∘C and a bulk Zn concentration of 5 at.% as shown in Fig. 5 b and c. Figure 5 b shows the evolution of the Zn concentration in an edge on view at the GB for four different time steps. The in-plane evolution of the Zn-rich and -lean domains are shown in Extended Data Figure 10. Initially, Zn is homogeneously distributed along the GB with a concentration of , as also seen in the concentration profiles extracted along the GB shown in Figure 5 b (green curve). With progressing time, the GB phase separates into Zn-rich () and Zn-lean () domains, which are separated by consistent with the experimental observations. For a bulk Zn concentration of 0.5 at.%, no GB decomposition is observed according to the DPF simulations.
The predicted composition of the Zn-rich GB regions is higher than determined experimentally, since the GB phase decomposition is kinetically limited at lower temperatures in the experiment. This is evident from the APT measurements shown in Fig. 3 b, where depletion of Zn adjacent to the GB is indicating incomplete segregation due to limited diffusivity during the cooling process. Furthermore, the presence of B and C atoms at the GB may impact the segregation behavior of Zn to the GB and ultimately affect the Zn GB concentration.
Co-segregation behavior of Zn and B
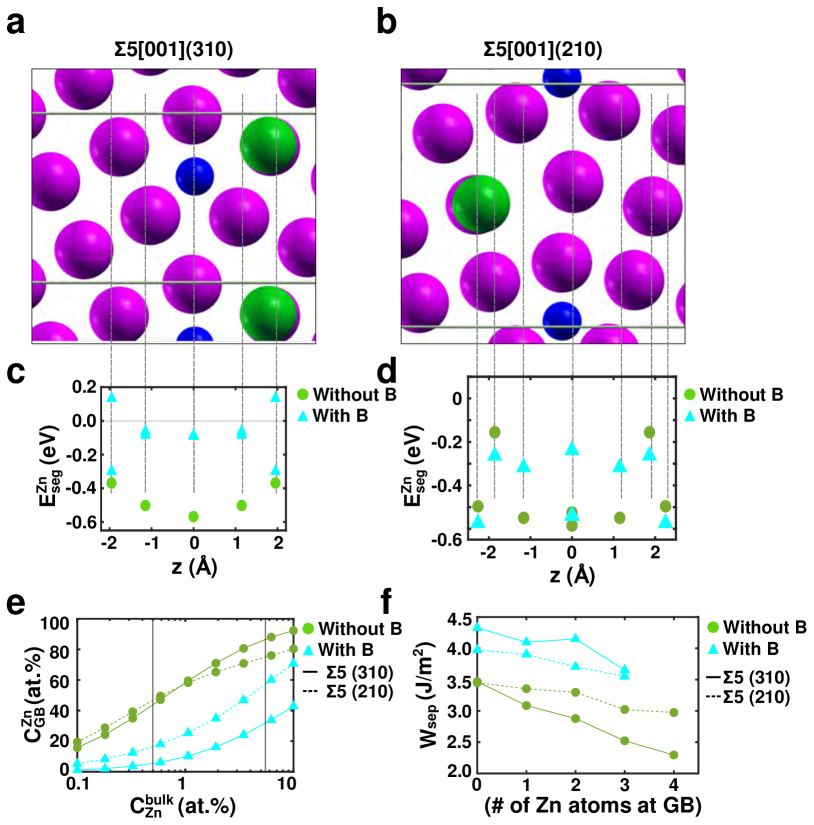
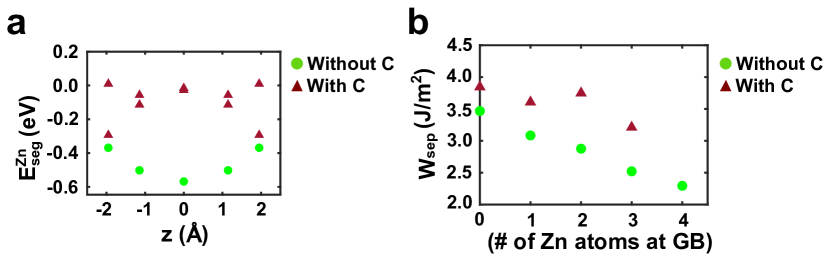
In order to explore the interaction of B and Zn and its impact on the segregation behavior and GB cohesion, we performed first principles DFT calculations of the as well as GBs. Details on the computational approach can be found in the Methods section. The GB structures with all possible segregation sites considered for Zn (green) and B (blue) atoms are displayed in Fig. 6 a and b. The same calculations performed for C (brown) are shown in the Extended Data Figure 7. The segregation energies of Zn with and without interstitial B for the and GBs are shown in Fig. 6 c and d. Zinc alone has a similarly high segregation energy for its lowest energy position at the GB center () in a substitutional site within the GB plane for both GBs of and , respectively. However, if B is present, the overall segregation energies of Zn are strongly reduced (see the cyan triangles). Note that multiple possible configurations were investigated. For example, the presence of B lowers the segregation energy of Zn at the GB center position by a factor of 6 to for the GB. Only for Zn farthest away from the GB considered here at , a slightly higher of is obtained for a single configuration. A similar trend is observed for the GB, where the segregation energies are reduced by a factor of 2-3 in the presence of B. A possible configuration with Zn at the GB center with nearly the same segregation energy as without B is found. This suggests that the GB shows a slightly higher probability for Zn to segregate with B being present than the GB.
Based on the calculated segregation energies, we estimate the enrichment of Zn at the GB at C using the White-Coghlan isotherm 33 considering segregation to all sites at the GB. This allows us to explore the influence of the bulk Zn concentration and the impact of B on the expected amount of Zn at the GB in the theoretical high temperature limit, which corresponds to the annealing temperature of the bicrystal diffusion couple. Since both the and GBs show a similar minimum segregation energy of Zn alone, the Zn concentration is predicted to be nearly the same at both GBs. It increases monotonically with increasing Zn bulk content as shown in Fig. 6e (green dots). When B is also present at the GBs, a strong reduction of the maximum Zn content can be observed for both interfaces. For the GB (solid lines) a reduction in the Zn concentration from to is observed for a bulk Zn concentration of , which corresponds to the Zn-rich Region in the experiments. A similar trend is observed for lower Zn bulk contents. The reduction in GB Zn concentration is less pronounced for the boundary as illustrated in Fig. 6 e (dashed lines). These predictions indicate that B does not only strongly reduce the segregation energies, but with this also significantly lowers the maximum attainable Zn content at the GBs within the thermodynamic limit at the annealing temperature.
Grain boundary cohesion
To assess the effects of co-segregation of Zn and B on GB cohesion, we calculated the theoretical work of separation for the and GBs as shown in Fig. 6 f. GB cohesive properties were computed for each Zn concentration in the most preferential segregation state. Both GBs show very similar cohesive properties in the pure state without any solutes present resulting in a work of separation of . With the addition of a single B atom, corresponding to half a monolayer (ML) or at.% and at.% for the and GB, respectively, the cohesive energy increases to and . We then investigated the effects of Zn additions to the GBs and found that the decreases almost linearly for both GBs, albeit with a steeper slope for the GB. For the case when no B is present at the GBs, four Zn atoms ( MLs) lower the work of separation to for the GB. The reduction of is less pronounced for the GB with ML Zn to . If both B and Zn are considered, it is found that the cohesion reducing effects of Zn are compensated by the presence of B. Even when 3 Zn atoms ( ML) are added to both GBs, the work of separation is still higher than that of the pure interfaces. This shows that the effect of impurity atoms on GB cohesion is to a large extent purely additive.
From these observations clear implications can be established for GB-based alloy design to prevent LMIE. The addition of B and other impurity elements can reduce the tendency for Zn segregation, while the presence of cohesion enhancing elements such as B counteracts the embrittling tendency of Zn.
Discussion
In this study, the nanoscale segregation behaviour of Zn in the presence of B and C at a bcc-Fe tilt GB was investigated. It is found that Zn is forming a periodic, line-type segregation pattern with nanometer periodicity in regions with 5 Zn bulk concentration. Despite the low Zn bulk concentration, strong modulation of Zn-rich (35 ) and Zn-lean (15 ) regions along the GB were observed which originate from a phase separation of the GB during cooling from the segregation transition at 403∘C according to our thermodynamically informed phase-field simulations. However, we can also not exclude the role of GB defects in the formation of this Zn segregation pattern. These Zn modulations alone would lead to local fluctuations in the work of separation along the GB, given the results obtained by DFT. Such local compositional variations at GBs have not been taken into account to explain the origins of LMIE or GB fracture 3, 4, 34, 6, 7, 8, 35. From APT it is observed that the impurity elements B and C are homogeneously distributed within the GB plane in the same regions. However, their peak concentration is reduced compared to the as-grown bicrystal 24. The asymmetric segregation profiles of B and C indicate that the GB has migrated during the annealing treatment either induced by Zn segregation 2, 36 or through the triple line, where the GB is connected to the liquid Zn reservoir 37.
Following our first-principles calculations, the strong repulsive interactions between B and Zn lead to a significant reduction in the segregation tendency of Zn in the presence of B. This ultimately leads to a reduction in the maximum Zn concentration at the GB, which by itself has a positive effect on GB cohesion 38, 39. Furthermore, the trends in calculated cohesive properties of the GB clearly indicate that even lower levels of B comparable to those observed experimentally are capable to compensate for the embrittling effects of Zn. Since both B and C are known to enhance GB cohesion 24, 25, 26, 27, 28, our calculated values for the work of separation only considering B are a lower bound and it is shown in the Extended Data that C has a similarly positive effect on GB cohesion.
While LMIE is a complex, hierarchical process leading to material failure by the ingress of liquid metal along GBs, it has been indicated that GB composition and local co-segregation effects ahead of the crack tip are decisive in the underlying mechanisms 7, 14. Our investigations show that the evolving GB composition and intrinsic elemental interactions are crucial in understanding their effects on GB cohesion.
Our work emphasizes the role of cohesion enhancing impurity elements and how they can be used to prevent GB failure induced during liquid metal embrittlement. We demonstrate that impurity segregation can mitigate the embrittling effects of Zn by hindering its segregation to GBs and leveling its reduction in GB cohesion. This points toward a promising route for materials design in which the controlled addition of B and C can act as efficient agent for reducing Zn mediated LMIE in steels.
Methods
Experimental
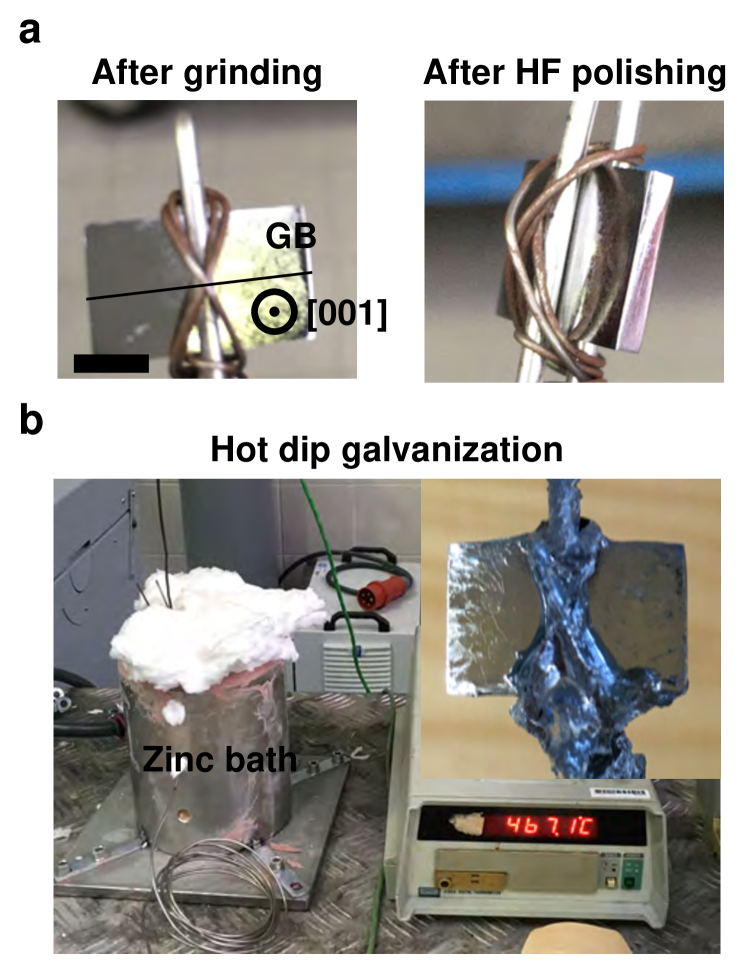
For the experiments, a Fe-Al bicrystal with a global was grown with the in-house Bridgman technique. The bicrystal was cut into a rectangle with the GB in the center. The steps how the bicrystal was coated with Zn are shown the Supplementary Figure 1. First, the sample was mechanically grinded and then chemically polished using a solution of HF, H2O and H2O2. In order to prevent the contamination of the sample after polishing, the sample was held with steel rods. Afterwards, the sample was immersed into a Zn bath for . The temperature of the Zn bath was kept at . The Zn was then grinded off the large surfaces as well as the large sides of the sample. Finally the sample was encapsulated in a quartz tubes under vacuum () and annealed at for hours. The Zn diffused bicrystal was mechanically polished until reaching a mirror-like surface. Microstructural characterization of the GB was done by EBSD (see Supplementary Figure 2a) as well as EDS, which were simultaneously carried out by means of a ThermoFisher Scios 2 dual beam FIB/SEM equipped with an EDAX Velocity EBSD camera and an EDAX Octane Elite Super EDS detector. From the characterized area, TEM plane-view specimen were prepared from two different regions using the Scios 2 FIB. STEM imaging as well as STEM-EDS were performed on a Cs probe-corrected FEI Titan Themis operated at as well as equipped with the SuperX EDS detector system. The investigations were done with a semiconvergence angle of , a camera length of and a probe current of . The high resolution images were processed with a Butterworth filter and a Gaussian filter. The APT experiments were done in a CAMECA LEAP 5000 XS operated in laser-mode.
Computational Details
Atomistic Simulations
The computational details are described in more detail in Ref. 24, 39 but encompass first principles density functional theory using the Vienna Ab-initio Simulation Package (VASP) with projector augmented wave-functions 40, 41, 42, 43. For the exchange-correlation part, the PBE functional 44, 45 was employed. Other parameters include the k-point mesh set as close as possible to 40 k-points/Å for all involved simulation cells, and the energy cutoff with 400 eV. The GBs for simulations are constructed from two symmetrically misoriented slabs that meet at the GB on one side and on the other side are separated by a vacuum layer of at least 8 Å. Segregation energies are computed using 46
| (1) |
with being the total energy of a GB without solute while denotes the total energy of the same cell but with the solute at GB site . For the reference of the solute in the bulk, the difference is computed between a bulk cell of 128 atoms without solute and with solute , and , respectively. For considering the change of interstitial B in the bulk to a substitutional site at the GB, and corresponds to the total energy of a single Fe atom in its bulk structure . Segregation energies are connected to the solute enrichment at GBs via the White-Coghlan segregation isotherm 33 extended to multiple solutes 47.
The work of separation was computed by separating the GB at all possible GB planes by at least 8 Å and computing the difference of the total energies for separated and joined GB slabs in the simulation cell 39, 9. The lowest obtained work of separation for each segregated state is considered as the most probable fracture plane.
Phase-field Simulations
The composition- and temperature-dependent GB phase behavior as well as GB segregation evolution are explored using the thermodynamically-informed phase-field modelling. The derivation and computational details of the model can be found in 48. The CALPHAD integrated density-based free energy functional of the Fe-Zn system reads
| (2) |
with and the atomic density ( for the bulk and at the GB plane). Here the superscript indicates bulk properties extracted from TCFE11 Thermo-Calc database: is the free energy, the potential energy and and are the mixing enthalpy and entropy, respectively. The gradient energy coefficients and accounts for the structural and chemical heterogeneity with the GB region.
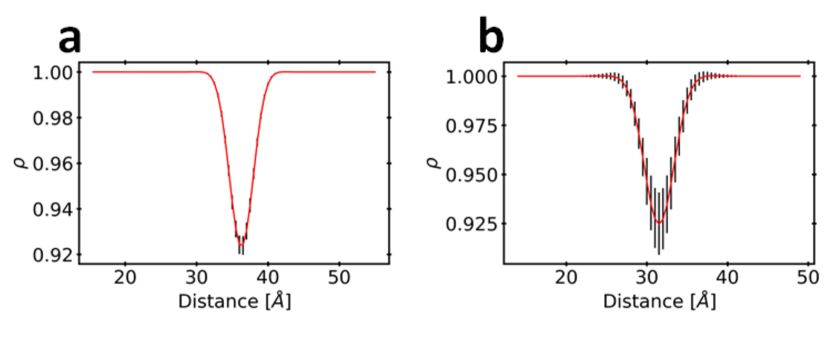
The GB phase diagram is calculated for which corresponds to the current GBs. Figure 9 shows the density profiles across the GBs computed from previous atomistic simulations 49. The chemical spinodal and miscibility gaps are computed using a robust implementation of the Maxwell construction and verified versus Thermo-Calc calculations. The density-based phase-field simulations were performed using an Openmp parallel C++ code with adaptive time-stepping. The simulation domain has been 17x17x3.4 nm3 with dx = 0.17 nm. Further details of simulation methods can be found in 50.
Data Availability
The data that support the findings of this study are available from the corresponding author upon reasonable request.
Code Availability
The code that support the findings of this study are available from the corresponding author upon reasonable request.
Extended Data
Diffusion couple
The steps to introduce Zn into the GB is shown in Fig. 1. First, the bicrystal was mechanically grinded with SiC paper upon a grit size of . Next, the bicrystal was chemically polished with a acidic solution of HF, H2O and H2O2. In order to avoid contamination, the sample was clamped by a steel rod. Immediately after the polishing step, the bicrystal was immersed into a Zn bath, whose temperature was measured to . The bicrystal was kept for into the bath. Afterwards, the Zn layers onto the (001) surfaces and the large edges were mechanically removed, so that only Zn at the short edges remained. Under this condition, the Zn coated bicrystal was encapsulated in a quartz capsule under vacuum with and annealed at for hours. A backscattered electron (BSE) micrograph from the region below the Fe-Zn interface shown in Fig. 2a reveals the formation of a two-phase layer containing Fe and the solid-solution phase of Zn. The orientation of the two-phase layer was determined by electron backscatter diffraction (EBSD) having an orientation close to . The boundary type was identified as a symmetric high angle GB. STEM investigations of the two phase region are shown in Fig. 2b and c. Figure 2b shows the ABF-STEM image and the corresponding STEM-EDS elemental maps for Fe and Zn around the GB. As it can be seen, the GB is dewetted with Zn. A concentration profile across the dewetted boundary results in a Zn concentration of (see Figure 2c).
Influence of temperature on GB structure
STEM investigations of the GB showed mesoscale inclinations with symmetric and asymmetric segments. In order to understand whether the high temperature annealing was causing it, a Zn-free bicrystal was annealed at for hours under similar high vacuum conditions (). As shown in Fig. 3a and b, the GB is flat and straight with no inclinations or kinks. The ABF-STEM shows dislocations nucleated within the grains, which can be caused during FIB milling. High-resolution HAADF-STEM images at different regions of the GB are shown in Fig. 3c. The GB is a symmetric and its structure shows kite-type structural units similar as investigated in previous studies 24. This confirms that the annealing does not affect the orientation of the boundary planes. Therefore, the observed inclinations needs to be related to the diffusion of Zn and the formation of the two-phase layer.
References
- 1 Lejček, P. & Šob, M. An analysis of segregation-induced changes in grain boundary cohesion in bcc iron. J. Mater. Sci. 49, 2477–2482 (2014).
- 2 Hillert, M. & Purdy, G. R. Chemically induced grain boundary migration. Acta Metal. 26, 333–340 (1978).
- 3 Beal, C., Kleber, X., Fabregue, D. & Bouzekri, M. Liquid zinc embrittlement of twinning-induced plasticity steel. Scr. Mater. 66, 1030–1033 (2012).
- 4 Cho, L., Kang, H., Lee, C. & De Cooman, B. C. Microstructure of liquid metal embrittlement cracks on Zn-coated 22MnB5 press-hardened steel. Scr. Mater. 90–91, 25–28 (2014).
- 5 Ashiri, R. et al. Supercritical area and critical nugget diameter for liquid metal embrittlement of Zn-coated twining induced plasticity steels. Scr. Mater. 109, 6–10 (2015).
- 6 Razmpoosh, M. H. et al. Liquid metal embrittlement in laser beam welding of Zn-coated 22MnB5 steel. Mater. Des. 155, 375–383 (20185).
- 7 Razmpoosh, M. H., Macwan, A., Goodwin, F., Biro, E. & Zhou, Y. Role of Random and Coincidence Site Lattice Grain Boundaries in Liquid Metal Embrittlement of Iron (FCC)-Zn Couple. Metall Mater Trans A 51, 3938–3944.
- 8 Ikeda, Y. et al. Early stages of liquid-metal embrittlement in an advanced high-strength steel. Materials Today Advances 13, 100196 (2022).
- 9 Scheiber, D., Prabitz, K., Romaner, L. & Ecker, W. The influence of alloying on Zn liquid metal embrittlement in steels. Acta Mater. 195, 750–760 (2020).
- 10 Fernandes, P. J. L. & Jones, D. R. H. Mechanisms of liquid metal induced embrittlement. Int. Mater. Rev. 42, 251–261 (1997).
- 11 Stoloff, N. S. & Johnston, T. L. Crack propagation in a liquid metal environment. Acta Metal. 11, 251–256 (1963).
- 12 Westwood, A. R. C. & Kamdar, M. H. Concerning liquid metal embrittlement, particularly of zinc monocrystals by mercury. Philos. Mag. A 8, 787–804 (1963).
- 13 Gordon, P. & An, H. H. The mechanisms of crack initiation and crack propagation in metal-induced embrittlement of metals. Metal. Mater. Trans. A 13, 457–472 (1982).
- 14 DiGiovanni, C., Ghatei Kalashami, A., Biro, E. & Zhou, N. Y. Liquid metal embrittlement transport mechanism in the Fe/Zn system: Stress-assisted diffusion. Materialia 18, 101153 (2021-08-01).
- 15 Schweinfest, R., Paxton, A. T. & Finnis, M. W. Bismuth embrittlement of copper is an atomic size effect. Nature 432, 1008–1011 (2004).
- 16 Senel, E., Walmsley, J. C., Diplas, S. & Nisancioglu, K. Liquid metal embrittlement of aluminium by segregation of trace element gallium. Corrosion Science 85, 167–173 (2014).
- 17 Yuasa, M. & Mabuchi, M. Bond mobility mechanism in grain boundary embrittlement: First-principles tensile tests of Fe with a P-segregated 3 grain boundary. Phys. Rev. B 82, 094108 (2010).
- 18 Wu, R., Freeman, A. J. & Olson, G. B. First Principles Determination of the Effects of Phosphorus and Boron on Iron Grain Boundary Cohesion. Science 265, 376–380 (1994).
- 19 Wu, R., Freeman, A. J. & Olson, G. B. Nature of phosphorus embrittlement of the Fe 3[11¯0](111) grain boundary. Phys. Rev. B 50, 75–81 (1994).
- 20 Peng, W., Peng, H., Wu, G. & Zhang, J. Effect of zinc-doping on tensile strength of 5 bcc Fe symmetric tilt grain boundary. Computational Materials Science 171, 109204 (2020).
- 21 Geng, W. T., Freeman, A. J. & Olson, G. B. Influence of Alloying Additions on Grain Boundary Cohesion of Transition Metals: First-Principles Determination and Its Phenomenological Extension. Phys. Rev. B 63, 165415 (2001).
- 22 Razmpoosh, M., DiGiovanni, C., Zhou, Y. & Biro, E. Pathway to understand liquid metal embrittlement (lme) in fe-zn couple: From fundamentals toward application. Progress in Materials Science 121, 100798 (2021).
- 23 Bhattacharya, D. et al. Influence of the starting microstructure of an advanced high strength steel on the characteristics of Zn-Assisted liquid metal embrittlement. Mater. Sci. and Eng. A 804, 140391 (2021).
- 24 Ahmadian, A. et al. Aluminum depletion induced by co-segregation of carbon and boron in a bcc-iron grain boundary. Nat Commun 12, 6008 (2021).
- 25 Wu, R., Freeman, A. J. & Olson, G. B. Effects of Carbon on Fe-Grain-Boundary Cohesion: First-Principles Determination. Phys. Rev. B 53, 7504–7509.
- 26 Fraczkiewicz, A. Influence of Boron on the Mechanical Properties of B2-Ordered FeAl Alloys. Mater. Trans. JIM 41, 166–169 (2000).
- 27 Wang, J., Janisch, R., Madsen, G. K. H. & Drautz, R. First-Principles Study of Carbon Segregation in Bcc Iron Symmetrical Tilt Grain Boundaries. Acta Mater. 115, 259–268 (2016).
- 28 Miyazawa, N., Hakamada, M. & Mabuchi, M. Atomic bond-breaking behaviour during grain boundary fracture in a C-segregated Fe grain boundary. Phil. Mag. Let. 97, 311–319.
- 29 Kholtobina, A. S., Ecker, W., Pippan, R. & Razumovskiy, V. I. Effect of alloying elements on hydrogen enhanced decohesion in bcc iron. Computational Materials Science 188, 110215 (2021).
- 30 Fors, D. H. R. & Wahnström, G. Nature of Boron Solution and Diffusion in -Iron. Phys. Rev. B 77, 132102 (2008).
- 31 Felfer, P. J. et al. A New Approach to the Determination of Concentration Profiles in Atom Probe Tomography. Microscopy and Microanalysis 18, 359–364 (2012).
- 32 Su, X., Tang, N.-Y. & Toguri, J. M. Thermodynamic evaluation of the fe–zn system. Journal of Alloys and Compounds 325, 129–136 (2001).
- 33 White, C. L. & Coghlan, W. A. The Spectrum of Binding Energies Approach to Grain Boundary Segregation. Met. Mat Trans A 8, 1403–1412.
- 34 Ashiri, R. et al. Liquid metal embrittlement-free welds of Zn-coated twinning induced plasticity steels. Scripta Materialia 114, 41–47 (2016).
- 35 Scheiber, D., Prabitz, K., Romaner, L. & Ecker, W. The Influence of Alloying on Zn Liquid Metal Embrittlement in Steels. Acta Materialia (2020).
- 36 Rabkin, E. et al. High-Temperature Diffusion-Induced Grain Boundary Migration in an Fe-5 at.% Al Bicrystal during Zinc Diffusion. Mater. Sci. Forum 126–128, 321–324.
- 37 Dohie, J. S., Cahoon, J. & Caley, W. The grain-boundary diffusion of zn in -fe. JPED 28, 322–327 (2007).
- 38 Tahir, A., Janisch, R. & Hartmaier, A. Hydrogen embrittlement of a carbon segregated 5 (310)[001] symmetrical tilt grain boundary in -fe. Mater. Sci. Eng. A 612, 462–467 (2014).
- 39 Scheiber, D., Romaner, L., Pippan, R. & Puschnig, P. Impact of Solute-Solute Interactions on Grain Boundary Segregation and Cohesion in Molybdenum. Phys. Rev. Mater. 2, 093609.
- 40 Kresse, G. & Hafner, J. Ab Initio Molecular Dynamics for Liquid Metals. Phys. Rev. B 47, 558 (1993).
- 41 Kresse, G. & Furthmüller, J. Efficiency of Ab-Initio Total Energy Calculations for Metals and Semiconductors Using a Plane-Wave Basis Set. Comput. Mater. Sci. 6, 15–50 (1996).
- 42 Kresse, G. & Furthmüller, J. Efficient Iterative Schemes for Ab Initio Total-Energy Calculations Using a Plane-Wave Basis Set. Phys. Rev. B 54, 11169–11186 (1996).
- 43 Kresse, G. & Joubert, D. From Ultrasoft Pseudopotentials to the Projector Augmented-Wave Method. Phys. Rev. B 59, 1758–1775 (1999).
- 44 Perdew, J. P., Burke, K. & Ernzerhof, M. Generalized Gradient Approximation Made Simple. Phys. Rev. Lett. 77, 3865.
- 45 Perdew, J., Burke, K. & Ernzerhof, M. Perdew, Burke, and Ernzerhof Reply. Phys. Rev. Lett. 80, 891.
- 46 Ebner, A. S. et al. Grain boundary segregation in Ni-base alloys: A combined atom probe tomography and first principles study. Acta Mater. 221, 117354 (2021).
- 47 Scheiber, D., Jechtl, T., Svoboda, J., Fischer, F. & Romaner, L. On Solute Depletion Zones along Grain Boundaries during Segregation. Acta Mater. 182, 100–107.
- 48 Kamachali, R. D. A model for grain boundary thermodynamics. RSC Adv. 10, 26728–26741 (2020).
- 49 Ratanaphan, S. et al. Grain boundary energies in body-centered cubic metals. Acta Mat 88, 346–354 (2015).
- 50 Darvishi Kamachali, R. et al. Segregation-assisted spinodal and transient spinodal phase separation at grain boundaries. npj Comput. Mater. 6, 191 (2020).
Acknowledgments
The authors gratefully acknowledge the financial support under the scope of the COMET program within the K2 Center “Integrated Computational Material, Process and Product Engineering (IC-MPPE)” (Project No 886385). This program is supported by the Austrian Federal Ministries for Climate Action, Environment, Energy, Mobility, Innovation and Technology (BMK) and for Digital and Economic Affairs (BMDW), represented by the Austrian Research Promotion Agency (FFG), and the federal states of Styria, Upper Austria and Tyrol. X. Z. is supported by the Alexander-Humboldt-Stiftung. R. D.K. gratefully acknowledges support from German Research Foundation (DFG) through projects DA 1655/2-1 and DA 1655/3-1. G. D. gratefully acknowledges support by the ERC Advanced Grant GB-Correlate (Grant Agreement 787446).
Author contribution
G. D., W. E. and L. R. secured funding. C.H. L. and A. A. designed the experiments and C.H. L. supervised the project. A. A. conducted the electron microscopy experiments including STEM and FIB/SEM.
X. Z. conducted the APT experiments. D. S. performed the atomistic simulations. R. D. K. executed the thermodynamic and phase-field simulations. C.H. L., L. R. and B. G. contributed to the data analysis. A. A., D. S. and C.H. L. wrote the paper. X. Z., B. G., R. K. D., W. E., L. R. and G. D. revised the paper.
Competing interests
The authors declare no competing interests.