A Comprehensive Survey on Enterprise Financial Risk Analysis from Big Data Perspective
Abstract
Enterprise financial risk analysis aims at predicting the future financial risk of enterprises. Due to its wide and significant application, enterprise financial risk analysis has always been the core research topic in the fields of Finance and Management. Based on advanced computer science and artificial intelligence technologies, enterprise risk analysis research is experiencing rapid developments and making significant progress. Therefore, it is both necessary and challenging to comprehensively review the relevant studies. Although there are already some valuable and impressive surveys on enterprise risk analysis from the perspective of Finance and Management, these surveys introduce approaches in a relatively isolated way and lack recent advances in enterprise financial risk analysis. In contrast, this paper attempts to provide a systematic literature survey of enterprise risk analysis approaches from Big Data perspective, which reviews more than 250 representative articles in the past almost 50 years (from 1968 to 2023). To the best of our knowledge, this is the first and only survey work on enterprise financial risk from Big Data perspective. Specifically, this survey connects and systematizes the existing enterprise financial risk studies, i.e. to summarize and interpret the problems, methods, and spotlights in a comprehensive way. In particular, we first introduce the issues of enterprise financial risks in terms of their types, granularity, intelligence, and evaluation metrics, and summarize the corresponding representative works. Then, we compare the analysis methods used to learn enterprise financial risk, and finally summarize the spotlights of the most representative works. Our goal is to clarify current cutting-edge research and its possible future directions to model enterprise risk, aiming to fully understand the mechanisms of enterprise risk generation and contagion.
Index Terms:
Fintech, Enterprise Financial Risk, Small and Medium-sized Enterprises, Big Data.1 Introduction
Enterprise financial risk analysis has long been a focus of scholarly research in the fields of Finance and Management [1]. Whether young start-ups, small and medium-sized enterprises (SMEs) or famous Fortune 500 enterprises, to some extent they all inevitably face one or multiple financial risks, such as credit risk, guarantee risk, supply chain risk, bankruptcy risk, etc [2]. In particular, enterprises face big risk challenges when an economic crisis or a gray rhino incident happened, such as the financial crisis in 2008 [1] and COVID-19 epidemic in 2020 [3]. In the modern economic system, as the global financial system becomes more deeply interconnected, enterprises face both the intra-risk and contagion risk [4, 5]. Therefore, predicting the financial risk of enterprises is of great importance for both government policymakers and financial institutions.
Studies on enterprise financial risk analysis, which originated in the fields of Finance and Management, have gradually attracted increasing numbers of researchers from Computer Science (CS). The earliest research mainly focused on the three most commonly used statistical econometric methods, e.g. multivariate discriminant analysis, linear probability model, and logistic regression, and studied their application in enterprise risk prediction [6].
With technological advancements in natural language processing (NLP) and artificial intelligence (AI), researchers have begun to evaluate enterprise financial risk from a Big Data perspective. Besides traditional enterprise financial index, more enterprise risk intelligence is taken into consideration, such as non-financial textual information and relational data [7]. Specifically, to deal with textual risk information, NLP techniques, including sentiment analysis and event extraction are used to dig enterprise risk signals from non-financial textual data. To model the risk momentum spillover on enterprise relational data, AI techniques, including deep learning and Graph Neural Networks (GNN), are utilized to evaluate the enterprise contagion risk. This series of studies has opened up new avenues for analyzing the generation and contagion mechanisms of enterprise financial risk from a Big Data perspective.
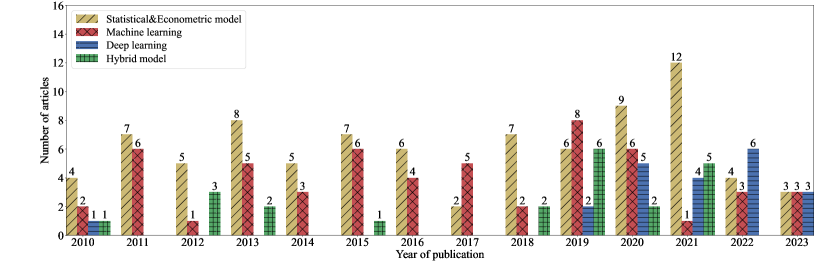
Figure 2 and Figure 2 show the number of relevant publications in the past thirteen years and their distribution in terms of different research directions. Due to the rapid expansion of the enterprise risk research based on the CS and AI technologies, it is both necessary and challenging to comprehensively review the relevant studies. In this work, we systematically review nearly 260 representative articles111In this work, we have collected nearly 2,000 publications about enterprise financial risk and have selected 256 of the best and most recent publications on enterprise risk.. We endeavor to summarize the problems, methodologies and spotlights of enterprise financial risk analysis in a comprehensive way, which may help readers to have a better understanding of the current research status and ideas. Figure 3 shows the framework of this survey.
The contributions of this work are threefold:
-
•
This survey provides a systematic and comprehensive review of existing research for enterprise financial risk. To the best of our knowledge, this is the first and only survey work on enterprise financial risk from the Big Data perspective.
-
•
We propose a novel holistic taxonomy of existing enterprise financial risk analysis. For each specific part, the contemporary landscape is summarized and insightful analysis is provided.
-
•
We discuss the limitations of current research and propose five potential research directions for enterprise financial risk analysis.
The remainder of this article is organized as follows. Section 2 formalizes the problems of enterprise risk analysis from four different directions, including the risk types, analysis granularity, risk intelligence and evaluation metrics. In Section 3, we will systematically introduce the approaches used more frequently. Section 4 summarizes the spotlights of the most representative studies. Section 5 provides guidance for future research directions. Finally, we conclude the survey in Section 6.
2 Problem Formalization
2.1 Financial Risk Types
In this section, we review the previous research on enterprise risk analysis in terms of risk types, i.e., credit risk, bankruptcy risk, guarantee risk, and financial risk, which are summarized in Table I.
| Enterprise Risk Types | Literature | Focus | Experiment | Method | ||||
| Industry | Country | Period | Size | Metric | Category | Methodology | ||
| Credit Risk | [8] | All industries | China | 1999-2004 | 120 | AC | ML | IBDR |
| [9] | Manufacturing | China | 2015-2017 | 1,091 | AUC,KS | SEM | MLR | |
| [10] | Manufacturing | China | 2011-2019 | 924 | AC,Type I, II error | DL | M-GL | |
| [11] | All industries | Italy | 2014 | 2.4M | GC,SCC | Hybrid Model | MLR, CT, NN | |
| [12] | All industries | China | 2012-2013 | 48 | AC, Type I, II error | ML | RSRAB | |
| [13] | Automotive | China | 2019 | 192 | AC | Hybrid Model | GA, SVM and NN | |
| Bankruptcy Risk | [14] | All industries | China | 2016-2018 | 3.5M | AUC | ML | TSMOFS |
| [15] | All industries | Belgian,UK | 2011-2014 | 2.4M | AUC | ML | SVM | |
| [16] | All industries | Japan | 2002-2016 | 2,062 | AC | DL | CNN | |
| [17] | All industries | Korea | 1995-1998 | 168 | AC, Type I, II error | ML | BPN, KN | |
| [18] | All industries | US | 1994-2014 | 11,827 | AUC | DL | Word Embedding, CNN, LR, RF, SVM | |
| [19] | Industry | US | 1981-1995 | 5,999 | P-value | SEM | Z-score, O-score | |
| Guarantee Risk | [20] | Banking | German | 1996-2006 | 452 | P-value | SEM | Z-score |
| [21] | All industries | China | 1997-2005 | 9,060 | CC | SEM | Regression | |
| [22] | All industries | China | 1999 | 875 | P-value | SEM | Descriptive statistics | |
| [23] | Banking | Japan | 1996-2002 | 100 | P-value | SEM | Regression | |
| [24] | All industries | Asia | 2013-2016 | 0.11M | AUC | DL | DGANN | |
| [25] | All industries | Asia | 2013-2016 | 0.11M | Macro-F1 score | DL | DNN | |
| Financial Risk | [26] | All industries | Slovak | 2015 | 62,533 | P-value | ML | MRA |
| [27] | All industries | Worldwide | 1992-2009 | 9,000 | CC | SEM | PDA | |
| [28] | All industries | Worldwide | 2008-2013 | 539 | P-value | ML | Panel regression | |
| [29] | High-tech industries | Worldwide | 2016-2020 | 600 | AC | ML | PSO-BP | |
| [30] | E-commerce | China | - | 3,617 | AC | DL | DL, DFT | |
| [31] | All industries | Worldwide | 1996-2013 | 17,057 | P-value | SEM | OLS and FFE regressions | |
-
•
ML: The machine learning methods. SEM: Statistical econometric measurement. DL: The deep learning methods. AC: Average accuracy. IBDR: Integrated binary discriminant rule. AUC: Area under curve. NN: neural networks. CNN: Convolutional neural networks. BPN: The BP network. KN: The Kohonen network. RF: Random forest. CC: Correlation coefficient. DGANN: The dynamic graph attention neural network. DNN: The deep neural network. MLR: Multiple Linear regression. PDA: Panel data regression. DFT: Data fusion technology. OPM: Option pricing model. LR: Logistic regression (this only refers to machine learning). MNL: Multinomial Logit. CT: Classification tree. RSRAB: Random Subspace-Real AdaBoost. GA: The genetic algorithm. M-GL: The multiview graph-based learning. TSMOFS: Two-stage multiobjective feature-selection. OLS: Ordinary least squares. FFE: Firm fixed effects.
2.1.1 Credit Risk
The enterprise credit risk refers to the possibility of loss due to the default of one party or the change of credit quality or morality in the transaction. The attributes of enterprise credit risk are characterized by comprehensiveness, bidirectionality, transitivity, diffusivity, cumulativeness, hiddenness, suddenness, and uncertainty. Credit risks mainly exist in various credit transactions among financial institutions and enterprises, enterprises and enterprises, governments and enterprises [32, 33].
Credit risk arises from a number of reasons, either as a result of defaulted payments by customers or as a result of internal mismanagement of the business. In addition, credit risk can also arise from external macro causes and from the financing firm’s own problems. Duffie et al. [34] find that the level and shape of the maturity structure of a firm’s default probability depends on the firm’s default distance. Belas et al. [35] explore the impact of the determinants of SME credit risk, paying particular attention to the role of social and economic factors. Tang et al. [36] focus on the impact of the interaction between market conditions and default risk on firms’ credit spreads.
2.1.2 Bankruptcy Risk
Corporate bankruptcy risk refers to the possibility that a company may not be able to repay its debts or maintain the necessary funds to sustain its operations, potentially leading to bankruptcy. This can have negative implications on the company’s operations, financial stability, and stakeholders. Factors that may contribute to corporate bankruptcy include financial structure [37], governance structure [38], directors’ characteristics [39], corporate social responsibility [40], macroeconomic environment [41], global shock events [42], etc. Companies facing bankruptcy risk may need to take steps such as reducing expenses, increasing revenue, and developing financial plans to mitigate their risk.
2.1.3 Guarantee Risk
Guarantee risk refers to the risk caused by the inability of the lender to recover the principal and interest of the loan through the collateral or guarantor when the borrower fails to repay the loan on time or defaults.
At the enterprise level, Cowan et al. [43] find that partial credit guarantees severely affect the default rate of insured loans, which suggests that guarantees affect firms’ incentives to repay loans. Jian et al. [21] analyze the determinants of Chinese firms’ participation in the guarantee ring from the perspectives of macroeconomics and microeconomics. At the financial institution level, GROPP et al. [20] empirically analyze the impact of public guarantees on banks’ risk-taking through natural experiments. Additionally, in the study on the feasibility of bond securitization, Wu et al.[44] propose an expression of rate of return of securities based on guarantee letters and introduce two key indicators to build a return model for bond securities.
2.1.4 Financial Risk
Financial risk refers to the possibility of losses that an enterprise may suffer due to unpredictable or uncontrollable factors that cause actual income and expected income to deviate in various financial activities. Financial risks can be divided into liquidity risk, financing risk, investment risk, etc., based on the source of risk. Moreover, the existence of financial risks may cause fluctuations in the value of enterprise assets, reduced income, or deterioration of financial conditions.
The financial risks of enterprises are affected by many factors, which can be analyzed from two aspects: internal and external factors. Internal factors include management decisions [45], internal control, financial management level, corporate culture and other factors [46, 47]. External factors include economic environment [48], market competition, laws and regulations, industry risks, financial market fluctuations, etc. Enterprises can prevent financial risks via establishing a financial risk warning system and analyzing internal and external environments [49, 50, 51].
2.2 Risk Analysis Granularity
In this section, we review the previous research on risk analysis in terms of different granularity, i.e., individual enterprise risk, enterprise chain risk, and system risk, which are summarized in Table II.
| Risk Analysis Aspect | Literature | Focus | Experiment | Methodology | ||||
| Industry | Country | Period | Size | Metric | Category | Methodology | ||
| Individual Enterprise | [34] | Industry | US | 1971-2001 | 28,000 | AUC | SEM | Maximum likelihood estimation |
| [52] | Industry | US | 1995-2003 | 4,000 | AIC, BIC | SEM | The Percentage Zeros, LOT | |
| [53] | Manufacturing | China | 1990-1999 | 88 | AC, Type I, II error | ML | GA-SVM | |
| [54] | Banking | Australian, German China | 2000-2010 | 2,818 | AC, Type I error | SEM | LDA, t-test, LR | |
| [55] | Manufacturing | India | 2011-2012 | 205 | CFA | SEM | Structural equation | |
| Enterprise Chain | [56] | Banking | Greek | 2004-2007 | 1,000 | AC, AUC | ML | ELECTRE |
| [57] | All industries | French | 1997-2015 | 10,000 | AC, F-measure | ML | Self-organizing neural network | |
| [58] | All industries | Poland | 2008-2016 | 10,000 | AC, AUC,Recall | ML | XGBoost, NN | |
| [59] | Financial | Australia | 1994 | 690 | AC, Recall, F-measure, AUC | ML | NN | |
| Systemic | [60] | Tourism | US | 2018-2020 | 95 | TRSI, SII | SEM | TALIS |
| [61] | Commerce | China | 2007-2016 | 86 | Z-score | SEM | Difference estimation method | |
| [62] | Financial markets | US | 1998-2010 | 116 | P-value | SEM | PCA | |
| [63] | Banking | US | 1976-2001 | 0.4M | P-value | SEM | Simple panel data models | |
| [64] | Financial | US, UK, Canadian | 1996-2005 | 2,171 | P-value | SEM | MRA | |
| [65] | All industries | European, US | 1999-2018 | 1,770 | CARs, CAARs, ARV | SEM | CAPM | |
2.2.1 Individual Enterprise Risk
Individual enterprises face many risks when operating and are also affected by various pressures during management activities. In the process of trade, multiple enterprises usually cooperate to achieve the best benefits. In this section, we will analyze individual enterprise risk based on industry type and find that current research mainly focuses on industry and manufacturing.
For industry, barrier selection frameworks exhibit better calibration and discrimination capabilities than other market-based models such as Merton (1974) or Black and Cox (1976) [66]. Other studies have focused on the comparative analysis of traditional statistical methods for distress classification and prediction, namely LDA and NN. In the manufacturing and construction industries, new methods are proposed to improve the predictability of corporate bankruptcy and insolvency risks, such as Self-Organized Maps (SOM) [67] and Z-score models [68]. In the retail industry, a multi-industry survey of the bankruptcy of some Korean companies can be used to construct an industry-specific insolvency prediction model [69]. As for the financial industry, previous research focus on the banks [70], and analyzing the risk propagation process between banks is crucial [71, 72].
2.2.2 Enterprise Chain Risk
Enterprise chain is a macro concept that essentially refers to a group of companies with some intrinsic connections, including structural and value dimensions. Enterprise chains can be further divided into supply chains, guarantee chains, transaction chains, and credit chains. This section introduces risk analysis for different enterprise chains.
In research on supply chains. Heckmann et al. [73] identify core characteristics used to define, quantify, and model supply chain risks through a literature review. However, Babich et al. [74] discover that competition among suppliers in a supply chain affects the equilibrium wholesale price. Blome et al. [75] present propositions on how firms manage supply risk during a financial crisis. In the context of guarantee chains, Cheng et al.[76] investigate the prediction of successive default events for network-guaranteed loans. Similarly, regarding transaction chains, using transaction data and payment network-based variables rather than the financial accounting data, Kou et al. [14] propose a model for predicting SME bankruptcy. Moreover, as for credit chains, Battiston et al.[77] propose a simple production network model by applying the supplier-customer relationships involving trade credit extensions.
2.2.3 Systemic Risk
Systemic risk refers to the risk inherent to the entire market or market segment, caused by factors beyond the control of a specific company or individual. We present an overview of systemic risk based on its sources.
As exemplified by recent studies [78, 79, 80, 81], systemic events, including epidemics, as well as terror attacks [82], possess the potential to exert a substantial influence on the global economy. As an illustration, during the COVID-19 pandemic, healthcare and technology sectors have experienced increased activity and revenue, while tourism-linked industries have suffered due to global movement restrictions[60]. Furthermore, the formulation and implementation of national policies hold a pivotal position in shaping the trajectory of a country’s economy[61, 83]. For instance, intrastate bank deregulation boosts the local market power of banks, but decreases innovation and risk for young private firms [84, 63]. Additionally, a disruption to the financial network has the capacity to spark a domino effect that may lead to widespread systemic failures. [85, 86, 87]. In order to fully understand this problem, Petrone et al.[88] and Tafakor et al.[89] are dedicated to developing financial network models that can expose contagion mechanisms and identify potential patterns of systemic threats among nodes.
2.3 Enterprise Risk Intelligence
Table III presents previous studies on risk analysis in terms of enterprise risk intelligence, i.e., financial index, non-financial textual information, relational data, and intelligence integration. And Figure 4 shows the publication treads of enterprise risk intelligence over the years.
| Enterprise Risk Intelligence | Literature | Experiment | Methodology | |||
| Period | Size | Metric | Category | Methodology | ||
| Financial Index | [90] | 1995-2001 | 592 | AC | ML | LR |
| [91] | 2004-2015 | 0.83 M | AC | DL | GNN | |
| [92] | 1998-2018 | 651 | AC, AUC, ROC | Hybrid Model | NIM, CNN-DL, SVM | |
| [93] | - | 1,000 | Recall, AC | DL | ANN | |
| [94] | 2007 | 250 | AUC | DL | Graph Pattern Mining | |
| Non-financial Textual Information | [95] | 2014-2018 | 83 | AUC, Recall, F1-score | DL | DeepRisk approach |
| [96] | 1980-2009 | 16,966 | P-value | SEM | Discrete hazard model | |
| [97] | - | 1.5 M | KS, AUC | DL | AMG-DP model | |
| [98] | 2015-2018 | 6,494 | MAE | DL | MR-QA | |
| Relational Data | [99] | 2019-2020 | 4,040 | AUC | DL | TH-GNN |
| [100] | 2011-2018 | 0.43 M | - | SEM | Three-factor model | |
| [101] | 2014 | 47 M | AC, Recall | DL | NN | |
| [4] | 2000-2021 | 0.11 M | AC, Recall, F1-score | DL | GNN | |
| [102] | - | 1 M | AUC | DL | ST-GNN | |
| Intelligence Integration | [103] | 1989-1997 | 300 | P-value | SEM | The logical model |
| [104] | 2001-2018 | 0.64 M | AC | ML | BPN | |
| [105] | 2011-2019 | 924 | AC | DL | M-GL | |
| [78] | 2020 | 1,584 | P-value | SEM | DCC-GARCH model | |
2.3.1 Financial Index
Financial indicators refer to relative indicators for enterprises to summarize and evaluate their financial status and operating results, including indicators of solvency, operating capacity, and profitability. In this section, we comprehensively review the impact of financial indicators on corporate risk.
Solvency refers to the company’s ability to pay current liabilities with current assets, mainly depending on whether the company’s capital structure and long-term profitability are sound. Among them, the asset-liability ratio [103, 106], quick ratio [92], working capital, etc., are all excellent corporate indicators that are employed to study the determinants of bankruptcy and analyze risk characteristics. Credit default swap (CDS) data and bond data are also commonly used to study their relationship with corporate risk [107, 108, 109]. The relevant indicators of enterprise operating ability include inventory turnover rate, accounts receivable turnover rate, current asset turnover rate, and total asset turnover rate, etc. The risks resulting from insufficient liquidity of funds are often worthy of attention [110]. Among them, Takahashi et al. [111] find that the capital flow of some bankrupt companies decreased significantly with the research on the typical financial characteristics of bankrupt companies in Japan. Profitability refers to the ability of an enterprise to earn profits, including gross sales rate, net sales rate, net asset rate, and return on equity. These indicators are often used to calculate the company’s profit margin and the stability of supply and demand, thereby helping banks predict enterprise credit and alleviate financial difficulties and liquidity shortages in the interbank market [112, 113].
2.3.2 Non-financial Information
Non-financial variables: Non-financial variables gauge the success of a business in domains such as operations, customers, and employees. Undoubtedly, non-financial variables related to customers include customer churn rate and personal rating, etc [114, 115]. Zhang et al.[115] explore the impact of interest rates and customer churn rates on bank profitability and customer retention. When it comes to employee-related non-financial variables, board structure has emerged as a commonly studied factor [116, 117]. Existing approaches [118, 119, 120] have explored the impact of data characteristics such as director turnover rate, board size, and CEO duality on corporate credit risk. Correspondingly, non-financial variables related to company operation typically include business cycle and macroeconomic variables [121, 57, 122]. Kang et al. [123] and Giesecke et al. [124] analyze the influence of price-related indices (energy price risk, resource risk, inflation risk) and national development-related indices (GDP) on corporate default risk.
Textual Information: Companies can leverage the power of news reports and sentiment analysis to assess risk by analyzing textual information found in news reports and qualitative risk disclosures in corporate filings. Tsai et al.[125] and Nyman et al.[126] utilize news sentiment analysis on a large volume of news reports to predict credit risk and volatility indicators for companies. Furthermore, legal documents can provide valuable information to assess risk too. Yin et al.[9] and Altman et al.[127] combine information related to legal actions taken by creditors to recover outstanding debts, company filing history, consolidated audit report/opinion data, firm-specific characteristics and legal judgments to build models to predict the enterprises default risk. In addition, conference calls [128, 129] and interview text [130, 131] also can be used to analyse corporate risk.
2.3.3 Relational Data
Relational data defines relationships between entities and is widely used in the study of the relationship between individual enterprises or enterprises, such as equity relationship, cooperation relationship, supply chain relationship, management relationship, etc [15]. It can be used to study the network of relationships between SMEs and the cooperative relationships of firms [101]. And a well-constructed corporate relationship network can be processed with the utilization of HGNN, which captures information at different levels. Furthermore, this approach effectively combines the financial and relationship data of a company, allowing for a more accurate assessment of corporate financial risk and the study of corporate relationship networks [99]. For example, Tobback et al. [15] use relationship data to construct a network of corporate relationships and make enterprise risk predictions. Relational data is also applied to the study of supply chain relationships. By collecting supply chain relationship data between enterprises (including direct suppliers, sub-tier suppliers and interactions between suppliers), a supply chain network containing multiple tiers of suppliers can be constructed. For instance, Wang et al. [100] use social network analysis methods to analyze the structural characteristics of the supply chain network, identify key enterprises and potential risk points. Relational data can also be used to mine supply linkages between SMEs and construct relevant topologies. Yang el al. [102] effectively analyze financial risk by constructing a supply chain graph.
2.3.4 Intelligence Integration
In the assessment of corporate risk, different kinds of information are captured. Generally, financial data is integrated with non-financial data to obtain comprehensive information. Non-financial information, like firm size, corporate governance indexes [132], and audit opinions [133], has already been demonstrated to be practical in risk prediction. Due to varied research goals, the specific types of non-financial information utilized in risk assessment may vary. Furthermore, there is a growing trend in risk management towards uniting relational data with financial data. Cleofas [134] combines accounting statements with business information, bank customer data, and credit applicant records to predict bankruptcy. Such data depicts the relationship between a company and linked enterprises [135], or the relationship between a company and banks [136]. Integration also happens among the three types of data mentioned above. For instance, Zhao et al. [137] utilize transaction data, web news as well as company relations and executives’ information to predict the stock movement.
2.4 Enterprise Risk Evaluation
2.4.1 Datasets
| Datasets | Tasks | Descriptions | Period | Size | ||||||
| SMEsD [4] | Bankruptcy Risk Prediction |
|
2014-2020 | 4,229 | ||||||
|
|
|
1996-2012 | 761 | ||||||
| Listed SMEs data[139] |
|
|
2014-2015 | 53 | ||||||
| Interview data[75] | Supply Chain Risk Management |
|
2009-2010 | - | ||||||
|
|
|
2010-2017 | 1,902 | ||||||
| Bank loan portfolio[141] |
|
|
1994-1997 | 1,411 | ||||||
| Bankruptcy financial data[142] |
|
|
1995-1999 | - |
We present the various datasets used for enterprise risk analysis in Table IV. These datasets cover different types and domains of information, providing scholars with rich materials to analyze and evaluate enterprises financial risks. The most widely used datasets in previous research mainly include SME datasets, financial datasets, stock datasets, rating datasets, credit guarantee datasets, etc. Previously, most traditional statistical econometric models substantially rely on financial data and text data to assess enterprise risk. However, with the advancement of machine learning and deep learning approaches, a wider range of datasets is now utilized. For instance, bank loan and credit guarantee data provide insights into financing and credit risks.
2.4.2 Evaluation Metrics
Evaluation metrics are crucial in the modeling process. Appropriate indices should be chosen for different tasks and models. In this section, four evaluation indicators are discussed in detail and Table V presents the main formulae for calculating these indicators.
Kolmogorov-Smirnov statistic (KS): The K-S test examines the distribution of continuous random variables and evaluates model’s discrimination performance. Using KS, Chang et al. [9] conduct 10 independent 10-fold cross-validations, predicting model recognition performance and obtaining 100 performance estimates.
AUC: The AUC curve, under the ROC curve and enclosed by axes, measures separability and learner quality. It is an important measure for financial risk prediction [143], where a larger AUC indicates a better classifier. AUC compares prediction effectiveness for hard, soft, and integrated features with various approaches. For default risk prediction, which is an unbalanced classification problem, AUC reflects the classifier’s learning effect more fully [144, 145].
F-measure: The F-Measure, which is a weighted harmonic average of precision and recall, is a good choice for evaluating unbalanced classification models [145]. Higher F-measures indicate better handling of unbalanced data [133]. Zhu et al. [146] assess IEML methods (i.e., multi-boosting and RS–boosting) on 377 datasets using F-measure as the evaluation metric.
Kappa measure: Using confusion matrices, the Kappa coefficient measures classification accuracy, considers chance agreement, and offers a better performance reflection than accuracy or precision and recall. It is a decent option for assessing unbalanced data classification, with higher coefficients indicating better prediction [133].
| Metric | Formula | Parameter and Explanation | Reference | ||||
| KS | : True positive rate; : True negative rate. | [9, 97] | |||||
| AUC |
|
[9, 143, 144] | |||||
| F-measure |
|
[145, 146, 133] | |||||
| Accuracy | TN: True Negative; FP: False Positive. | [146, 147, 148] | |||||
| Recall Rate | TP: True Positive; FN: False Negative. | [144, 149] | |||||
| Kappa measure | : The proportion of correct predictions made by the model; : The proportion of correct predictions made by the random classifier. | [133] |
3 Methodologies
Table VI presents the previous studies on risk analysis in terms of analysis models, i.e., statistical model, machine learning model, deep learning model and hybrid model. Figure 5 exhibits a chronological overview of influential enterprise risk analysis method. And Figure 9 shows the publication trends of analysis models over the years.
| Category | Literature | Focus | Experiment | Methodology | ||||
| Intelligence | Country | Industry | Period | Size | Metric | |||
| Statistical Econometric Methods | [20] | Financial statements | Germany | Banking | 1995-2006 | 1,329 | P-value | Z-Score |
| [172] | Stock market data financial statements | China | - | 2004-2006 | 80 | Expected default | KMV | |
| [173] | CDS Spreads | US | - | 2006-2012 | 100 | Risk probability | Copula | |
| [78] | Financial data | Worldwide | Banking | During the COVID-19 | 1,584 | P-value | CoVaR | |
| [103] | Balance sheet questionnaire | Italian | - | 1989-1997 | - | P-value | Logit model | |
| [174] | Financial data stock market data | China | - | From 2007 | - | P-value | Logit Regression | |
| Machine Learning Methods | [15] | Financial ratios Executive information | Belgian, UK | - | 2011-2014 | 400,000 | AUC | SVM |
| [175] | Financial statements | - | - | 1975-1982 | 129 | Accuracy | NN | |
| [62] | Stock market data | US | All industries | 1998-2010 | - | Absorption Ratio | PCA | |
| [176] | Financial statements | - | All industries | - | 66,000 | Accuracy | RF | |
| [177] | Financial ratios | Turkish | - | 2005-2011 | 2,722 | Accuracy, F-Measure | DT | |
| [178] | Financial ratios | Polish | - | - | 240 | Accuracy, AUC | PTVPSO-FKNN | |
| Deep Learning Methods | [16] | Financial statements | Japan | - | 2002-2016 | 2,164 | AUC | CNN |
| [91] | Loan data | China | - | - | - | AUC | GNN | |
| [150] | Financial ratios | Polish | - | 2002-2013 | - | AUC | BSM-SAES | |
| [179] | Financing behavior data static enterprise demographic data | China | - | 2014-2018 | 83 | F1, AUC | DNN | |
| [102] | Corporate relations, lending data | China | - | - | 280M | AUC, KS | ST-GNN | |
| Hybrid approach | [180] | Financial data, default distance | China | - | 2003-2008 | 2,470 | Significance | KMV, RF, RST |
| [181] | Financial data, stock data | China | IT | 1999-2006 | 321 | Accuracy | CART–CBR, RST–GRA–CBR, RST–CBR | |
| [171] | Interview information | - | - | - | 1 | Expected utility | BBN, EUT | |
3.1 Statistical Econometric Methods
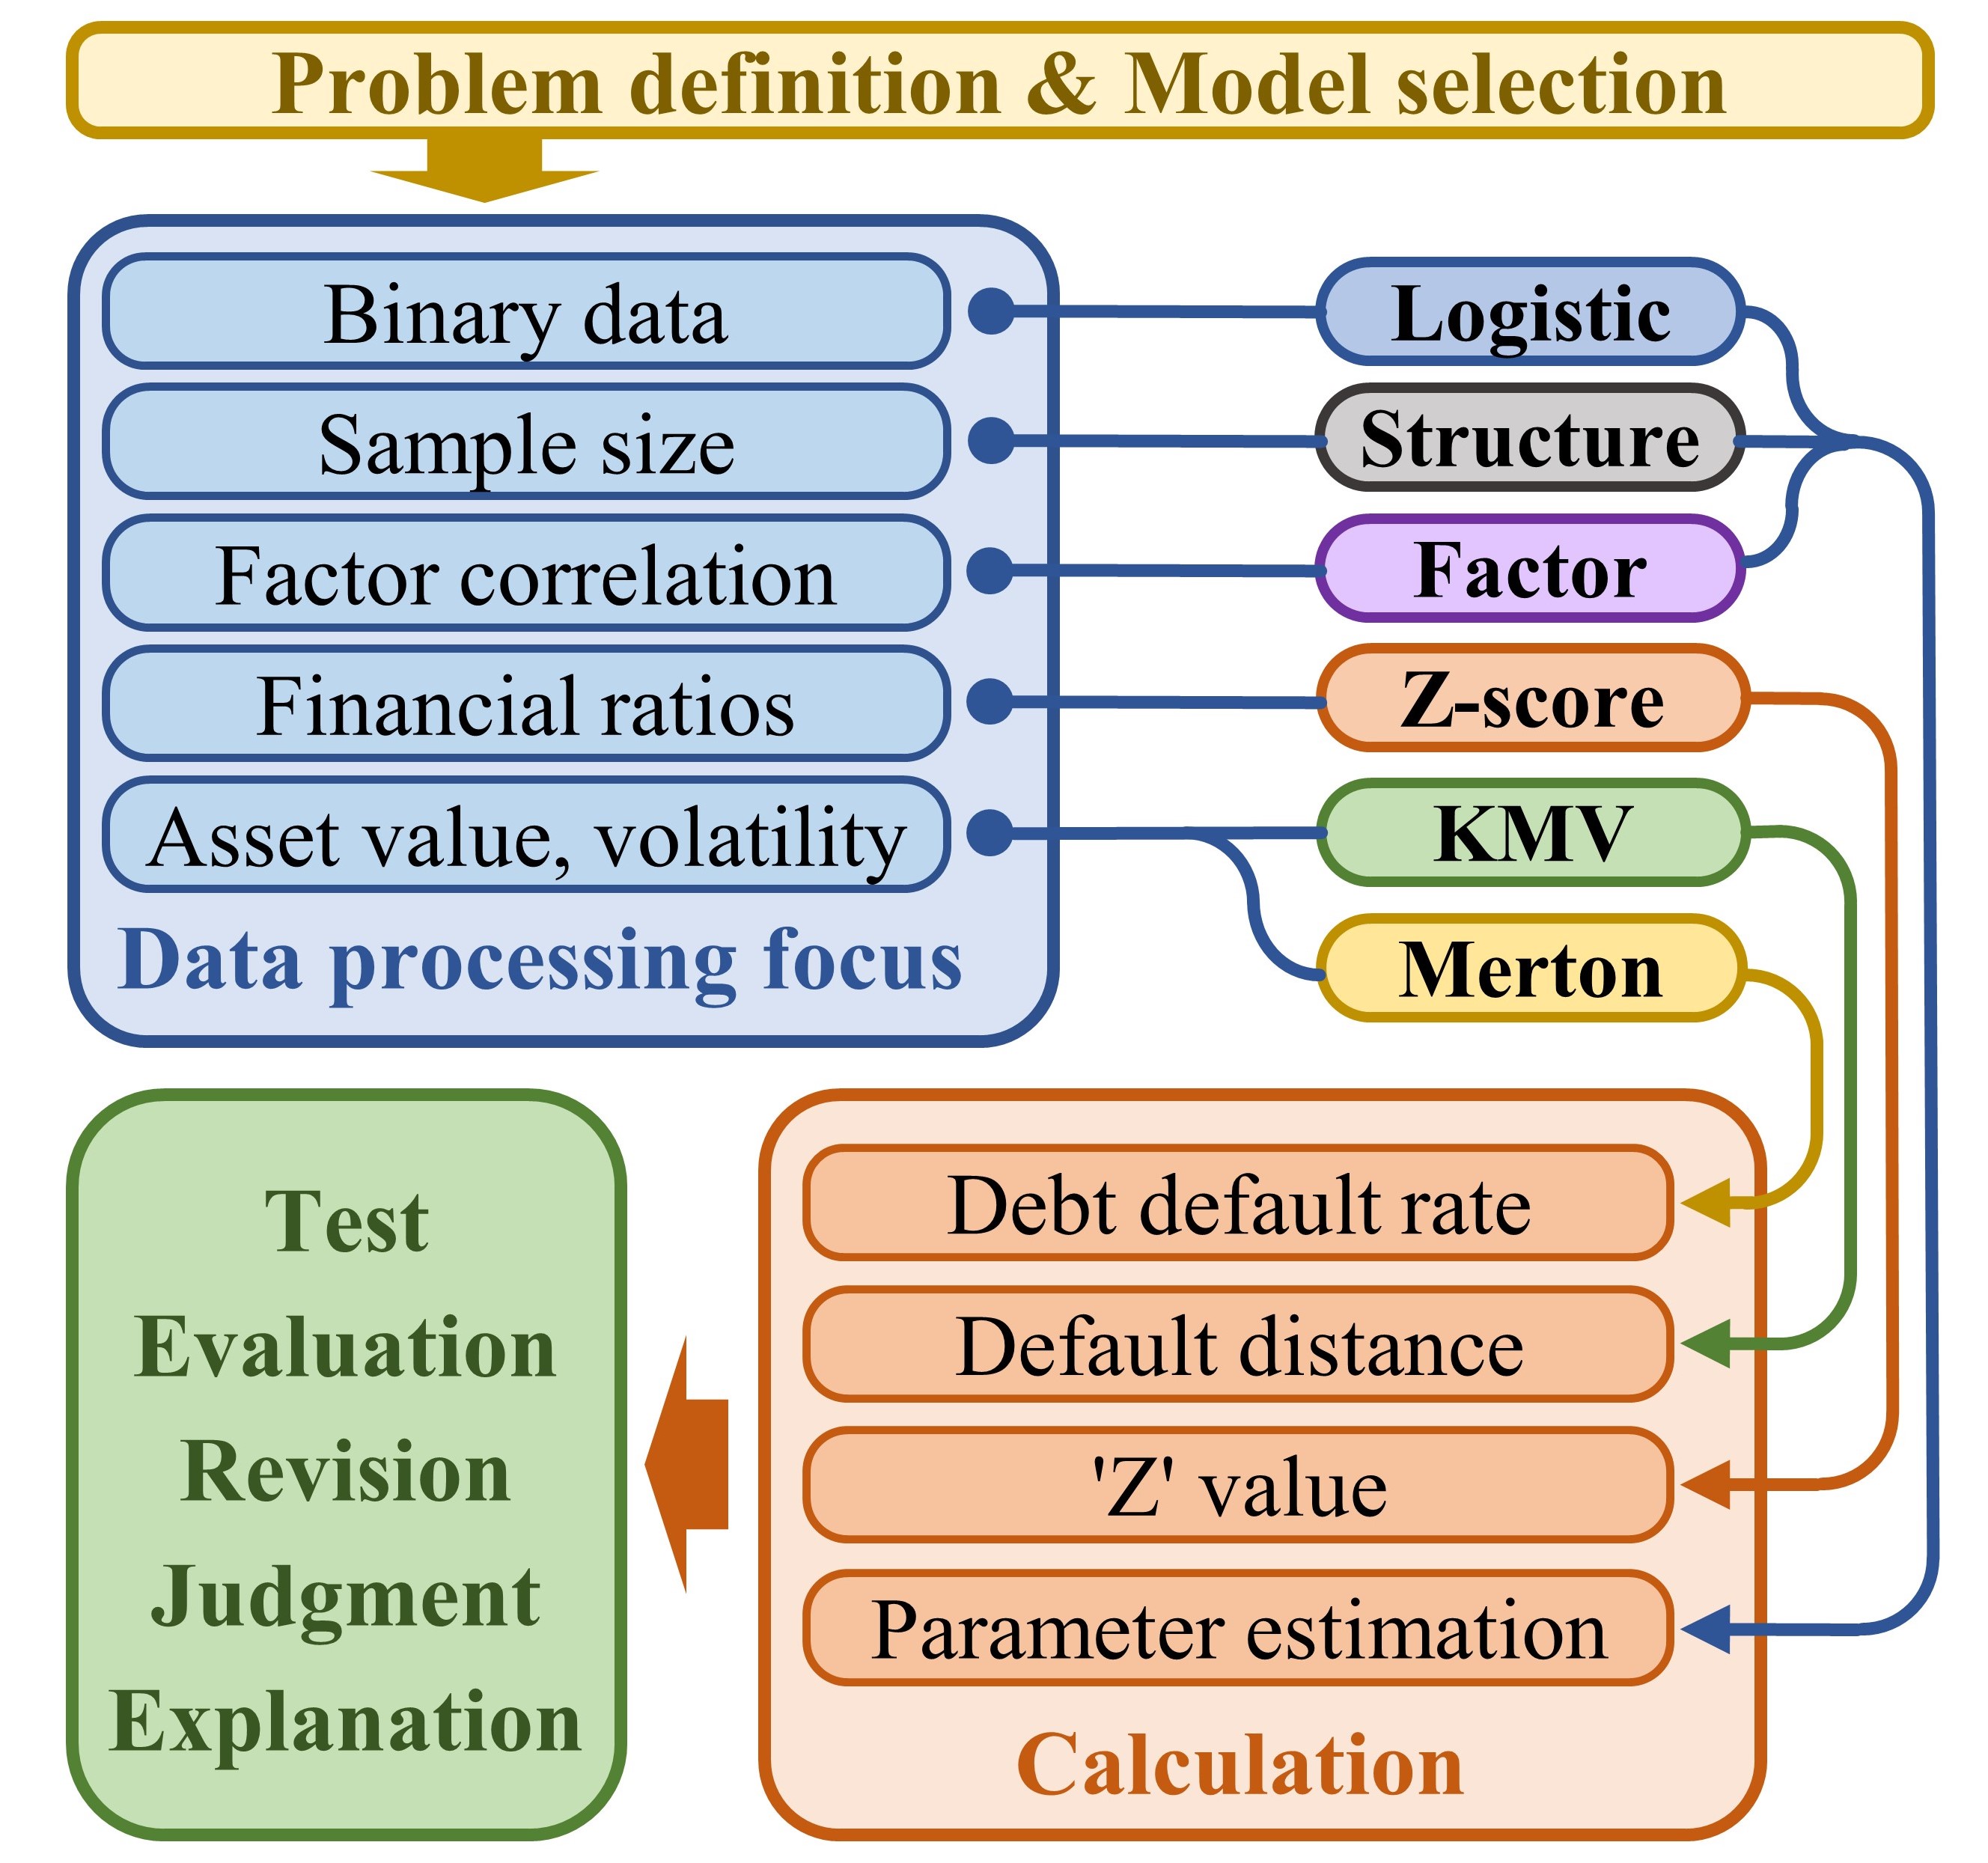
The study of enterprise risk originated from traditional economic disciplines. In this section, we will briefly introduce the following main statistical models: Regression Model, Z-score Model, Merton Model, KMV Model, Complex Network, Structural Equation Model, and Factor Model. Figure 6 illustrates the pipeline of several general traditional models. Table VII presents the core formulas of the main statistical models discussed in this section.
| Model | Main Formular | Parameter and Explanation |
| Logistic Regression | : Probability of ; : The intercept term of the regression function; : Row vectors of regression coefficients; : Column vectors of explanatory variables. | |
| Z-score Model | : Working capital/Total assets ratio; : Retained earnings/Total assets ratio; : Earnings before interest and tax/Total assets ratio; : Market value of equity/Total liabilities ratio; : Total sales/Total assets ratio. | |
| Merton Model | : Cumulative probability distribution function of the standard normal distribution; : European call Option price; : Stock price at time 0; : Executive price; : Continuously compounded risk-free rate; : Duration of options; : Stock price volatility. | |
| KMV Model | : Distance to Default; : The risk–free rate of the return of the asset of the company; : The current value of the asset of the company; : The face value of the debt; : The annualized company value volatility; : Long-term debt; : Short-term debt. | |
| Structural Equation Model | : Number of endogenous variables; : Number of exogenous variables; : vector of observed endogenous variables; : matrix of regression slopes; : vector of observed exogenous variables; : vector of regression intercepts; : matrix of regression slopes; : vector of disturbances; : covariance matrix of disturbances. | |
| Factor Model | : Asset or portfolio return ; : Risk-free rate; : Market revenue; : Factor exposure; : Simulated portfolio returns for size factor at time (small minus big); : Simulated portfolio return of book-to-market factor at time (high minus low). |
3.1.1 Regression Model
The regression model plays a crucial role in economic research, as it helps verify the relationship between explanatory variables and the response variable. Many classic risk-related studies utilize regression model[38, 9, 106, 182]. More specifically, Beasley et al.[155] adopt an ordinal logistic regression model to demonstrate that the implementation of enterprise risk management requires leadership. Eckles et al.[183] use probit regression to calculate the likelihood of enterprises adopting ERM. Habermann et al.[182] employ panel regression to investigate the relationship between CSR and bankruptcy.
3.1.2 Z-score Model
The Z-score model employs a set of financial ratios to evaluate a company’s financial distress. It takes the following factors into account, such as asset size, liquidity, profitability, financial structure, debt servicing capacity, and asset utilization for making predictions. Therefore, it is widely applied in bankruptcy forecasting [184, 19]. A company with a Z-score lower than 1.8 is considered to have a high risk of bankruptcy [2]. In particular, Xu et al.[185] utilize the model to predict the bankruptcy risk of Japanese listed companies, and Gropp et al.[186] use it to measure the bank’s risk under public guarantees.
3.1.3 Merton Model
The Merton model, proposed by Merton in 1974 [187], is a renowned credit risk measurement model that primarily assesses corporate default risk from the perspective of option pricing[188, 189]. Vassalou et al.[154] adopt the Merton model to gauge the default risk of individual companies and analyze the effect of default risk on stock returns. However, its application is not limited to assessing default risk alone. Xu et al.[185] also use the Merton model to detect signs of corporate bankruptcy from option price information, while Hilscher et al.[190] conduct a study on the relationship between the Merton model’s failure beta, CDS spreads, and credit ratings.
3.1.4 KMV Model
The KMV model, deriving from Merton’s option pricing theory, estimates default probabilities. It primarily utilizes stock market data to evaluate a company’s ability to repay loans and determine its actual default probability. Despite having strict assumptions, the model proves effective in certain aspects. For instance, Reisz et al.[66] apply the KMV model to estimate the bankruptcy probability of companies. Chen et al. [156] enhance the predictive validity of the KMV model for credit defaults of listed SMEs in China by adjusting its parameters. For studying the relationship between technological competition and enterprise bankruptcy, Eisdorfer et al.[191] use three bankruptcy risk measurement models, including the KMV model, as control variables.
3.1.5 Complex Network
A complex network comprises a large number of nodes and intricate relationships between them. Many researchers utilize this structure to analyze financial and systemic risk[192, 193, 85]. To be specific, Zhu et al.[192] apply the complex network method to study the contagion of international financial risks. Wu et al.[193] propose a SICM model based on complex networks to examine the contagion mechanism of financial risk. Chen et al.[3] adopt scale-free networks as the foundation for analyzing corporate credit risk on supply chain networks.
3.1.6 Structural Equation Model
The structural equation model (SE) is a statistical method for evaluating relationships between variables. SE is often employed to analyze questionnaires and variables that are difficult to measure accurately, and it has found widespread use in supply chain studies[55, 194, 195, 196]. Specifically, Imbierowicz et al.[197] utilize SE to analyze the correlation between liquidity and credit risk. Jajja et al.[196] apply SE to investigate the relationship between supply chain risk of manufacturing firms and firm agility performance. Munir et al.[195] employ SEM to examine the connection between supply chain integration and supply chain risk management.
3.1.7 Factor Model
Factor models resemble regression models in that they both study the influencing factors of dependent variables. However, the factors in factor models are not directly observable. Commonly used models include the single-factor model[198, 199], three-factor model[200], and multi-factor model[108, 201]. For instance, Wang et al.[200] employ a three-factor model to study the risk of quarterly heterogeneity in supply chains. Brusset et al.[198] utilize a single-factor model to investigate the factors related to supply chain elasticity. Ang et al.[108] apply CDS spread data and a multi-factor model to examine financial market systemic risk in sovereign countries.
3.1.8 Other Statistical Models
There are numerous common statistical models in traditional economic or management fields for studying enterprise risk. For instance, Duffie et al.[34] employ maximum likelihood estimation to investigate the term structure of the conditional probability of enterprise bankruptcy. Angilella et al.[157] develop a credit risk model based on a multi-criteria model to assess innovative SMEs. Cachon et al.[153] utilize the Nash equilibrium in game theory to analyze competition and cooperation between suppliers and retailers. Considering international oil prices, Maghyereh et al.[158] implement the Delta CoVaR method to measure the systemic risk of banking systems in GCC countries. Due to space constraints, many statistical models have not been mentioned, but these methods also contribute to the study of corporate risk.
3.2 Machine Learning Methods
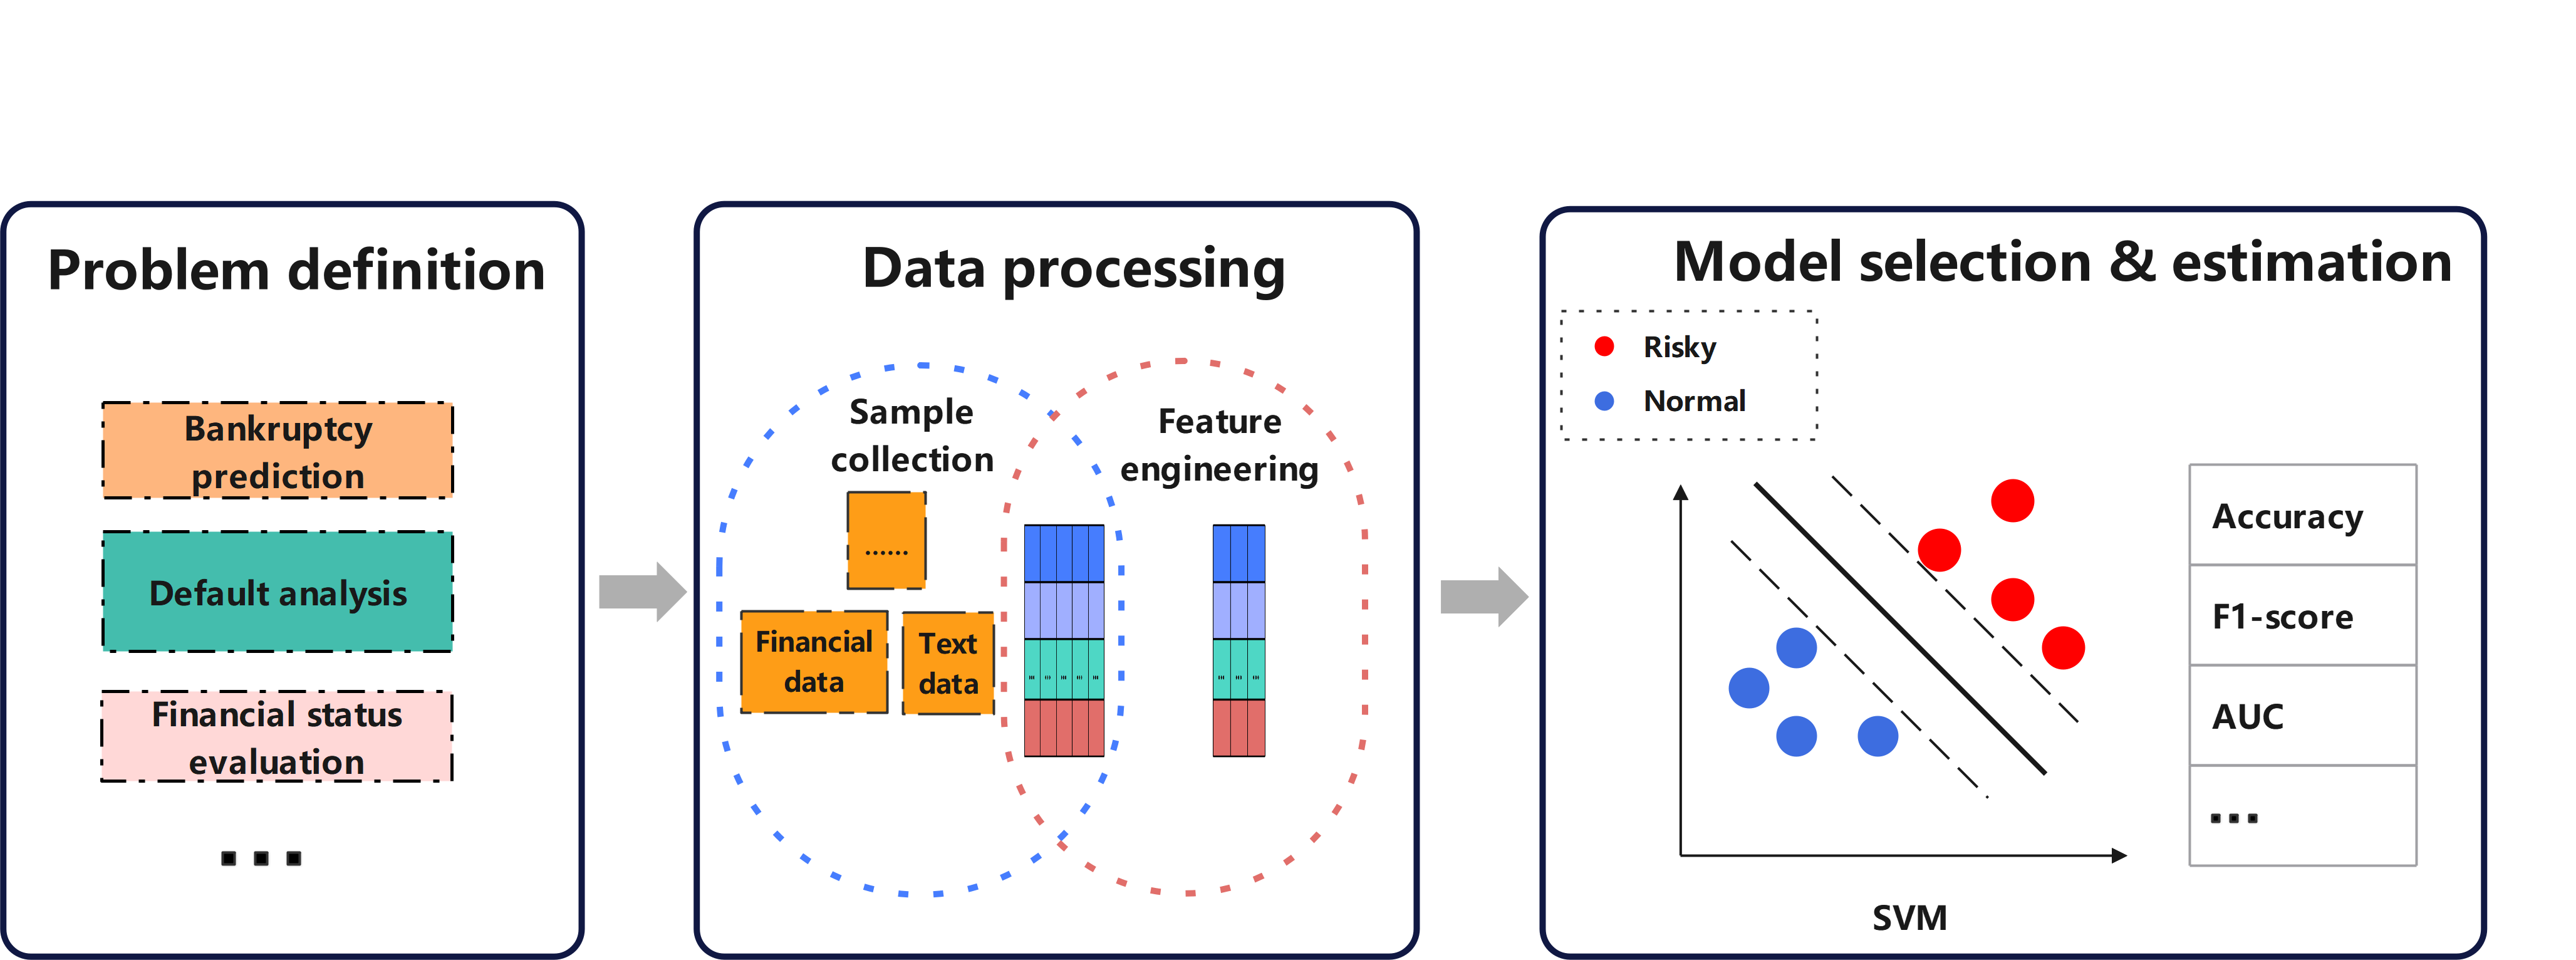
Machine learning methods have gained popularity in enterprise risk prediction and analysis. Compared with traditional statistical methods, machine learning has several advantages. Specifically, it exhibits stronger adaptability, allowing it to more effectively handle non-linear relationships and high-dimensional data. Furthermore, machine learning models have stronger scalability and model generalization capabilities. Table VIII shows the core formulas of the main machine learning models and the meaning of the parameters of these models in this section. Figure 7 shows the general pipeline of machine learning models in enterprise risk analysis.
3.2.1 Logistic Regression
Although supported by linear regression theory, Logistic Regression (LR) introduces nonlinear factors via sigmoid function, thus being capable of dealing with classification problems. LR is often used to analyze a company’s external environment and internal operations. For instance, Everett et al. [41] make a special study of the relationship between macroeconomics and small-firm failure through LR. It finds that a better economic environment can lead some firms to fail due to their propensity to exit after realizing profits. Utilizing a LR model, Zorn et al. [163] analyze the problem of corporate bankruptcy from the perspective of layoffs , finding that downsizing firms are twice as likely to get bankruptcy as non-downsizing firms.
3.2.2 Neural Networks
Neural network (NN) is a machine learning algorithm that emulates the behavioral characteristics of animal neural networks, and is capable of end-to-end data processing.
Boasting for being capable of handling non-linear relationships and high-dimensional data, NN has been extensively applied in enterprise risk prediction. For instance, Coats et al. [202] use a NN to analyze a company’s future financial position. Iturriaga et al. [203] combine multilayer perceptrons and SOM for the financial domain. Not only can the probability of bankruptcy be predicted, but it can also visualize the probability of bankruptcy three years before the bankruptcy occurs. Improvements in performance of the NN can be achieved through better training methods, better architecture, or better input data. In [204], the author analyzes the NN model in three aspects: data span, NN architecture and iteration times. It is found that rich data can improve the performance of the model, and the latter two need to be properly valued to avoid overfitting. Additionally, many studies have optimized input data from different perspectives, all of which have resulted in improved performance of the model [205, 57, 69].
3.2.3 Support Vector Machine
Support vector machine (SVM) is a type of generalized linear classifier that performs binary classification through supervised learning. The decision boundary of SVM is determined by the maximum margin hyperplane, which is calculated based on the sample data.
SVM is widely utilized for bankruptcy prediction, and it is a good choice to apply SVM model when the sample size is small [206]. Also, choosing different kernels for different prediction scenarios may be a good way to improve model performance [207]. Some methods such as feature selection and parameter tuning are used to improve the performance of SVM in enterprise risk analysis. Specifically, many researchers have done a lot of work on feature selection so that SVM can obtain better prediction performance [162, 208]. Other scholars are devoted to the optimization of feature selection and parameter selection [209].
3.2.4 Decision Tree
Decision Tree (DT) is a classical classification and regression algorithm in machine learning. DT is a straightforward and interpretable method that is commonly employed for simple prediction tasks, or as a component of more complex prediction models. As an illustration, Delen et al. [177] employ a two-stage analytical approach to investigate firm risk. The first stage involved the use of exploratory factor analysis to verify the underlying dimensions of financial ratios. In the second stage, four commonly-used decision tree models were utilized to explore potential relationships between firm risk and financial ratios. Sung et al. [210] adopt DT as the bankruptcy prediction model because of its great interpretability. When dealing with excessive variables, DT can also be used for variable selection[211]. To achieve better performance, various optimization methods of DT have been proposed by many scholars. These methods include ensemble methods and other statistical methods [145, 164, 212].
3.2.5 Random Forest
The Random Forest (RF) algorithm is a popular ensemble classifier that utilizes multiple decision trees for training and predicting samples. It is widely acknowledged for its robustness and accuracy in handling complex classification problems.
Although RF demonstrates impressive accuracy, it often requires more time to process large-scale datasets. Therefore, it is recommended to use RF if high prediction accuracy is critical and the dataset is small.
RF can also be used to output intermediate results. Combining evidence theory and RF, Zhu et al. [213] find that
the RF classification result is used as the fundamental probability distribution for evaluating financial risk characteristics, and the evidence synthesis rule of evidence theory is used for multi-source information fusion to determine the financial risk level and corresponding probability distribution.
| Model | Main Formular | Parameter and Explanation |
| Logistic Regression | :Probability of ; : The intercept term of the regression function; | |
| : Row vectors of regression coefficients; : Column vectors of explanatory variables | ||
| Neural Networks | : The activated neuron in layer ; : The activated neuron in layer ; | |
| : Weight from the neuron in layer to the neuron in layer ; | ||
| : The offset of the neuron in layer | ||
| Support Vector Machine | : Parameter vector; : Offset term; | |
| : Label ; : The sample | ||
| Genetic Algorithm | :Probability of individual being selected; | |
| : Population size; : Fitness of individual | ||
| Decision Tree | : Information entropy; : Sample set; | |
| : Number of sample categories; : Proportion of the class sample |
3.2.6 Genetic Algorithm
The Genetic Algorithm (GA) is a biologically-inspired optimization technique that simulates the mechanisms of natural selection and inheritance presented in living systems. GA is typically employed for multi-objective optimization or black-box optimization problems. Current research tends to utilize GA as a tool for rule exploration or as a component of enterprise risk analysis model [214]. For instance, in [160], bankruptcy rules are extracted through GA and applied to bankruptcy prediction. In [215], a robust bankruptcy prediction model is constructed by combining genetic programming algorithm with rough set theory.
3.2.7 Others Methods
Previous studyies often attempt to improve machine learning models by combining theories from different fields or integrating multiple models to enhance performance. Yeh et al. [216] combine DEA, rough sets, and SVM to improve the ability of SVM to predict company bankruptcy. Tsakonas et al. [217] propose the application of genetic programming-based neural logic networks, which can explain the network structure through a set of expert rules. Most models that are using ensemble-based techniques attempt to evaluate all bankruptcy scenarios, either using the same set of variables or the same set of samples. In many cases, these two assumptions do not hold. Jardin et al. [218] use biclustering and neural network-based ensembles to predict bankruptcy. Biclustering methods can estimate subgroups of data while considering possible relationships between samples and variables. Chen et al. [178] propose a bankruptcy prediction model based on the adaptive FKNN method, and the continuous PSO method is used to determine the neighborhood size and fuzzy parameters of the model.
3.3 Deep Learning Methods
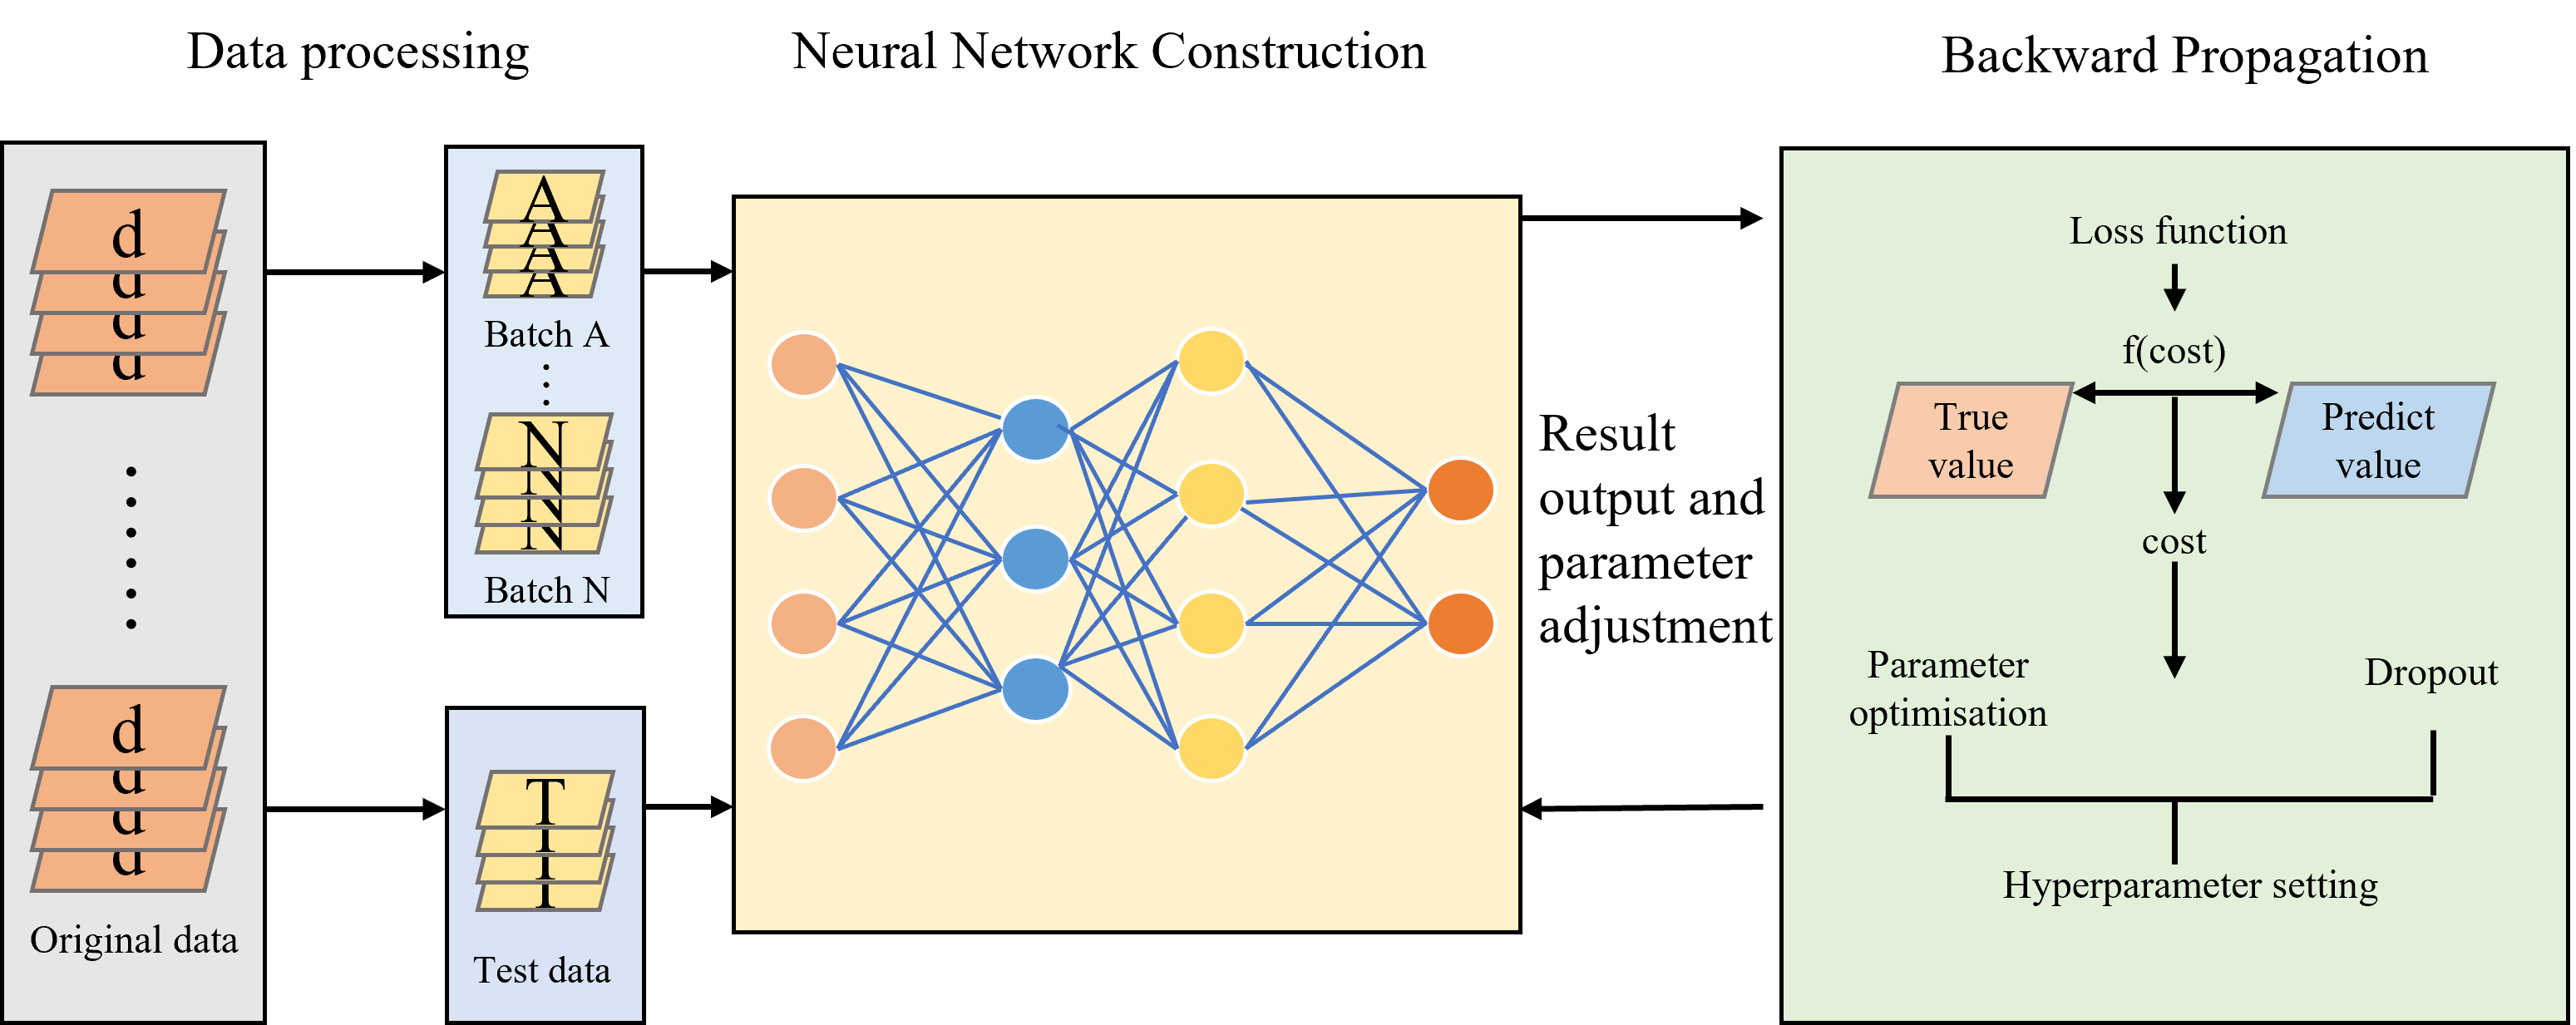
Deep learning, a subfield of machine learning, which harnesses the power of artificial neural networks, has a sophisticated architecture consisting of multiple layers for processing. Through back propagation, the model parameters are continuously updated, enabling autonomous data exploration and the generation of informative features. Thus, deep learning methods overcome the limitations of manually designed features and pave the way for more effective financial risk analysis. In this section, we discuss various applications of deep learning methods in risk analysis based on their structural characteristics.
3.3.1 Convolutional Neural Networks
CNNs are advanced deep learning models that leverage unique features such as local connectivity and weight sharing. These unique features make CNNs highly effective in extracting significant features from complex financial data, revealing obscured patterns and trends that can facilitate precise predictions and informed decisions regarding future market [219]. Based on this feature, Wei et al. [49] extract structured data and unstructured text from corporate annual reports and construct a financial risk prediction system using CNN and LSTM methods. Hosaka et al. [16] convert the financial scale data into grayscale images and then apply CNN in bankruptcy prediction.
3.3.2 Autoencoder
Autoencoder is an unsupervised neural network model that aims to compress the input data into a low-dimensional feature space and then reconstruct the original input data from this feature space. Therefore, Autoencoder can also be used for enterprise financial risk analysis. For instance, Soui et al. [151] utilize SAE to extract the best features and also use softmax classifiers to predict bankruptcy. Smiti et al. [150] propose a novel approach called BSM-SAES. This approach combines a boundary synthesis minority oversampling technique and a stacked autoencoder based on the softmax classifier.
3.3.3 Graph Neural Networks
GNN is a deep learning method based on graph structure that transforms nodes and edges into a dense vector form and employs the topological information of the graph for computation and inference. And GNN is commonly used for node classification in enterprise risk analysis. For instance, Yang et al. [102] put forward an innovative framework for financial risk analysis based on supply chain graph mining. Meanwhile, Bi et al. [99] propose TH-GNN, which is applied to tribe-style graphs, with the first level encoding the structural patterns of tribes through contrastive learning and the second level diffusing information based on inter-tribal relationships. Then Bi et al. [152] present KT-GNN, which simulates the transfer of knowledge from vocal nodes to silent nodes by transferring the distribution during message passing and representation learning. It is also used in the financial risk assessment scenario.
3.4 Hybrid Models
In the field of enterprise risk research, a single model may have poor performance in prediction or evaluation. Therefore, some studies combine several models to complement each other’s strengths, hoping to avoid some limitations and improve the overall performance of model evaluation.
3.4.1 Homogeneous Hybrid Model
Some hybrid models are of the same category, which signifies they either combine SEMs or various ML and DL methods. For instance, Giesecke et al. [166] and Pra et al.[220] both employ contagion models with Bernoulli mixture models to investigate different aspects of credit risk for large financial institutions and enterprise borrowing-lending network. Voda et al.[68] utilize the canonical discriminant analysis, sensitivity analysis and stepwise least squares estimation to examine bankruptcy risk.
It can be founded that some previous studies have leveraged multiple ML and DL algorithms. For example, Chen et al.[221] devise a hybrid model combining NN and K-means algorithm to forecast financial distress. Ahn et al.[168] combine GA with the case-based reasoning (CBR) method to improve bankruptcy prediction performance. To better predict the credit risk, You et al.[139] propose a RS-MultiBoosting model, which combines random subspace and MultiBoosting.
In pursuit of further improved prediction performance, some works attempt to merge at least three ML algorithms.
Sun et al.[167] suggest a data mining method that combines attribute-oriented induction, information gain, and DT to predict financial distress problems.
They later improve this method based on multiple classifier serial combinations involving SVM, multiple discriminant analysis (MDA) and CBR [222].
Hung et al.[223] propose a model that combines DT, BPN and SVM to better forecast bankruptcy.
3.4.2 Cross-hybrid Model
Cross-hybrid models combine different types of models, such as statistical and ML models. These models effectively represent the integration of economics and computer science and may achieve a good balance between prediction accuracy and interpretability.
Since the advent of ML techniques, some works have been endeavoring to amalgamate them with SEM, and this approach remains a productive area of research and development even today. For instance, Cheng et al.[224] combine NN and logit analysis to build a hybrid model named RBFN to forecast financial distress. Fernando et al.[67] propose a method for corporate bankruptcy prediction that combines SOM and Multivariate Adaptive Regression Splines. Tarei et al.[225] combine multiple criteria decision making, integrated decision-making trial and evaluation laboratory analytical network process to develop a framework for quantifying supply chain risk.
Some scholars endeavor to integrate three distinct approaches. For example, Xu et al.[92] propose an integrated model called NIM to predict bankruptcy, which combines CNN-oriented DL, SVM and soft set theory. Gao et al.[226] utilize BPNN, analytic hierarchy processes, and data mining algorithm HIUA to forecast the financial risk of listed companies. In order to measure systemic financial risks, Huang et al.[227] employ logistic regression, NN and time-varying parameter vector autoregressive model to process multiple data.
Many studies combining the strengths of more models are widely conducted. For instance, Yildirim et al.[228] contend big data analysis is suitable for corporate credit default prediction, so they introduce two hybrid models based on logistic regression, DT, RF, gradient boosting and graph theory. Sun et al.[229] propose a multi-classifier hybrid model to forecast financial distress, which combines MDA, Logit, NN, DT, SVM, CBR. Jardin et al.[170] construct two models for bankruptcy prediction, which are based on discriminant analysis, logistic regression, FNN, Cox’s model, SOM and NN.
4 Spotlights of Representative Works
In this section, we first make a brief introduction to the rep- representative works and then present their unique contributions.
| Reference | Title | Journal | Year | Citations | ||
| [2] | Financial ratios, discriminant analysis and the prediction of corporate bankruptcy | J FINANC | 1968 | 23685 | ||
| [230] |
|
J FINANC | 1995 | 3069 | ||
| [231] |
|
Journal of management | 2006 | 2781 | ||
| [232] |
|
J FINANC | 2008 | 2754 | ||
| [233] |
|
Journal of Business Venturing | 2011 | 2486 | ||
| [1] |
|
J FINANC ECON | 2012 | 2468 | ||
| [234] |
|
The review of financial studies | 1997 | 2368 | ||
| [72] | Systemic risk and stability in financial networks | American Economic Review | 2015 | 2119 | ||
| [235] |
|
Decision sciences | 2007 | 1891 | ||
| [236] | A neural network model for bankruptcy prediction | IJCNN | 1990 | 1465 | ||
| [237] |
|
Journal of Business Ethics | 2006 | 1384 | ||
| [238] | Benchmarking state-of-the-art classification algorithms for credit scoring | JORS | 2003 | 1192 | ||
| [239] |
|
IJPE | 2008 | 1160 | ||
| [209] | Bankruptcy prediction using support vector machine with optimal choice of kernel function parameters | EXPERT SYST APPL | 2005 | 1154 | ||
| [240] |
|
ABACUS | 2007 | 1086 | ||
| [241] |
|
INFORMS | 2019 | 1086 | ||
| [242] |
|
Information Sciences | 2014 | 753 | ||
| [243] |
|
J FINANC | 2012 | 675 | ||
| [147] |
|
EXPERT SYST APPL | 2017 | 656 | ||
| [244] |
|
J BANK & FINANC | 2011 | 586 | ||
| [245] |
|
Production Economics | 2015 | 506 | ||
| [22] |
|
J BANK & FINANC | 2009 | 473 | ||
| [197] |
|
J BANK & FINANC | 2014 | 466 | ||
| [20] |
|
REV FINANC | 2014 | 348 | ||
| [18] |
|
EJOR | 2019 | 232 | ||
| [16] |
|
EXPERT SYST APPL | 2019 | 209 | ||
| [102] |
|
IJCAI | 2021 | 45 |
We select the representative works based on citations and methodological progress. The citation for each reference is based on the citation statistics from Google Scholar as of April 23, 2023. Table IX presents the most representative studies during the period from 1968 to 2023 in terms of citations. The highly cited studies can be broadly divided into two groups according to their focus: existence and methods. Table X summarizes the findings of these representative works for easy review.
The first category is the existence category, which focuses on demonstrating the comovements between enterprise financial risk and various types of data including financial index, textual information, relational data and intelligence integration. For instance, Belas et al. [38] conduct a study that revealed that there was a direct connection between the corporate governance structure and enterprise bankruptcy. Imbierowicz et al. [197] examine the relationship between liquidity risk and credit risk in the banking industry from different perspectives. Chae [245] analyze supply chain tweets and gain insight into the potential role of Twitter in supply chain practice and research.
The second category focuses on utilizing various techniques, particularly the latest advances in NLP and ML, to extract valuable information from textual media and relation data. This helps establish connections between enterprise multi-source heterogeneous data and financial risk. Barboza et al. [147] employ four machine learning models to predict the probability of enterprise bankruptcy, and discovery that RF is the best. Campbell et al. [232] leverage a reduced-form econometric model to predict short- and long-term corporate bankruptcies and failures, while showing that stocks with a high risk of failure tend to deliver lower average returns.
| Group | Reference | Contribution | ||
| Existence | [197] |
|
||
| [241] |
|
|||
| [240] |
|
|||
| [246] |
|
|||
| [245] |
|
|||
| [243] |
|
|||
| [239] |
|
|||
| [235] |
|
|||
| Methods | [1] |
|
||
| [147] |
|
|||
| [237] |
|
|||
| [242] |
|
|||
| [244] |
|
|||
| [234] |
|
|||
| [232] |
|
|||
| [230] |
|
5 Directions For Future Work
5.1 Enterprise Intelligence
We anticipate that enterprise risk prediction will increasingly rely on the integration and analysis of diverse data sources. Such sources may include information from customers, industries, affiliated companies, and governments, with seemingly insignificant data such as business utility bills also potentially providing effective supplements to traditional data. And, it is also crucial to note that data availability can be a significant challenge for enterprise risk prediction. Thus, it is imperative to prioritize the construction of open databases that can serve as a platform for sharing. By doing so, we can unlock the full potential of the data and gain a more comprehensive understanding of risk profiles.
5.2 Analysis Model
With the advancement of deep learning, there has been rapid progress in the development of models that can capture more intricate information and effectively process unstructured data. GNN and time series information extraction based on deep learning are two promising technologies with great potential. In recent years, graph neural networks have emerged as a novel neural network paradigm specifically tailored to learn from and reason about graph-structured data, which is known to contain rich relational information. It combines the advantages of graph and deep learning to achieve deeper information correlation. Currently, there are some studies on enterprise risk analysis based on graph attention [247, 149]. And the growth of enterprises is a dynamic and continuous evolving process. To better understand the enterprises risks from a temporal perspective, it is essential to incorporate time-series information into the analytical framework. While traditional measurement methods have been employed for time-series analysis [248, 133], there is growing interest in leveraging deep learning techniques, including LSTM [249] and transformer [250], to more accurately model and analyze enterprise risks over time. In addition, heterogeneous convergence is a promising way to model the multidimensional nature of enterprise risk. By integrating different models, we can comprehensively present and analyze risks from multiple perspectives, achieving a significant improvement in analytical performance.
5.3 Contagion Mechanism
Current research is examining the potential risks that financial networks pose to companies. However, to fully comprehend these risks, it is essential to gain a deeper understanding of the specific pathways through which they are transmitted. This involves identifying the impact of risk on individual companies, as well as the extent to which these risks spread. Additionally, it is crucial to investigate the temporal aspects of risk transmission, such as the length of time it takes for risks to spread to related companies. Furthermore, whether the risks types of related companies are the same as those of the original company is also significant. Unfortunately, technological limitations have prevented a systemic study of these questions. Given the progress of globalization, it is critical to gain a comprehensive understanding of risk transmission mechanisms. Therefore, further exploration into this research direction is highly recommended.
5.4 Risk Interpretability
Despite existing deep learning models have achieved success in enterprise risk analysis, these methods are often treated as black-boxes and cannot explain “Why the model makes certain predictions?”. This limitation hinders their application in critical areas such as finance and security. To address this issue, several techniques are proposed to explain the deep models for image and text data [251, 252]. And the explanation techniques for GNNs are categorized into two main classes: instance-level methods [253] and model-level methods [254, 255, 256]. Therefore, exploring a risk detector that can provide high-quality predictions and explanations simultaneously is a promising approach for future research on enterprise financial risk.
5.5 LLMs for Enterprise Financial Risk
LLMs can be applied in various scenarios, such as intelligent customer service, investment advisory, marketing, risk manage- ment, operations, investment research, investment banking, quan- titative trading. In the financial industry, LLMs have already been deployed, with examples including Morgan Stanley, Stripe, and Bloomberg GPT. In the area of enterprise financial risks, LLMs can be utilized for public opinion analysis and regulation extraction from texts. Furthermore, LLMs can also be employed to improve existing financial NLP tasks, such as relation extraction and named entity recognition, so as to construct enterprise knowledge graphs. Then, the inference capability of LLMs on graph-structured data can be leveraged to analyze financial risks of enterprises.
6 Conclusion
In this survey, we attempt to cascade and systematize existing research on enterprise financial risk, providing a comprehensive review of enterprise risk analysis. This is the first survey for enterprise financial risk from the Big Data perspective. In particular, we first begin with an introduction to the types, granularity, intelligence and evaluation metrics of enterprise financial risk. Then we classify models of enterprise financial risk, show the basic implementation framework for each type of model, and summarise representative approaches in enterprise risk analysis. Finally, we elaborate on current cutting-edge research and its possible future directions. We believe that this survey will provide researchers in the field with the fundamental knowledge and a clear framework for research.
Acknowledgments
The research is supported by the National Natural Science Foundation of China under Grant Nos. U1811462, 71725001, 71910107002, 61906159, 62176014, 71873108, 62072379, and Sichuan Science and Technology Program under Grant No. 2023NSFSC0032, 2023NSFSC0114, and Guanghua Talent Project of Southwestern University of Finance and Economics, and “Double-First Class” International Innovation Project (SYL22GJCX07).
References
- [1] M. Billio, M. Getmansky, A. W. Lo, and L. Pelizzon, “Econometric measures of connectedness and systemic risk in the finance and insurance sectors,” Journal of financial economics, vol. 104, no. 3, pp. 535–559, 2012.
- [2] E. I. Altman, “Financial ratios, discriminant analysis and the prediction of corporate bankruptcy,” The Journal of Finance, vol. 23, no. 4, pp. 589–609, 1968.
- [3] W. Chen, Z. Li, and Z. Xiao, “On credit risk contagion of supply chain finance under covid-19,” Journal of Mathematics, 2021.
- [4] Y. Zhao, S. Wei, Y. Guo, Q. Yang, Q. Li, F. Zhuang, J. Liu, and G. Kou, “Combining intra-risk and contagion risk for enterprise bankruptcy prediction using graph neural networks,” arXiv preprint arXiv:2202.03874, 2022.
- [5] K. Abduraimova, “Contagion and tail risk in complex financial networks,” Journal of Banking & Finance, p. 106560, 2022.
- [6] R. A. Collins and R. D. Green, “Statistical methods for bankruptcy forecasting,” Journal of Economics and Business, vol. 34, no. 4, pp. 349–354, 1982.
- [7] W. Xu, W. Liu, C. Xu, J. Bian, J. Yin, and T.-Y. Liu, “Rest: Relational event-driven stock trend forecasting,” in Proceedings of the Web Conference 2021, 2021, pp. 1–10.
- [8] Z. Hua, Y. Wang, X. Xu, B. Zhang, and L. Liang, “Predicting corporate financial distress based on integration of support vector machine and logistic regression,” Expert Systems with Applications, vol. 33, no. 2, pp. 434–440, 8 2007.
- [9] C. Yin, C. Jiang, H. K. Jain, and Z. Wang, “Evaluating the credit risk of smes using legal judgments,” Decision Support Systems, vol. 136, p. 113364, 2020.
- [10] C. Wang, F. Yu, Z. Zhang, and J. Zhang, “Multiview graph learning for small-and medium-sized enterprises’ credit risk assessment in supply chain finance,” Complexity, vol. 2021, 2021.
- [11] E. Letizia and F. Lillo, “Corporate payments networks and credit risk rating,” EPJ Data Science, vol. 8, no. 1, p. 21, 2019.
- [12] Z. You, X. Chi, W. Gang-Jin, and Y. Xin-Guo, “Predicting china’s sme credit risk in supply chain finance based on machine learning methods,” Entropy, vol. 18, no. 5, p. 195, 2016.
- [13] B. Sang, “Application of genetic algorithm and bp neural network in supply chain finance under information sharing,” Journal of Computational and Applied Mathematics, vol. 384, p. 113170, 3 2021.
- [14] G. Kou, Y. Xu, Y. Peng, F. Shen, Y. Chen, K. Chang, and S. Kou, “Bankruptcy prediction for smes using transactional data and two-stage multiobjective feature selection,” Decision Support Systems, vol. 140, p. 113429, 2021.
- [15] E. Tobback, T. Bellotti, J. Moeyersoms, M. Stankova, and D. Martens, “Bankruptcy prediction for smes using relational data,” Decision Support Systems, vol. 102, pp. 69–81, 2017.
- [16] T. Hosaka, “Bankruptcy prediction using imaged financial ratios and convolutional neural networks,” Expert systems with applications, vol. 117, pp. 287–299, 2019.
- [17] K. Lee, D. Booth, and P. Alam, “A comparison of supervised and unsupervised neural networks in predicting bankruptcy of korean firms,” Expert Systems with Applications, vol. 29, no. 1, pp. 1–16, 2005.
- [18] F. Mai, S. Tian, C. Lee, and L. Ma., “Deep learning models for bankruptcy prediction using textual disclosures,” European journal of operational research, vol. 274, no. 2, pp. 743–758, 2019.
- [19] I. D. Dichev, “Is the risk of bankruptcy a systematic risk?” the Journal of Finance, vol. 53, no. 3, pp. 1131–1147, 1998.
- [20] R. Gropp, C. Gruendl, and A. Guettler, “The impact of public guarantees on bank risk-taking: Evidence from a natural experiment,” Review of Finance, vol. 18, no. 2, pp. 457–488, 2014.
- [21] J. Ming and X. Ming, “Determinants of the guarantee circles: The case of chinese listed firms,” Pacific-Basin Finance Journal, vol. 20, no. 1, pp. 78–100, 2012.
- [22] B. Henk, C. Rebel A, and F. Lawrence J, “Expropriation through loan guarantees to related parties: Evidence from china,” Journal of Banking & Finance, vol. 33, no. 1, pp. 141–156, 2009.
- [23] J. A. Wilcox and Y. Yasuda, “Government guarantees of loans to small businesses: Effects on banks’ risk-taking and non-guaranteed lending,” Journal of Financial Intermediation, vol. 37, pp. 45–57, 2019.
- [24] D. Cheng, X. Wang, Y. Zhang, and L. Zhang, “Risk guarantee prediction in networked-loans,” in Proceedings of the Twenty-Ninth International Conference on International Joint Conferences on Artificial Intelligence, 2021, pp. 4483–4489.
- [25] C. Dawei, N. Zhibin, and Z. Yiyi, “Contagious chain risk rating for networked-guarantee loans,” in Proceedings of SIGKDD, 2020, pp. 2715–2723.
- [26] K. Valaskova, T. Kliestik, and M. Kovacova, “Management of financial risks in slovak enterprises using regression analysis,” Oeconomia Copernicana, vol. 9, no. 1, pp. 105–121, 2018.
- [27] I. Oikonomou, C. Brooks, and S. Pavelin, “The impact of corporate social performance on financial risk and utility: A longitudinal analysis,” Financial Management, vol. 41, no. 2, pp. 483–515, 2012.
- [28] J. F. Kölbel, T. Busch, and L. M. Jancso, “How media coverage of corporate social irresponsibility increases financial risk,” Strategic Management Journal, vol. 38, no. 11, pp. 2266–2284, 2017.
- [29] M. Zhai, “Risk prediction and response strategies in corporate financial management based on optimized bp neural network,” Complexity, vol. 2021, 2021.
- [30] Y. Cao, Y. Shao, and H. Zhang, “Study on early warning of e-commerce enterprise financial risk based on deep learning algorithm,” Electronic Commerce Research, vol. 22, no. 1, pp. 21–36, 2022.
- [31] J.-B. Kim, L. Li, L. Y. Lu, and Y. Yu, “Financial statement comparability and expected crash risk,” Journal of Accounting and Economics, vol. 61, no. 2-3, pp. 294–312, 2016.
- [32] D. McKillop, D. French, B. Quinn, A. L. Sobiech, and J. O. Wilson, “Cooperative financial institutions: A review of the literature,” International Review of Financial Analysis, vol. 71, p. 101520, 2020.
- [33] K. Xing, D. Luo, and L. Liu, “Macroeconomic conditions, corporate default, and default clustering,” Economic Modelling, vol. 118, p. 106079, 2023.
- [34] D. Duffie, L. Saita, and W. Ke, “Multi-period corporate default prediction with stochastic covariates,” Journal of financial economics, vol. 83, no. 3, pp. 635–665, 3 2007.
- [35] J. Belas, L. Smrcka, B. Gavurova, and J. Dvorsky, “The impact of social and economic factors in the credit risk management of sme,” Technological and Economic Development of Economy, vol. 24, no. 3, pp. 1215–1230, 2018.
- [36] D. Y. Tang and Y. Hong, “Market conditions, default risk and credit spreads,” Journal of Banking & Finance, vol. 34, no. 4, pp. 743–753, 4 2010.
- [37] J. A. Ohlson, “Financial ratios and the probabilistic prediction of bankruptcy,” Journal of accounting research, pp. 109–131, 1980.
- [38] C. M. Daily and D. R. Dalton, “Bankruptcy and corporate governance: The impact of board composition and structure,” Academy of Management journal, vol. 37, no. 6, pp. 1603–1617, 1994.
- [39] P. Arora, “Financially linked independent directors and bankruptcy reemergence: The role of director effort,” Journal of Management, vol. 44, no. 7, pp. 2665–2689, 2018.
- [40] H. Kamalirezaei, A. A. Anvary Rostamy, A. Saeedi, and M. Khodaei Valeh Zaghard, “Corporate social responsibility and bankruptcy probability: Exploring the role of market competition, intellectual capital, and equity cost,” Journal of Corporate Accounting & Finance, vol. 31, no. 1, pp. 53–63, 2020.
- [41] J. Everett and J. Watson, “Small business failure and external risk factors,” Small business economics, vol. 11, no. 4, pp. 371–390, 1998.
- [42] M. Cowling, R. Brown, and A. Rocha, “¡? covid19?¿ did you save some cash for a rainy covid-19 day? the crisis and smes,” International Small Business Journal, vol. 38, no. 7, pp. 593–604, 2020.
- [43] K. Cowan, A. Drexler, and Á. Yañez, “The effect of credit guarantees on credit availability and delinquency rates,” Journal of Banking & Finance, vol. 59, pp. 98–110, 2015.
- [44] W. Binghui, “Asset securitization and rate of return: A study on letters of guarantee,” Physica A: Statistical Mechanics and its Applications, vol. 490, pp. 1551–1554, 2018.
- [45] T. McNulty, C. Florackis, and P. Ormrod, “Boards of directors and financial risk during the credit crisis,” Corporate Governance: An International Review, vol. 21, no. 1, pp. 58–78, 2013.
- [46] B. Sabri, C. Alexis, M. Riadh, and S. Asif, “Does corporate social responsibility reduce financial distress risk?” Economic Modelling, vol. 91, pp. 835–851, 2020.
- [47] G. C. Landi, F. Iandolo, A. Renzi, and A. Rey, “Embedding sustainability in risk management: The impact of environmental, social, and governance ratings on corporate financial risk,” Corporate Social Responsibility and Environmental Management, 2022.
- [48] X. Li, J. Wang, and C. Yang, “Risk prediction in financial management of listed companies based on optimized bp neural network under digital economy,” Neural Computing and Applications, pp. 1–14, 2022.
- [49] W. Wei and B. Li, “Analysis and risk assessment of corporate financial leverage using mobile payment in the era of digital technology in a complex environment,” Journal of Mathematics, vol. 2022, 2022.
- [50] L. Zhu, M. Li, and N. Metawa, “Financial risk evaluation z-score model for intelligent iot-based enterprises,” Information Processing & Management, vol. 58, no. 6, p. 102692, 2021.
- [51] G. Qiao, L. Du et al., “Enterprise financial risk early warning method based on hybrid pso-svm model,” Journal of Applied Science and Engineering, vol. 22, no. 1, pp. 171–178, 2019.
- [52] K. Carling, T. Jacobson, J. Lindé, and K. Roszbach, “Corporate credit risk modeling and the macroeconomy,” Journal of banking & finance, vol. 31, no. 3, pp. 845–868, 3 2007.
- [53] C.-H. Wu, G.-H. Tzeng, Y.-J. Goo, and W.-C. Fang, “A real-valued genetic algorithm to optimize the parameters of support vector machine for predicting bankruptcy,” Expert systems with applications, vol. 32, no. 2, pp. 397–408, 2007.
- [54] D. Liang, C.-F. Tsai, and H.-T. Wu, “The effect of feature selection on financial distress prediction,” Knowledge-Based Systems, vol. 73, pp. 289–297, 2015.
- [55] S. Ambulkar, J. Blackhurst, and S. J. Grawe, “Firm’s resilience to supply chain disruptions: Scale development and empirical examination,” Journal of Operations Management, vol. 33, pp. 111–122, 2015.
- [56] M. Doumpos and C. Zopounidis, “A multicriteria outranking modeling approach for credit rating,” Decision Sciences, vol. 42, no. 3, pp. 721–742, 7 2011.
- [57] P. du Jardin, “Dynamic self-organizing feature map-based models applied to bankruptcy prediction,” Decision Support Systems, vol. 147, p. 113576, 2021.
- [58] S. Hwijae, H. C, P. Du, and H. Hyung Ju, “Data analytic approach for bankruptcy prediction,” Expert Systems with Applications, vol. 138, p. 112816, 2019.
- [59] A. Khashman, “A neural network model for credit risk evaluation,” International Journal of Neural Systems, vol. 19, no. 04, pp. 285–294, 2009.
- [60] S. J. H. Shahzad, T. H. V. Hoang, and E. Bouri, “From pandemic to systemic risk: contagion in the us tourism sector,” Current Issues in Tourism, vol. 25, no. 1, pp. 34–40, 2022.
- [61] A. Zhang, S. Wang, B. Liu, and J. Fu, “How government regulation of interbank financing impacts risk for chinese commercial banks,” Journal of Asian Economics, vol. 66, p. 101148, 2020.
- [62] M. Kritzman, Y. Li, S. Page, and R. Rigobon, “Principal components as a measure of systemic risk,” The Journal of Portfolio Management, vol. 37, no. 4, pp. 112–126, 2011.
- [63] W. R. Kerr and R. Nanda, “Democratizing entry: Banking deregulations, financing constraints, and entrepreneurship,” Journal of Financial Economics, vol. 94, no. 1, pp. 124–149, 2009.
- [64] L. L. Bargeron, K. M. Lehn, and C. J. Zutter, “Sarbanes-oxley and corporate risk-taking,” Journal of Accounting and Economics, vol. 49, no. 1-2, pp. 34–52, 2010.
- [65] V. Ramiah, B. Martin, and I. Moosa, “How does the stock market react to the announcement of green policies?” Journal of Banking & Finance, vol. 37, no. 5, pp. 1747–1758, 2013.
- [66] A. S. Reisz and C. Perlich, “A market-based framework for bankruptcy prediction,” Journal of financial stability, vol. 3, no. 2, pp. 85–131, 2007.
- [67] F. Sánchez-Lasheras, J. de Andrés, P. Lorca, and F. J. de Cos Juez, “A hybrid device for the solution of sampling bias problems in the forecasting of firms’ bankruptcy,” Expert Systems with Applications, vol. 39, no. 8, pp. 7512–7523, 2012.
- [68] A. D. Voda, G. Dobrotua, D. M. Țîrcua, D. D. Dumitrașcu, and D. Dobrotua, “Corporate bankruptcy and insolvency prediction model,” Technological and Economic Development of Economy, vol. 27, no. 5, pp. 1039–1056, 2021.
- [69] S. Lee and W. S. Choi, “A multi-industry bankruptcy prediction model using back-propagation neural network and multivariate discriminant analysis,” Expert Systems with Applications, vol. 40, no. 8, pp. 2941–2946, 2013.
- [70] M. A. Boyacioglu, Y. Kara, and Ö. K. Baykan, “Predicting bank financial failures using neural networks, support vector machines and multivariate statistical methods: A comparative analysis in the sample of savings deposit insurance fund (sdif) transferred banks in turkey,” Expert Systems with Applications, vol. 36, no. 2, pp. 3355–3366, 2009.
- [71] X. Huang, I. Vodenska, S. Havlin, and H. E. Stanley, “Cascading failures in bi-partite graphs: model for systemic risk propagation,” Scientific reports, vol. 3, no. 1, pp. 1–9, 2013.
- [72] D. Acemoglu, A. Ozdaglar, and A. Tahbaz-Salehi, “Systemic risk and stability in financial networks,” American Economic Review, vol. 105, no. 2, pp. 564–608, 2015.
- [73] I. Heckmann, T. Comes, and S. Nickel, “A critical review on supply chain risk–definition, measure and modeling,” Omega, vol. 52, pp. 119–132, 4 2015.
- [74] V. Babich, A. N. Burnetas, and P. H. Ritchken, “Competition and diversification effects in supply chains with supplier default risk,” Manufacturing & Service Operations Management, vol. 9, no. 2, pp. 123–146, 4 2007.
- [75] C. Blome and T. Schoenherr, “Supply chain risk management in financial crises—a multiple case-study approach,” International journal of production economics, vol. 134, no. 1, pp. 43–57, 11 2011.
- [76] C. Dawei, N. Zhibin, and Z. Liqing, “Delinquent events prediction in temporal networked-guarantee loans,” IEEE Transactions on Neural Networks and Learning Systems, 2020.
- [77] S. Battiston, D. D. Gatti, M. Gallegati, B. C. N. Greenwald, and J. E. Stiglitz, “Credit chains and bankruptcy propagation in production networks,” Journal of Economic Dynamics and Control, vol. 31, pp. 2061–2084, 2007.
- [78] Y. Duan, S. El Ghoul, O. Guedhami, H. Li, and X. Li, “Bank systemic risk around covid-19: A cross-country analysis,” Journal of Banking & Finance, vol. 133, p. 106299, 2021.
- [79] M. Caporin, L. Garcia-Jorcano, and J.-A. Jimenez-Martin, “Measuring systemic risk during the covid-19 period: A talis3 approach,” Finance Research Letters, vol. 46, p. 102304, 2022.
- [80] N. Borri and G. Di Giorgio, “Systemic risk and the covid challenge in the european banking sector,” Journal of Banking & Finance, vol. 140, p. 106073, 2022.
- [81] M. Papík and L. Papíková, “Impacts of crisis on sme bankruptcy prediction models’ performance,” Expert Systems with Applications, vol. 214, p. 119072, 2023.
- [82] K. Drakos, “Terrorism-induced structural shifts in financial risk: airline stocks in the aftermath of the september 11th terror attacks,” European Journal of Political Economy, vol. 20, no. 2, pp. 435–446, 2004.
- [83] M. Li, Q. Lin, F. Lan, Z. Zhan, and Z. He, “Trade policy uncertainty and financial investment: Evidence from chinese energy firms,” Energy Economics, vol. 117, p. 106424, 2023.
- [84] S. Chava, A. Oettl, A. Subramanian, and K. V. Subramanian, “Banking deregulation and innovation,” Journal of Financial economics, vol. 109, no. 3, pp. 759–774, 2013.
- [85] S. Battiston, M. Puliga, R. Kaushik, P. Tasca, and G. Caldarelli, “Debtrank: Too central to fail? financial networks, the fed and systemic risk,” Scientific reports, vol. 2, no. 1, pp. 1–6, 2012.
- [86] M. Smerlak, B. Stoll, A. Gupta, and J. S. Magdanz, “Mapping systemic risk: critical degree and failures distribution in financial networks,” PloS one, vol. 10, no. 7, p. e0130948, 2015.
- [87] S. Poledna, J. L. Molina-Borboa, S. M. Molina-Borboa nez Jaramillo, M. Van Der Leij, and S. Thurner, “The multi-layer network nature of systemic risk and its implications for the costs of financial crises,” Journal of Financial Stability, vol. 20, pp. 70–81, 2015.
- [88] D. Petrone and V. Latora, “A dynamic approach merging network theory and credit risk techniques to assess systemic risk in financial networks,” Scientific Reports, vol. 8, no. 1, pp. 1–14, 2018.
- [89] L. Tafakori, A. Pourkhanali, and R. Rastelli, “Measuring systemic risk and contagion in the european financial network,” Empirical Economics, pp. 1–45, 2021.
- [90] A. Brezigar-Masten and I. Masten, “Cart-based selection of bankruptcy predictors for the logit model,” Expert systems with applications, vol. 39, no. 11, pp. 10 153–10 159, 2012.
- [91] D. Cheng, Z. Niu, J. Li, and C. Jiang, “Regulating systemic crises: Stemming the contagion risk in networked-loans through deep graph learning,” IEEE Transactions on Knowledge and Data Engineering, 2022.
- [92] W. Xu, Y. Pan, W. Chen, and H. Fu, “Forecasting corporate failure in the chinese energy sector: a novel integrated model of deep learning and support vector machine,” Energies, vol. 12, no. 12, p. 2251, 2019.
- [93] A. Khashman, “Neural networks for credit risk evaluation: Investigation of different neural models and learning schemes,” Expert Syst. Appl., vol. 37, pp. 6233–6239, 2010.
- [94] B. Ribeiro, N. Chen, and A. Kovacec, “Shaping graph pattern mining for financial risk,” Neurocomputing, vol. 326, pp. 123–131, 2019.
- [95] W. Zhang, S. Yan, J. Li, X. Tian, and T. Yoshida, “Credit risk prediction of smes in supply chain finance by fusing demographic and behavioral data,” Transportation Research Part E: Logistics and Transportation Review, 2022.
- [96] Q. Bai and S. Tian, “Innovate or die: Corporate innovation and bankruptcy forecasts,” Journal of Empirical Finance, vol. 59, pp. 88–108, 2020.
- [97] B. Hu, Z. Zhang, J. Zhou, J. Fang, Q. Jia, Y. Fang, Q. Yu, and Y. Qi, “Loan default analysis with multiplex graph learning,” in Proceedings of CIKM, 2020, pp. 2525–2532.
- [98] Y. Zhen, Q. Yu, and X. Wei, “Financial risk prediction with multi-round q&a attention network.” in IJCAI, 2020, pp. 4576–4582.
- [99] B. Wendong, X. Bingbing, S. Xiaoqian, W. Zidong, S. Huawei, and C. Xueqi, “Company-as-tribe: Company financial risk assessment on tribe-style graph with hierarchical graph neural networks,” in Proceedings of the 28th ACM SIGKDD Conference on Knowledge Discovery and Data Mining, 2022, pp. 2712–2720.
- [100] Y. Wang, J. Li, D. Wu, and R. Anupindi, “When ignorance is not bliss: An empirical analysis of subtier supply network structure on firm risk,” Management Science, vol. 67, no. 4, pp. 2029–2048, 2021.
- [101] E. Letizia and F. Lillo, “Corporate payments networks and credit risk rating,” EPJ Data Science, vol. 8, pp. 1–29, 2019.
- [102] S. Yang, Z. Zhang, J. Zhou, Y. Wang, W. Sun, X. Zhong, Y. Fang, Q. Yu, and Y. Qi, “Financial risk analysis for smes with graph-based supply chain mining,” in Proceedings of the Twenty-Ninth International Conference on International Joint Conferences on Artificial Intelligence, 2021, pp. 4661–4667.
- [103] L. Becchetti and J. Sierra, “Bankruptcy risk and productive efficiency in manufacturing firms,” Journal of banking & finance, vol. 27, no. 11, pp. 2099–2120, 2003.
- [104] T. M. Alam, K. Shaukat, M. Mushtaq, Y. Ali, M. Khushi, S. Luo, and A. Wahab, “Corporate bankruptcy prediction: An approach towards better corporate world,” The Computer Journal, vol. 64, no. 11, pp. 1731–1746, 2021.
- [105] C. Wang, F. Yu, Z. Zhang, and J. Zhang, “Multiview graph learning for small- and medium-sized enterprises’ credit risk assessment in supply chain finance,” Complex., vol. 2021, pp. 6 670 873:1–6 670 873:13, 2021.
- [106] B. Jennie, T. G. Bali, and W. Quan, “Common risk factors in the cross-section of corporate bond returns,” Journal of Financial Economics, vol. 131, no. 3, pp. 619–642, 3 2019.
- [107] J. Ericsson and O. Renault, “Liquidity and credit risk,” The Journal of Finance, vol. 61, no. 5, pp. 2219–2250, 9 2006.
- [108] A. Ang and F. A. Longstaff, “Systemic sovereign credit risk: Lessons from the us and europe,” Journal of Monetary Economics, vol. 60, no. 5, pp. 493–510, 7 2013.
- [109] M. G. Subrahmanyam, T. Dragon Yongjun, and W. Sarah Qian, “Does the tail wag the dog?: The effect of credit default swaps on credit risk,” The Review of Financial Studies, vol. 27, no. 10, pp. 2927–2960, 7 2014.
- [110] M. Nishihara and T. Shibata, “The effects of asset liquidity on dynamic sell-out and bankruptcy decisions,” European Journal of Operational Research, vol. 288, no. 3, pp. 1017–1035, 2021.
- [111] R. Takashima, K. Yagi, and H. Takamori, “Government guarantees and risk sharing in public–private partnerships,” Review of Financial Economics, vol. 19, no. 2, pp. 78–83, 2010.
- [112] J. Wang, “A study on credit risk assessment and credit decision making based on micro, small and medium enterprises,” in Journal of Physics: Conference Series, 2021, p. 012037.
- [113] C.-P. Georg, “The effect of the interbank network structure on contagion and common shocks,” Journal of Banking & Finance, vol. 37, no. 7, pp. 2216–2228, 2013.
- [114] S. Angilella and S. Mazzù, “A credit risk model with an automatic override for innovative small and medium-sized enterprises,” Journal of the Operational Research Society, vol. 70, pp. 1784 – 1800, 2019.
- [115] J. Zhang, T. Liu, Q. Li, and T. Zhang, “Research on computer aided risk evaluation model through fuzzy hierarchical analysis,” Journal of Physics: Conference Series, vol. 2033, 2021.
- [116] T. Wang, “Predicting private company failures in italy using financial and non‐financial information,” Australian Accounting Review, vol. 29, pp. 143–157, 2019.
- [117] I.-M. Haw, B. Y. Song, W. Tan, and W. Wang, “Bankruptcy, overlapping directors, and bank loan pricing,” Journal of Corporate Finance, vol. 71, p. 102097, 2021.
- [118] N. Wilson and A. Altanlar, “Company failure prediction with limited information: newly incorporated companies,” Journal of the Operational Research Society, vol. 65, pp. 252–264, 2014.
- [119] F. Ciampi, “Corporate governance characteristics and default prediction modeling for small enterprises. an empirical analysis of italian firms,” Journal of Business Research, vol. 68, no. 5, pp. 1012–1025, 5 2015.
- [120] C. Ham and K. Koharki, “The association between corporate general counsel and firm credit risk,” Journal of Accounting and Economics, vol. 61, no. 2-3, pp. 274–293, 2016.
- [121] D. Hackbarth, M. Jianjun, and E. Morellec, “Capital structure, credit risk, and macroeconomic conditions,” Journal of financial economics, vol. 82, no. 3, pp. 519–550, 12 2006.
- [122] S. Figini and P. Giudici, “Statistical merging of rating models,” Journal of the operational research society, vol. 62, no. 6, pp. 1067–1074, 2011.
- [123] J. Kang and C. E. Pflueger, “Inflation risk in corporate bonds,” The Journal of Finance, vol. 70, no. 1, pp. 115–162, 2015.
- [124] K. Giesecke, F. A. Longstaff, S. Schaefer, and I. Strebulaev, “Corporate bond default risk: A 150-year perspective,” Journal of financial Economics, vol. 102, no. 2, pp. 233–250, 11 2011.
- [125] T. Feng-Tse, L. Hsin-Min, and H. Mao-Wei, “The impact of news articles and corporate disclosure on credit risk valuation,” Journal of Banking & Finance, vol. 68, pp. 100–116, 7 2016.
- [126] R. Nyman, S. Kapadia, and D. Tuckett, “News and narratives in financial systems: exploiting big data for systemic risk assessment,” Journal of Economic Dynamics and Control, vol. 127, p. 104119, 2021.
- [127] E. I. Altman, G. Sabato, and N. Wilson, “The value of non-financial information in small and medium-sized enterprise risk management,” JOURNAL OF CREDIT RISK, vol. 6, no. 2, pp. 95–127, SUM 2010.
- [128] J. Donovan, J. Jennings, K. Koharki, and J. Lee, “Measuring credit risk using qualitative disclosure,” Review of Accounting Studies, vol. 26, no. 2, pp. 815–863, 1 2021.
- [129] T. A. Hassan, S. Hollander, L. van Lent, and A. Tahoun, “Firm-level political risk: Measurement and effects,” FEN: Political Risk & Corporate Finance (Topic), 2019.
- [130] M. J. Christopher, C. Mena, O. Khan, and O. Yurt, “Approaches to managing global sourcing risk,” Supply Chain Management, vol. 16, pp. 67–81, 2011.
- [131] I. Manuj and J. T. Mentzer, “Global supply chain risk management strategies,” International Journal of Physical Distribution & Logistics Management, vol. 38, pp. 192–223, 2008.
- [132] D. Liang, C.-C. Lu, C.-F. Tsai, and G.-A. Shih, “Financial ratios and corporate governance indicators in bankruptcy prediction: A comprehensive study,” European Journal of Operational Research, vol. 252, no. 2, pp. 561–572, 2016.
- [133] F. Shen, Y. Liu, R. Wang, and W. Zhou, “A dynamic financial distress forecast model with multiple forecast results under unbalanced data environment,” Knowledge-Based Systems, vol. 192, p. 105365, 2020.
- [134] L. Cleofas-Sánchez, V. García, A. Marqués, and J. S. Sánchez, “Financial distress prediction using the hybrid associative memory with translation,” Applied Soft Computing, vol. 44, pp. 144–152, 2016.
- [135] M. Gofman and Y. Wu, “Trade credit and profitability in production networks,” Journal of Financial Economics, vol. 143, no. 1, pp. 593–618, 2022.
- [136] C.-C. Chan, B.-H. Lin, Y.-H. Chang, and W.-C. Liao, “Does bank relationship matter for corporate risk-taking? evidence from listed firms in taiwan,” The North American Journal of Economics and Finance, vol. 26, pp. 323–338, 2013.
- [137] Y. Zhao, H. Du, Y. Liu, S. Wei, X. Chen, H. Feng, Q. Shuai, Q. Li, F. Zhuang, and G. Kou, “Stock movement prediction based on bi-typed and hybrid-relational market knowledge graph via dual attention networks,” arXiv preprint arXiv:2201.04965, 2022.
- [138] T. R. Berry-Stölzle and X. Jianren, “Enterprise risk management and the cost of capital,” Journal of Risk and Insurance, vol. 85, no. 1, pp. 159–201, 9 2018.
- [139] Z. You, Z. Li, X. Chi, W. Gang-Jin, and T. V. Nguyen, “Forecasting smes’ credit risk in supply chain finance with an enhanced hybrid ensemble machine learning approach,” International Journal of Production Economics, vol. 211, pp. 22–33, 5 2019.
- [140] C. Yin, C. Jiang, H. K. Jain, and Z. Wang, “Evaluating the credit risk of smes using legal judgments,” Decis. Support Syst., vol. 136, p. 113364, 2020.
- [141] M. Doumpos, K. Kosmidou, G. Baourakis, and C. Zopounidis, “Credit risk assessment using a multicriteria hierarchical discrimination approach: A comparative analysis,” European Journal of Operational Research, vol. 138, no. 2, pp. 392–412, 4 2002.
- [142] S. Westgaard and N. Van der Wijst, “Default probabilities in a corporate bank portfolio: A logistic model approach,” European journal of operational research, vol. 135, no. 2, pp. 338–349, 12 2001.
- [143] Y. Peng, G. Wang, G. Kou, and Y. Shi, “An empirical study of classification algorithm evaluation for financial risk prediction,” Applied Soft Computing, vol. 11, no. 2, pp. 2906–2915, 2011.
- [144] A. Huang and F. Wu, “Two-stage adaptive integration of multi-source heterogeneous data based on an improved random subspace and prediction of default risk of microcredit,” Neural Comput. Appl., vol. 33, pp. 4065–4075, 2021.
- [145] S. Jie, L. Jie, H. Fujita, and L. Hui, “Imbalanced enterprise credit evaluation with dte-sbd: Decision tree ensemble based on smote and bagging with differentiated sampling rates,” Information Sciences, vol. 425, pp. 76–91, 1 2018.
- [146] Z. You, X. Chi, W. Gang-Jin, and Y. Xin-Guo, “Comparison of individual, ensemble and integrated ensemble machine learning methods to predict china’s sme credit risk in supply chain finance,” Neural Computing and Applications, vol. 28, no. 1, pp. 41–50, 2017.
- [147] F. Barboza, H. Kimura, and E. Altman, “Machine learning models and bankruptcy prediction,” Expert Systems with Applications, vol. 83, pp. 405–417, 2017.
- [148] C.-F. Tsai, “Combining cluster analysis with classifier ensembles to predict financial distress,” Information Fusion, vol. 16, pp. 46–58, 2014.
- [149] D. Cheng, X. Wang, Y. Zhang, and L. Zhang, “Risk guarantee prediction in networked-loans,” in IJCAI International Joint Conference on Artificial Intelligence, 2020.
- [150] S. Smiti and M. Soui, “Bankruptcy prediction using deep learning approach based on borderline smote,” Information Systems Frontiers, vol. 22, no. 5, pp. 1067–1083, 2020.
- [151] M. Soui, S. Smiti, M. W. Mkaouer, and R. Ejbali, “Bankruptcy prediction using stacked auto-encoders,” Applied Artificial Intelligence, vol. 34, no. 1, pp. 80–100, 2020.
- [152] B. Wendong, X. Bingbing, S. Xiaoqian, X. Li, S. Huawei, and C. Xueqi, “Predicting the silent majority on graphs: Knowledge transferable graph neural network,” arXiv preprint arXiv:2302.00873, 2023.
- [153] G. P. Cachon and P. H. Zipkin, “Competitive and cooperative inventory policies in a two-stage supply chain,” Management science, vol. 45, no. 7, pp. 936–953, 7 1999.
- [154] M. Vassalou and X. Yuhang, “Default risk in equity returns,” The journal of finance, vol. 59, no. 2, pp. 831–868, 3 2004.
- [155] M. S. Beasley, R. Clune, and D. R. Hermanson, “Enterprise risk management: An empirical analysis of factors associated with the extent of implementation,” Journal of accounting and public policy, vol. 24, no. 6, pp. 521–531, 2005.
- [156] X. hong Chen, X. Wang, and D. D. Wu, “Credit risk measurement and early warning of smes: An empirical study of listed smes in china,” Decision Support System, vol. 49, pp. 301–310, 2010.
- [157] S. Angilella and S. Mazzù, “The financing of innovative smes: A multicriteria credit rating model,” European Journal of Operational Research, vol. 244, no. 2, pp. 540–554, 2015.
- [158] A. Maghyereh and H. Abdoh, “The effect of structural oil shocks on bank systemic risk in the gcc countries,” Energy Economics, vol. 103, p. 105568, 2021.
- [159] E. K. Laitinen and T. Laitinen, “Bankruptcy prediction: Application of the taylor’s expansion in logistic regression,” International review of financial analysis, vol. 9, no. 4, pp. 327–349, 2000.
- [160] K.-S. Shin and Y.-J. Lee, “A genetic algorithm application in bankruptcy prediction modeling,” Expert systems with applications, vol. 23, no. 3, pp. 321–328, 2002.
- [161] M.-J. Kim and D.-K. Kang, “Ensemble with neural networks for bankruptcy prediction,” Expert systems with applications, vol. 37, no. 4, pp. 3373–3379, 2010.
- [162] Z. Yang, W. You, and G. Ji, “Using partial least squares and support vector machines for bankruptcy prediction,” Expert Systems with Applications, vol. 38, no. 7, pp. 8336–8342, 2011.
- [163] M. L. Zorn, P. M. Norman, F. C. Butler, and M. S. Bhussar, “Cure or curse: Does downsizing increase the likelihood of bankruptcy?” Journal of Business Research, vol. 76, pp. 24–33, 2017.
- [164] J. Ai, P. L. Brockett, and W. Tianyang, “Optimal enterprise risk management and decision making with shared and dependent risks,” Journal of Risk and Insurance, vol. 84, no. 4, pp. 1127–1169, 5 2017.
- [165] M. S. Uddin, G. Chi, M. A. M. A. Janabi, and T. Habib, “Leveraging random forest in micro‐enterprises credit risk modelling for accuracy and interpretability,” International Journal of Finance & Economics, 2020.
- [166] K. Giesecke and S. Weber, “Cyclical correlations, credit contagion, and portfolio losses,” Journal of Banking & Finance, vol. 28, no. 12, pp. 3009–3036, 12 2004.
- [167] J. Sun and H. Li, “Data mining method for listed companies’ financial distress prediction,” Knowl. Based Syst., vol. 21, pp. 1–5, 2008.
- [168] H. Ahn and K.-j. Kim, “Bankruptcy prediction modeling with hybrid case-based reasoning and genetic algorithms approach,” Applied soft computing, vol. 9, no. 2, pp. 599–607, 2009.
- [169] C. You-Shyang and C. Ching-Hsue, “Hybrid models based on rough set classifiers for setting credit rating decision rules in the global banking industry,” Knowledge-Based Systems, vol. 39, pp. 224–239, 2 2013.
- [170] P. Du Jardin, “Bankruptcy prediction using terminal failure processes,” European Journal of Operational Research, vol. 242, no. 1, pp. 286–303, 2015.
- [171] A. Qazi, A. Dickson, J. Quigley, and B. Gaudenzi, “Supply chain risk network management: A bayesian belief network and expected utility based approach for managing supply chain risks,” International Journal of Production Economics, vol. 196, pp. 24–42, 2 2018.
- [172] C. Xiaohong, W. Xiaoding, and D. D. Wu, “Credit risk measurement and early warning of smes: An empirical study of listed smes in china,” Decision Support Systems, vol. 49, no. 3, pp. 301–310, 6 2010.
- [173] D. H. Oh and A. J. Patton, “Time-varying systemic risk: Evidence from a dynamic copula model of cds spreads,” Journal of Business & Economic Statistics, vol. 36, no. 2, pp. 181–195, 2018.
- [174] Y. Xu, Y. Xuan, and G. Zheng, “Internet searching and stock price crash risk: Evidence from a quasi-natural experiment,” Journal of Financial Economics, vol. 141, no. 1, pp. 255–275, 2021.
- [175] R. L. Wilson and R. Sharda, “Bankruptcy prediction using neural networks,” Decision support systems, vol. 11, no. 5, pp. 545–557, 6 1994.
- [176] M. Soui, S. Smiti, M. W. Mkaouer, and R. Ejbali, “Analyzing industry-level vulnerability by predicting financial bankruptcy,” Economic Inquiry, vol. 57, no. 4, pp. 2017–2034, 2019.
- [177] D. Delen, C. Kuzey, and A. Uyar, “Measuring firm performance using financial ratios: A decision tree approach,” Expert systems with applications, vol. 40, no. 10, pp. 3970–3983, 2013.
- [178] H.-L. Chen, B. Yang, G. Wang, J. Liu, X. Xu, S.-J. Wang, and D.-Y. Liu, “A novel bankruptcy prediction model based on an adaptive fuzzy k-nearest neighbor method,” Knowledge-Based Systems, vol. 24, no. 8, pp. 1348–1359, 2011.
- [179] W. Zhang, S. Yan, J. Li, X. Tian, and T. Yoshida, “Credit risk prediction of smes in supply chain finance by fusing demographic and behavioral data,” Transportation Research Part E: Logistics and Transportation Review, vol. 158, p. 102611, 2 2022.
- [180] Y. Ching-Chiang, L. Fengyi, and H. Chih-Yu, “A hybrid kmv model, random forests and rough set theory approach for credit rating,” Knowledge-Based Systems, vol. 33, pp. 166–172, 9 2012.
- [181] C. Chun-Ling, “Application of hybrid case-based reasoning for enhanced performance in bankruptcy prediction,” Information Sciences, vol. 236, pp. 174–185, 7 2013.
- [182] F. Habermann and F. B. Fischer, “Corporate social performance and the likelihood of bankruptcy: Evidence from a period of economic upswing,” Journal of Business Ethics, vol. 182, no. 1, pp. 243–259, 2023.
- [183] D. L. Eckles, R. E. Hoyt, and S. Miller, “The impact of enterprise risk management on the marginal cost of reducing risk: Evidence from the insurance industry,” Corporate Governance: Disclosure, 2014.
- [184] V. Agarwal and R. Taffler, “Comparing the performance of market-based and accounting-based bankruptcy prediction models,” Journal of Banking & Finance, vol. 32, no. 8, pp. 1541–1551, 2008.
- [185] M. Xu and C. Zhang, “Bankruptcy prediction: the case of japanese listed companies,” Review of accounting studies, vol. 14, no. 4, pp. 534–558, 2009.
- [186] R. E. Gropp, A. Guettler, and C. Gründl, “The impact of public guarantees on bank risk taking: Evidence from a natural experiment,” Banking & Financial Institutions eJournal, 2010.
- [187] R. C. Merton, “On the pricing of corporate debt: The risk structure of interest rates,” The Journal of finance, vol. 29, no. 2, pp. 449–470, 1974.
- [188] S. M. Bartram, G. W. Brown, and J. E. Hund, “Estimating systemic risk in the international financial system,” Journal of Financial Economics, vol. 86, no. 3, pp. 835–869, 2007.
- [189] H. B. Sosin, “On the valuation of federal loan guarantees to corporations,” Journal of Finance, vol. 35, pp. 1209–1221, 1980.
- [190] J. Hilscher and M. Wilson, “Credit ratings and credit risk: Is one measure enough?” Management science, vol. 63, no. 10, pp. 3414–3437, 10 2017.
- [191] A. Eisdorfer and P.-H. Hsu, “Innovate to survive: The effect of technology competition on corporate bankruptcy,” Financial Management, vol. 40, no. 4, pp. 1087–1117, 2011.
- [192] Y. Zhu, F. Yang, and W. Ye, “Financial contagion behavior analysis based on complex network approach,” Annals of Operations Research, vol. 268, pp. 93–111, 2018.
- [193] B. Wu and T. Duan, “Nonlinear dynamics characteristic of risk contagion in financial market based on agent modeling and complex network,” Complex., vol. 2019, pp. 2 946 018:1–2 946 018:12, 2019.
- [194] J. El Baz and S. Ruel, “Can supply chain risk management practices mitigate the disruption impacts on supply chains’ resilience and robustness? evidence from an empirical survey in a covid-19 outbreak era,” International Journal of Production Economics, vol. 233, p. 107972, 3 2021.
- [195] M. S. Munir, M. S. S. Jajja, K. A. Chatha, and S. Farooq, “Supply chain risk management and operational performance: The enabling role of supply chain integration,” International Journal of Production Economics, vol. 227, p. 107667, 2020.
- [196] M. S. S. Jajja, K. A. Chatha, and S. Farooq, “Impact of supply chain risk on agility performance: Mediating role of supply chain integration,” International Journal of Production Economics, vol. 205, pp. 118–138, 11 2018.
- [197] B. Imbierowicz and C. Rauch, “The relationship between liquidity risk and credit risk in banks,” Journal of Banking & Finance, vol. 40, pp. 242–256, 3 2014.
- [198] X. Brusset and C. Teller, “Supply chain capabilities, risks, and resilience,” International Journal of Production Economics, vol. 184, pp. 59–68, 2017.
- [199] M. Dietsch and J. Petey, “Should sme exposures be treated as retail or corporate exposures? a comparative analysis of default probabilities and asset correlations in french and german smes,” Journal of Banking & Finance, vol. 28, no. 4, pp. 773–788, 4 2004.
- [200] Y. I. Wang, J. Li, D. A. Wu, and R. Anupindi, “When ignorance is not bliss: An empirical analysis of sub-tier supply network structure on firm risk,” Ross: Technology & Operations (Topic), 2020.
- [201] T. Breuer, M. Jandavcka, J. Mencía, and M. Summer, “A systematic approach to multi-period stress testing of portfolio credit risk,” Journal of Banking & Finance, vol. 36, no. 2, pp. 332–340, 2 2012.
- [202] P. K. Coats and L. F. Fant, “Recognizing financial distress patterns using a neural network tool,” Financial Management, vol. 22, pp. 142–155, 1993.
- [203] F. J. L. Iturriaga and I. P. Sanz, “Bankruptcy visualization and prediction using neural networks: A study of us commercial banks,” Expert Systems with applications, vol. 42, no. 6, pp. 2857–2869, 2015.
- [204] M. Leshno and Y. Spector, “Neural network prediction analysis: The bankruptcy case,” Neurocomputing, vol. 10, pp. 125–147, 1996.
- [205] A. F. Atiya, “Bankruptcy prediction for credit risk using neural networks: A survey and new results,” IEEE Transactions on neural networks, vol. 12, no. 4, pp. 929–935, 2001.
- [206] K.-S. Shin, T. S. Lee, and H.-j. Kim, “An application of support vector machines in bankruptcy prediction model,” Expert systems with applications, vol. 28, no. 1, pp. 127–135, 2005.
- [207] B. E. Erdogan, “Prediction of bankruptcy using support vector machines: an application to bank bankruptcy,” Journal of Statistical Computation and Simulation, vol. 83, no. 8, pp. 1543–1555, 2013.
- [208] L. Zhou, K. K. Lai, and J. Yen, “Bankruptcy prediction using svm models with a new approach to combine features selection and parameter optimisation,” International Journal of Systems Science, vol. 45, no. 3, pp. 241–253, 2014.
- [209] J. H. Min and Y.-C. Lee, “Bankruptcy prediction using support vector machine with optimal choice of kernel function parameters,” Expert systems with applications, vol. 28, no. 4, pp. 603–614, 2005.
- [210] T. K. Sung, N. Chang, and G. Lee, “Dynamics of modeling in data mining: interpretive approach to bankruptcy prediction,” Journal of management information systems, vol. 16, no. 1, pp. 63–85, 1999.
- [211] S. Cho, H. Hong, and B.-C. Ha, “A hybrid approach based on the combination of variable selection using decision trees and case-based reasoning using the mahalanobis distance: For bankruptcy prediction,” Expert Systems with Applications, vol. 37, no. 4, pp. 3482–3488, 2010.
- [212] S. Y. Kim and A. Upneja, “Predicting restaurant financial distress using decision tree and adaboosted decision tree models,” Economic Modelling, vol. 36, pp. 354–362, 2014.
- [213] W. Zhu, T. Zhang, Y. Wu, S. Li, and Z. Li, “Research on optimization of an enterprise financial risk early warning method based on ds-rf model—taking js agricultural reclamation group as an example,” International Review of Financial Analysis, p. 102140, 2022.
- [214] S. H. Cho and K.-s. Shin, “Feature-weighted counterfactual-based explanation for bankruptcy prediction,” Expert Systems with Applications, vol. 216, p. 119390, 2023.
- [215] T. E. McKee and T. Lensberg, “Genetic programming and rough sets: A hybrid approach to bankruptcy classification,” European journal of operational research, vol. 138, no. 2, pp. 436–451, 2002.
- [216] C.-C. Yeh, D.-J. Chi, and M.-F. Hsu, “A hybrid approach of dea, rough set and support vector machines for business failure prediction,” Expert Systems with Applications, vol. 37, no. 2, pp. 1535–1541, 3 2010.
- [217] A. Tsakonas, G. Dounias, M. Doumpos, and C. Zopounidis, “Bankruptcy prediction with neural logic networks by means of grammar-guided genetic programming,” Expert Systems with Applications, vol. 30, no. 3, pp. 449–461, 2006.
- [218] P. Du Jardin, “Forecasting bankruptcy using biclustering and neural network-based ensembles,” Annals of Operations Research, vol. 299, no. 1, pp. 531–566, 2021.
- [219] K. Muthukumaran and K. Hariharanath, “Deep learning enabled financial crisis prediction model for small-medium sized industries.” Intelligent Automation & Soft Computing, vol. 35, no. 1, 2023.
- [220] P. Dai Pra, W. J. Runggaldier, E. Sartori, and M. Tolotti, “Large portfolio losses: A dynamic contagion model,” The Annals of Applied Probability, vol. 19, no. 1, pp. 347–394, 2 2009.
- [221] W.-S. Chen and Y.-K. Du, “Using neural networks and data mining techniques for the financial distress prediction model,” Expert Syst. Appl., vol. 36, pp. 4075–4086, 2009.
- [222] J. Sun and H. Li, “Financial distress prediction based on serial combination of multiple classifiers,” Expert Syst. Appl., vol. 36, pp. 8659–8666, 2009.
- [223] C. Hung and J.-H. Chen, “A selective ensemble based on expected probabilities for bankruptcy prediction,” Expert Syst. Appl., vol. 36, pp. 5297–5303, 2009.
- [224] C.-B. Cheng, C.-L. Chen, and C.-J. Fu, “Financial distress prediction by a radial basis function network with logit analysis learning,” Comput. Math. Appl., vol. 51, pp. 579–588, 2006.
- [225] P. K. Tarei, J. J. Thakkar, and B. Nag, “A hybrid approach for quantifying supply chain risk and prioritizing the risk drivers,” Journal of Manufacturing Technology Management, vol. 29, pp. 533–569, 2018.
- [226] B. Gao, “The use of machine learning combined with data mining technology in financial risk prevention,” Computational Economics, pp. 1–21, 2021.
- [227] A. Huang, L. Qiu, and Z. Li, “Applying deep learning method in tvp-var model under systematic financial risk monitoring and early warning,” Journal of Computational and Applied Mathematics, vol. 382, p. 113065, 2021.
- [228] M. Yildirim, F. Y. Okay, and S. Özdemir, “Big data analytics for default prediction using graph theory,” Expert Syst. Appl., vol. 176, p. 114840, 2021.
- [229] J. Sun and H. Li, “Listed companies’ financial distress prediction based on weighted majority voting combination of multiple classifiers,” Expert Syst. Appl., vol. 35, pp. 818–827, 2008.
- [230] R. A. Jarrow and S. M. Turnbull, “Pricing derivatives on financial securities subject to credit risk,” The journal of finance, vol. 50, no. 1, pp. 53–85, 3 1995.
- [231] M. H. Lubatkin, Z. Simsek, Y. Ling, and J. F. Veiga, “Ambidexterity and performance in small-to medium-sized firms: The pivotal role of top management team behavioral integration,” Journal of management, vol. 32, no. 5, pp. 646–672, 2006.
- [232] J. Y. Campbell, J. Hilscher, and J. Szilagyi, “In search of distress risk,” The Journal of Finance, vol. 63, no. 6, pp. 2899–2939, 2008.
- [233] N. Rosenbusch, J. Brinckmann, and A. Bausch, “Is innovation always beneficial? a meta-analysis of the relationship between innovation and performance in smes,” Journal of business Venturing, vol. 26, no. 4, pp. 441–457, 2011.
- [234] R. A. Jarrow, D. Lando, and S. M. Turnbull, “A markov model for the term structure of credit risk spreads,” The review of financial studies, vol. 10, no. 2, pp. 481–523, 4 1997.
- [235] C. W. Craighead, J. Blackhurst, M. J. Rungtusanatham, and R. B. Handfield, “The severity of supply chain disruptions: design characteristics and mitigation capabilities,” Decision sciences, vol. 38, no. 1, pp. 131–156, 3 2007.
- [236] M. D. Odom and R. Sharda, “A neural network model for bankruptcy prediction,” in Proceedings of IJCNN. IEEE, 1990, pp. 163–168.
- [237] M. J. Maloni and M. E. Brown, “Corporate social responsibility in the supply chain: an application in the food industry,” Journal of business ethics, vol. 68, no. 1, pp. 35–52, 9 2006.
- [238] B. Baesens, T. Van Gestel, S. Viaene, M. Stepanova, J. Suykens, and J. Vanthienen, “Benchmarking state-of-the-art classification algorithms for credit scoring,” Journal of the operational research society, vol. 54, no. 6, pp. 627–635, 6 2003.
- [239] C. S. Tang and B. Tomlin, “The power of flexibility for mitigating supply chain risks,” International Journal of Production Economics, vol. 116, pp. 12–27, 2008.
- [240] E. I. Altman and G. Sabato, “Modelling credit risk for smes: Evidence from the u.s. market,” Monetary Economics, 2007.
- [241] R. Albuquerque, Y. Koskinen, and C. Zhang, “Corporate social responsibility and firm risk: Theory and empirical evidence,” Social Responsibility in Production & Supply Chain Management eJournal, 2019.
- [242] G. Kou, Y. Peng, and G. Wang, “Evaluation of clustering algorithms for financial risk analysis using mcdm methods,” Information sciences, vol. 275, pp. 1–12, 2014.
- [243] H. Zhiguo and X. Wei, “Rollover risk and credit risk,” The Journal of Finance, vol. 67, no. 2, pp. 391–430, 3 2012.
- [244] P. E. Mistrulli, “Assessing financial contagion in the interbank market: Maximum entropy versus observed interbank lending patterns,” Journal of Banking & Finance, vol. 35, no. 5, pp. 1114–1127, 2011.
- [245] B. Chae, “Insights from hashtag #supplychain and twitter analytics: Considering twitter and twitter data for supply chain practice and research,” International Journal of Production Economics, vol. 165, pp. 247–259, 2015.
- [246] J. Ericsson, K. Jacobs, and R. Oviedo, “The determinants of credit default swap premia,” Journal of financial and quantitative analysis, vol. 44, no. 1, pp. 109–132, 2 2009.
- [247] D. Cheng, Y. Tu, Z.-W. Ma, Z. Niu, and L. Zhang, “Risk assessment for networked-guarantee loans using high-order graph attention representation,” in Proceedings of IJCAI, 2019, pp. 5822–5828.
- [248] J. Sun, H. Fujita, P. Chen, and H. Li, “Dynamic financial distress prediction with concept drift based on time weighting combined with adaboost support vector machine ensemble,” Knowledge-Based Systems, vol. 120, pp. 4–14, 2017.
- [249] S. Hochreiter and J. Schmidhuber, “Long short-term memory,” Neural computation, vol. 9, no. 8, pp. 1735–1780, 1997.
- [250] A. Vaswani, N. Shazeer, N. Parmar, J. Uszkoreit, L. Jones, A. N. Gomez, L. Kaiser, and I. Polosukhin, “Attention is all you need,” Advances in neural information processing systems, vol. 30, 2017.
- [251] K. Simonyan, A. Vedaldi, and A. Zisserman, “Deep inside convolutional networks: Visualising image classification models and saliency maps,” arXiv preprint arXiv:1312.6034, 2013.
- [252] F. Yang, S. K. Pentyala, S. Mohseni, M. Du, H. Yuan, R. Linder, E. D. Ragan, S. Ji, and X. Hu, “Xfake: Explainable fake news detector with visualizations,” in WWW, 2019, pp. 3600–3604.
- [253] H. Yuan, H. Yu, J. Wang, K. Li, and S. Ji, “On explainability of graph neural networks via subgraph explorations,” in ICML, 2021, pp. 12 241–12 252.
- [254] X. Wang, Y. Wu, A. Zhang, F. Feng, X. He, and T.-S. Chua, “Reinforced causal explainer for graph neural networks,” IEEE Transactions on Pattern Analysis and Machine Intelligence, 2022.
- [255] R. Li, Y. Cao, Q. Zhu, G. Bi, F. Fang, Y. Liu, and Q. Li, “How does knowledge graph embedding extrapolate to unseen data: a semantic evidence view,” in AAAI, 2022, pp. 5781–5791.
- [256] Z. Zhang, Q. Liu, H. Wang, C. Lu, and C. Lee, “Protgnn: Towards self-explaining graph neural networks,” in AAAI, 2022, pp. 9127–9135.
![[Uncaptioned image]](/html/2211.14997/assets/x4.png) |
Yu Zhao received the B.S. degree from Southwest Jiaotong University in 2006, and the M.S. and Ph.D. degrees from the Beijing University of Posts and Telecommunications in 2011 and 2017, respectively. He is a Professor at the Southwestern University of Finance and Economics. His current research interests include artificial general intelligence, natural language processing, knowledge graph, fintech. He has authored more than 30 papers including IEEE TKDE, IEEE TNNLS, IEEE TMC, IEEE TMM, ACL, ICME, etc. |
![[Uncaptioned image]](/html/2211.14997/assets/x5.png) |
Huaming Du received his M.S. degree from China University of Petroleum, Beijing, China, in 2018. He is currently pursuing the Ph.D. degree in Southwestern University of Finance and Economics, Chengdu, China. His research interests include Fintech, reinforcement learning, and graph representation learning. He has published papers in top journals such as IEEE TKDE, IEEE TCSVT. |
![[Uncaptioned image]](/html/2211.14997/assets/x6.png) |
Qing Li received his PhD degree from Kumoh National Institute of Technology in February of 2005, Korea, and his M.S. and B.S. degrees from Harbin Engineering University, China. He is a postdoctoral researcher at Arizona State University and the Information & Communications University of Korea. He is a professor at Southwestern University of Finance and Economics, China. His research interests include natural language processing, FinTech. He has published more than 70 papers in the prestigious refereed conferences and journals, such as IEEE TKDE, ACM TOIS, AAAI, SIGIR, ACL, WWW, etc. |
![[Uncaptioned image]](/html/2211.14997/assets/x7.png) |
Fuzhen Zhuang received the PhD degree in computer science from the Institute of Computing Technology, Chinese Academy of Sciences. He is currently a full Professor in Institute of Artificial Intelligence, Beihang University., Beijing 100191, China. His research interests include Machine Learning and Data Mining, including Transfer Learning, Multi-task Learning, Multi-view Learning and Recommendation Systems. He has published more than 100 papers in the prestigious refereed conferences and journals, such as KDD, WWW, SIGIR, ICDE, IJCAI, AAAI, EMNLP, Nature Communications, IEEE TKDE, ACM TKDD, IEEE T-CYB, IEEE TNNLS, ACM TIST, etc. |
![[Uncaptioned image]](/html/2211.14997/assets/x8.png) |
Ji Liu received the B.S. degree from the University of Science and Technology of China, Hefei, China, in 2005, the master’s degree from Arizona State University, Tempe, AZ, USA, in 2010, and the Ph.D. degree from the University of Wisconsin–Madison, Madison, WI, USA, in 2014. He is currently an Assistant Professor of computer science, electrical and computer engineering with the Goergen Institute for Data Science, University of Rochester (UR), Rochester, NY, USA, where he created the Machine Learning and Optimization Group. He has authored more than 70 papers in top journals and conferences including JMLR, TPAMI, TNNLS, TKDD, NIPS, ICML, SIGKDD, ICCV, and CVPR. Dr. Liu was a recipient of the Award of Best Paper Honorable Mention at SIGKDD 2010, the Award of Best Student Paper Award at UAI 2015, and the IBM Faculty Award. He is named one MIT technology review’s “35 innovators under 35 in China.” |
![[Uncaptioned image]](/html/2211.14997/assets/x9.png) |
Gang Kou is a Distinguished Professor of Chang Jiang Scholars Program in Southwestern University of Finance and Economics, managing editor of International Journal of Information Technology & Decision Making (SCI) and managing editor-in-chief of Financial Innovation (SSCI). He is also editors for other journals, such as: Decision Support Systems, and European Journal of Operational Research. Previously, he was a professor of School of Management and Economics, University of Electronic Science and Technology of China, and a research scientist in Thomson Co., R & D. He received his Ph.D. in Information Technology from the College of Information Science & Technology, Univ. of Nebraska at Omaha; Master degree in Dept of Computer Science, Univ. of Nebraska at Omaha; and B.S. degree in Department of Physics, Tsinghua University, China. He has published more than 100 papers in various peer-reviewed journals. Gang Kou’s h-index is 57 and his papers have been cited for more than 10000 times. He is listed as the Highly Cited Researcher by Clarivate Analytics (Web of Science). |