Investigating the effect of electronic correlation on transport properties and phononic states of Vanadium
Abstract
In the present work, we have tried to investigate the importance of electronic correlation on transport properties and phononic states of Vanadium (V). The temperature-dependent electrical resistivity () and electronic part of thermal conductivity () due to electron-electron interactions (EEIs) and electron-phonon interactions (EPIs) are computed. The values of due to EEIs are found to be extremely small in comparison to due to EPIs. For instance, at 300 K, the calculated value of due to EEIs (EPIs) is 0.859 ( 0.20) m. The magnitudes of due to EPIs are found to be in good agreement with the experimental results. These observations indicate the negligible importance of EEIs to these quantities for V. However, at 300 K, the value of Seebeck coefficient () at DFT+DMFT level ( -0.547 VK-1) is found to be entirely different than at DFT level ( VK-1). Also, the DFT+DMFT value of at 300 K is in good match with the available experimental data (-1.06 VK-1[1], 1.0 VK-1[2]). Apart from this, the study of phononic states at DFT and DFT+DMFT level is performed. The obtained phononic band structure and phonon DOS at DFT+DMFT differ to a good extent from that at DFT. The maximum energy of phononic state obtained at DFT (DFT+DMFT) is 33.83 ( 35.15) meV, where the result of DFT+DMFT is obtained more closer to the experimental data (35.15[3], 36.98[4] & 41.77[5] meV). These results highlight the importance of electronic correlation on & phononic states of simple correlated V metal.
I Introduction
In the past few years, physicists have studied a lot about the effect of electronic correlation on various transport properties of materials[6, 7, 8, 9]. The strength of electronic correlation in a material depends upon ratio, where is on-site Coulomb interaction and is hopping integral. Here, is related to band width (). Based on these parameters, materials are usually classified as weakly (), moderately () and strongly correlated () systems[10, 11]. A wide range of novel quantum phenomena arise due to the electronic correlation of and electrons. Some of these are superconductivity[12], topological properties[13], spin and cluster-glasses[14], Kondo effect[15], etc. Thus, the theoretical study of the effect of electronic correlation has generated great interest in the physics community[16, 17]. However, theoretical developments for studying these systems are still a challenging task. This is because the many-body Hamiltonian equations that define the system are not exactly solvable using the existing theoretical approach. In the case of correlated electron systems (CESs), dynamical mean field theory (DMFT)[18, 19] is successful in capturing the electronic correlation up to a great extent.
With more than fifty years of research, transition metals have attracted tremendous interest in the scientific community for their fascinating behaviour[20, 21]. Recent studies on Vanadium (V) categorise it as a moderately correlated electron system[22]. Thus, it would be a suitable candidate for studying the effect of electronic correlation on various transport properties and phononic states. Also, Belozerov et al.[23] have recently studied electronic correlation and its effect on magnetic properties of V using DFT+DMFT method. Their results indicate that V shows Pauli paramagnetism at low temperatures, while it follows the Curie-Weiss law at higher temperatures. Also, they reported the quasiparticle mass enhancement factor of state to be 1.4 at eV. Our result of (), i.e. 1.14 (1.12) at eV using the DFT method is in a good agreement with their results. Furthermore, Savrasov et al.[24] have studied the electrical resistivity () and electronic part of thermal conductivity () of V due to electron-phonon interactions (EPIs) using density-functional theory (DFT) method. In this work, they have also compared their theoretical results with an experimental data set, which are in a good match[25]. However, at present, there are several experimental results available corresponding to [26, 27, 28, 29]. But these data differ from each other to a good extent.[26, 27, 28, 29]. So it becomes a dilemma as to which experimental data is more accurate. In such circumstances, even the theoretical data obtained at the DFT level is questionable. Thus, it becomes necessary to investigate the of V at DFT+DMFT level to verify whether the electronic correlation affects it or not. According to the Wiedemann-Franz law, of a material is directly related to [12]. Thus, the effect of correlation on is expected to be similar to . Since, the value of for V is eV, which lies in the range of moderately CESs[22]. So, DFT may not truly capture the electronic correlation in this case. Sihi et al.[22] have studied the photoemission spectra (PES) of V qualitatively using different theoretical approaches. In this work, it was shown that the qualitative features of PES, near the Fermi level, obtained through DFT and DFT+DMFT methods are in good agreement with the experimental data. However, the quantitative comparison of PES at both the levels is still lacking in their work. Furthermore, mere matching of PES does not guarantee that the features of states and their distributions around the Fermi energy will be same at DFT and DFT+DMFT levels. It is important to mention here that the transport properties are highly dependent on the states near the Fermi level. Thus, a comparative study of temperature-dependent transport properties of V using DFT and DFT+DMFT approach is very much needed to explore the importance of electronic correlation on these properties of the material.
Phonons play essential roles in deciding several material properties such as thermal and electronic transport, thermodynamics, and structural stability. The phonon calculations are usually performed for bulk materials through the DFT method, which provides good results for most of the time[30, 31]. However, generally used exchange-correlation functionals such as LDA[32] and GGA[33] do not properly incorporate the effect of electronic correlation. While tackling these problems, DFT+DMFT generally seems to offer a potential path for a better understanding of the effect of electronic correlation. Recently, Khanal et al.[34] studied the phononic states of iron superconductor FeSe using the DFT+DMFT approach. Their work highlights the effect of electronic correlations on phonon frequencies. Also, in a recent work, Koçer et al.[35] have provided an efficient and general approach for the phonon calculations by using DFT+DMFT method. In their work, they have calculated the lattice dynamics properties of Fe, NiO, MnO, and SrVO3 using DFT+DMFT approach. Furthermore, using DFT+DMFT approach, the phonon spectra of plutonium and iron were also studied by several authors[36, 37, 38, 39]. A key question that we would like to address is whether or not the electronic correlation affects the phononic states of V. This study would be helpful in further exploring the effects of electronic correlation on properties of V.
In the present work, an effort has been made to explore the extent to which electronic correlation affects the transport properties and phononic states of V. With this motivation, the contribution to the values of temperature-dependent and due to electron-electron interactions (EEIs) and electron-phonon interactions (EPIs) are calculated. A comparative analysis of both these contributions to and is done. In addition to this, the study of temperature-dependent Seebeck coefficient is carried out within the temperature range of K using DFT+DMFT method. Also, the values of are computed at 300 K via DFT method. Apart from transport properties, the study of phononic states is carried out at DFT and DFT+DMFT levels. In this regard, the calculations of phonon dispersion curve and phonon DOS are performed using both DFT and DFT+DMFT methods. The comparative study of the result obtained using both the approaches highlights the importance of electronic correlation on the and phononic states of V.
| -mesh | (*m-1) | (VK-1) | (Wm-1K |
|---|---|---|---|
| () | 1256.55 | 12.975 | 6481.646 |
| () | 1114.97 | 16.827 | 7026.405 |
| () | 1139.33 | -4.269 | 6453.981 |
| () | 1144.65 | 0.205 | 7873.407 |
| () | 1236.16 | 4.696 | 7849.347 |
| () | 1453.71 | -10.459 | 8587.235 |
| () | 1084.86 | 1.404 | 7225.235 |
| () | 1158.14 | -1.108 | 7236.168 |
| () | 1104.06 | 0.359 | 7395.98 |
| () | 1163.52 | -0.547 | 7686.932 |
II Computational details
The density functional theory (DFT) based calculations are carried out using WIEN2k package[40]. The non-magnetic calculations of electronic and phononic properties of Vanadium (V) are performed using full-potential linearized augmented plane wave (FP-LAPW) method. Local density approximation (LDA)[32] is used as exchange-correlation functional in these calculations. The space group and lattice constant for V are taken as Imm and 3.024 Å, respectively[22]. Furthermore, the Wyckoff position and the muffin-tin sphere radius for V atom are taken as and 2.0 Bohr, respectively. The self-consistent ground state energy calculations are performed over a k-mesh size of 101010 with the charge convergence limit set to Ry/Bohr. The temperature-dependent DFT+dynamical mean field theory (DMFT) computations are carried out using embedded DMFT functional (eDMFTF) code[19], which is interfaced with WIEN2k package. The ground state energy is computed in a self-consistent way over a k-mesh size of 666666. For these calculations, the energy convergence limit and the charge convergence limit are set to Ry/Bohr and Ry/Bohr, respectively. The value of eV is taken from the literature[22] and the value of eV is calculated by Yukawa screening method[41]. The exact double counting method is used to avoid the double-counting issue[42]. The continuous time quantum Monte Carlo (CTQMC) method is used as an impurity solver in these calculations[43]. This CTQMC method is implemented in the eDMFTF code[19]. Also, the maximum entropy analytical continuation method is used to obtain the spectral function in real axis[42]. Density of states (DOS) and eigenvalues are calculated over a dense k-mesh size of 300300300. These eigenvalues are further used to calculate the electronic transport properties using TRACK code[44], which is interfaced with eDMFTF code. In the DFT+DMFT calculations, the Fermi energy is found to be 7.9911 eV. Using this Fermi energy, the velocity matrix is calculated via optic module of WIEN2k package[40] over a dense k-mesh size of 300300300.
It is important to mention here that before computing the temperature-dependent transport properties, a k-mesh convergence test has been performed over these properties at 300 K. Corresponding data is mentioned in Table 1. The DFT and DFT+DMFT based phonon calculations are carried out for a 222 supercell using PHONOPY package[30]. The DFT based force calculations are performed over a k-mesh size of 121212 using WIEN2k package with the force convergence limit set to Ry/Bohr. Furthermore, DMFT based force calculations are performed at 300 K using eDMFTF code.
The calculations of transport properties due to electron-phonon interactions (EPIs) are carried out using Abinit code[45]. These computations are performed using density functional perturbation theory (DFPT) method[46]. The projector augmented wave (PAW)[47] pseudopotential is adopted to obtain transport properties. These calculations are performed over a k-mesh size of 424242 and q-mesh size of 666. The energy cutoff parameter is set to 30 Hartree.
III Results and Discussion
III.1 Transport properties
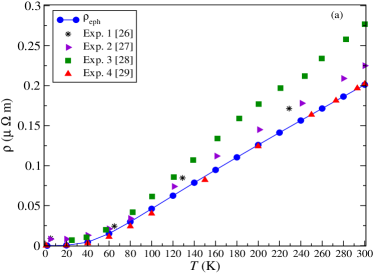
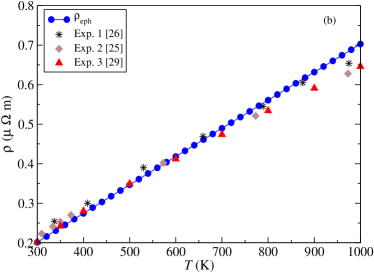
The electrical resistivity () is an important transport property that aids in determining the practical applications of materials. The calculations of temperature () dependent due to electron-phonon interactions (EPIs) are carried out within the temperature range of K. The experimental results are available in two different temperature ranges ( K and K). So the calculated results are divided into two parts for the purpose of comparison with the available experimental data. Corresponding plots are shown in Fig(s). 1(a) and 1(b), respectively. In both the Fig(s)., it is seen that the values of increase with the rise in . The magnitude of due to EPIs () is obtained as 0.42 m at 20 K, which gets raised to 0.20 m at 300 K. Furthermore, the magnitude of at 1000 K is found to be 0.7029 m. The obtained results are also compared with the available experimental data[25, 26, 27, 28, 29]. For a better understanding of the effect of electronic correlation on of the material, the temperature-dependent due to electron-electron interactions (EEIs) are also calculated using DFT+DMFT method. Corresponding results are mentioned in Table 2. The magnitude of due to EEIs () is obtained as 0.9436 m at 100 K, which gets raised to 0.15 m at 1000 K. It is seen from the table and Fig(s). 1 that, within the given temperature range, at any value of , the magnitude of is even less than of the value of . The possible reason behind this may be the extremely large order of electron-electron lifetime () in comparison to that of electron-phonon lifetime (). The calculated order of and are and seconds, respectively.
| (K) | (*m) | (Wm-1K-1) | (V2K-2) |
|---|---|---|---|
| 100 | 0.09436 | 2728 | 0.026 |
| 200 | 0.0856 | 4360 | 0.019 |
| 300 | 0.0859 | 7687 | 0.022 |
| 400 | 0.0895 | 7690 | 0.017 |
| 500 | 0.0965 | 8889 | 0.017 |
| 600 | 0.1054 | 10245 | 0.018 |
| 700 | 0.1151 | 11706 | 0.019 |
| 800 | 0.1684 | 13158 | 0.028 |
| 900 | 0.1435 | 10065 | 0.016 |
| 1000 | 0.15 | 15869 | 0.024 |
Apart from the slight deviations, the calculated values of within the temperature range K, are found to be in a good match with the available experimental data in literature[25, 26, 27, 28, 29]. Furthermore, Table 2 shows that the magnitudes of increase with the rise in temperature, except for some values of . The obtained value of at 100 K is greater than the value of at 200 K. This is possibly because in the DFT+DMFT calculations, eigenvalues are computed using maximum entropy method[42] which may not provide accurate results at lower values of . As these eigenvalues are involved in calculating , high fluctuations are expected at small values of . Apart from the EEIs, EPIs greatly affect the values of as seen in Fig. 1. As the phonons cause the scattering of electrons, the increase in number of phonons will enhance the scattering process. This will result in the increase in values of with the rise in . The discussion of the effect of EPIs on suggests that the values of must increase with the rise in . The results obtained in Fig. 1 are in accordance with this. As already discussed, the contribution of EEIs to the values of is extremely small in comparison to that of EPIs at any given . This indicates that, within the given temperature range, the effect of EEIs is insignificant in deciding the value of . This further suggests that electronic correlation is negligibly importance to the values of of V within the given temperature range.
The importance of electronic correlation on the electronic part of thermal conductivity () of the material is also investigated. In light of this, the calculations of temperature-dependent due to EPIs () are performed within the temperature range of K and the results are depicted in Fig. 2. It is seen from the figure that the values of decrease with the rise in . The magnitude of is found to be 280.2 Wm-1K-1 at K which gets decreased to 35.9 Wm-1K-1 at K. The figure also shows the comparison between the obtained results and available experimental data[25]. In addition to this, the thermal conductivity due to EEIs () are also calculated within the temperature range of K. The obtained results are mentioned in Table 2. It is found from the table that values of increase with the rise in . The magnitude of is found to be 2728 Wm-1K-1 at K which gets increased to 15869 Wm-1K-1 at K.
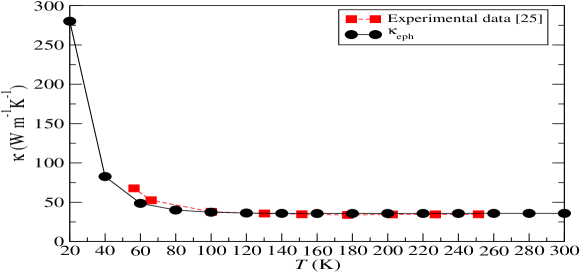
The calculated value of is found to be very high in comparison to the experimental , which is shown in Fig. 2. This may be due to the fact that in the present calculation, only EEIs are involved for which is extremely high. However, in real, the materials possess all possible interactions. According to Matthiessen’s rule, the combined effect of all the possible interactions reduces the value of [12]. Thus, it is expected that calculated values will be higher than experimental results. The results obtained in Fig. 2 are in accordance with this discussion. According to Wiedemann-Franz law[12], it is well known that depends on the and [12]. As already discussed, the effect of electronic correlation on is extremely small. This suggests that the effect of electronic correlation on will also be negligible. It is also important to note here that the calculated values of the is in good match with the available experimental data within the given temperature range[25]. This generally suggests that EEIs are insignificant in deciding the values of . This further implies that electronic correlation is negligibly important to the values of for V.
At any given value of , and are related to one another through Lorenz number . This is popularly known as Wiedemann-Franz law[12]. The calculation of for V in the given temperature range is carried out and corresponding results are mentioned in Table 2. The obtained order of very well matches with the typical order of for the metallic system[12]. Along with , the effect of electronic correlation on the Seebeck coefficient () is also studied.
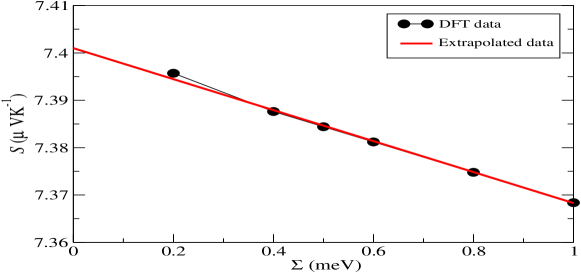
The calculation of at 300 K using the DFT approach is carried out. In this direction, the values are computed at different magnitudes of . Corresponding plot is shown in Fig. 3. Using the extrapolation method, the value of has been obtained at , which is equal to VK-1. This corresponds to real DFT value at 300 K. The obtained data for at DFT level is very off from the available experimental results[1, 2]. Thus, it would be interesting to verify if the electronic correlation is reponsible for this inconsistency in DFT data with the experimental results. In light of this, the study of temperature-dependent is carried out at DFT+DMFT level within the temperature range K. In these calculations, it is found that the values of are highly sensitive to the size of -mesh used. So, to check the convergence of with respect to -point, the calculations of at 300 K with different sizes of -mesh are carried out. This is done to obtain an optimized size of -mesh for studying the temperature-dependent behaviour of of the material. The values of corresponding to different sizes of -mesh are mentioned in Table 1. For the larger size of -mesh, it is found that there is a small fluctuation in the calculated value of . At K, the values of are obtained as , , and VK-1 corresponding to the -mesh size of (), (), () and (), respectively. Taking the absolute values of corresponding to all four -meshes yields the mean value of VK-1. The obtained mean value is found to be in good agreement with the experimentally reported data[1, 2] at 300 K with an error bar VK-1. Thus, for studying the temperature-dependent behaviour of , optimized size of -mesh is chosen as (). Having found this, the calculations of temperature-dependent over the -mesh size of () are carried out. The obtained results are mentioned in Table 3. It can be seen from table that for K, the values of are positive and its magnitude decreases with the rise in . However, for K, the values of are negative and its magnitude increases with the rise in . At 100 K, the value of is found to be VK-1 which gradually changes to VK-1 at 1000 K. It is important to note that the results show the change in sign of as increases from 200 to 300 K.
| (K) | (VK-1) | (VK-1) | (VK-1) |
|---|---|---|---|
| 100 | 2.82[48], 1.02[1] | - | |
| 200 | 0.41[48], 0.27[1], 0.86[2], 0.6[2] | 6.28[44] | |
| 300 | -1.06[1], 1.0[2] | 5.95[44] | |
| 400 | - | 1.84[44] | |
| 500 | - | - | |
| 600 | - | - | |
| 700 | - | - | |
| 800 | - | - | |
| 900 | - | - | |
| 1000 | - | - |
From Table 3, it is found that for K, the values of are positive. Hence, below room temperature, this material must show -type behaviour. However, at higher values of ( K), it is found that the sign of is negative. This shows that for values of K, the material must exhibit -type behaviour. From the table, at 100 and 200 K, it is also found that the values of is not in good match with the experimental results. The possible reason for this may be that the maximum entropy method is not efficient at lower values of . Hence, for calculating at small values of , one must use a dense -mesh to obtain reasonable results. However, in the present work, due to higher computational cost, the calculations are not performed for a -mesh size greater than (). Furthermore, full type Coulomb interaction is used to calculate the values of . Sihi et al.[44] have also calculated the values of using Ising type of Coulomb interaction. But, in comparison to their data, the results of present work give better match with the experimental results, which is depicted in Table 3. This indicates that for V, full type Coulomb interaction is a better choice to calculate the values of .
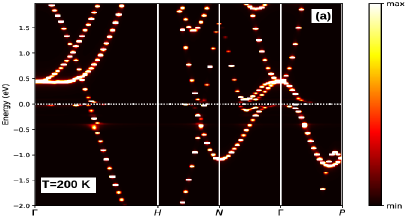
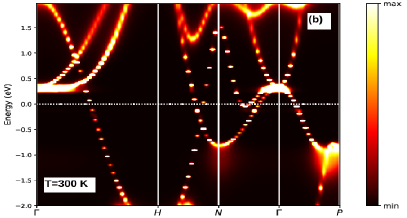
In order to understand the change in sign of between the values at 200 K and 300 K, the electronic dispersion curves are plotted at these temperatures, which are shown in Fig(s). 4(a) and 4(b), respectively. It is seen from Fig. 4(a), near the Fermi level in the high symmetric directions , the size of hole pocket is larger than the electron pocket. Thus, at 200 K, the concentration of holes is expected to be higher than the concentration of electrons at the Fermi level. In addition to this, it is seen that hole pocket is flatter in comparison to that of electron pocket. This generally suggests that the effective mass () for holes will be higher in comparison to that for electrons. In case of solids, is directly proportional to and inversely proportional to [49]. The effect of seems to dominate over the effect of carrier concentration in deciding the value of . This results in the positive value of at 200 K. Furthermore, in Fig. 4(b), it is seen that near the Fermi level, there is only the presence of an electron pocket along direction. Thus, it is expected that value of should be negative, which is depicted in Table 3.
It is seen from the above discussion that shifting from DFT to the DFT+DMFT approach, the value of changes a lot. Moreover, unlike the DFT results, the value of at 300 K obtained using DFT+DMFT methods gives a very good match with the experimental data. This shows that electronic correlation plays a very important role in deciding the value of in case of V which is a moderately CESs.
III.2 Phonon dispersion and phonon density of states
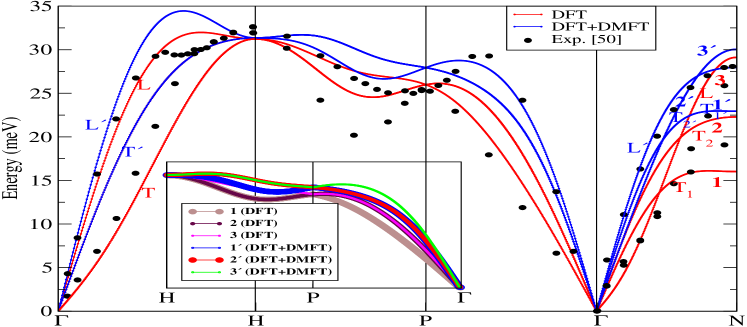
The phonon dispersion curve obtained using DFT and DFT+DMFT based calculations are shown in Fig. 5. Also, the obtained results are compared with the available experimental data[50]. The curves from DFT+DMFT calculations are obtained at 300 K. These curves are plotted along the high symmetric directions in the first Brillouin zone. V is well-known to crystallize in a body-centered cubic crystal structure with one atom in the primitive cell. This is reflected in the phonon dispersion curve which exhibits three acoustic branches, here represented as 1 (), 2 () and 3 () corresponding to DFT (DFT+DMFT). Among the three acoustic modes, two are transverse, (represented by T1 (T) and T2 (T)) and one is longitudinal (represented by L (L′)). From the figure, it is seen that the bands at and points are triply degenerate at both the levels. Nextly, along directions, the phonon bands 1 () and 2 () are degenerate while band 3 () is non-degenerate at DFT (DFT+DMFT) level. Furthermore, along directions, bands 1 and 2 are degenerate while band 3 is non-degenerate at DFT level which is shown in subplot of Fig. 5. But, at DFT+DMFT level, along directions, bands and are degenerate while band is non-degenerate. Moreover, at DFT level, it is further seen that along directions, bands 2 and 3 are degenerate while band 1 is non-degenerate. However, at DFT+DMFT level, bands and are degenerate and band is non-degenerate along direction. In addition to this, along directions all the three bands are found to be non-degenerate at both the levels. Moving further, in most of the regions along the given high symmetric directions, the three phonon bands obtained at DFT+DMFT level have higher energy than the corresponding bands obtained from DFT calculations. However, at high symmetric point, the calculated bands have same energy at both the levels. Along directions, the energy of band 1 obtained from DFT+DMFT calculations is greater than the corresponding energy obtained at DFT level. The similar behaviour is seen for bands 2 and 3. Apart from this, it is also seen that at point, the gap between bands 2 and 3 is greater in DFT as compared to DFT+DMFT calculations.
The phonon dispersion curve obtained from DFT and DFT+DMFT differ from each other to a good extent. The better agreement between DFT+DMFT results with available experimental data[50] of the phonon dispersion curve is strong evidence that electronic correlation is extremely importance in studying the phononic states of V.
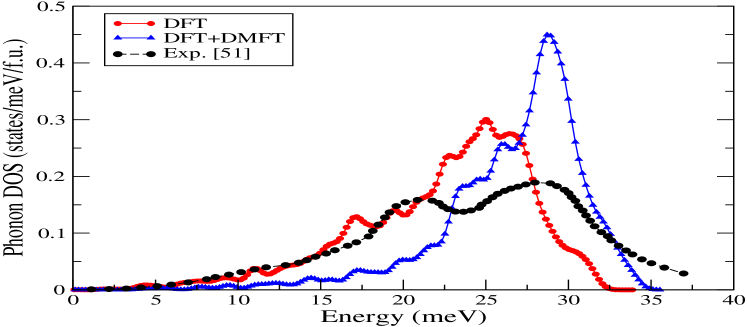
In order to have a better picture of electronic correlation on phononic states, the phonon DOS are also calculated using both the methods i.e., DFT and DFT+DMFT. The DOS at DFT+DMFT level are calculated at 300 K. Corresponding plots are shown in Fig. 6 along with the available experimental result[51]. The maximum value of DOS is found to be 0.30 at the energy 25 meV using DFT calculations. This energy, in terms of temperature, corresponds to 290 K. In the case of DFT+DMFT computations, the maximum value of DOS is found to be 0.45 at the energy 28.70 meV, which corresponds to 333 K. Furthermore, the maximum phonon energy above which DOS is zero is 33.83 meV at DFT level. At DFT+DMFT level, this energy corresponds to 35.15 meV. This value is more closer to the reported data of maximum phonon energy at room temperature in various experimental works, which are 37.22[51, 52], 35.15[3], 36.98[4] and 41.77[5]meV. From the figure, it is seen that the deviations between the calculated values of phonon DOS at the DFT level and experimental results[3, 51, 52] are large. While the DFT+DMFT approach improves the deviations above meV. It is also seen that the maximum value of DOS calculated at the DFT+DMFT calculation is in a good agreement with the experimental result[51]. Thus, this study shows that the electronic correlation has a tremendous effect on phononic states, even in moderately CESs like V.
| DFT | 41.49 | 223.06 | 120.87 | 154.93 |
|---|---|---|---|---|
| DFT+DMFT | 48.87 | 228.67 | 111.88 | 150.8 |
| Exp.[53] | 42.55 | 227.95 | 118.7 | 155.1 |
| Exp.[54] | 42.6 | 228 | 119 | 155.5 |
Along with phonon dispersion and phonon DOS, the elastic constants and bulk modulus is also studied. The slopes of longitudinal and transversal phonon branches near the point provides the value of the elastic constants (, and ). The calculations of elastic constants and bulk modulus () are performed using the relations as follows[55]:
| (1) |
| (2) |
| (3) |
| (4) |
and
| (5) |
where , and represent the wave velocity, frequency and wave vector, respectively. denotes the mass density of the atom. Also, , and correspond to longitudinal (100), transverse (100) and slow transverse (110) waves, respectively. The values of elastic constants corresponding to , and are mentioned in Table 4. From the table, it can be seen that the value of , and are 41.49 (48.87), 223.06 (228.67) and 120.87 (111.88) GPa, respectively at DFT (DFT+DMFT) level. The obtained elastic constants are found to be in a good agreement with the available experimental data[53, 54]. The bulk modulus is also calculated and mentioned in Table 4. The obtained value of is found to be 154.93 (150.8) GPa at DFT (DFT+DMFT) level, which is in a good match with the experimental data[53, 54].
IV Conclusions
The study of transport properties shows that the values of due to EEIs are negligible in the comparison to due to EPIs within the temperature range K. In addition to this, the value of due to EPIs is found to be in good agreement with the available experimental data at any given , within K. These observations generally suggest that EEIs play insignificant role in deciding the values of these properties within the studied temperature range. Moving further, at 300 K, the values of obtained at DFT level VK-1. The value of at 300 K, calculated using DFT+DMFT method, is found to be -0.547VK-1, which is very much off from DFT results. Apart from the transport properties, the phonon dispersion curve calculated at DFT+DMFT level is found to differ a lot from that at DFT level. Furthermore, phononic DOS obtained at DFT+DMFT level shows considerable differences from the DOS at DFT level. The maximum energy of phononic states obtained at DFT and DFT+DMFT level are 33.83 and 35.15 meV, respectively. These observations clearly indicate that electronic correlation is considerably important in studying the & phononic states of V and must not be neglected.
References
- Okram [2012] G. S. Okram, AIP Advances 2, 012178 (2012).
- Mackintosh and Sill [1963] A. Mackintosh and L. Sill, J. Phys. Chem. Solids 24, 501 (1963).
- Stewart and Brockhouse [1958] A. T. Stewart and B. N. Brockhouse, Rev. Mod. Phys. 30, 250 (1958).
- Mozer et al. [1963] B. Mozer, K. Otnes, and H. Palevsky, Solid State Commun. 1, 158 (1963).
- Chernoplekov et al. [1963] N. Chernoplekov, M. Zemlyanov, and A. Chicherin, JETP 16 (1963).
- Valli et al. [2012] A. Valli, G. Sangiovanni, A. Toschi, and K. Held, Phys. Rev. B 86, 115418 (2012).
- Zhang et al. [2015] P. Zhang, R. E. Cohen, and K. Haule, Nature 517, 605–607 (2015).
- Hildebrand et al. [1997] G. Hildebrand, T. J. Hagenaars, W. Hanke, S. Grabowski, and J. Schmalian, Phys. Rev. B 56, R4317 (1997).
- Mirhosseini et al. [2008] S. H. Mirhosseini, K. K. Saha, A. Ernst, and J. Henk, Phys. Rev. B 78, 012404 (2008).
- Paul and Birol [2019] A. Paul and T. Birol, Annu. Rev. Mater. Res. 49, 31 (2019).
- Kotliar et al. [2006] G. Kotliar, S. Y. Savrasov, K. Haule, V. S. Oudovenko, O. Parcollet, and C. A. Marianetti, Rev. Mod. Phys. 78, 865 (2006).
- Ashcroft and Mermin [2011] N. Ashcroft and N. Mermin, (Cengage Learning, 2011).
- Lu et al. [2013] F. Lu, J. Zhao, H. Weng, Z. Fang, and X. Dai, Phys. Rev. Lett. 110, 096401 (2013).
- Binder and Young [1986] K. Binder and A. P. Young, Rev. Mod. Phys. 58, 801 (1986).
- Kouwenhoven and Glazman [2001] L. Kouwenhoven and L. Glazman, Phys. World 14, 33 (2001).
- Dzero et al. [2010] M. Dzero, K. Sun, V. Galitski, and P. Coleman, Phys. Rev. Lett. 104, 106408 (2010).
- Zhao et al. [2021] J. Zhao, W. Wu, Y. Wang, and S. A. Yang, Phys. Rev. B 103, L241117 (2021).
- Georges et al. [1996] A. Georges, G. Kotliar, W. Krauth, and M. J. Rozenberg, Rev. Mod. Phys. 68, 13 (1996).
- Haule et al. [2010] K. Haule, C.-H. Yee, and K. Kim, Phys. Rev. B 81, 195107 (2010).
- Gutzwiller [1964] M. C. Gutzwiller, Phys. Rev. 134, A923 (1964).
- Bailyn [1965] M. Bailyn, Phys. Rev. 139, A1905 (1965).
- Sihi and Pandey [2020] A. Sihi and S. K. Pandey, Eur. Phys. J. B 93, 9 (2020).
- Belozerov et al. [2023] A. S. Belozerov, A. A. Katanin, and V. I. Anisimov, Phys. Rev. B 107, 035116 (2023).
- Savrasov and Savrasov [1996] S. Y. Savrasov and D. Y. Savrasov, Phys. Rev. B 54, 16487 (1996).
- Hellwege and Madelung [1982] K.-H. Hellwege and O. Madelung, Group III, Vol. 15 (Springer-Verlag, Berlin, 1982) p. 63.
- Chernoplekov et al. [1973] N. Chernoplekov, G. Panova, B. Samoilov, and A. Shikov, JETP 64, 195 (1973).
- Westlake [1967] D. Westlake, AIME MET SOC TRANS 239, 1341 (1967).
- Pan et al. [1977] V. Pan, V. Prokhorov, A. Shevchenko, and V. Dovgopol, Low Temp. Phys. 3, 1266 (1977).
- Desai et al. [1984] P. D. Desai, T. K. Chu, H. M. James, and C. Y. Ho, J. Phys. Chem. Ref. Data 13, 1069 (1984).
- Togo and Tanaka [2015] A. Togo and I. Tanaka, Scripta Materialia 108, 1 (2015).
- Chaput et al. [2011] L. Chaput, A. Togo, I. Tanaka, and G. Hug, Phys. Rev. B 84, 094302 (2011).
- Perdew and Wang [1992] J. P. Perdew and Y. Wang, Phys. Rev. B 45, 13244 (1992).
- Perdew et al. [1996] J. P. Perdew, K. Burke, and M. Ernzerhof, Phys. Rev. Lett. 77, 3865 (1996).
- Khanal and Haule [2020] G. Khanal and K. Haule, Phys. Rev. B 102, 241108 (2020).
- Koçer et al. [2020] C. P. Koçer, K. Haule, G. L. Pascut, and B. Monserrat, Phys. Rev. B 102, 245104 (2020).
- Dai et al. [2003] X. Dai, S. Y. Savrasov, G. Kotliar, A. Migliori, H. Ledbetter, and E. Abrahams, Science 300, 953 (2003).
- Leonov et al. [2012] I. Leonov, A. I. Poteryaev, V. I. Anisimov, and D. Vollhardt, Phys. Rev. B 85, 020401 (2012).
- Leonov et al. [2014] I. Leonov, A. I. Poteryaev, Y. N. Gornostyrev, A. I. Lichtenstein, M. I. Katsnelson, V. I. Anisimov, and D. Vollhardt, Sci. Rep. 4, 5585 (2014).
- Han et al. [2018] Q. Han, T. Birol, and K. Haule, Phys. Rev. Lett. 120, 187203 (2018).
- Blaha et al. [2020] P. Blaha, K. Schwarz, F. Tran, R. Laskowski, G. K. Madsen, and L. D. Marks, J. Chem. Phys. 152, 074101 (2020).
- Haule and Birol [2015] K. Haule and T. Birol, Phys. Rev. Lett. 115, 256402 (2015).
- Haule [2015] K. Haule, Phys. Rev. Lett. 115, 196403 (2015).
- Haule [2007] K. Haule, Phys. Rev. B 75, 155113 (2007).
- Sihi and Pandey [2023] A. Sihi and S. K. Pandey, Comput. Phys. Comm. 285, 108640 (2023).
- Gonze et al. [2016] X. Gonze, F. Jollet, F. A. Araujo, D. Adams, B. Amadon, T. Applencourt, C. Audouze, J.-M. Beuken, J. Bieder, A. Bokhanchuk, et al., Comput. Phys. Comm. 205, 106 (2016).
- Giannozzi et al. [1991] P. Giannozzi, S. de Gironcoli, P. Pavone, and S. Baroni, Phys. Rev. B 43, 7231 (1991).
- Blöchl [1994] P. E. Blöchl, Phys. Rev. B 50, 17953 (1994).
- Jung et al. [1977] W. D. Jung, F. A. Schmidt, and G. C. Danielson, Phys. Rev. B 15, 659 (1977).
- Jeffrey and Toberer [2008] G. S. Jeffrey and E. S. Toberer, Nat. Mater. 7, 101 (2008).
- Bosak et al. [2008] A. Bosak, M. Hoesch, D. Antonangeli, D. L. Farber, I. Fischer, and M. Krisch, Phys. Rev. B 78, 020301 (2008).
- Eisenhauer et al. [1958] C. M. Eisenhauer, I. Pelah, D. J. Hughes, and H. Palevsky, Phys. Rev. 109, 1046 (1958).
- Turberfield and Egelstaff [1962] K. C. Turberfield and P. A. Egelstaff, Phys. Rev. 127, 1017 (1962).
- Alers [1960] G. A. Alers, Phys. Rev. 119, 1532 (1960).
- Bolef [2004] D. I. Bolef, J. Appl. Phys 32, 100 (2004).
- Barker et al. [1970] J. A. Barker, M. L. Klein, and M. V. Bobetic, Phys. Rev. B 2, 4176 (1970).