Panoramic Video Salient Object Detection with Ambisonic Audio Guidance
Audio-visual Correspondence
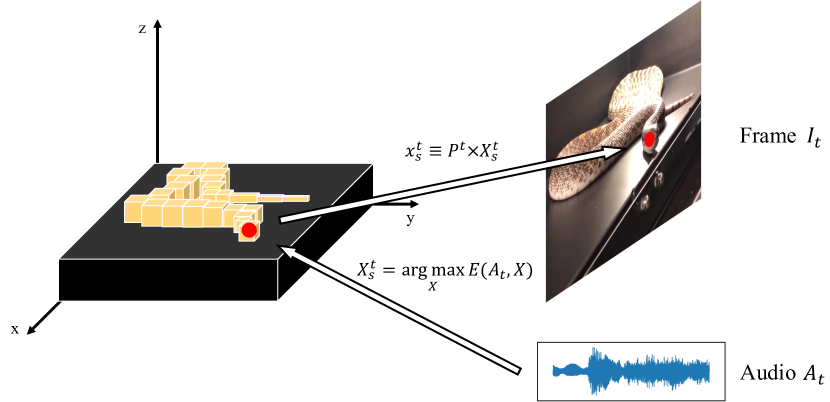
Given the audio recordings , we can decode the 3D location of sound source by signal processing methods such as MUSIC algorithm (schmidt1986multiple) which searches for the location of the maximum of the spatial energy spectrum as
| (1) |
where is the spatial energy spectrum and is the 3D coordinate of sound source at time . Therefore, the sound source can be easily corresponded to the pixel on a frame by applying camera matrix. Given that, we can represent the relationship between audio recordings and 2D location of sound source in frame by
| (2) |
where is the camera matrix at time t and is the homogeneous coordinate of sound source in frame . In practice, the camera matrix is unknown but can be estimated by a adjacent input frames . Consequently, we can link the sound source location in frames from audio .
Detailed Structure of Acoustic Encoder
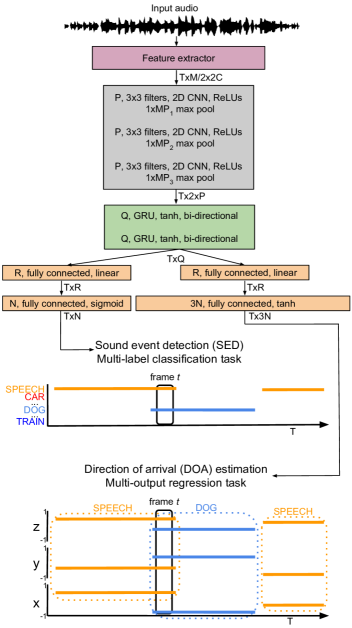
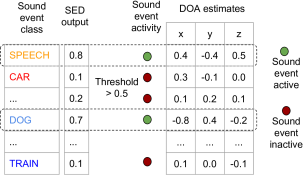
The block diagram of the proposed method for SELD is presented in Figure 2(a). The input to the method is the multichannel audio. The phase and magnitude spectrograms are extracted from each audio channel and are used as separate features. The proposed method takes a sequence of features in consecutive spectrogram frames as input and predicts all the sound event classes active for each of the input frames along with their respective spatial location, producing the temporal activity and DOA trajectory for each sound event class. In particular, a CRNN is used to map the feature sequence to the two outputs in parallel. At the first output, SED is performed as a multi-label classification task, allowing the network to simultaneously estimate the presence of multiple sound events for each frame. At the second output, DOA estimates in the continuous 3D space are obtained as a multi-output regression task, where each sound event class is associated with three regressors that estimate the 3D Cartesian coordinates , and of the DOA on a unit sphere around the microphone. The SED output of the network is in the continuous range of [0 1] for each sound event in the dataset, and this value is thresholded to obtain a binary decision for the respective sound event activity as shown in Figure 2(b). Finally, the respective DOA estimates for these active sound event classes provide their spatial locations. The detailed description of the feature extraction and the proposed method is explained in the following sections.
Feature extraction
The spectrogram is extracted from each of the channels of the multichannel audio using an -point discrete Fourier transform (DFT) on Hamming window of length and 50% overlap. The phase and magnitude of the spectrogram are then extracted and used as separate features. Only the positive frequencies without the zeroth bin are used. The output of the feature extraction block in Figure 2(a) is a feature sequence of frames, with an overall dimension of , where the dimension consists of magnitude and phase components.
Neural network architecture
The output of the feature extraction block is fed to the neural network as shown in Figure 2(a). In the proposed architecture the local shift-invariant features in the spectrogram are learned using multiple layers of 2D CNN. Each CNN layer has filters of dimensional receptive fields acting along the time-frequency-channel axis with a rectified linear unit (ReLU) activation. The use of filter kernels spanning all the channels allows the CNN to learn relevant inter-channel features required for localization, whereas the time and frequency dimensions of the kernel allows learning relevant intra-channel features suitable for both the DOA and SED tasks. After each layer of CNN, the output activations are normalized using batch normalization (ioffe2015batch), and the dimensionality is reduced using max-pooling () along the frequency axis, thereby keeping the sequence length unchanged. The output after the final CNN layer with filters is of dimension , where the reduced frequency dimension of is a result of max-pooling across CNN layers.
The output activation from CNN is further reshaped to a frame sequence of length feature vectors and fed to bidirectional RNN layers which are used to learn the temporal context information from the CNN output activations. Specifically, nodes of gated recurrent units (GRU) are used in each layer with tanh activations. This is followed by two branches of FC layers in parallel, one each for SED and DOA estimation. The FC layers share weights across time steps. The first FC layer in both the branches contains nodes each with linear activation. The last FC layer in the SED branch consists of nodes with sigmoid activation, each corresponding to one of the sound event classes to be detected. The use of sigmoid activation enables multiple classes to be active simultaneously. The last FC layer in the DOA branch consists of nodes with tanh activation, where each of the sound event classes is represented by nodes corresponding to the sound event location in , , and , respectively. For a DOA estimate on a unit sphere centered at the origin, the range of location along each axes is , thus we use the tanh activation for these regressors to keep the output of the network in a similar range.
We refer to the above architecture as SELDnet. The SED output of the SELDnet is in the continuous range of for each class, while the DOA output is in the continuous range of for each axes of the sound class location. A sound event is said to be active, and its respective DOA estimate is chosen if the SED output exceeds the threshold of 0.5 as shown in Figure 2(b).