Detection of stellar light from quasar host galaxies at redshifts above 6
The detection of starlight from the host galaxies of quasars during the reionization epoch () has been elusive, even with deep HST observations1, 2. The current highest redshift quasar host detected3, at , required the magnifying effect of a foreground lensing galaxy. Low-luminosity quasars4, 5, 6 from the Hyper Suprime-Cam Subaru Strategic Program (HSC-SSP)7 mitigate the challenge of detecting their underlying, previously-undetected host galaxies. Here we report rest-frame optical images and spectroscopy of two HSC-SSP quasars at with JWST. Using NIRCam imaging at 3.6m and 1.5m and subtracting the light from the unresolved quasars, we find that the host galaxies are massive (stellar masses of and M⊙, respectively), compact, and disk-like. NIRSpec medium-resolution spectroscopy shows stellar absorption lines in the more massive quasar, confirming the detection of the host. Velocity-broadened gas in the vicinity of these quasars enables measurements of their black hole masses ( and M⊙, respectively). Their location in the black hole mass - stellar mass plane is consistent with the distribution at low redshift, suggesting that the relation between black holes and their host galaxies was already in place less than a billion years after the Big Bang.
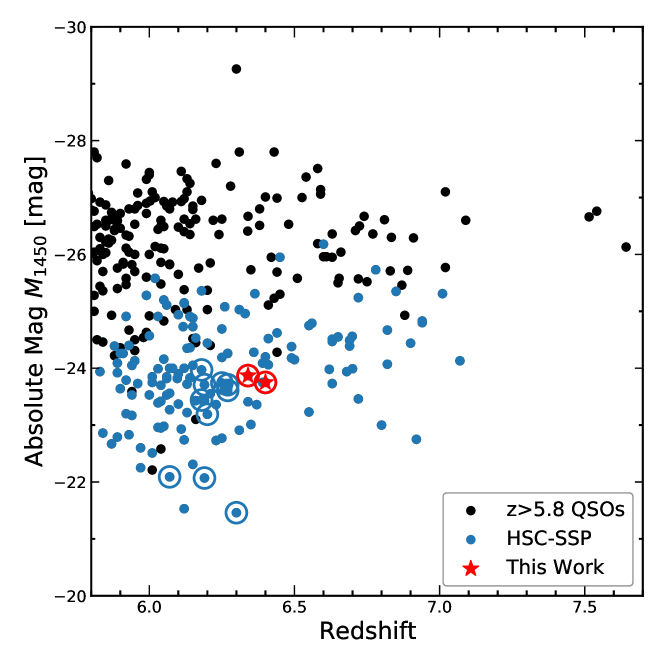
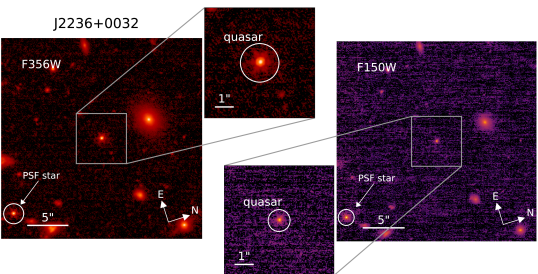
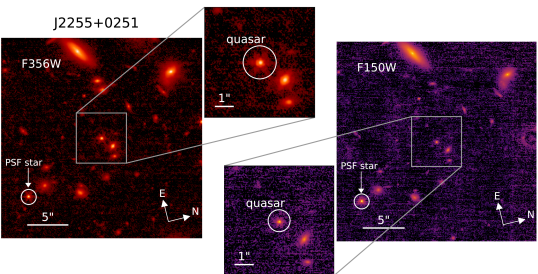
The quasars J2236+0032 and J2255+0251 (coordinates listed in Extended Data Table 1) are at redshifts of and . They have relatively low luminosity ( and mag, respectively), roughly 10 times less luminous than typical bright quasars at these redshifts8, 9, 10. Using JWST with NIRCam11, we observed J2236+0032 on November 6, 2022 and J2255+0251 on October 26, 2022. Images were taken in two broad-band filters (F356W and F150W) to detect their host galaxies at 3.56 and 1.50 m, thus bracketing the rest-frame 4000 Å break, a characteristic feature of galaxy spectra which constrains the age of the stellar population. Total exposure times were approximately 3,100 seconds for each filter per target.
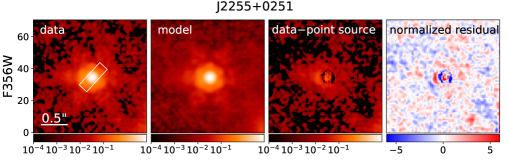
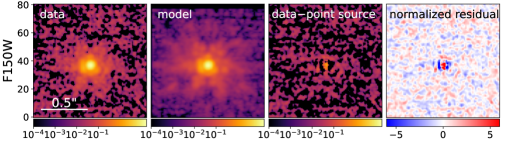
In Figure 1, we show a ′′′′ region and zoomed-in cutouts of the JWST images centered on the quasars for both filters. As expected, both quasars are detected at high significance. The first quasar J2236+0032 ( mag, ,) has no evidence of close neighbors. The second quasar J2255+0251 ( mag, ) has two neighboring sources () that do not have spectroscopic redshifts at this point; however, their detection in the HSC - and -bands suggests that both of them are at lower redshift than the central quasar.
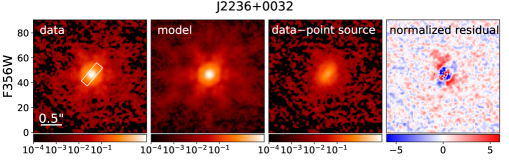
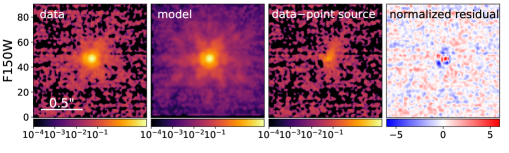
The detection of an underlying host galaxy requires careful decomposition of the two-dimensional light distribution to separate the unresolved quasar from its host galaxy. We perform a two-component model fit of the rest-frame optical emission in a region of the NIRCam images centered on each target. We use the software galight12 to identify stars from each image to model the two-dimensional (2D) point-spread function (PSF). We then model each quasar image in each filter as a sum of a point-like quasar and an extended host. The host galaxy was modeled using a 2D Sérsic profile13 whose parameters include the position, size (Reff), axis ratio, orientation, flux, and the radial profile/shape of the light distribution (i.e., Sérsic index), allowing a flexible description of the a priori unknown host galaxy shape. In Extended Data Table 1, we report the best-fit parameters and their uncertainties based on the dispersion resulting from different PSF models with different modeling techniques (see Methods).
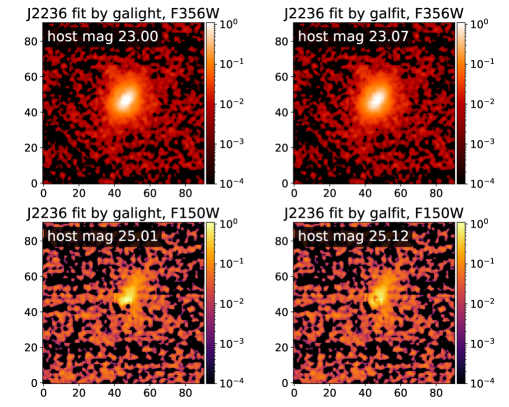
As shown in Figure 2, we detect the host galaxies for both targets, which are visible after subtracting the quasar point-source model (third column). For J2236+0032, the quasar host is significantly detected in both filters ( mag; mag). The inferred host-to-total flux ratios are , and with sizes (Reff) of kpc and kpc for F356W and F150W, respectively. The light distribution is elongated in the same direction (i.e., NE–SW) in the two filters, suggesting a mildly inclined disk-like host. For this target, we fix the Sérsic index to in both bands – corresponding to an exponential disk model – to avoid non-physical fits; this is supported by a subsequent fit to the host galaxy emission after subtracting the quasar (see Methods). For J2255+0251, the host galaxy is clearly detected in the F356W band ( mag) with a host-to-total flux ratio of . The host emission extends southeast (left) of the quasar’s location. The size of the host is inferred to be Reff kpc with a Sérsic index of , suggesting a more disk-like than spheroidal profile. The host galaxy is not detected in the F150W image, resulting in an upper limit of mag (see Methods). This upper limit provides an important constraint on the galaxy spectral energy distribution (SED). A non-detection is not surprising, given the low host-to-total flux ratio in the F356W band and the fact that galaxies are typically fainter blueward of the 4000 Å break. We use NIRSpec14 observations to demonstrate that the contribution of extended line emission to the host photometry in F356W is minimal (See Methods).
Our two photometric bands lie on either side of the 4000 Å break, allowing us to quantify the contributions of young and relatively old stars, and thus to estimate the stellar masses of the two quasar host galaxies. We fit the SED of each host with a single stellar population, in which the stellar metallicity is constrained to the range , the stellar age is within the range Gyr (capped by the age of the universe at redshift 6.4), and the extinction Av is in the range of mag. With standard assumptions on the stellar Initial Mass Function (IMF), we find that J2236+0032 has a stellar mass of , while J2255+0251 is less massive with . We use simulations and three different SED fitting codes to demonstrate that the results are robust, although further observations will lessen potential systematic errors in these mass estimates (see Methods for full details on our mass estimates and their uncertainties). Our host galaxies are among the highest stellar mass galaxies known at (ref. 15).
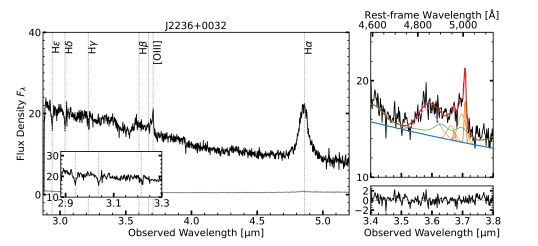
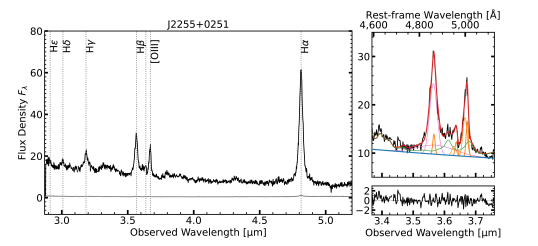
A rest-frame optical spectrum of each quasar was obtained by the NIRSpec instrument on JWST (Figure 3). These spectra cover 2.87–5.27 m, or approximately 4000–7000 Å in the rest-frame, revealing strong emission lines including the H+[O iii] multiplet, H, and blended Fe ii pseudo-continuum. The 02-wide slit was fortuitously aligned along the major axis of the host galaxy of J2236+0032 (Figure 2). Remarkably, we serendipitously identify stellar absorption lines (H, H, and H) in J2236+0032. Thus the contribution of stellar light is confirmed both from the imaging and spectroscopy in this object. We use the velocity width of the broad H emission line and the rest-frame 5100 Å continuum luminosity to estimate the mass of the central black hole, under the assumption that the high-velocity gas is governed by the gravity of the SMBH. Using a recipe calibrated in the local universe16 and subtracting the stellar emission, we obtain virial masses of M for J2236+0032, and M for J2255+0251, respectively (see Methods).
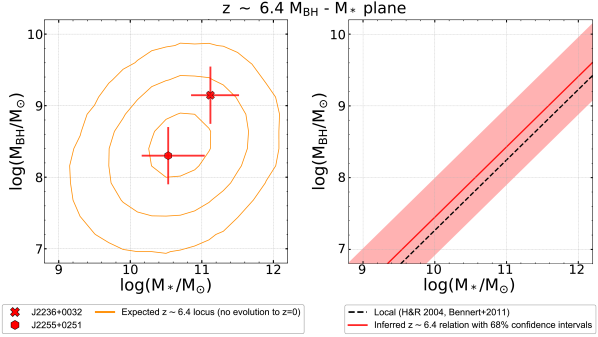
Figure 4 shows the two quasars in the black hole mass – stellar mass plane (left panel), as well as the inferred underlying relation compared to the local relation (right panel). As is observed in the local universe, the quasar hosting the more massive black hole is hosted by the more massive galaxy. To evaluate their location in the MBH – M∗ plane relative to the local mass relation, we carry out a simulation, following ref. 17, that takes into account the selection effects for these two quasars in the HSC survey. For this purpose, we combine the quasar flux limits, the estimated BH mass and accretion rate functions at , as well as uncertainty in our stellar mass estimates to predict the expected MBH for these two quasars – under the baseline assumption that the MBH–M∗ relation does not evolve between and the present. In the left panel, the orange contours show the resulting bivariate probability distribution for the location of these two quasars, with the measured values overplotted in red. Our two quasars fall within the probability distribution (orange contours) of this simulated sample and are thus consistent with no evolution of the MBH–M∗ relation from to , as shown for the inferred underlying relation in the right panel of Figure 4. With just two quasars, the probability distribution of the nominal evolution strength is broad as suggested by the width of these uncertainties (see also Extended Data Figure 6 in the Methods). However, ongoing JWST observations will give us a significantly larger sample, allowing us to better constrain models for the mutual evolution of the black hole and stellar populations in galaxies19, 18, 20.
References
- 1 Mechtley, M. et al. Near-infrared Imaging of a z = 6.42 Quasar Host Galaxy with the Hubble Space Telescope Wide Field Camera 3. ApJ756, L38 (2012)
- 2 Marshall, M. A. et al. Limits to Rest-frame Ultraviolet Emission from Far-infrared-luminous z 6 Quasar Hosts. ApJ 900, 21 (2020)
- 3 Peng, C. Y. et al. Probing the coevolution of supermassive black holes and galaxies using gravitationally lensed hosts. ApJ 649, 616-634 (2006)
- 4 Matsuoka, Y. et al. Subaru High-z Exploration of Low-luminosity Quasars (SHELLQs). I. Discovery of 15 Quasars and Bright Galaxies at . ApJ 828, 26 (2016)
- 5 Matsuoka, Y. et al. Subaru High-z Exploration of Low-luminosity Quasars (SHELLQs). IV. Discovery of 41 Quasars and Luminous Galaxies at 5.7 z 6.9. ApJS 237, 5 (2018)
- 6 Matsuoka, Y., et al. Subaru High-z Exploration of Low-luminosity Quasars (SHELLQs). XVI. 69 New Quasars at 5.8 z 7.0. ApJS 259, 18 (2022)
- 7 Aihara, H., et al. The Hyper Suprime-Cam SSP Survey: Overview and survey design. PASJ 70, S4 (2018)
- 8 Fan, X. et al.. A Survey of Quasars in the Sloan Digital Sky Survey. I. Discovery of Three New Quasars and the Spatial Density of Luminous Quasars at z~6. ApJ 122, 2833–2849 (2001)
- 9 Bañados, E. et al. An 800-million-solar-mass black hole in a significantly neutral Universe at a redshift of 7.5. Nature 553, 473–476 (2018)
- 10 Fan, X., Banados, E., & Simcoe, R. A. Quasars and the Intergalactic Medium at Cosmic Dawn. arXiv e-prints arXiv:2212.06907 (2022)
- 11 Rieke, M. J., Kelly, D. & Horner, S. Overview of James Webb Space Telescope and NIRCam’s Role. Cryogenic Optical Systems and Instruments XI. 5904, 1–8 (2005)
- 12 Ding, X. et al. The Mass Relations between Supermassive Black Holes and Their Host Galaxies at HST-WFC3. ApJ 888, 37 (2020)
- 13 Sérsic, J. L. Boletin de la Asociacion Argentina de Astronomia La Plata Argentina, 6, 41-43 (1963)
- 14 Jakobsen, P., et al. The Near-Infrared Spectrograph (NIRSpec) on the James Webb Space Telescope. I. Overview of the instrument and its capabilities. A&A 661, A80 (2022)
- 15 Grazian, A., et al. The galaxy stellar mass function at 3.5 z 7.5 in the CANDELS/UDS, GOODS-South, and HUDF fields. A&A 575, A96 (2015)
- 16 Vestergaard, M., & Peterson, B. M. Determining Central Black Hole Masses in Distant Active Galaxies and Quasars. II. Improved Optical and UV Scaling Relationships. ApJ 641, 689-709 (2006)
- 17 Li, J., et al. On the Connection between Supermassive Black Holes and Galaxy Growth in the Reionization Epoch. ApJ 931, L11 (2022)
- 18 Habouzit, M., et al. Co-evolution of massive black holes and their host galaxies at high redshift: discrepancies from six cosmological simulations and the key role of JWST. MNRAS 511, 3751-3767 (2022)
- 19 Kormendy, J., & Ho, L. C. Coevolution (Or Not) of Supermassive Black Holes and Host Galaxies. ARA&A 51, 511-653 (2013)
- 20 Inayoshi, K., et al. Rapid Growth of Seed Black Holes during Early Bulge Formation. ApJ 927, 237 (2022)
- 21 Häring, N., & Rix, H.-W. On the Black Hole Mass-Bulge Mass Relation. ApJ 604, L89-L92 (2004)
- 22 Bennert, V. N., Auger, M. W., Treu, T., Woo, J.-H., & Malkan, M. A. A Local Baseline of the Black Hole Mass Scaling Relations for Active Galaxies. I. Methodology and Results of Pilot Study. ApJ 726, 59 (2011)
Figures
Methods
Cosmological model
A standard concordance cosmology with km s-1 Mpc-1, , and is adopted, which gives a scale of kpc/′′ at . All magnitudes are presented in the AB system. Milky Way dust extinction is negligible at the near-infrared wavelengths of interest and is not corrected for.
Target selection
The two objects presented here are part of our Cycle 1 JWST program (Observation ID 1967; PI: M.Onoue) which targets 12 of the lowest-luminosity quasars at redshift 6.0 to 6.4 (ref. 1) discovered by the Hyper Suprime-Cam Subaru Strategic Program7, an optical wide-field survey using the 8.2-meter Subaru telescope.
These quasars were spectroscopically confirmed by ground-based follow-up observations4, 5, 6. The quasars exhibit broad Ly emission and strong intergalactic medium absorption blueward of Ly. This deep survey, which is sensitive to quasars a factor of 10 less luminous than those discovered by shallower surveys such as the Sloan Digital Sky Survey (see Extended Data Figure 1).
NIRCam Observations and data reduction
The data presented in this paper were taken with Module B of the NIRCam instrument, which has a field of view of square arcminutes. Total exposures of 3,100 seconds in the two filters (F356W and F150W) were obtained simultaneously. A primary and sub-pixel dithering pattern was employed to mitigate cosmic ray hits and bad pixels in the detector and to ensure sub-pixel resampling during the stacking step. We used the INTRAMODULEBOX and STANDARD dithering patterns for the primary and sub-pixel dithers, respectively. We used the BRIGHT1 readout mode.
The data were processed using the standard procedures in JWST pipeline version 1.7.2.
The pre-calibrated “Stage 2” image frames were downloaded from the MAST archive.
These images have the pipeline parameter reference files jwst_1009.pmap for J2255+0251 and jwst_1011.pmap for J2236+0032, as registered in the JWST Calibration Reference Data System111https://jwst-crds.stsci.edu.
For individual frames, global background light was first subtracted using the Background2D function of Photutils2.
The archived images clearly have horizontal and vertical stripe noise patterns, known as “ noise”.
This noise was subtracted by first masking bright objects, then collapsing the 2D images along each axis of the detectors and estimating the noise amplitudes by measuring sigma-clipped median values. These amplitudes were then subtracted from each row and column. The horizontal stripes were measured for each of the four detector amplifiers separately.
These post-processed Stage 2 image frames were then aligned and stacked with inverse-variance weighting using the Stage 3 pipeline, keeping the original position angle of the detector for the purpose of building the PSF library.
Both F356W and F150W images were resampled with a pixel scale a factor of two smaller than that of the detector, using the drizzling algorithm implemented in the Resample step of the pipeline.
The final pixel scales for F356W and F150W are and , respectively.
2D image decomposition of quasar and host galaxy emission using galight
Accurate decomposition of the image of a quasar into a central point source and an extended host galaxy requires a high-quality model for the PSF based on stars detected in the same image as the quasars. Space-based telescopes have a much sharper and more stable PSF than ground-based telescopes, and the Hubble Space Telescope (HST) has been used to measure quasar host galaxies to redshift up to (ref. 12, 3, 4, 5). However, HST’s 90-minute orbit means that it is continually passing between Earth’s shadow and direct sunlight, causing the telescope to expand and contract (“orbital breathing”) and giving rise to a time-dependent PSF. The difficulty of modeling the PSF has not allowed quasar host galaxies to be detected significantly beyond (ref. 6, 1, 7, 2), where host starlight can be only measured through the SED fitting method8.
Here, we follow our tested strategy12, including the analysis of JWST images10, and build a PSF library by identifying all isolated, unsaturated stars of sufficient signal-to noise ratio (SNR) in our images. We identified 1216 PSF stars in filter F150WF356W for J2236+0032 and 95 PSF stars in filter F150WF356W in the images for J2255+0251. We use our two-dimensional modeling software galight12 to fit the quasar images with a model of a scaled PSF (the spatially unresolved point-like quasar) and a PSF-convolved 2D Sérsic profile (the host galaxy). galight is a python-based open-source package222https://galight.readthedocs.io/en/latest/ that utilizes the image modeling capabilities of lenstronomy9. It has been adopted for quasar decomposition of images by HST12, JWST10, and the HSC survey11. We adopt uniform priors for the effective radius Reff and the Sérsic index ( of the host to avoid unphysical parameter inference. For J2255+0251, there is one nearby object which we fit simultaneously with a Sérsic profile, allowing us to correct for its effect on the host galaxy properties.
We obtain a weighted inference for the decomposition result as briefly described here. After subtracting the remaining local background, we use each PSF in our library in turn to fit the image. The performance of each PSF is determined by its best-fit value. We select groups of two, three, and five PSFs from the library that have the top level performance and then average them using psfr (Birrer et al. in prep). To optimize our modeling of the unresolved quasar emission, we consider both best-fit models using individual stars and average models based on the combined PSF stars described above. Thus, we add the three averaged PSFs as new members to the PSF library. We take the results from the five top-performing PSF models in the updated library. We determine our final result parameters by weighting their values, as defined by ref. 12, Eq. (3)-(6). The uncertainties we quote are based on the dispersion in the host properties from these five different PSF models. Errors based on variation in the PSF models are often significantly larger than the formal fitting errors, as has been recently demonstrated using simulations and observations of quasars and their host galaxies12. The final inferred host filter magnitude, size, Sérsic index, and other fit parameters are presented in Extended Data Table 1. The images in Figure 2 are based on the PSF with the best performance. The sizes of our host galaxies are defined using the Sérsic effective radius Reff along the semi-major axis measured by galight.
The quasar host of J2236+0032 appears to be a compact galaxy. As a result, we find that the Sérsic is poorly constrained, and the resulting host residual is point-like with an inferred Reff of (the lower limit of the prior), indicating that the central PSF has not been fully removed. This model implies a stellar mass with an implausibly high value above given the SED fitting described below. Thus, we refit this object, fixing in both F356W and F150W. This gives a much-improved model. The host is quite elongated in F356W, suggesting that it is a disky edge-on galaxy. We also find a consistent position angle between F356W and F150W, as shown in Figure 2. Thus, for J2236+0032, we adopt the results with Sérsic fixed to 1. We further directly fit the “data quasar" residual image (i.e., host) with the Sérsic model and allow the Sérsic index to vary. When we do so, the inferred is 1.55 with values of Reff and the host magnitude consistent with those with the fit.
Since J2255+0251 has no clear host detection in the F150W band, we re-model the data and fix the host galaxy parameters (host Sérsic index, Reff, ellipticity, and position angle) to the values inferred from the F356W band, while allowing the central position and amplitude to vary. We still see no evidence for a host residual, but the model gives a formal host magnitude of mag. We quote these inferences in Extended Data Table 1 and adopt a lower limit to the magnitude of mag.
Confirmation of our 2D decomposition using galfit
In the fitting routine described above, the results are sensitive to the setting of certain parameters. For instance, a sub-pixel shift of the PSF is typically needed to optimally align with the position of the quasar. This interpolation within a pixel can result in modest variations in the allocation of flux between the quasar and its host galaxy. In galight, the parameter point_source_supersampling_factor controls this interpolation.
For guidance here on the optimal setting, we compared our results with the decomposition from galfit13 while implementing different supersampling factor values, i.e., 1 (no interpolation) and 2. The choice of supersampling factor had a greater impact on the F150W decomposition than that on the F356W image. We found that the two codes are in close agreement when using a supersampling_factor of 2 as shown in Extended Data Figure 2 and reported in Extended Data Table 1. As a result, to account for the uncertainty associated with this setting, we report the averaged results obtained using both supersampling_factor values of 1 and 2, with uncertainties covered by these two settings.
Tests of the robustness of the host galaxy properties
We perform several sanity checks for our two quasars to confirm that the detections of their host galaxies are real. First, our final reduced data are co-added using 16 dithers. To check whether the apparent host is caused by a random ghost from any particular dither frame, we reanalyze the data using the first 8 and the second 8 dithers separately. We are able to detect the host from both halves of the data. To ensure that the apparent host galaxy flux is not dominated by a mismatched PSF core, we mask the quasar center (using a and radius aperture for F356W and F150W, respectively) and redo the fit. Again, the host is well-detected.
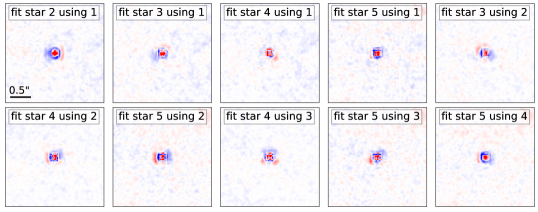
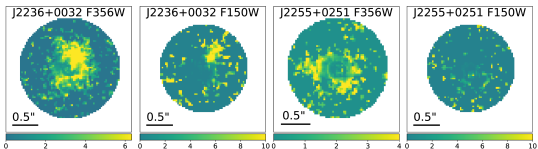
To rule out the possibility that the residual emission (host galaxy) is an artifact of the chosen PSF stars, we selected the five top-performing PSF in the library, and identified twenty pairs from these. We then fit one PSF with the other without assuming any host component for all pairs. We performed this test for stars in the fields of J2236+0032 and J2255+0251 in both bands; residual images show no extended features in any case. This is illustrated for J2255+0251 in the F356W filter in the top panels of Extended Data Figure 3. We also fit galaxy + host models to pure PSF images, in which case the inferred host magnitudes were roughly two magnitudes fainter than the hosts detected around the quasars. In contrast, we clearly detect the quasar host when we use any of the five library PSFs and, using these stellar residual maps to measure the standard deviation, we display the maps of the host signal-to-noise ratio for all images of our two quasars in the bottom panels of Extended Data Figure 3.
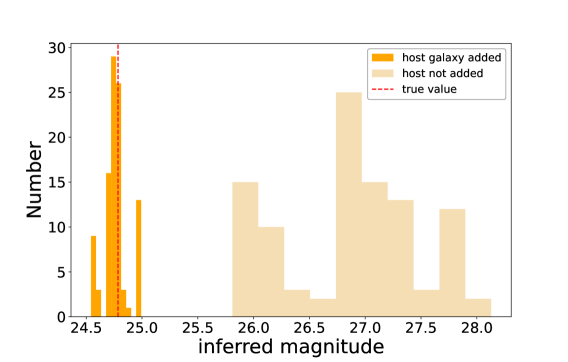
We carried out three sets of simulations to further validate our host detections, including J2255+0251 in the F356W filter and J2236+0032 in the F356W and F150W filters. In one realization of the simulation, we randomly select a PSF from the five top-ranked PSFs in the library, and add a Sérsic profile using the best-fit parameters from our model inference. We sample the resulting mock quasarhost image at the observed resolution and insert it into a random empty position in the JWST NIRCam data. We then model the images with the other four PSF stars, and select the result with the best performance. We repeated this simulation a hundred times to quantify the bias and standard deviation of the inferred values around the true values. We found that the key Sérsic parameters can be obtained accurately, with biases well below 1 in all quantities. For J2255+0251, the bias (obtainedtruth) and scatter of the inferred host magnitude are 0.020.11. For J2236+0032, the magnitude bias and scatter are 0.010.14 and 0.130.16 for F356W and F150W, respectively. We present the distributions of the inferred host magnitudes in the simulations of J2255+0251 (F356W) in Extended Data Figure 4. We note that these simulation tests were conducted with point_source_supersampling_factor set to 1. The similar scatter distribution can be found when setting this parameter to 2.
Finally, we tested the fidelity of the host magnitude inference using a joint fit across the two bands. We fix the host galaxy parameters for J2236+0032 (where the host is detected in F150W), setting the Sérsic parameters to those inferred from F356W; we find a very similar host magnitude to the value when all parameters are allowed to vary: the changes in the inferred host magnitude are within 0.1 mag.
Stellar mass of the host galaxy
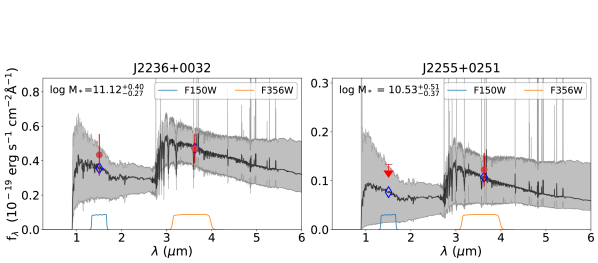
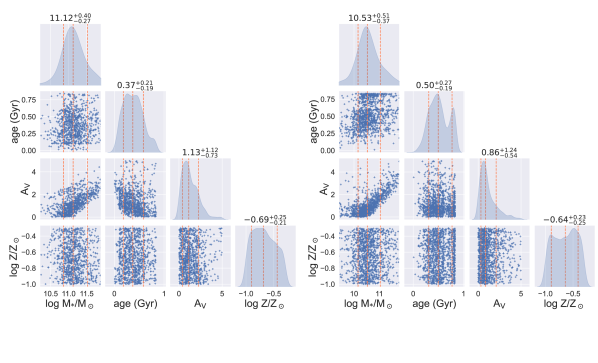
We use SED fitting to estimate the stellar masses of our two host galaxies at using the photometry and its uncertainty based on NIRCam imaging with two filters (F356W and F150W) which straddle the rest-frame 4000 Å break. The host galaxy of J2255+0251 is not detected in the F150W filter, thus we take mag as a lower limit on the magnitude. We adopt a Chabrier IMF in our analysis to allow direct comparison with the local black hole - host galaxy mass relations (e.g., ref. 21, 22). Contributions of nebular emission lines from the host galaxies are also allowed with a uniform log ionization parameter over the range . Three key parameters define the shape of the SED template: age, metallicity, and dust attenuation (Av). We adopt a uniform prior on the age over the range [0.01, 0.84] (in Gyr), extending to the age of the universe at . We adopt a uniform prior in metallicity over the range following ref. 14, 15. We assume an Av range of [0, 5.0] mag for both targets. For J2255+0251, the F150W band has an upper limit on the flux thus the constraint on Av is weaker; hence, we assume Av follows a log-normal distribution with a median value at 0.85 as supported by recent JWST observations of high-redshift galaxies16. A measurement of the Balmer decrement (i.e., the ratio of narrow H and H in the spectrum) implies an attenuation Av=0.670.13 mag for the narrow-line region (Onoue et al., in prep), consistent with the median extinction value of our prior. We also note that for J2236+0032, the contribution of the host in the spectrum (Onoue et al., in prep) has a magnitude in close agreement with the NIRCam photometry, supporting our stellar mass estimate.
We use gsf17 to perform the SED model fitting. This software generates a set of templates with a range of ages and metallicities according to the prior to fit a composite stellar population (CSP)-like star formation history.
A random parameter sampling is performed through Markov-Chain Monte-Carlo (MCMC) to infer the probability distribution of the SED parameters. For J2236+0032 and J2255+0251, the inferred values of log M∗ are and (in units of ), respectively, as shown in Extended Data Table 1.
In Extended Data Figure 5, we present the best-fit SEDs of the two quasar hosts, in which the MCMC inference indicates that the stellar mass is mildly sensitive to age and metallicity but is more sensitive to Av.
We also adopt the same configuration for the independent code Bagpipes18 and CIGALE19 to perform SED fits; we find values of M∗ that change by 0.1 dex or less.
The robust measurement of stellar mass is due to having photometry on both sides of the 4000 Å break, accurate spectroscopic redshifts, and a firm upper limit of the stellar age 0.84 Gyr, given the age of the universe at . Even so, we note that additional systematic uncertainties may be unaccounted for thus leading to greater uncertainty in the mass estimates than we have quoted.
NIRSpec Observations and data reduction
The NIRSpec Fixed-Slit data for the two quasars were obtained on October 30, 2022 for J2236+0032 and October 28, 2022 for J2255+0251. The targets were aligned onto the S200A2 slit and observed with the medium-resolution () G395M grating, which covers 2.87 – 5.27 m in the observed frame. Total exposures of 1,970 seconds were obtained for each target.
The spectroscopic data were processed with the JWST pipeline version 1.8.5.
Raw (uncal) data were downloaded from the MAST archive, which has the parameter reference files jwst_1027.pmap.
The stage 1 calibration was performed with the default parameters but with the function to detect large cosmic-ray hits on the detector turned on during the Jump step.
The noise along the vertical direction was subtracted from the Stage 1 products using the same method as that for NIRCam images.
Pixels of the science frames flagged as bad or saturated were masked based on the associated Data Quality frames.
During the Stage 2 data processing, including flat-fielding and flux calibration,
we use in-flight measurements of spectrophotometric standard stars (jwst_nirspec_fflat_0065.fits) to convert the detector signals into physical units.
The signal loss due to the optical system and the finite width of the S200A2 slit were corrected in the Pathloss step by applying built-in correction factors for a point source as a function of wavelength.
The two-dimensional spectra at each dither position were then stacked using the Stage 3 pipeline.
The pixel resampling scale was kept to the original pixel scale of the detector.
A 6-pixel-wide box-car aperture (06 wide) was employed to extract the one-dimensional spectrum from the stacked spectrum.
Spectrum fitting
We use a public code QSOFitMORE20 (version 1.2.0333https://doi.org/10.5281/zenodo.4893646) with custom modification to fit the NIRSpec rest-optical spectra of the two quasars. The continuum emission is fitted with two components: power-law emission from the accretion disk, and a pseudo-continuum from the forest of singly-ionized iron emission. QSOFitMORE uses an empirical iron template of ref. 21. The rest-frame 5100 Å monochromatic luminosity () is derived from the best-fit power-law continuum model with a power-law index of (i.e., flux density ).
Emission lines are modeled with a combination of one or more Gaussian profiles.
J2236+0032 needs one broad component for H, while the adjacent forbidden emission of [O iii] requires one narrow component and another blueshifted broad component.
The narrow [O iii] doublet is forced to have the same line width without velocity offsets between the two.
The [O iii] redshifts of the two targets are derived from the peaks of the narrow [O iii] components.
The [O iii] redshift of J2236+0032 agrees well with the location of the absorption lines we detect in H, H, and H (Figure 3).
The H+[O iii] line profile as well as the continuum properties of J2236+0032 are reported in Extended Data Table 2.
A full description of the fitting procedure and other emission line properties will be presented in Onoue et al. (in prep.).
BH mass estimates
The central black hole masses MBH of the two quasars are measured by the single-epoch method using broad H emission lines. Assuming that the broad H emission traces the kinematics of the gas orbiting in the vicinity of the SMBHs (the so-called broad-line-region), one can use the line width of H as a proxy of the rotation velocity of the broad-line-region gas. There is also an empirical correlation between the rest-frame 5100 Å continuum luminosity () and the radius from the SMBH to the broad-line-region gas, which is observed by the reverberation mapping technique22. In this paper, we use the recipe provided by ref. 16 to estimate the black hole mass:
| (1) |
Based on the spectrum fitting results described above, we derive virial BH masses of M for J2236+0032 and M for J2255+0251. Note that these virial SMBH masses have intrinsic uncertainties of 0.4 dex16, which is not included in the error budget above. We report the derived BH properties in Extended Data Table 2.
We estimate the host galaxy contribution to the rest-optical continua of the NIRSpec spectra, using the decomposed host galaxy images in the NIRCam’s F356W filter.
Referring to the relative position angle of the NIRCam and NIRSpec observations,
we find that the stellar emission falling inside the extraction aperture is 21.8% (J2236+0032) and 4.8% (J2255+0251) with respect to the total emission.
We interpret this as the fraction of the host starlight in the observed continuum emission in the NIRSpec G395M spectrum for each source, which allows us to correct the 5100 Å continuum luminosity to that from the quasar emission alone.
Accordingly, the virial BH masses become M for J2236+0032 and M for J2255+0251, respectively.
These corrected BH properties are reported in Extended Data Table 2, and are adopted in Figure 4.
This correction is more significant for J2236+0032, in which stellar absorption lines are detected (Figure 3).
Emission from H+[O iii] in the hosts
Our SED model allows for the inclusion of the H+[O iii] line emission that falls within the F365W filter (Extended Data Figure 5). However, if those lines were of high equivalent width in the hosts, they could affect the broad-band photometry used in the stellar mass inference, especially if the gas is ionized by the quasar23, 24. To ensure that our NIRCam detection of extended host emission is not dominated by these lines, we directly compare the total flux of the H+[O iii] narrow lines seen in our spectra with the contribution from the host in the NIRCam image within the aperture of the spectral slit. For J2236+0032, narrow H emission is not detected and the [O iii] emission in NIRSpec contributes only of the host galaxy light.
For J2255+0251, the narrow H+[O iii] emission is comparable to the host galaxy brightness measured in the F356W filter. Much of this emission may be coming from the narrow-line region of the quasar itself. To quantify the impact on the detection of the stellar continuum, we use the 2D NIRSpec spectroscopic data and fit a Gaussian to the unresolved spatial profile at each wavelength, allowing the centroid to vary linearly with wavelength, setting the width to be the same as the spatial PSF as measured from a publicly available reference star in the same spectroscopic configuration as our observations, and letting the amplitude be a free parameter. The best-fit Gaussian profile at each wavelength is then subtracted from the 2D spectrogram to reveal any spatially extended [O iii] emission in the spectrum. A background region of equivalent size is subtracted from the extended emission region. We calculate the flux density of the extended emission in the F356W band and compare it to the flux density of the NIRCam host galaxy within the aperture of the NIRSpec slit on the sky. For J2255+0251, the [O iii] extended emission has a magnitude of 27.6, which is of the flux of the observed host galaxy within the slit aperture.
Note that the measurement of the extended emission is based on the observational fact that the apparent minor axis of J2255+0251 is wider than the scale of the PSF in F356W (see Figure 2).
We thus conclude that the majority of the narrow H+[O iii] emission in J2255+0251 comes from the unresolved quasar, which has been removed by our quasar decomposition. For J2236+0032, we use the same approach and find that the extended [O iii] has a magnitude of 27.5 mag. The flux ratio between the extended [O iii] and the host galaxy within the slit is %. No extended H emission was detected in either target.
Construction of mock quasar and host galaxy sample at
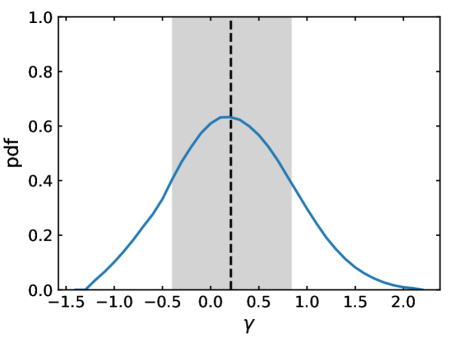
We use the method described in ref. 17 to generate mock samples to assess the expected location of our two quasars in the black hole - stellar mass plane. We start with a large galaxy sample representative of the population at based on the stellar mass function15. We then assume that the ratio of black hole to host stellar mass and its dispersion are the same as the local values (i.e., no evolution). As an update on this procedure, we now use the BH Eddington rate distribution of ref. 25 to assign quasar luminosities. Observational uncertainty on M∗ and intrinsic uncertainty on MBH are incorporated with a selection on magnitude () is applied. The orange contours in Figure 4 show the resulting bivariate probability distribution in the stellar mass-black hole mass plane. We further generate samples for different evolution rates (MBH/M) in steps of 0.1 in and under the assumption that the dispersion is the same as the local value (ref. 26, 17 demonstrates that the evolution rate and dispersion are degenerate). The probability distribution of is determined given our measurements of both MBH and M∗ of our two quasars (Extended Data Figure 6); lies in the range to with 68% confidence.
References
- 1 Matsuoka, Y., et al. Subaru High-z Exploration of Low-luminosity Quasars (SHELLQs). V. Quasar Luminosity Function and Contribution to Cosmic Reionization at z = 6. ApJ 869, 150 (2018)
- 2 Bradley, L., Sipőcz, B., Robitaille, T., et al. astropy/photutils: 1.4.0 Zenodo 6385735B (2022)
- 3 Jahnke, K., et al. Ultraviolet Light from Young Stars in GEMS Quasar Host Galaxies at 1.8z2.75. ApJ 614, 568-585 (2004)
- 4 Mechtley, M., et al. Do the Most Massive Black Holes at z = 2. Grow via Major Mergers? ApJ 830, 156 (2016)
- 5 Marian, V., et al. Major Mergers Are Not the Dominant Trigger for High-accretion AGNs at z 2. ApJ 882, 141 (2019)
- 6 Glikman, E., et al. Major Mergers Host the Most-luminous Red Quasars at z 2: A Hubble Space Telescope WFC3/IR Study. ApJ 806, 218 (2015)
- 7 Chen, Y.-C., et al. A close quasar pair in a disk-disk galaxy merger at z = 2.17. Nature 616, 45-49 (2023)
- 8 Dong, X. Y., & Wu, X.-B. Herschel Observed Stripe 82 Quasars and Their Host Galaxies: Connections between AGN Activity and host Galaxy Star Formation. ApJ 824, 70 (2016)
- 9 Birrer, S., et al. lenstronomy II: A gravitational lensing software ecosystem. The Journal of Open Source Software 6, 3283 (2021)
- 10 Ding, X., Silverman, J. D., & Onoue, M. Opening the Era of Quasar-host Studies at High Redshift with JWST. ApJ 939, L28 (2022)
- 11 Li, J., et al. The Sizes of Quasar Host Galaxies in the Hyper Suprime-Cam Subaru Strategic Program. ApJ 918, 22 (2021)
- 12 Zhuang, M.-Y., & Shen, Y. Characterization of JWST NIRCam PSFs and Implications for AGN+Host Image Decomposition. arXiv e-prints arXiv:2304.13776 (2023)
- 13 Peng, C. Y., Ho, L. C., Impey, C. D., & Rix, H.-W. Detailed Structural Decomposition of Galaxy Images. AJ 124, 266-293 (2002)
- 14 Bouwens, R. J., et al. UV-continuum Slopes of 4000 z 4-8 Galaxies from the HUDF/XDF, HUDF09, ERS, CANDELS-South, and CANDELS-North Fields. ApJ 793, 115 (2014)
- 15 Ucci, G., et al. Astraeus - II. Quantifying the impact of cosmic variance during the Epoch of Reionization. MNRAS 506, 202-214 (2021)
- 16 Shapley, A. E., Sanders, R. L., Reddy, N. A., Topping, M. W., & Brammer, G. B. JWST/NIRSpec Balmer-line Measurements of Star Formation and Dust Attenuation at z 3-6. arXiv e-prints arXiv:2301.03241 (2023)
- 17 Morishita, T., et al. Massive Dead Galaxies at z 2 with HST Grism Spectroscopy. I. Star Formation Histories and Metallicity Enrichment. ApJ 877, 141 (2019)
- 18 Carnall, A. C., McLure, R. J., Dunlop, J. S., & Davé, R. Inferring the star formation histories of massive quiescent galaxies with BAGPIPES: evidence for multiple quenching mechanisms. MNRAS 480, 4379-4401 (2018)
- 19 Boquien, M., et al. CIGALE: a python Code Investigating GALaxy Emission. A&A 622, A103 (2019)
- 20 Fu, Y. QSOFITMORE (version 1.2.0): a python package for fitting UV-optical spectra of quasars. Zenodo.5810042 (2021)
- 21 Boroson, T. A., & Green, R. F. The Emission-Line Properties of Low-Redshift Quasi-stellar Objects. ApJS 80, 109 (1992)
- 22 Kaspi, S., et al. Reverberation Measurements for 17 Quasars and the Size-Mass-Luminosity Relations in Active Galactic Nuclei. ApJ 533, 631-649 (2000)
- 23 Kashino, D., et al. EIGER I. a large sample of [OIII]-emitting galaxies at and direct evidence for local reionization by galaxies. arXiv e-prints arXiv:2211.08254 (2022)
- 24 Matthee, J., et al. EIGER II. first spectroscopic characterisation of the young stars and ionised gas associated with strong H and [OIII] line-emission in galaxies at z=5-7 with JWST. arXiv e-prints arXiv:2211.08255 (2022)
- 25 Wu, J., et al. Demographics of quasars in the black hole mass-luminosity plane. MNRAS 517, 2659-2676 (2022)
- 26 Li, J., et al. Synchronized Coevolution between Supermassive Black Holes and Galaxies over the Last Seven Billion Years as Revealed by Hyper Suprime-Cam. ApJ 922, 142 (2021)
Code Availability
The JWST data were processed with the JWST calibration pipeline (https://jwst-pipeline.readthedocs.io). Public tools were used for data analysis: galight12, galfit13 and PyQSOFit20.
Data Availability
The JWST data are available in the MAST and can be accessed via doi:10.17909/2z59-3v32 (JWST GO 1967) after a twelve-month exclusive access period. Reduced quasar NIRCam image cutouts are also available from the corresponding author upon request or at https://github.com/dartoon/publication/tree/main/SHELLQs_J2236_J2255_data.
Acknowledgements
We thank Takahiro Morishita and Lilan Yang for help with the gsf and Bagpipes packages. We thank Yuming Fu for his help on the use of QSOFitMORE. We thank Xiaohui Fan, Luis Ho, and Vardha Bennert for useful discussions.
This work is based on observations made with the NASA/ESA/CSA James Webb Space Telescope. The data were obtained from the Mikulski Archive for Space Telescopes at the Space Telescope Science Institute, which is operated by the Association of Universities for Research in Astronomy, Inc., under NASA contract NAS 5-03127 for JWST. These observations are associated with program #1967. Support for program #1967 was provided by NASA through a grant from the Space Telescope Science Institute, which is operated by the Association of Universities for Research in Astronomy, Inc., under NASA contract NAS 5-03127.
This paper is based on data collected at the Subaru Telescope and retrieved from the HSC data archive system, which is operated by the Subaru Telescope and Astronomy Data Center (ADC) at NAOJ. Data analysis was in part carried out with the cooperation of Center for Computational Astrophysics (CfCA), NAOJ. We are honored and grateful for the opportunity of observing the Universe from Maunakea, which has the cultural, historical and natural significance in Hawaii.
This work was supported by World Premier International Research Center Initiative (WPI), MEXT, Japan. XD, JS, YM, TI, KK, and HU are supported by the Japan Society for the Promotion of Science (JSPS) KAKENHI grant Nos. JP22K14071, JP18H01251, JP22H01262, JP17H04830, JP21H04494, JP20K14531, JP17H06130, JP20H01953. FW, SEIB, BT, JTS, and MO acknowledge support from the ERC grant Nos. 740246, 885301, 950533. MO and KI acknowledge support from the National Natural Science Foundation of China grant Nos. 12150410307 and 12073003. YM acknowledges support from the Mitsubishi Foundation grant No. 30140. SF acknowledges support from NASA through the NASA Hubble Fellowship grant HST-HF2-51505.001-A awarded by the STScI, which is operated by the Association of Universities for Research in Astronomy, Incorporated, under NASA contract NAS5-26555. ZH acknowledges support from NSF grant AST-2006176. KI acknowledges support by the Spanish MCIN under grant PID2019-105510GB-C33/AEI/10.13039/501100011033 AL acknowledges funding from MIUR under the grant PRIN 2017-MB8AEZ. BT acknowledges support from the Israel Science Foundation (grant No. 1849/19) and from the European Research Council (ERC) under the European Union’s Horizon 2020 research and innovation program (grant agreements No. 950533). MT acknowledges support from the NWO grant 0.16.VIDI.189.162 (“ODIN”). MV acknowledges support from the Independent Research Fund Denmark via grant number DFF 8021-00130.
Author Contributions
XD led the analysis of the quasar decomposition, simulation test, SED fitting, and preparation of the manuscript. MO reduced the NIRCam and NIRSpec data. He also led the spectroscopic data analysis and wrote relevant sections. We regard that these first two authors equally contributed to this work. JS contributed to the NIRCam data analysis and preparation of the manuscript. CP performed the NIRSpec 2D spectroscopic analysis and evaluated the strength of the extended [O iii] emission. JL constructed the mock quasar sample at , which was used to assess the redshift evolution of the black hole – stellar mass relation. MO, XD, JS, YM, TI, MS, and KJ led the project design and management, also developing the main interpretation of the results. All co-authors contributed to the discussion of the presented results and the preparation of the manuscript.
Competing interests
The authors declare no competing interests.
Correspondence
Correspondence and requests for materials should be addressed to X. Ding (xuheng.ding@ipmu.jp) and M. Onoue (onoue@pku.edu.cn).
Extended Data
| J2236+0032 | J2255+0251 | |||
| RA | 22 36 44.58 | 22 55 38.04 | ||
| Dec | +00 32 56.90 | +02 51 26.60 | ||
| Redshift | 6.40 | 6.34 | ||
| (mag) | 23.8 | 23.9 | ||
| F356W | F150W | F356W | F150W | |
| Reff (′′) | 0.130.02 | 0.100.03 | 0.270.19 | - |
| Reff (kpc) | 0.70.1 | 0.50.2 | 1.51.1 | - |
| Sérsic index | fixed as 1 | fixed as 1 | 1.51.4 | - |
| ellipticity (b/a) | 0.390.02 | 0.340.11 | 0.610.09 | - |
| PA (N to W) | 39.4∘2.8∘ | 48.8∘25.5∘ | 26.0∘11.6∘ | - |
| flux ratio | 25.5%4.4% | 10.2%2.8% | 9.8%2.6% | 3.8 |
| quasar mag | 21.950.07 | 22.730.04 | 22.150.03 | 22.890.02 |
| host mag | 23.120.20 | 25.120.29 | 24.580.30 | 26.3 |
| host mag (galfit) | 23.100.07 | 24.950.10 | 24.270.06 | 26.7 |
| host M∗ () | ||||
| J2236+0032 | (corrected) | J2255+0251 | (corrected) | |
|---|---|---|---|---|
| [O iii] redshift | ||||
| ( erg s-1) | ||||
| H FWHMbroad (km s-1) | ||||
| MBH () |