Two-band conduction as a pathway to non-linear Hall effect and unsaturated negative magnetoresistance in the martensitic compound GdPd2Bi
Abstract
The present work aims to address the electronic and magnetic properties of the intermetallic compound GdPd2Bi through a comprehensive study of the structural, magnetic, electrical and thermal transport on a polycrystalline sample, followed by theoretical calculations. Our findings indicate that the magnetic ground state is antiferromagnetic in nature. Magnetotransport data present prominent hysteresis loop hinting a structural transition with further support from specific heat and thermopower measurements, but no such signature is observed in the magnetization study. Temperature dependent powder x-ray diffraction measurements confirm martensitic transition from the high-temperature (HT) cubic Heusler structure to the low-temperature (LT) orthorhombic structure similar to many previously reported shape memory alloys. The HT to LT phase transition is characterized by a sharp increase in resistivity associated with prominent thermal hysteresis. Further, we observe robust Bain distortion between cubic and orthorhombic lattice parameters related by , and , that occurs by contraction along -axis and elongation along -axis respectively. The sample shows an unusual ‘non-saturating’ -dependent negative magnetoresistance for magnetic field as high as 150 kOe. In addition, non-linear field dependence of Hall resistivity is observed below about 30 K, which coincides with the sign change of the Seebeck coefficient. The electronic structure calculations confirm robust metallic states both in the LT and HT phases. It indicates complex nature of the Fermi surface along with the existence of both electron and hole charge carriers. The anomalous transport behaviors can be related to the presence of both electron and hole pockets.
I Introduction
Heusler-based intermetallic alloys and compounds continue to be in the forefront of active research due to their multifaceted electronic and magnetic properties. They have already been identified as material for the development of spintronics devices, magnetic actuators and switches [1, 2, 3, 4]. So far, the major attention has been given to 3 transition metal-based Heuser compounds [5]. An early study of the rare-earth (RE) based full Heusler compounds was reported for Pd2DySn and Pd2HoSn, which were found to order antiferromagnetically below 5 K [6, 7, 8]. On the other hand, Pd2RESn (RE = Tm, Lu, Y, Yb) were found to be superconducting [6]. Recently, rare-earth-bismuth-based full Heuslers and half Heuslers have attracted huge attention for their potential contribution in the field of spintronics. A number of REPdBi and REPtBi compounds were identified as topological insulators or semimetals with nontrivial band topology [9, 10]. Most importantly, REPtBi and REPdBi are identified as Weyl semimetals showing anomalous Hall effect due to Berry curvature. [11, 12].
A close relative to the REPdBi series is the REPd2Bi-type full Heusler compounds. However, unlike the half-Heuslers, REPd2Bi compounds possess inversion symmetry. Most of them either order antiferromagnetically at low temperature (below 10 K) or show a nonmagnetic ground state [13, 14]. The Dy, Ho and Er compounds in the series show additional signature of the first order phase transition in the resistivity versus temperature data around 100 - 150 K [13]. For the Ho-compound, the first order phase transition is found to be associated with a structural change as evident from the appearance of additional peaks in the temperature-dependent x-ray diffraction data [14]. To the best of our knowledge, there is no report of the magnetic and transport properties of GdPd2Bi in the literature.
Gd has total angular momentum, 7/2 due to the half-filled shell, which imply that the magneto-crystalline anisotropy will be weaker. In the present work, we have performed a comprehensive study on GdPd2Bi through our magnetic, transport and structural investigations along with density functional theory (DFT) based electronic structure calculations. Though there are several reports on the electronic structure of REPdBi and REPtBi compounds, the full Heusler based REPd2Bi compounds are hardly investigated through ab-initio based electronic structure calculations. Our work identifies a martensitic type structural transition in the compound from a cubic L to orthorhmbic structure below about 150 K. The compound shows anomalous Hall coefficient and unconventional negative magnetoresistance, which can be attributed to the presence of multi-band electronic structure.
II Experimental Details
Polycrystalline sample of GdPd2Bi was prepared using conventional arc melting technique and the as cast ingot was used for further measurements. The phase purity and the crystallographic structure were ensured by powder x-ray diffraction (PXRD) followed by Rietveld refinement, which was performed using MAUD program [15]. Rietveld refinement of the PXRD pattern obtained at room temperature confirms the formation of MnCu2Al-type L21 structure (space group ). The refined cubic lattice parameter is found to be 6.812(6) Å.
Magnetic measurements were carried out by using a commercial Quantum Design SQUID magnetometer (MPMS XL Ever Cool model). The resistivity () was measured by four probe method on a cryogen-free high magnetic field system (Cryogenic Ltd., U.K.) between 5-300 K. Thermopower measurement was performed in a lab based set up using differential technique between 10 K to 300 K. The sample was further investigated through high resolution temperature dependent x-ray diffraction (wavelength of the radiation being 0.749 Å) using synchrotron facility at the Photon Factory, National Laboratory for High Energy Physics (KEK), Japan at various sample temperatures ranging from 15 to 300 K. Heat capacity () measurement was carried out using a Quantum Design Physical Properties Measurement System.
III Theoretical Techniques
DFT-based electronic structure calculations were performed using the plane-wave basis set based on a pseudo-potential framework as incorporated in the Vienna ab-initio simulation package (VASP) [16, 17]. The exchange-correlation functional was employed following the Perdew-Burke-Ernzerhof (PBE) prescription [18]. The effect of the spin-orbit coupling (SOC) is introduced as a full-relativistic correction term to the Hamiltonian. For the plane-wave basis, a 350 eV cut-off was applied. To take care the missing onsite Coulomb, we have used = 6 eV for the Gd, where , is the onsite Coulomb interaction and is the Hund’s coupling term [19, 20]. The structural optimization was performed by relaxing the internal atomic positions toward the equilibrium until the Hellman-Feynman force becomes less than 0.001 eV Å-1. A k-point mesh of 6 6 6 in the Brillouin zone (BZ) and the electronic convergence criteria were set to be at 10-7 eV for self-consistent calculations.
IV Experimental Results
IV.1 Magnetization
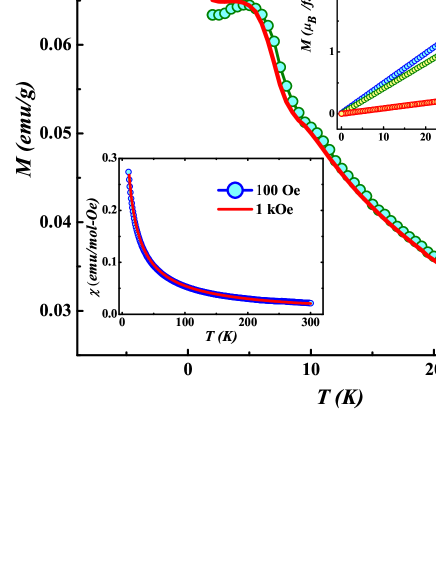
GdPd2Bi is found to order antiferromagnetically at = 7 K as shown in the main panel of fig 1. A weak bifurcation between field-cooled (FC) and zero-field-cooled (ZFC) magnetization () was observed below about 4 K. The dc magnetic susceptibility (, is the applied magnetic field) between 20 to 300 K can be well-fitted with the Curie-Weiss law: , where is the Curie constant and is the paramagnetic Weiss temperature. From the good fitting of the vs [not shown here], we get the effective paramagnetic moment, = 8.0 /f.u and = 18 K. The half-filled shell of the free Gd3+ has the effective moment 7.9 , which is close to the observed value. The negative value of confirms the antiferromagnetic (AFM) correlation in the system. The isothermal magnetization curves [upper inset of fig 1], measured up to = 70 kOe, are found to be linear at = 5, 10 and 150 K. The linear isotherm even at 5 K supports the AFM nature of the magnetic ordering.
IV.2 Electrical Resistivity
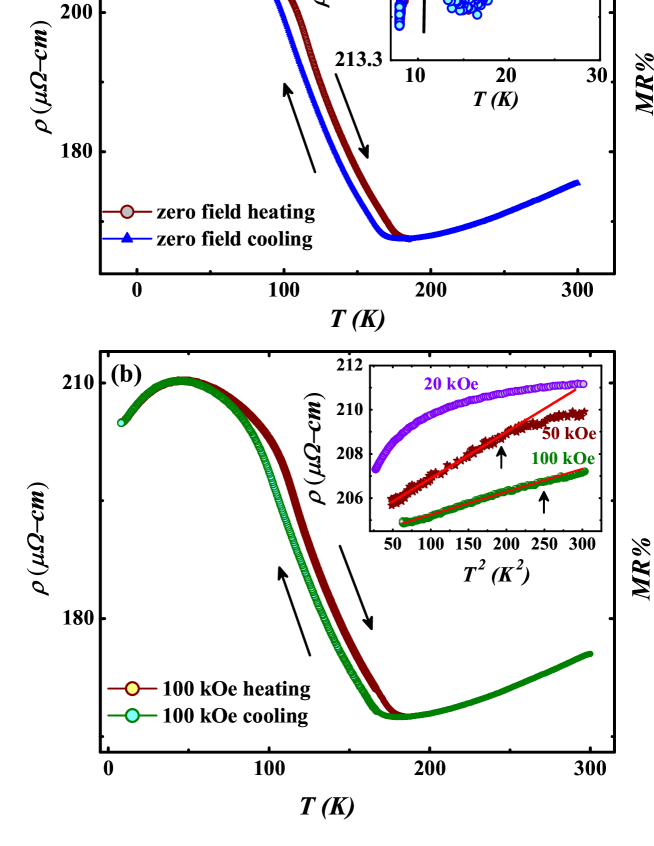
The most fascinating observation in the present work is obtained from the transport measurement. The -variation of for GdPd2Bi in presence of = 0 and 100 kOe is presented in figs. 2 (a) and (b) respectively. The sample shows conventional decrease in with temperature down to around = 180 K. On further cooling, follows an upturn with decreasing down to around 30 K and eventually it shows a saturating tendency. The signature of AFM ordering is also present in the zero-field low temperature data [see the inset of fig. 2 (a)] The region of upturn shows clear thermal hysteresis indicating the transition to be first order in nature. Similar upturn was previously observed in case of other members of the family, namely HoPd2Bi and DyPd2Bi [13]. Since we do not observe any feature between 100 - 200 K in the vs data, the observed transition is likely to be purely structural in nature.
The thermal hysteresis and the upturn survive even under an applied field of 100 kOe, and there is no significant change in the position of the upturn and the width of the thermal hysteresis. However, we observe a decrease in the value of under signifying negative magnetoresistance. Notably, a clear drop in is observed below about 40 K [as evident from fig 2(b)], which indicates the emergence of a magnetic field-induced metallicity in GdPd2Bi. The peak due to the AFM ordering in zero field [inset of fig. 2 (a)] vanishes for 20 kOe. Inset of fig. 2(b) shows the versus plot below = 20 K for different values of applied . The system deviates completely from behaviour for 20 kOe. It is evident that follows a dependence for = 100 kOe below about 16 K, while similar variation is observed below 14 K for = 50 kOe. Such variation of is commonly attributed to electron-electron scattering in the Fermi liquid theory of metals. The coefficient of the term is found to be = 1.3 10-8 and 2.4 10-8 -cm K-2 at 100 and 50 kOe, respectively. The value of is about one order of magnitude higher than the conventional metals such as Cu [21].
The region of upturn in the data around 180 K is associated with the negative temperature coefficient of resistivity ( 0), and such behavior is generally observed in insulators, semiconductors or semimetals. However, the present rise can be ascribed to the structural transition, which is evident from our later analysis. It is interesting to note that similar upturn in resistivity is observed in case of several Ni-Mn-Z ( = In, Sn , Sb)-based shape memory alloys around the martensitic transition [22, 23, 24, 25].
To shed more light on the occurrence of field-induced metallicity, we have measured the field variation of up to 150 kOe at = 5 K and 10 K that eventually leads to a large negative magnetoresistance [ = ] of around 16% and 9% respectively. Hence, a conventional positive contribution from the Lorentz force can be ruled out for GdPd2Bi. Interestingly, the negative MR in bulk GdPd2Bi sample is ‘non-saturating’ in nature and follows the form - [fig. 2(c)] for as high as 150 kOe. In addition, it is interesting to note that the negative MR persists in the compound for as high as 120 K, which is much higher than the magnetic transition temperature ( = 7 K), although the magnitude of MR decreases with increasing [fig. 2 (d)].
The MR can also be discussed in the framework of the semiclassical Kohler approach. In a single-band system with uniform scattering at all points on the Fermi surface, Kohler’s scaling is often found to be valid and is expressed as
| (1) |
where is a temperature-independent implicit function [26]. versus measured at different temperatures should fall into a single curve. However, deviation from the general Kohler plot can be attributed to the reconstruction of Fermi surface for nesting and/or to the existence of multi-carrier electronic transport [28, 27, 29]. Interestingly the title compound is found to violate the Kohler’s rule (not shown here) which might be due to the existence of two type of carriers.
IV.3 Heat capacity
Fig. 3(a) presents the low temperature data measured in zero magnetic field as well as under = 60 kOe. The zero-field data show a clear -like anomaly around 9.5 K, which matches well with the AFM transition observed in the magnetization data. Under the application of 60 kOe magnetic field, the transition does not get suppressed, albeit the peak slightly shifts towards lower (8.5 K). We have also calculated the change in entropy () due to the the application of (magneto-caloric effect) [30] around using the following relation.
| (2) |
is found to be negative with a sharp anomaly at the magnetic transition temperature [inset of fig. 3(a)]. attains a moderate value of 2 J/kg-K at , which is connected to the field induced shift of to lower .
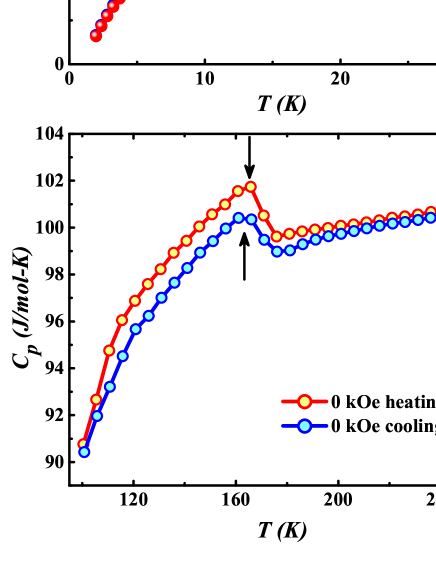
At high temperature, vs data shows a peak around = 162 K for both 0 kOe and 60 kOe measurements [fig. 3(b)]. The peak in occurs around the temperature where the upturn in the data is observed. Such feature is associated with the structural phase transformation as mentioned in section F. The data around do not show any change due to the application of . Interestingly, the heating and the cooling data show thermal hysteresis around this structural transition, which mimics the similar observation in the measurements. The value at 300 K is found to be pretty close to the value obtained by using the Dulong-Petit method (= 3, where is the universal gas constant and (= 4 here) is the number of atoms per formula unit) for the sample ( 100 J/mol-K).
IV.4 Thermopower
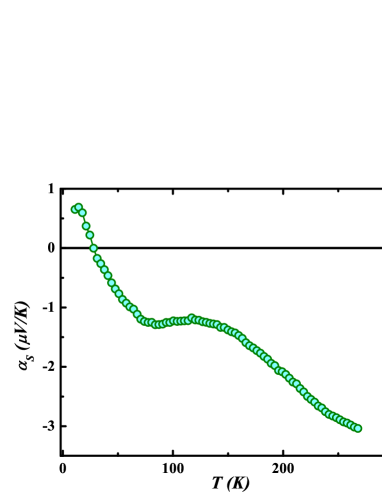
We have performed the thermopower measurement in terms of Seebeck coefficient () [31] in zero field as shown in fig. 4. GdPd2Bi shows negative value of between 25 - 270 K attaining a maximum value with magnitude 3 V/K. shows a hump-like feature around 140 K, which matches well with the feature observed in the data. Interestingly, changes its sign and turns positive below 25 K and attains a value of 1 V/K at 12 K, which may be due to the presence of both electrons and holes in the system. In a two-carrier system the thermopower is often expressed as
| (3) |
where is the electrical conductivity and the subscripts and denotes the hole and electron contributions, respectively. Thus, eqn 3 makes it clear that, might exhibit change in sign with temperature in the case of a two carrier system [28]. Notably, we find that GdPd2Bi is the only compound in the REPd2Bi series which predominantly shows negative value of [13]. On the other hand, REPd2Sb compounds show negative value but they do not undergo any structural transition (lack of thermal hysteresis) [13, 32]. Bi-based compounds are often found to be potential candidates for thermoelectric applications [33]. But in case of GdPd2Bi, the power factor (PF) is rather low ( 25 W m-1K-2).
IV.5 Hall measurements
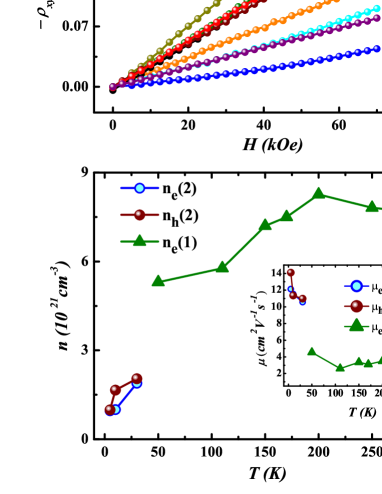
The Hall resistivity () for GdPd2Bi was determined as the antisymmetric part of the measured transverse voltage, = t[(+) - (-)]/2, where is the thickness of the sample, is the applied current and is the transverse voltage generated. Variation of with measured at different constant temperatures up to = 70 kOe is depicted in fig. 5(a) [40, 41]. The negative value of at all measured temperatures indicates electron to be the majority carrier in the system. As temperature is lowered from room temperature, vs show linear variation above about 30 K. However, on further lowering of , turns non-linear for 30 K suggesting that a simple picture of the single-carrier model for the conventional Hall effect is inadequate for the sample, at least below 30 K.
We have depicted the -variation of / in the inset of fig. 5(a), and it is strongly -dependent along with a clear anomaly around the temperature of thermal hysteresis observed in the data.
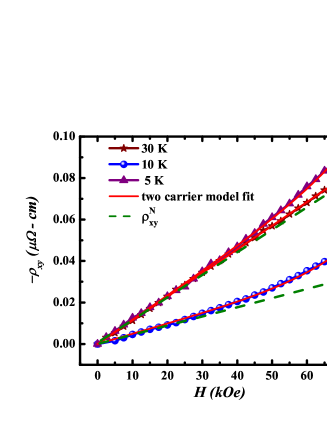
As mentioned earlier, the Hall resistivity at low- ( = 5 K, 10 K and 30 K) shows a non-linear nature and follows a concave upward shape as can be seen from the fig 6. The non-linearity at low- may arise either due to the presence of more than one charge carrier or due to the anomalous Hall contribution [42]. Since the sample shows a perfect linear variation of with [see upper inset of fig. 1], the nonlinearity of the cannot be simply attributed to the anomalous Hall effect (AHE) of magnetic origin. Notably, turns from negative to positive below about 25 K. Such behavior may be due to the presence of both electrons and holes in the system. Therefore, a multiband model consisting of holes and electrons seems logical to describe the nonlinearity in .
We invoked the following two carrier model to fit the Hall resistivity [43]:
| (4) |
Here , , and are the carrier density and mobility of hole(h) and electron(e) respectively. As can be seen from fig. 6, for = 5, 10 and 30 K can be fitted with eqn. 4 suggesting that the two carrier model can successfully describe the experimentally measured data below about 30 K. However, the linear nature of versus above 30 K prompted us to express the Hall resistivity data via an effective single-carrier model, where the normal Hall-coefficient ( = ) is calculated from the slope of high-field (40 kOe 70 kOe) data. Hence, is fitted with two different models for 30 K regime and 30 K temperature range, where two-carrier and single-carrier models respectively, gives best fit of the experimental data [44, 45].
The temperature dependence of the carrier concentration ( and ) and Hall mobility ( and ) are shown in fig. 5(b). The extracted value of electron carrier concentration increases from 9.6 1020 cm-3 at 5 K (derived from two carrier model) to 7 1021 cm-3 (obtained from single carrier model, ) at room temperature for GdPd2Bi which is in line with the typical of semimetallic materials [46, 47]. The Hall mobility () is also deduced from the linear fitting of the data using the equation: = /( = 0). decreases with increase in and then saturates at higher temperatures above about 110 K [see inset of fig 5(b)]. With lowering of , increases slightly down to 200 K and then decreases sharply, around the temperature range where the thermal hysteresis is observed. Thereafter, it continues to decreases down to 5 K.
IV.6 Temperature evolution of structural parameters
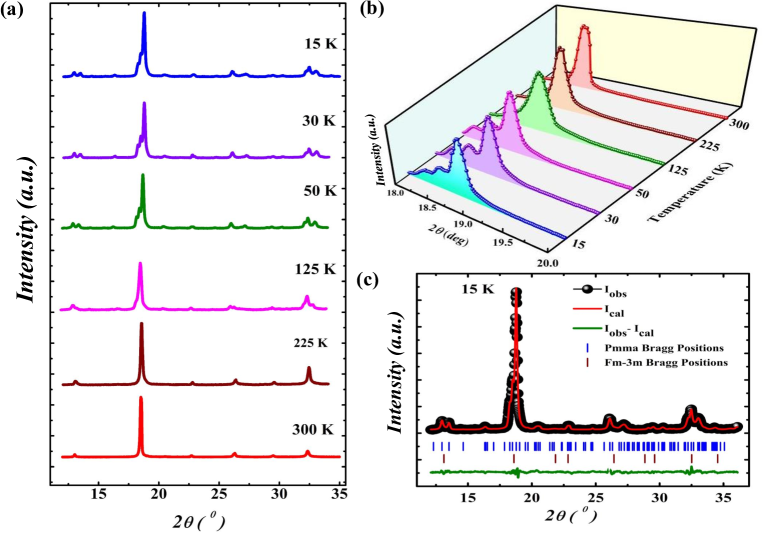
Synchrotron diffraction performed at different constant temperatures are plotted in fig. 7(a). It shows [see figs. 7(a) and (b)] the change in the pattern as is lowered from 300 K to 15 K. To highlight the change, the temperature evolution of the most intense (220) peak of the cubic phase is shown in fig. 7(b). Splitting of the main peak with the decrease in is consistent with the loss of cubic symmetry, and the structure presumably attains a lower symmetry. Earlier Gofryk et. al. proposed the existence of a structural transition in the REPd2Bi series of compounds [13], and the low- crystal structure was reported to be orthorhombic () [14].
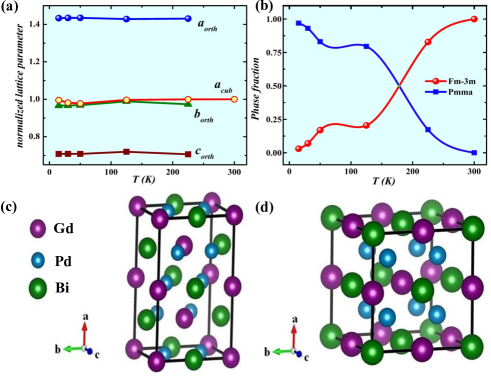
We have carefully analyzed the data using Rietveld refinement technique and the fitted data for the representative temperature 15 K are shown in fig. 7(c). We used ISODISTORT [48, 49] software to identify all the possible list of non-cubic, non-isomorphic subgroups of the parent cubic structure. We find that the orthorhombic generates all the experimentally observed reflections correctly and converge well with the data. In the intermediate temperatures, both cubic and orthorhombic structures co-exist and we have considered both the phases to refine the diffraction data. The thermal evolution of the lattice parameters is plotted (with respect to the cubic lattice parameter, ) in fig. 8(a). The refined lattice parameters for the cubic (at 300 K) and orthorhombic (at 15 K) phases are found to be = 6.812(6) Å and = 9.766(1) Å , = 6.582(5) Å and = 4.824(1) Å respectively. In case of a cubic to orthorhombic structural phase transition, the lattice parameters for the low-temperature (LT) orthorhombic unit cell is associated to the high-temperature (HT) cubic structure by the relation: = , = and = [50]. The ratio turns out be close to 0.75 indicating considerable distortion of the cubic cell as temperature is lowered. The cell volume around the thermal hysteresis regime changes around 2% between the low- and high-temperature phases which is similar to the cell volume change of the ferromagnetic shape memory alloy, Ni2MnGa [50]. The atomic positions for the cubic and orthorhombic structures are given in table 1. These values are similar to those of other Heusler-based shape memory alloys, such as Co2NbSn [51] and Ni2.04Mn1.4Sn0.56 [52], undergoing martensitic type phase transition.
For the 15 K data, there is a finite percentage of cubic phase present suggesting the co-existence of both the phases even at low- region. The variation of phase fraction consisting of the orthorhombic phase and cubic phase with temperature is presented in fig. 8(b). Increase in the fraction of orthorhombic phase along with the decrease of cubic phase with decrease in temperature can be clearly observed. This observation supports the occurrence of phase transformation, as also evident from the thermal hysteresis in the vs data along with the anomaly in the high temperature data.
| Temperature (K) | 300 | 15 |
| Structure/space group | L21 cubic mm | Orthorhombic |
| Cell parameters | = 6.812(6) Å | = 9.766(1) = 6.582(5) = 4.824(1) Å |
| Cell volume (Å3) | 316.24(1) | 309.63(5) |
| Standard deviation () | 1.77 | 1.56 |
| Atoms | Site x y z Biso | Site x y z Biso |
| Gd | 4b 0.5(3) | 2a 0 0 0 1.1(2) |
| 2f 0.509(1) 0.9(1) | ||
| Pd | 8c 0.4(4) | 4h 0 0.266(5) 0.7(1) |
| 4k 0.265(2) 0.031(9) 0.45(9) | ||
| Bi | 4a 0 0 0 1.1(9) | 2b 0 0 1.2(1) |
| 2e 0 0.503(3) 1.1(5) | ||
V Theoretical Results
V.1 Density of states
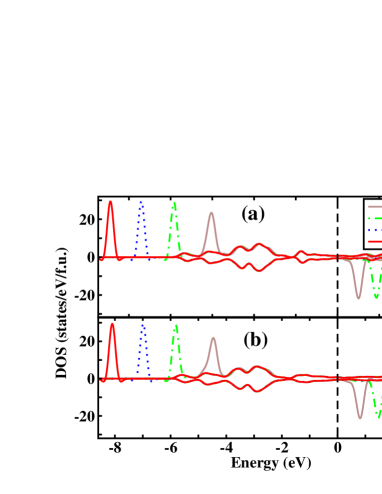
The first principles electronic structure calculations have been done for both LT and HT phases of GdPd2Bi. The calculated spin polarized GGA+ density of states (DOS) are shown in fig. 9(a) and fig. 9(b) for high and low temperature phases of GdPd2Bi respectively. From the DOS, it is clear that both the high and low temperature phases are metallic in nature with small but finite DOS contributions at the Fermi energy in the both spin channels. The calculated spin magnetic moments at the position of Gd ions/site is 7.10 /site for both high temperature cubic and low temperature orthorhombic structures. Whereas, the induced magnetic moment at the Pd and Bi is very small around -0.03. Point to be noted that, the induced moment at the Pd and Bi sites are of opposite sign to that of the sign of the Gd magnetic moment. The electronic structures of both low and high temperature phases have been verified by varying the onsite Coulomb correlations i.e. from 0 to 6 eV at the rare-earth element Gd site. As the onsite coulomb correlation increases, the Gd- states are moving apart as shown clearly in fig. 9, without opening any gap at the Fermi energy, confirming the robustness of the metallic nature of the electronic structure.
V.2 Magnetic configuration
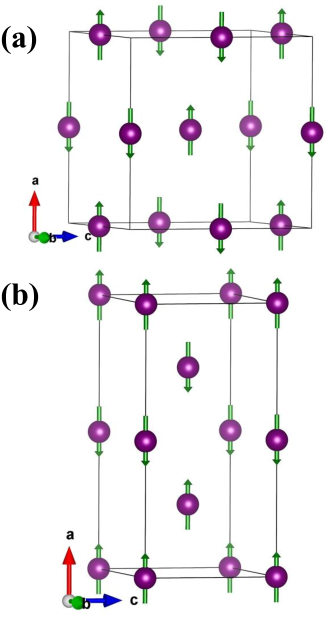
Experimentally, it has been found that the antiferromagnetic correlation for both high and low temperature. Therefore, it is pertinent to calculate the total energies of different spin configurations for both HT and LT structures. The calculated energetics are shown in table II. The results show that in both the structures the AFM configuration is energetically lower than the ferromagnetic configuration by 3.77 (2.95) meV/f.u. for HT (LT) structures (as mentioned in table 2). We have calculated various other spin configurations as well. However, the presented spin configurations in fig. 10 are energetically lower than the other antiferromagnetic configurations. In the HT cubic structure, the Gd only sublattice as shown in the fig. 10(a) forms an regular tetrahedral unit with spin arrangement. On the contrary, in the case of LT orthorhombic structure, due to reduction of the symmetry, the Gd atoms form an isosceles triangle with antiferromagnetic arrangement. As a whole, the spins on the Gd atoms are arranged parallel in the bc plane and coupled anti parallel along the crystallographic a direction.
| Phase | Configuration | Gd1 | Gd2 | Gd3 | Gd4 | E (meV) |
| HT | FM | 3.77 | ||||
| AFM | 0.0 | |||||
| LT | FM | 2.95 | ||||
| AFM | 0.0 |
V.3 Band structure
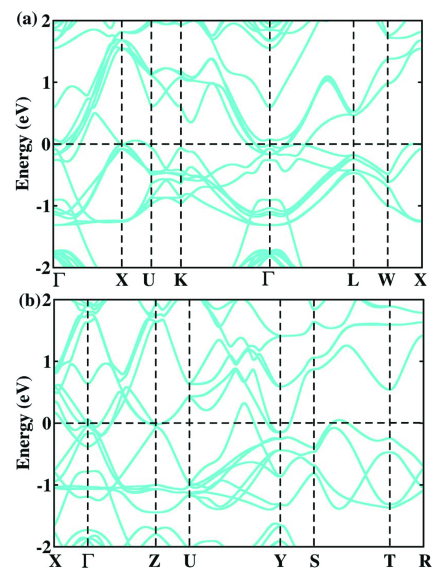
The robustness of the metallicity and the electronic structure has been also analysed in the presence of the spin-orbit coupling for both HT and LT phases. The fig. 11 shows the band structure in presence of the Coulomb correlation and the SOC in the AFM ground state spin configurations. From the band structure it is very clear that even in the presence of the SOC and AFM correlation, the metallicity is preserved. Moreover, careful investigation reveals that for both the HT (fig. 11(a)) and LT (fig. 11(b)) configurations, the valence and conduction bands cross the Fermi energy. For example, in the HT cubic phase, the valence bands cross the Fermi energy in the X-U direction of the BZ, whereas the conduction bands in multiple region such as K--L and -X in the BZ. Similarly, for the LT phases, the conduction bands cross the about the , Z and Y points in the BZ. However, the valence bands cross the along the X--Z, U-Y and S-T directions in the BZ. The bands that cross the Fermi energy dominantly contribute from the Pd-4d and Bi-5p orbitals. The effect of SOC on the magnetic moment is minimal, except that there is small orbital magnetic moment at the Gd site of the order of 0.02 .
V.4 Fermi surface
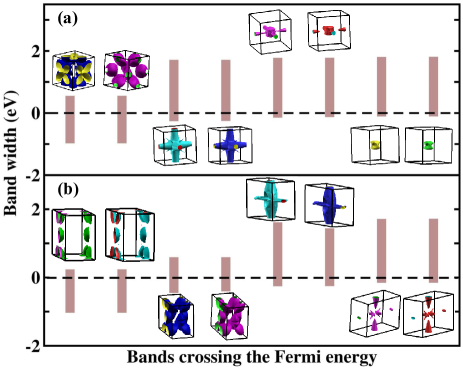
We have plotted the band width crossing the , and the corresponding Fermi surfaces in presence of the SOC for both HT and LT phases in fig. 12(a) and (b), respectively. From the band widths, it is clear that both electron pockets and hole pockets are present in both HT and LT phases of the title compound. However, careful investigation of the fig. 11 and 12, confirms that the hole pocket is more dominant in the LT phase than the HT phase. In fig. 12(a), the bands crossing the Fermi energy and forming electron pockets are predominant in nature. The corresponding Fermi surfaces are also shown in the inset of fig. 12. From fig. 12(a) insets, it is clear that the electron pocket Fermi surfaces are mainly three types, whereas- the hole pocket Fermi surfaces are of one type, with complicated nesting in the BZ. The electron pockets are mostly located around the point, and the hole pockets are at the edge of the BZ near the high symmetry and points. Interestingly, although there are some hole pockets in the Fermi surface, the dominant carriers are still the in electron pockets in the BZ. The LT case is not exactly same as that of the HT in the context of the carrier pockets in the BZ. In fig. 12(b) insets, the Fermi surfaces of the electron and hole pockets are shown for the LT phase, which has few distinct difference compared to that of the HT phase. In the LT phase, the contribution of the electron pocket Fermi surfaces has decreased, whereas- the contribution of the hole pocket Fermi surfaces has increased, compared to that of the HT phase. In fig. 12(b), the hole pockets form two different kind of the Fermi surfaces located around the point and spans larger areas in the BZ. Therefore, from the Fermi surface plots, it is clear that in both HT and LT phases, electrons and holes contribute in the carrier type, however, in the LT phase, the hole contributions have increased compared to that of the HT phase.
VI Discussion
The structural transition from cubic to low-symmetry phase is already reported for REPd2Bi (RE = Dy and Ho) [13]. However, Gd with orbital angular momentum = 0 at the ground state, is electronically different from the other rare-earth ions. Nevertheless, the observation of structural phase transition indicates that orbital moment has little effect on the phenomenon.
GdPd2Bi depicts thermal hysteresis in the electrical transport measurement around the structural transition. At high temperatures ( 200 K), the is metallic followed by an upturn below 200 K, and this region of upturn shows thermal hysteresis indicating a first order phase transition. Evidently, this upturn manifests the structural transition observed in our PXRD data [see fig 8]. At lower temperatures below 30 K, the resistivity shows a saturating tendency, which eventually turns metallic under the application of . Such sharp decrease in under in the low- region has also been reported in another half-Heusler compound HoNiSb, which is predominantly semiconducting in nature. In case of HoNiSb, such decrease in in the low temperature, has been attributed to the reduction of spin-disorder scattering due to the alignment of moments under the application of , and the reduction of the gap occurring due to the splitting of the up and down spin subbands [53]. It is interesting to note that the has remarkable similarities with several transition metal-based shape memory alloys undergoing martensitic phase transition (MPT), where sharp and hysteretic rise in between two metallic phases is observed. The common examples are Ni-Co-Al, Ni-Mn-Sn, Ni-Mn-In etc [24, 25, 22, 50]. In case of one such Ni-Mn-Sn alloys (nominal composition, Ni2Mn1.4Sn0.6), the rise in around the MPT is about 36%, which is comparable to 43% rise in the presently studied GdPd2Bi.
The analysis of our dependent PXRD data indicates that the sample undergoes structural transition from cubic () to orthorhombic () structure [see fig 7]. For GdPd2Bi, we observe robust Bain distortion [54, 50] between cubic and orthorhombic cell parameters: , and . Similar lattice transformation is also observed in case of Co2NbSn, Ni2Mn1.44Sn0.56 and Ni2Mn1.48Sb0.52 samples across the MPT [51, 52]. For GdPd2Bi, we observe a 1.5% change in lattice volume across the transition, although the lattice distortion is significant. MPT is a shear-dominated non-diffusive solid to solid phase transition, where the volume change is small [55]. Therefore, the observed transition in GdPd2Bi is likely to be martensitic-type. The MPT in GdPd2Bi is clearly first order in nature, which is supported by the phenomenon of phase coexistence obtained from our PXRD data. The further observe thermal hysteresis in our data, which strengthens the first order nature of the MPT.
Another important feature is the occurrence of large negative MR in the title compound. The MR follows an dependence up to 150 kOe of field and it remains unsaturated. The negative MR is prevalent in the PM phase well above the AFM transition temperature. There are reports of negative MR in several other intermetallic AFM compounds in the PM phase, such as Gd2PdSi3, GdSi, GdNi2Si2, FeSe2 [56, 57, 58, 59] and so on. For GdNi2Si2 negative is found both in the PM () state and also below varying almost quadratically with . Such behavior, is not attributed to the Kondo effect due to the well-localized character of Gd electrons, but rather depends on the spin fluctuations in the Ni band [58]. The negative MR close to arises due to the suppression of spin fluctuations by the magnetic field. However, for some compounds (e.g., Gd2PdSi3, GdSi), considerable MR exists well above , and it is attributed to the formation of magnetic-polarons. The applied field aligns these magnetic polaron (local FM clusters) leading to the reduction of spin-dependent scattering [57].
From a theoretical point of view, Usami et al. [60] studied the MR response of AFM metal in the light of model of electrons. In presence of fluctuating moments from electrons, the calculation shows a quadratic dependence of negative MR at low field even in the PM, which eventually saturates at higher fields.
In case of GdPd2Bi, finite negative MR is observed for temperature as high as 150 K [see fig. 2(d)] and it is quite unlikely to observe antiferromagnetic fluctuations at temperatures much higher than the . A polaronic picture can be mooted for GdPd2Bi similar to Gd2PdSi3 or GdSi. However, the magnetic susceptibility of GdPd2Bi shows a perfect Curie-Weiss behavior down to about 15 K, and the data recorded at = 100 Oe and 1 kOe overlap with each other (see lower inset of fig 1). This does not support the picture of spin fluctuations or magnetic polarons, as they would lead to the deviation from the Curie-Weiss law. Additionally, had the MR been related to the spin-fluctuation or magnetic polarons, one would expect a saturation or tendency towards saturation at higher fields. However, we observe a robust behaviour even at a field as high as 150 kOe. At such a high field, the spin-fluctuation should get completely suppressed or the polarons would have melted. Therefore, a simple spin-fluctuation or polaronic model may not be appropriate here.
GdPd2Bi shows martensitic transition, and it may contain martensitic variants at low temperature [61]. It has been found (specially in case of ferromagnetic shape memory alloys) that a magnetic field can induce a reverse transition from martensite to austenite leading to negative MR. However, for GdPd2Bi, we found that the martensitic transition temperature is completely insensitive of , and therefore, such phenomenon can be ruled out.
A non-saturating positive MR varying quadratically with is not uncommon. There are several systems having non-trivial topology in their electronic structure, which show nonsaturarting positive MR [62, 63, 64, 65, 66]. However, the presently studied compound does not belong to that category. Saini et al. recently reported quadratically varying positive MR in the single crystal sample of PtAl [67]. The Fermi surface contains both electron and hole pockets similar to the presently studied compound. It appears that the negative MR in GdPd2Bi does not have a magnetic or structural origin, and it is possibly connected to the complex nature of the Fermi surface.
The most fascinating feature here is the presence of distinct thermal hysteresis in the vs data both in zero field as well as = 100 kOe. Thermal hysteresis in vs data is a common feature in the case of Ferromagnetic shape memory alloys (FSMAs) (such as Co–Ni–Al, Ni-Mn-Sn) that undergo a first order phase transition from austenite (cubic) to martensitic (orthorhombic/hexagonal/tetragonal/monoclinic) phase. Interestingly, similar scenario of martensitic phase transformation occurs for GdPd2Bi.
Further evidence in support of occurrence of first order transition is seen from the and versus data. A broad anomaly is observed in around 160 K. First order martensitic phase transitions often give rise to an anomaly in , which is of finite width as a result of the system not being in thermal equilibrium [51].
The value for GdPd2Bi is negative for 25 K and positive below it. Interestingly, the sign of is negative indicating electrons to be the dominant charge carrier in GdPd2Bi, which is in line with . However, below about 30 K, the turns non-linear indicating the significant contribution of holes in addition to electrons in the system. It might be possible that the contribution from hole carriers becomes significant for 30 K, which in turn leads to small positive value of . The Fermi surface plot also shows that both HT and LT, two types of carriers i.e. electron and hole exist. However, in the LT phase, the hole contribution as a carrier is more prominent than the HT phase.
VII Summary and Conclusions
An in-depth study of structure, magnetic and electronic ground state of full Heusler GdPd2Bi compound is presented via x-ray diffraction, magnetization, magnetotransport, thermal transport and heat capacity measurements with further support from DFT calculations. Magnetic study reveal that the compound orders antiferromagnetically at around 7 K. The total energy calculations further confirm that the antiferromagnetic correlation is dominant over the full polarized spin configuration for GdPd2Bi. Magnetotransport study reveals uncharacteristic thermal hysteresis in 100-200 K range, while no corresponding singularities are observed in the magnetic data. In addition, a fairly high quadratic and nonsaturating magnetoresistance has been observed in this compound. We propose that the negative MR is not directly related to the magnetic properties of the material, rather it arises from the complex nature of the Fermi surface with nesting and electron/hole pockets [68]. Detailed structural analysis reveal a martensitic type structural phase transition is likely to be associated with the thermal hysteresis and no gap opening occurs at for both HT and LT phases. The Hall measurement and electronic structure calculations in presence of SOC corroborate complex character of the electronic structure near Fermi surface due to the presence of both electron and hole bands in poor metallic GdPd2Bi. SOC is an important parameter in rare-earth based systems which significantly influences physical properties in a system. Tuning the electronic structure can be possible by altering the rare-earth element in REPd2Bi series. Therefore, our work not only present a thorough study on GdPd2Bi, but also would boost interest for further investigation on the other members of the REPd2Bi family.
Acknowledgment
Snehashish Chatterjee, Prabir Dutta and Surasree Sadhukhan would like to acknowledge Univerisity Grants Commission (India), Science and Engineering Research Board (Grant No. PDF/2017/001061), and IIT Goa respectively for their research fellowship. Sudipta Kanungo thanks Department of Science and Technology, Govt. of India for providing an INSPIRE faculty research grant [Grant No. DST/INSPIRE/04/2016/000431; IFA16-MS91]. UGC DAE-CSR, Indore, and Kolkata Centers are duly acknowledged for low-temperature transport and heat-capacity measurements. The authors would like to sincerely acknowledge the Indian beamline facility at Photon Factory, KEK, Tsukuba, Japan for low temperature synchrotron x-ray diffraction measurement.
References
- [1] B.R.K. Nanda, I. Dasgupta, J. Phys.: Condens. Matter 15, 7307 (2003).
- [2] T. Graf, C. Felser, S.S.P. Parkin, Prog. Sol. Stat. Chem. 39, 1 (2011).
- [3] K. Özdogan, E. Şaşıoğlu and I. Galanakis, J. Appl. Phys. 113, 193903 (2013).
- [4] T. Krenke, E. Duman, M. Acet, E.F. Wassermann, X. Moya, L. Mañosa, A. Planes,Nat. Mater. 4, 450 (2005).
- [5] S. Chatterjee, S. Chatterjee, S. Giri, and S. Majumdar, J. Phys.: Condens. Matter 34, 013001 (2022).
- [6] M. Ishikawa, J. L. Jorda, and A. Junod, Superconductivity in d- and f-Band Metals (Kernforschungszentrum, Karlsuhe), 1982 p. 141.
- [7] M. J. Johnson and R. N. Shelton, Solid State Commun. 52, 839 (1984).
- [8] S.K. Malik, A.M. Umarji,and G.K. Shenoy Phys. Rev. B 31, 11 (1985).
- [9] H. Lin, L. A. Wray, Y. Xia, S. Xu, S. Jia, R. J. Cava, A. Bansil and M. Z. Hasan, Nature Mat. 9, 546 (2010).
- [10] W. Al-Sawai, Hsin Lin, R. S. Markiewicz, L. A. Wray, Y. Xia, S.-Y. Xu, M. Z. Hasan, and A. Bansil, Phys. Rev.B 82, 125208 (2010).
- [11] C. Shekhar, S. Ouardi, A. K. Nayak, G. H. Fecher, W. Schnelle, and C. Felser, Phys. Rev. B 86, (2012) 155314.
- [12] C. Shekhar, N. Kumar, V. Grinenko, S. Singh, R. Sarkar, H. Luetkens, S.-C. Wu, Y. Zhang, A. C. Komarek, E. Kampert, Y. Skourski, J. Wosnitza, W. Schnelle, A. McCollam, U. Zeitler, J. Kübler, B. Yan, H.-H. Klauss, S. S. P. Parkin, and C. Felser, Proc. Natl. Acad. Sci. U. S. A. 115(37), 9140 (2018).
- [13] K. Gofryk, D. Kaczorowski, T. Plackowski, A. Leithe-Jasper and Yu. Grin, Phys. Rev. B 72, (2005) 094409.
- [14] K. Gofryk, ‘Thermoelectric properties 4 and 5-Heusler electronic phases RPdX and RPd2X (X = Sb and Bi)’, Institute of Low Temperature and Structure Research, Polish Academy of Sciences, Wrocław, Poland (2005).
- [15] http://maud.radiographema.eu.
- [16] G. Kresse and J. Hafner, Phys. Rev. B , 558(R) (1993).
- [17] G. Kresse and J. Furthmüller, Phys. Rev. B , 11169 (1996).
- [18] J. P. Perdew, K. Burke, and M. Ernzerhof, Phys. Rev. Lett. , 3865 (1996).
- [19] V. I. Anisimov, I. V. Solovyev, M. A. Korotin, M. T. Czyzyk, and G. A. Sawatzky, Phys. Rev. B , 16929 (1993).
- [20] S. L. Dudarev, G. A. Botton, S. Y. Savrasov, C. J. Humphreys, and A. P. Sutton, Phys. Rev. B , 1505 (1998).
- [21] S. Chatterjee, P. Dutta, S. Giri, S. Majumdar, S. Sadhukhan, S. Kanungo, S. Chatterjee, M. M. Patidar, G. S. Okram and V. Ganesan, Phys. Rev. B 102, 214443 (2020).
- [22] P. J. Brown, A. P. Gandy, R. Kainuma, T. Kanomata, K. U. Neumann, K. Oikawa, B. Ouladdiaf, A. Sheikh and K. R. A. Ziebeck, J. Phys.: Condens. Matter 23, 456004 (2011).
- [23] S. Chatterjee, S. Giri, S. Majumdar, and S. K. De Phys. Rev. B 77, 012404 (2008).
- [24] S. Chatterjee, S. Giri, S. Majumdar, and S. K. De Phys. Rev. B 77, 224440 (2008).
- [25] S. Chatterjee, M. Thakur, S. Giri, S. Majumdar, A.K. Deb, S.K. De, J. Alloys Compound, 456, 96 (2008).
- [26] M. Kohler, Ann. Phys. (Berlin) 424, 211 (1938).
- [27] K. K. Kolincio , M. Roman and T. Klimczuk Phys. Rev. Lett. 125, 176601 (2020).
- [28] C. Candolfi, A. Ormeci, U. Aydemir, M. Baitinger, N. Oeschler, Yu. Grin, and F. Steglich Phys. Rev. B 84, 205118 (2011).
- [29] A. Wang, D. Graf, Y. Liu, Q. Du, J. Zheng, H. Lei and C. Petrovic Phys. Rev. B 96, 121107(R) (2017).
- [30] K. A. Gschneidner, Jr. and V. K. Pecharsky, J. Rare Earths 24, 641 (2006).
- [31] H. Goldsmid, Thermoelectric Refrigeration (Temple Press Books Ltd., London) (1964).
- [32] D. Kaczorowski, K. Gofryk, T. Plackowski, A. Leithe-Jasper and Yu. Grin, J. Mag. Mag. Mater 290, 573 (2005).
- [33] K. Gofryk, D. Kaczorowski, T. Plackowski, A. Leithe-Jasper, and Yu. Grin Phys. Rev. B 84, 035208 (2011).
- [34] H. Hohl, A. P. Ramirez, W. Kaefer, K. Fess, C. Thurner, C. Kloc, and E. Bucher, MRS Proc. 478, 109 (1997).
- [35] H. Zhu, R. He, J. Mao, Q. Zhu, C. Li, J. Sun, W. Ren, Y. Wang, Z. Liu, and Z. Tang et al., Nat. Commun. 9, 1 (2018).
- [36] D. Young, P. Khalifah, R. Cava, and A. Ramirez, J. Appl. Phys. 87, 317 (2000).
- [37] H.-S. Kim, Z. M. Gibbs, Y. Tang, H. Wang, and G. J. Snyder, APL Mater. 3, 041506 (2015).
- [38] C.S. Lue, C.F. Chen, J.Y. Lin, Y.T. Yu, Y.K. Kuo, Phys. Rev. B 75, 064204 (2007).
- [39] C.S. Lue, J.W. Huang, D.S. Tsai, K.M. Sivakumar, Y.K. Kuo, J. Phys. Condens. Matter 20 255233 (2008).
- [40] A. C. Melissinos, Experiments in Modern Physics (Academic Press, An Imprint of Elsevier, California), pp. 86 (1966).
- [41] S. U. Jen, B. L. Chao, and C. C. Liu. J. Appl. Phys. 76, 5782 (1994).
- [42] A. Laha, R. Singha, S. Mardanya, B. Singh, A. Agarwal, P. Mandal and Z. Hossain, Phys. Rev. B 103, L241112 (2021).
- [43] J. Honig and T. Harman, Adv. Energy Convers. 3, 529 (1963).
- [44] G. Pokharel, S. M. L. Teicher, B. R. Ortiz, P. M. Sarte, G. Wu, S. Peng, J. He, R. Seshadri and S. D. Wilson, Phys. Rev. B 104, 235139 (2021).
- [45] Y. Yang, Y. Fu, W. Zhu, J. He, B. Liu, C. B. Liu, L. Li, C. Niu and Y. Luo, J. Phys.: Condens. Matter 34 315701 (2022).
- [46] F. G. Aliev, Physica B 171, 199 (1991).
- [47] I. M. Tsidilkovski, Electron Spectrum of Gapless Semiconductors, Springer Series in Solid-State Sciences 116 Springer,Berlin, New York, (1996).
- [48] H. T. Stokes, D. M. Hatch, and B. J. Campbell, ISODISTORT, ISOTROPY Software Suite, iso.byu.edu.
- [49] B. J. Campbell, H. T. Stokes, D. E. Tanner, and D. M. Hatch, J. Appl. Cryst. 39, 607 (2006).
- [50] P. J. Brown, A. P. Gandy, K. Ishida, R. Kainuma, T. Kanomata, K-U Neumann, K. Oikawa, B. Ouladdiaf and K. R. A. Ziebeck, J. Phys.: Condens. Matter 18, 2249 (2006).
- [51] K-U Neumann , T. Kanomata , B. Ouladdiaf and K. R. A. Ziebeck, J. Phys.: Condens. Matter 14, 1371 (2002).
- [52] J. Sannigrahi, S. Pramanick, S. Chatterjee, J. S. Lord, D. Khalyavin, A. D. Hillier, D. T. Adroja, and S. Majumdar Phys. Rev. B 99, 224401 (2019).
- [53] I. Karla, J. Pierre and R.V. Skolozdra, J. Alloys Compound 265, 42 (1998).
- [54] Sanjay Singh, B. Dutta, S.W. D’Souza, M.G. Zavareh, P. Devi, A.S. Gibbs, T. Hickel, S. Chadov, C. Felser and D. Pandey, Nat Commun 8, 1006 (2017).
- [55] V A Chernenko Scr. Mater. 40, 523 (1999).
- [56] R. Mallik et al E. Phys. Lett. 41, 315 (1998).
- [57] H. Li, Y. Xiao, B. Schmitz, J. Persson, W. Schmidt, P. Meuffels, G. Roth and T. Brückel Sci Rep 2, 750 (2012).
- [58] E. V. Sampathkumaran and I. Das, Phys. Rev. B 51, 8631 (1995).
- [59] H. Liu and Y. Xue Adv. Mater. 33, 2008456 (2021).
- [60] K. Usami, J. Phys. Soc. Jpn 45, 466 (1978).
- [61] B. Kiefer, and D. C. Lagoudas, Phil. Mag. 85, 4289 (2005)
- [62] M. Ali, J. Xiong, S. Flynn et al. Nature 514, 205 (2014).
- [63] C. Shekhar, A. Nayak, Y. Sun et al. Nature Phys 11, 645–649 (2015).
- [64] B. Wu , V. Barrena, F. Mompeän, M. G.-Hernändez, H. Suderow, and I. Guillamön Phys. Rev. B 101, 205123 (2020).
- [65] Z. Li, Y. Zeng, J. Zhang, M. Zhou, and W. Wu Phys. Rev. B 98, 165441 (2018).
- [66] Y. Li, L. Li, J. Wang, T. Wang, X. Xu, C. Xi, C. Cao, and J. Dai Rev. B 94, 121115(R) (2016).
- [67] V. Saini, S. Sasmal, R. Kulkarni, B. Singh, and A. Thamizhavel Phys. Rev. B 106, 125126 (2022).
- [68] O. Breunig, Z. Wang, A. A. Taskin, J. Lux, A. Rosch and Y. Ando Nat. Commun. 8, 15545 (2017).