FedGS: Federated Graph-based Sampling with Arbitrary Client Availability
Abstract
While federated learning has shown strong results in optimizing a machine learning model without direct access to the original data, its performance may be hindered by intermittent client availability which slows down the convergence and biases the final learned model. There are significant challenges to achieve both stable and bias-free training under arbitrary client availability. To address these challenges, we propose a framework named Federated Graph-based Sampling (FedGS), to stabilize the global model update and mitigate the long-term bias given arbitrary client availability simultaneously. First, we model the data correlations of clients with a Data-Distribution-Dependency Graph (3DG) that helps keep the sampled clients data apart from each other, which is theoretically shown to improve the approximation to the optimal model update. Second, constrained by the far-distance in data distribution of the sampled clients, we further minimize the variance of the numbers of times that the clients are sampled, to mitigate long-term bias. To validate the effectiveness of FedGS, we conduct experiments on three datasets under a comprehensive set of seven client availability modes. Our experimental results confirm FedGS’s advantage in both enabling a fair client-sampling scheme and improving the model performance under arbitrary client availability. Our code is available at https://github.com/WwZzz/FedGS.
Introduction
Federated learning (FL) enables various data owners to collaboratively train a model without sharing their own data (McMahan et al. 2017). In a FL system, there is a server that broadcasts a global model to clients and then aggregates the local models from them to update the global model. Such a distributed optimization may cause prohibitive communication costs due to the unavailability of clients (Gu et al. 2021).
As an early solution to this problem, (McMahan et al. 2017) propose to uniformly sample a random subset of clients without replacement to join the training process.
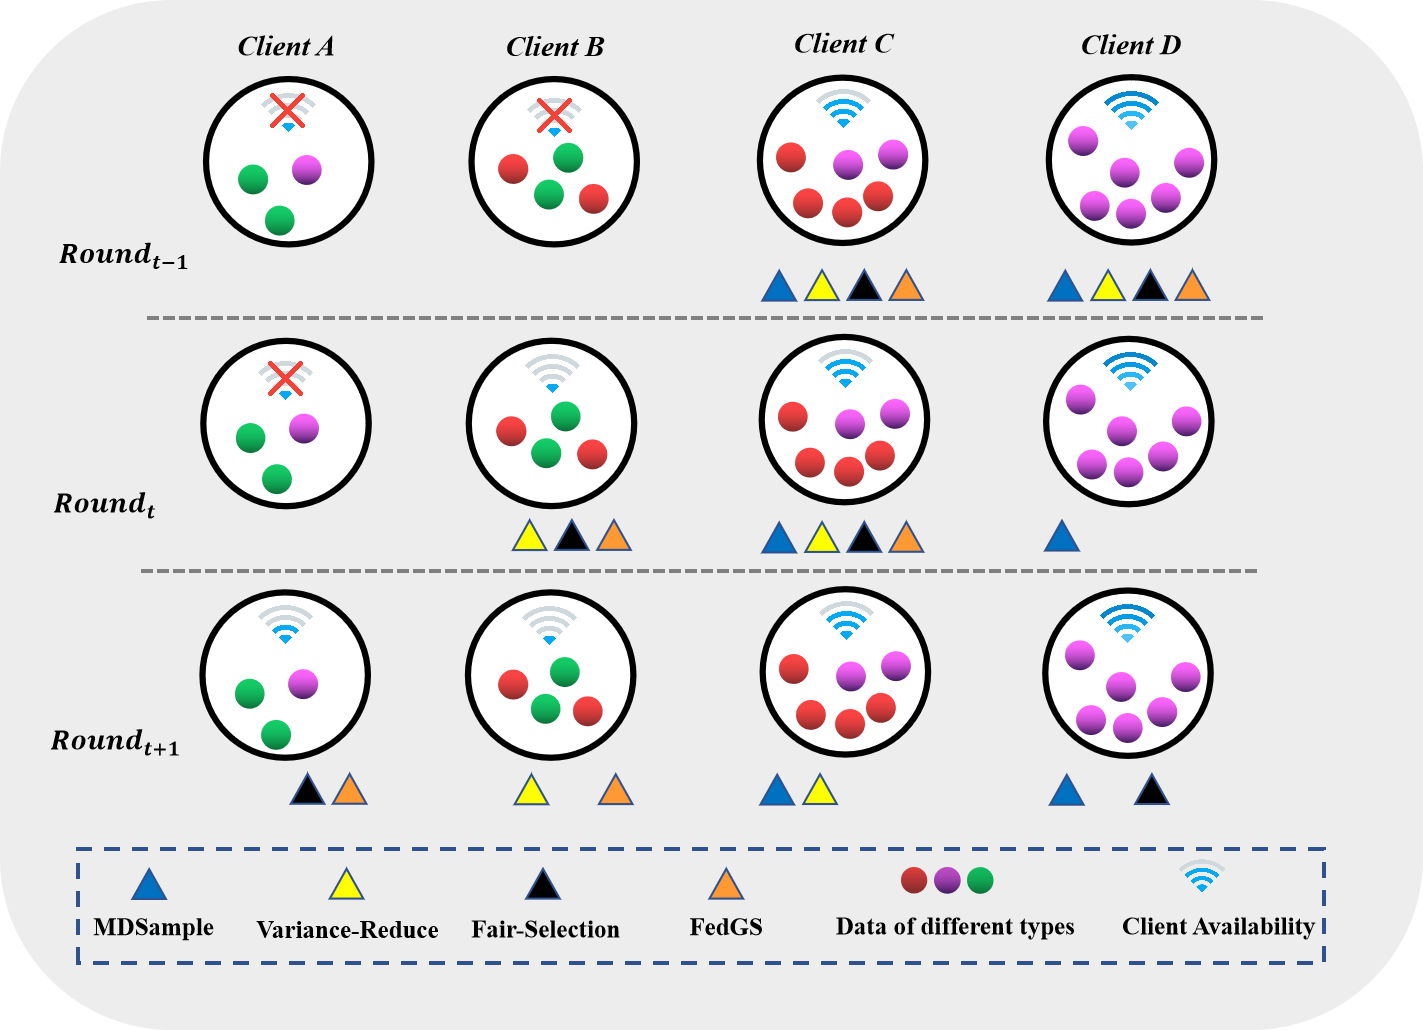
(Li et al. 2020) sample clients in proportion to their data sizes with replacement to obtain an unbiased estimator of update. More recently, some works take the client availability into account when sampling clients (Yan et al. 2020; Gu et al. 2021; Balakrishnan et al. 2021; Cho, Wang, and Joshi 2020; Huang et al. 2020). They show that selecting clients without considering whether the clients are active will lead to unbounded waiting times and poor responding rates. As a result, they sample only the active clients to guarantee immediate client availability (Gu et al. 2021; Cho, Wang, and Joshi 2020). For example, in Fig. 1, the server will not sample the inactive Client and Client at Round .
However, enabling both stable model updates and bias-free training under arbitrary client availability (i.e., without any assumption on when each client will become available) poses significant challenges which have not been addressed. On one hand, the model is improved on the data distributions of the sampled clients at each round, which might lead to the detriment of the data specificity of non-sampled clients (Fraboni et al. 2021). For example, in Fig. 1, fair-selection (Huang et al. 2020) tries to guarantee the least sampled times for each client (and hence it is “fair”). While mitigating the long-term bias, it will ignore the data of the red type at Round , since it only considers the balance of the sampled frequency of clients. This fails to observe the data heterogeneity across the clients and leads to instability of the model update due to the absence of the gradients computed on the “red” data. On the other hand, the global models trained by FL may also be biased towards clients with higher availability in a long run. Also in Fig. 1, the MDSample (Li et al. 2020) and Variance-Reduce (Fraboni et al. 2021; Balakrishnan et al. 2021) methods, which do not consider the difference in client availability, introduce bias towards the clients with higher availability (i.e. Client is overlooked at Round regardless of not sampled in the previous rounds). In summary, there are significant challenges to address two competitive issues (i.e. stable model updates and bias-free training) that limit the FL training performance under the arbitrary client availability.
To address the issues above, we propose a novel FL framework named Federated Graph-based Sampling (FedGS) to tackle the arbitrary client availability problem. We first model the data correlations of clients with a Data-Distribution-Dependency Graph (3DG) that helps keep the sampled clients data far from each other. We further minimize the variance of the numbers of times that the clients are sampled to mitigate long-term bias. Extensive experiments on three datasets under different client availability modes confirm FedGS’s advantage in both enabling a fair client-sampling scheme and improving the model performance under arbitrary client availability.
The contributions of this work are summarized as follow:
-
•
We propose FedGS that could both stabilize the model update and mitigate long-term bias under arbitrary client availability. To the best of our knowledge, this is the first work that tackles the two issues simultaneously.
-
•
We propose the data correlations of clients with a Data-Distribution-Dependency Graph (3DG), which helps keep sampled clients apart from each other, and is also dedicate to mitigate long-term bias.
-
•
We design a comprehensive set of seven client availability modes, on which we evaluate the effectiveness of FedGS on three datasets. We observe that FedGS outperforms existing methods in both client-selection fairness and model performance.
Background and Problem Formulation
Given clients where the th client has a local data size of and a local objective function , we study the standard FL optimization problem as:
| (1) |
where is the shared model parameter and is the total data size. A common approach to optimize this objective is to iteratively broadcast the global model (i.e., its learned parameter values) to all clients at each training round and aggregate local models that are locally trained by clients using SGD with fixed steps:
| (2) |
When the number of clients is large, it is infeasible to update with from each client , due to communication constraints. Sampling a random client subset to obtain an estimator of the full model update at each round becomes an attractive in this case, which is shown to enjoy convergence guarantee when the following unbiasedness condition is met (Li et al. 2019; Fraboni et al. 2021):
| (3) |
Further, Fraboni et al. and Balakrishnan et al. propose to reduce the variance of the estimator as follows to enable faster and more stable training:
| (4) | ||||
| (5) |
However, the effectiveness of these variance-reducing methods is still limited by the long-term bias caused by the arbitrary client availability as discussed earlier.
Mitigating long-term bias
We first propose an objective that could mitigate the long-term bias without any assumption on the client availability. We denote the set of available clients at the round as . Then, sampled clients should satisfy and , where is the maximum sample size limited by the server’s capacity. To mitigate the impact of unexpected client availability on the sampled subset from a long-term view, we sample clients by minimizing the variance of the sampling counts of clients (i.e., the numbers of times that the clients are sampled after rounds). Let the sampling counts of clients after rounds be where . Then, the variance of the client sampling counts after round is:
| (6) | |||
| (7) |
As discussed earlier, only balancing participating rates for clients may introduce large variance of model updates that slows down the model convergence (Fraboni et al. 2021). To enable a stable training, we introduce low-variance model updates as a constraint on the feasible space when minimizing the variance of sampling counts of the clients. We thus formulate our sampling optimization problem as:
| (8) | |||
| (9) |
where is a coefficient that allows to search for a trade-off between the two objectives of stable model updates and balanced client sampling counts. When , the optimal solution will select the currently available clients with the lowest sampling counts. On the other hand, a small will limit the sampled clients to those with adequately small variance of the corresponding model updates.
Methodology
This section presents our solutions to the optimization problem above (Eq. 8 and 9). The main challenge lies in converting the constraint on the variance of the global model update into a solvable one. For this purpose, we utilize the data similarity between clients to increase the data diversity of the sampled subset.
Variance Reduction Based On 3DG
Before illustrating our method, we briefly review previous works that address the Gradient Variance Reduction problem in FL. Li et al. add an proximal term to the local objectives to prevent the model from overfitting on the local data. Karimireddy et al. use control variate to dynamically correct the biased updates during local training. These two methods can avoid large model update variance by debiasing the local training procedure, which is orthogonal to the sampling strategy. Fraboni et al. group the clients into clusters and then sample clients from these clusters without replacement to increase the chance for each client to be selected while still promising the unbiasedness of the model updates. Similarly, Balakrishnan et al. approximates the full model updates by enlarging the diversity of the selected client set, which is done by minimizing a relaxed upper bound of the difference between the optimal full update and the approximated one. Such a relaxation aims to achieve that for each client there exists an adequately similar client in the sampled subset.
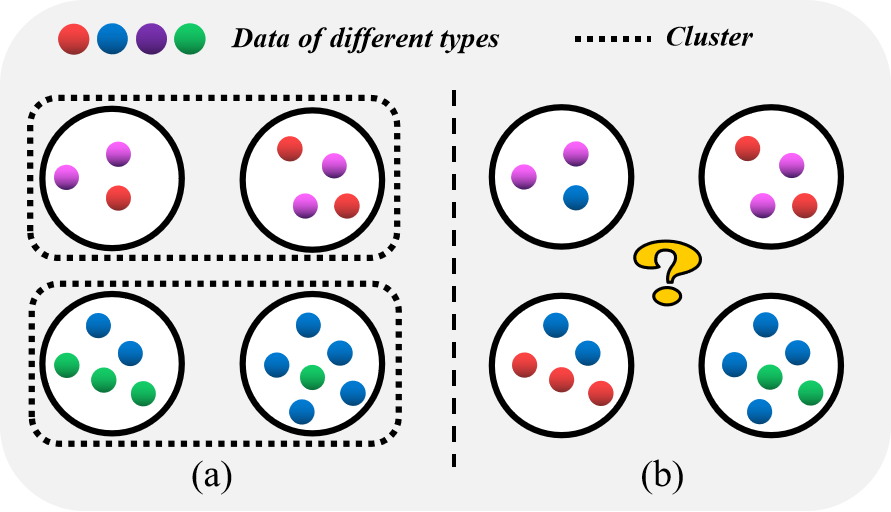
The existing methods work well when there are obvious clusters of clients based on their local data distributions in Fig. 2(a). However, when the local data distributions are too complex to cluster like Fig. 2(b), clustering the clients cannot accurately capture the implicit data correlations between clients, which may lead to performance degradation. Meanwhile, minimizing the relaxed upper is not the only means to enlarge the diversity of the sampled clients. We can achieve the same purpose without such minimization.
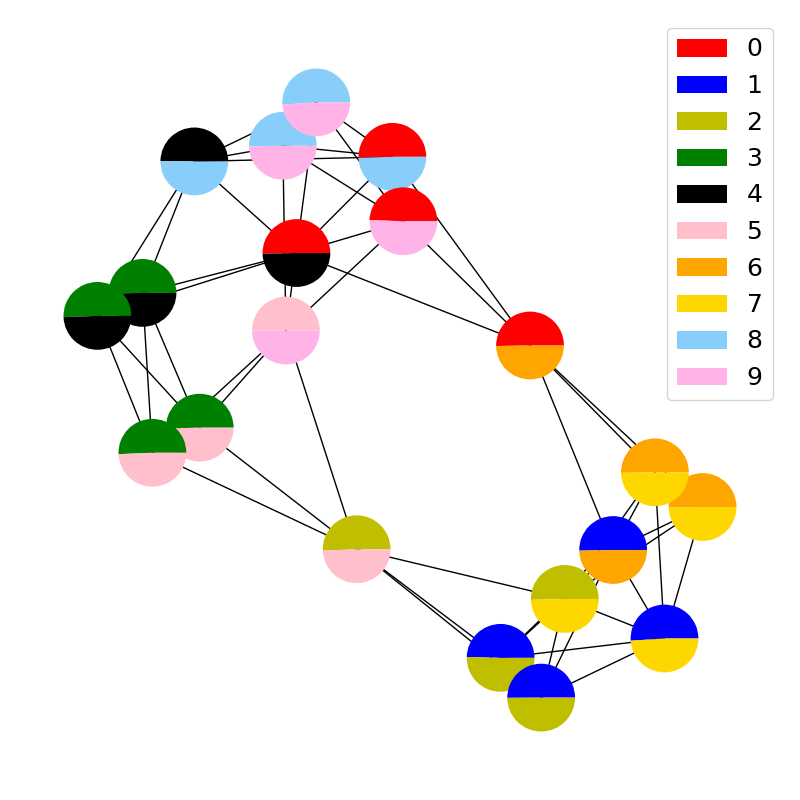
To better describe the correlations among clients’ local data distributions, we model the local data distribution similarities with a Data-Distribution-Dependency Graph (3DG) instead of grouping the clients into discrete clusters, as shown in Fig. 3. Then, we show that keeping a large average shortest-path distance between the sampled nodes (i.e. clients) on the 3DG helps approximate the full model update. Intuitively, encouraging the sampled nodes to spread as far as possible helps differentiate the sampled local data distributions, which brings a higher probability to yield good balanced approximations for the full model update. This is proven as Theorem 1.
Theorem 1.
Suppose that there are types of data (i.e., types of labels) over all datasets, where each data type’s ratio is such that the dataset can be represented by the vector . Without losing generality, consider to be uniformly distributed in the simplex in , the number of local updates to be , and 3DG is a complete graph. A larger distance of sampled clients on the 3DG leads to a more approximate full model update.
Proof.
See Appendix A. ∎
Although the proof is based on that 3DG is a complete graph, we empirically show that keeping the clients far away from each others on the 3DG can benefit FL training even when this assumption is broken.
Construction of 3DG in FL
Now we discuss how to construct the 3DG. A straightforward approach is to directly calculate the distance (e.g., KL divergence) between different local data distributions, which is infeasible in FL because the clients do not share their local data. Without loss of generality, we assume that there is a feature vector that can well represent the information about the local data distribution of each client . We argue that this is achievable in practice. For example, training an ML model for tasks of supervised learning (e.g., classification) usually face severe data heterogeneity in FL, where there may exist label skewness in clients’ local data (e.g. each client only owns data with a subset of labels). In this case, the label distribution vectors (i.e. the number of items of each label) can well reflect the bias of each client’s local data. Once given the feature vectors , we can easily calculate the similarity between any two clients and with a similarity function as:
| (10) |
Then, the similarity matrix can be converted into an adjacent matrix for the 3DG over the clients for the 3DG over the clients by:
where is a positive threshold used to control the sparsity of the adjacent matrix and controls the diversity of the edge weight. A large value of will lead to small difference between the edge weights.
The feature vector can also leak sensitive information about the clients, and it may not be exposed to the other clients or the server. It is necessary for the server to obtain the similarities between clients in privacy-preserving manner to reconstruct or accurately approximate the oracle 3DG (i.e., the 3DG corresponding to the true features ). To achieve this goal, we present two methods that can help the server construct the 3DG.
The first is to use techniques based on Secure Scalar Product Protocols (SSPP) (Wang et al. 2009; Shundong, Mengyu, and Wenting 2021), which aims to compute the dot product of private vectors of parties. We argue that any existing solutions of SSPP can be used to reconstruct the similarity matrix of clients in our settings, and we detail one of the existing solutions for scalar product protocal (Du and Zhan 2002) with a discussion on how to adapt it to build the 3DG in the Appendix D.
Although the SSPP-based methods can construct the oracle 3DG without any error, it cannot be adapted to the case where the feature vectors are difficult or impossible to obtain. In addition, the SSPP-based method only applies when the similarity function is a simple dot product.
We propose a second method that computes the similarity between clients based on their uploaded model parameters. Given the locally trained models and , a straightforward way to calculate the similarity between the two clients is to compute the cosine similarity of their model updates (Xu and Lyu 2020; Xu et al. 2021)
| (11) |
where . However, since the model parameters’ update is usually of extremely high dimensions but low rank (Azam et al. 2021), the direct cos similarity may contain too much noise, causing inaccuracy when constructing the 3DG. Motivated by (Baek et al. 2022), we instead compute the functional similarity based on the model parameters to overcome the problem above. We first feed a batch of random Gaussian noise to all the locally trained models, where and are respectively the mean and covariance of a small validation dataset owned by the server (Zhao et al. 2018). Then, we take the average of the th layer’s network embedding on this batch for each client to obtain , and we compute the similarity as:
| (12) |
where we set as the output layer in practice.
Another concerning issue is that the server may not have access to all the clients’ feature vectors during the initial phase. As a result, the adjacent matrix of clients may need to be dynamically built and polished round by round. Nevertheless, we emphasize that we are not trying to answer how to optimally capture the correlations between clients’ local data distributions in FL. Instead, we aim at showing that the topological correlations of clients’ local data can be utilized to improve the training process of FL, and we key how to build the optimal 3DG for as our future work.
For convenience, we simply assume that all the clients are available at the initial phase, by which the server can obtain the 3DG just before training starts. We empirically show the effectiveness of the approximated 3DG in Sec. 4.4.
FedGS
We now present our proposed Federated Graph-based Sampling (FedGS) method. As mentioned in Sec. 3.1, we bound the variance of the global model update at each round by keeping a larger average shortest-path distance between each pair of sampled clients. Given a 3DG, we first use the Floyd–Warshall algorithm to compute the shortest-path distance matrix for all pairs of clients. Let be a binary variable, where means client is selected to participate training round and otherwise. Then, the sampling result in round can be , where the average shortest-path distance between sampled clients is written as:
| (13) |
Accordingly, we replace the constraint in Equation (9) with , and we convert this constraint into a penalty term added into the objective. After rewriting the equation (8) to be a maximization problem based on , we obtain:
| (14) | |||
| (15) |
where , and means client is available in round . Note that for the clients unavailable clients in round and . Thus, Equation (14) can be reduced to:
| (16) | |||
| (17) |
and represents that the th client in the available set is selected. and also only contains the element where the corresponding clients are available in round .
This rewritten problem is a constrained mixed integer quadratic problem, which is a variety of an NP-hard problem, p-dispersion (Pisinger 1999), with a non-zero diagonal. We optimize it to select clients within a fixed upper bound of wall-clock time. We empirically show that a local optimal can already bring non-trivial improvement when the client availability varies.
Aggregation Weight.
Instead of directly averaging the uploaded model parameters like (Balakrishnan et al. 2021; Li et al. 2020), We normalize the ratio of the local data size of selected clients as weights of the model aggregation:
| (18) |
We argue that this is reasonable in our sampling scheme. Firstly, FedGS forces to balance the sampling counts of all the clients regardless of their availability. Thus, for convenience, we simply assume that all the clients will be uniformly sampled with the same frequency in every rounds, and that the size of the set of available clients is always larger than the sample size limit in each round . By treating the frequency as the probability of each client being selected without replacement in each round , , we obtain:
| (19) | ||||
| (20) |
where . Therefore, the expected updated model of the next round follows:
| (21) | ||||
| (22) | ||||
| (23) |
From Equation (22), we see that the degree of data imbalance will impact the unbiasedness of the estimation. When the data size is balanced as , the estimation is unbiased since . If the data size is imbalanced, the degree of data imbalance will only have a controllable influence on the unbiasedness with the ratio of each client’s local data’s size to the average data size . This impact can be immediately reduced by increasing the number of sampled clients at each round.
The analysis above is based on the assumption that our proposed FedGS can well approximate the results obtained by uniform sampling without replacement in ideal settings. Generally speaking, a small will limit the difference between the sampling counts, which is also empirically verified by our experimental results. The pseudo codes in Algorithm 1 summarizes the main steps of FedGS.
Input:The global model , the feature matrix of clients’ data distribution , the maximum wall-clock time of the solver , the sizes of clients’ local data , the number of local updating steps , and the learning rate
| Name | Description | Dependency | Active Rate | ||
| Time | Data | Other | |||
| IDeaL | Full client availability | - | - | - | |
| MoreDataFirst (Ours) | More data, higher availability | - | data size | - | |
| LessDataFirst (Ours) | Less data, higher availability | - | data size | - | |
| YMaxFirst (Gu et al. 2021) | Larger value of label, higher availability | - | value of label set | - | |
| YCycle (Ours) | Periodic availability with label values | round | value of label set | - | |
| Log Normal (Ribero, Vikalo, and De Veciana 2022) | Independent availability obeying lognormal | - | - | ||
| Sin Log Normal (Ribero, Vikalo, and De Veciana 2022) | Sin-like intermittent availability of with LN | round | - | ||
| Dataset | Synthetic(0.5, 0.5) | CIFAR10 | FashionMNIST | ||||||||||
| Availability | IDL | LN | SLN | LDF | MDF | IDL | LN | SLN | LDF | MDF | IDL | YMF | YC |
| UniformSample | 0.302 | 0.320 | 0.324 | 0.330 | 0.362 | 0.975 | 1.042 | 1.038 | 1.049 | 0.999 | 0.315 | 0.331 | 0.333 |
| MDSample | 0.302 | 0.322 | 0.328 | 0.328 | 0.326 | 0.971 | 1.037 | 1.048 | 1.051 | 0.991 | 0.315 | 0.333 | 0.338 |
| Power-of-Choice | 0.691 | 0.362 | 0.352 | 0.557 | 0.301 | 1.287 | 1.108 | 1.078 | 1.267 | 1.026 | 0.345 | 0.326 | 0.311 |
| FedProx | 0.301 | 0.346 | 0.376 | 0.319 | 0.410 | 0.972 | 1.056 | 1.162 | 1.039 | 0.995 | 0.315 | 0.331 | 0.374 |
| FedGS | 0.307 | 0.305 | 0.320 | 0.309 | 0.310 | 1.006 | 0.976 | 1.002 | 0.974 | 0.967 | 0.302 | 0.310 | 0.324 |
| FedGS | 0.311 | 0.306 | 0.319 | 0.308 | 0.311 | 0.977 | 0.973 | 1.000 | 0.966 | 0.974 | 0.299 | 0.312 | 0.312 |
| FedGS | 0.328 | 0.306 | 0.318 | 0.308 | 0.311 | 0.968 | 0.972 | 0.996 | 0.971 | 0.963 | 0.300 | 0.308 | 0.310 |
| FedGS | 0.306 | 0.307 | 0.320 | 0.308 | 0.311 | 0.970 | 0.975 | 1.001 | 0.973 | 0.969 | 0.310 | 0.303 | 0.312 |
| FedGS | 0.317 | 0.307 | 0.321 | 0.309 | 0.311 | 0.976 | 0.974 | 0.996 | 0.972 | 0.972 | 0.307 | 0.303 | 0.307 |
Experiment
Experimental Setup
Datasets and models to be trained
We validate FedGS on three commonly used federated datasets: Synthetic (0.5, 0.5) (Li et al. 2020), CIFAR10 (Krizhevsky, Hinton et al. 2009) and FashionMNIST (Xiao, Rasul, and Vollgraf 2017). For Syntetic dataset, we follow the settings use by (Li et al. 2020) to generate imbalance and non-i.i.d. dataset with 30 clients. For CIFAR10, we unequally partition the dataset into 100 clients following the label distribution (Hsu, Qi, and Brown 2019) ( is the global label distribution). For FashionMNIST, we balance the data sizes for 100 clients, each of whom owns data of only two labels. We train a logistic regression model for Synthetic(0.5, 0,5) and CNN models for CIFAR10 and FashionMNIST. More details on datasets are in Appendix C.
Client Availability
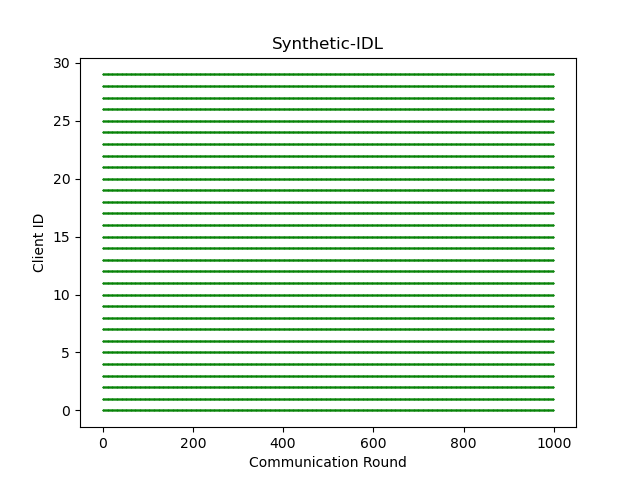
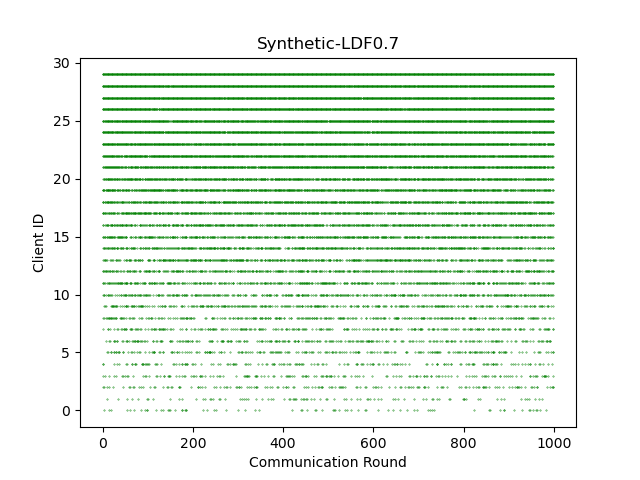
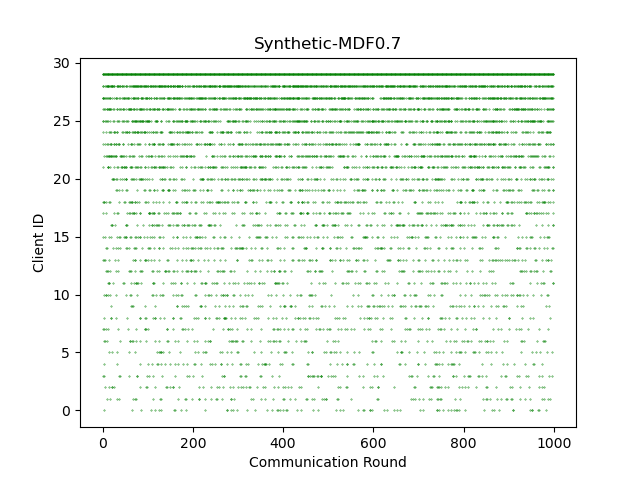
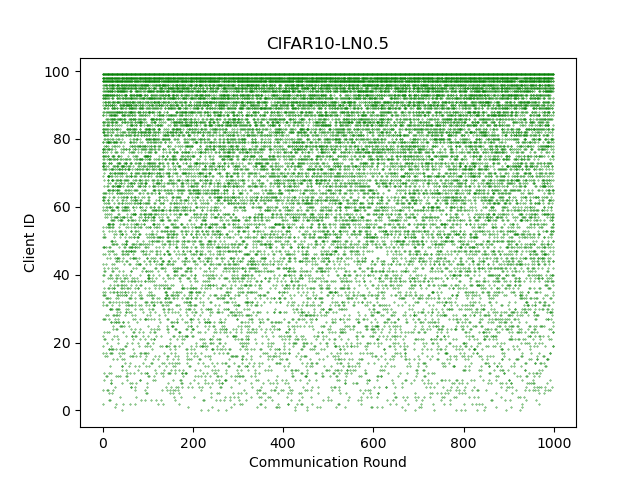
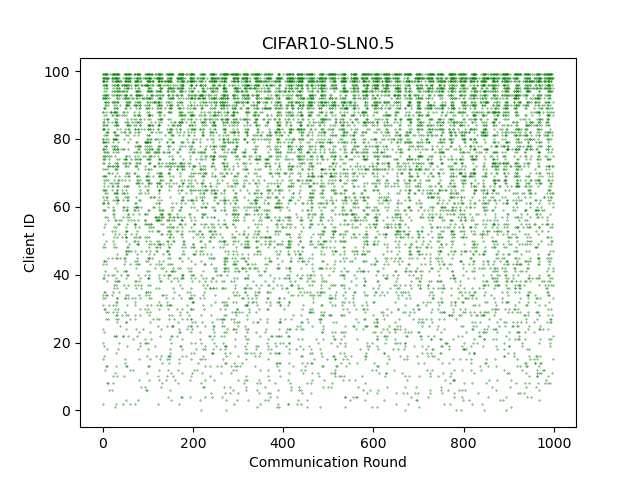
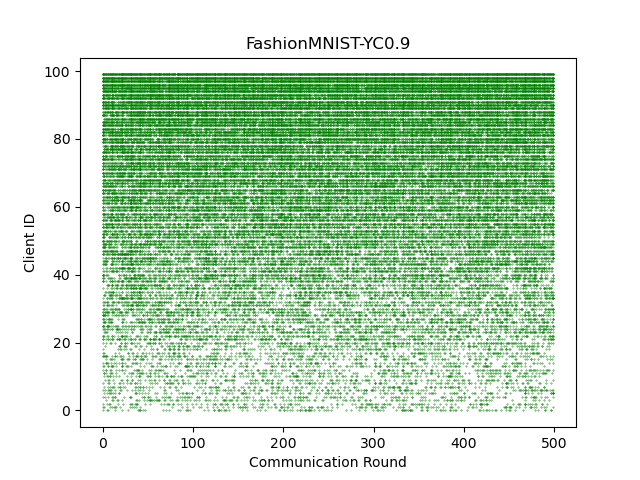
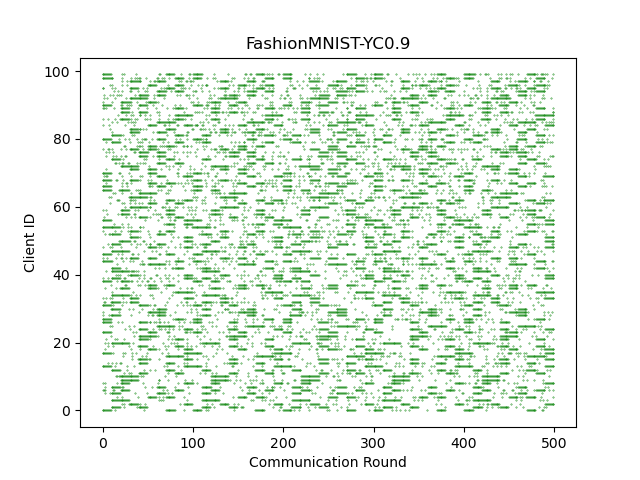
We first review the client availability settings discussed in existing FL literature (Ribero, Vikalo, and De Veciana 2022; Gu et al. 2021), a common way is to allocate an active probability to each client at each round. We observe that the client’s active probability may depend on data distribution or time (Ribero, Vikalo, and De Veciana 2022; Gu et al. 2021). We mainly conclude the existing client availability modes and propose a comprehensive set of seven client availability modes in Table 1 to conduct experiments under arbitrary availability. For each mode, we set a coefficient to control the degree of the global unavailability, where a large value of suggests a small chance for most devices to be active. A further explanation about these availability modes is provided in Appendix C, where we also visualize the active state of clients at each round.
Baselines
We compare our method FedGS with: (1) UniformSample (McMahan et al. 2017), which samples available clients uniformly without replacement, (2) FedProx/MDSample (Li et al. 2020), which samples available clients with a probability proportion to their local data size and trains w/wo proximal term, (3) Power-of-Choice (Cho, Wang, and Joshi 2020), which samples available clients with top- highest loss on local data and is robust to the client unavailability. Particularly, all the reported results of our FedGS are directly based on the oracle 3DG. We put results obtained by running FedGS on the constructed 3DG in the Appendix B.
Hyper-parameters
For each dataset, we tune the hyper-parameters by grid search with FedAvg, and we adopt the optimal parameters on the validation dataset of FedAvg to all the methods. The batch size is for Synthetic and for both CIFAR10 and FashionMNIST. The optimal parameters for Synthetic, Cifar10, FashionMNIST are resepctively , and . We round-wisely decay the learning srate by a factor of for all the datasets. More details about the hyper-parameters are put in Appendix C.
Implementation
All our experiments are run on a 64 GB-RAM Ubuntu 18.04.6 server with Intel(R) Xeon(R) CPU E5-2630 v4 @ 2.20GHz and 4 NVidia(R) 2080Ti GPUs. All code is implemented in PyTorch 1.12.0.
Results of Impact of Client Availability
We run experiments under different client availability modes to study the impact of arbitrary client availability, where the main results are shown in Table 2. Overall, the optimal model performance measured by the test loss is impacted by the client availability modes for all methods and over all three datasets. On Synthetic, UniformSample suffers the worst model performance degradation, (i.e. IDL v.s. MDF), while that for MDSample is (i.e. IDL v.s. LDF). FedGS retrains a strong model performance, with a degradation no more than for all the values of . Further, our proposed FedGS achieves the best performance under all the availability modes except for IDL and MDF. For IDL, our FedGS still yields competitive results comparing with UniformSample and MDSample (0.306 v.s. 0.302). For MDF, although Power-of-Choice achieves the optimal result, its model performance is extremely unstable across different availability modes, e.g., its model performance is almost worse than the others for IDL. Meanwhile, FedGS still achieves improvement over MDSample and over UniformSample in this case. For CIFAR10 and FashionMNIST, all the optimal results fall into the region runned with FedGS. Using brings a non-trivial improvement over using in most of the client availability modes, which suggests that the variance reduction of FedGS can also benefit FL training.
Results of Client Selection Fairness
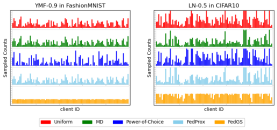
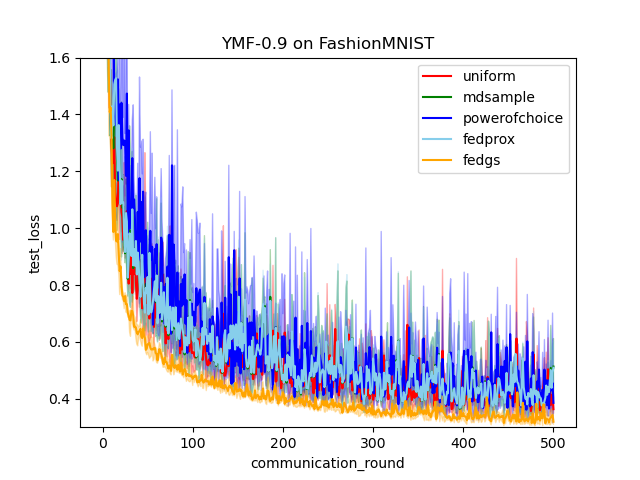
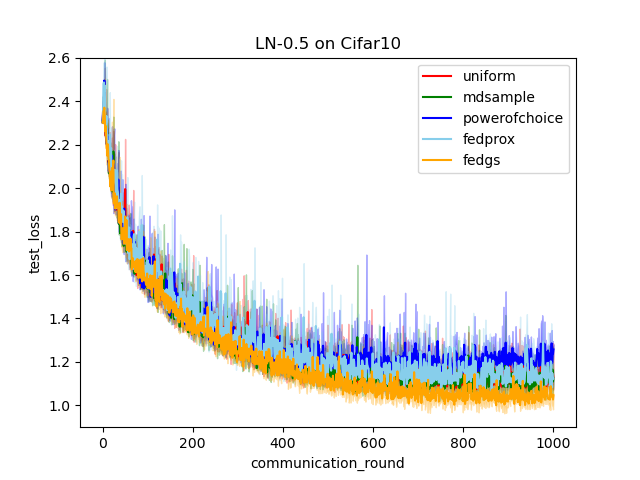
As shown in Fig. 4, can substantially enhance fairness in client selection, which results in a uniform distribution of client sample counts both on FashionMNIST with YMF-0.9 and CIFAR10 with LN-0.5. We also show the corresponding curves of test loss in Fig. 5, which show that FedGS can stabilize FL training and find a better solution.
Effectiveness of 3DG Construction
To validate the effectiveness of our method to reconstruct the oracle 3DG based on the functional similarity of model parameters, we use the F1-score of predicting the edges in the oracle 3DG to measure the quality of the construction, and we compare results with those obtained using the cosine similarity. The oracle 3DG is generated with and . Considering the difference in the feature space of the oracle and those of the model-based methods, we vary the value of and report the results with the highest F1-score for each method. Results in Table 3 confirm the effectiveness of the proposed method to approximate the oracle 3DG, where the functional-similarity method achieves a higher F1-score than the cos-similarity method on both datasets. The results of FedGS running on the model-based 3DG are included in Appendix B.
| Dataset | Method | Precision | Recall | F1-Score |
| CIFAR10 | functional similarity | 0.8789 | 0.8700 | 0.8744 |
| cosine similarity | 1.0000 | 0.1316 | 0.2327 | |
| FashionMNIST | functional similarity | 0.9761 | 0.7097 | 0.8218 |
| cosine similarity | 0.3765 | 0.9853 | 0.5448 |
Related Works
Client Sampling in FL
Client sampling is proven to has a significant impact on the stability of the learned model (Cho, Wang, and Joshi 2020). (McMahan et al. 2017) uniformly samples clients without replacement to save communication efficiency. (Li et al. 2020) samples clients proportion to their local data size and uniformly aggregate the models with full client availability. (Fraboni et al. 2021) reduces the variance of model to accelerate the training process. Nevertheless, these works ignored the long-term bias introduced by arbitrary client availability, which will result in the model overfitting on a particular data subset. Recent works (Ribero, Vikalo, and De Veciana 2022; Gu et al. 2021; Huang et al. 2020) are aware of such long-term bias from the arbitrary availability of clients. However, these two competitive issues (e.g. stable model updates and bias-free training) have not been considered simultaneously.
Graph Construction in FL
When it is probable to define the topology structure among clients in FL, several works directly utilized underlying correlations among different clients according to their social relations (He et al. 2021). Other works proposed to connect the clients with their spatial-temporal relations as a graph (Meng, Rambhatla, and Liu 2021; Zhang et al. 2021). However, those works are used to conduct explicit correlations between clients (e.g. social relation, spatial relation), which were not able to uncover the important and implicit connections among clients. In short, we are the first to construct Data-Distribution-Dependency Graph (3DG) to learn the potential data dependency of sampled clients, which is proven to both guarantee a fair client sampling scheme and improve the model performance under arbitrary client availability.
Conclusion
We addressed the long-term bias and the stability of model updates simultaneously to enable faster and more stable FL under arbitrary client availability. To this end, we proposed the FedGS framework that models clients’ data correlations with a Data-Distribution-Dependency Graph (3DG) and utilizes the graph to stabilize the model updates. To mitigate the long-term bias, we minimize the variance of the numbers of times that clients are sampled under the far-distance-on-3DG constraint. Our experimental results on three real datasets under a comprehensive set of seven client availability modes confirm the robustness of FedGS on arbitrary client availability modes. In the future, we plan to study how to define and construct 3DG across various ML tasks.
Acknowledgements
The research was supported by Natural Science Foundation of China (62272403, 61872306), Fundamental Research Funds for the Central Universities (20720200031), FuXiaQuan National Independent Innovation Demonstration Zone Collaborative Innovation Platform (No.3502ZCQXT2021003), and Open Fund of PDL (WDZC20215250113).
References
- Azam et al. (2021) Azam, S. S.; Hosseinalipour, S.; Qiu, Q.; and Brinton, C. 2021. Recycling Model Updates in Federated Learning: Are Gradient Subspaces Low-Rank? In International Conference on Learning Representations.
- Baek et al. (2022) Baek, J.; Jeong, W.; Jin, J.; Yoon, J.; and Hwang, S. J. 2022. Personalized Subgraph Federated Learning. arXiv:2206.10206.
- Balakrishnan et al. (2021) Balakrishnan, R.; Li, T.; Zhou, T.; Himayat, N.; Smith, V.; and Bilmes, J. 2021. Diverse client selection for federated learning via submodular maximization. In International Conference on Learning Representations.
- Cho, Wang, and Joshi (2020) Cho, Y. J.; Wang, J.; and Joshi, G. 2020. Client Selection in Federated Learning: Convergence Analysis and Power-of-Choice Selection Strategies. arXiv:2010.01243.
- Du and Zhan (2002) Du, W.; and Zhan, Z. 2002. Building decision tree classifier on private data. Electrical Engineering and Computer Science.
- Fraboni et al. (2021) Fraboni, Y.; Vidal, R.; Kameni, L.; and Lorenzi, M. 2021. Clustered sampling: Low-variance and improved representativity for clients selection in federated learning. In International Conference on Machine Learning, 3407–3416. PMLR.
- Gu et al. (2021) Gu, X.; Huang, K.; Zhang, J.; and Huang, L. 2021. Fast federated learning in the presence of arbitrary device unavailability. Advances in Neural Information Processing Systems, 34: 12052–12064.
- He et al. (2021) He, C.; Balasubramanian, K.; Ceyani, E.; Yang, C.; Xie, H.; Sun, L.; He, L.; Yang, L.; Yu, P. S.; Rong, Y.; Zhao, P.; Huang, J.; Annavaram, M.; and Avestimehr, S. 2021. FedGraphNN: A Federated Learning System and Benchmark for Graph Neural Networks. arXiv:2104.07145.
- Hsu, Qi, and Brown (2019) Hsu, T.-M. H.; Qi, H.; and Brown, M. 2019. Measuring the Effects of Non-Identical Data Distribution for Federated Visual Classification. arXiv:1909.06335.
- Huang et al. (2020) Huang, T.; Lin, W.; Wu, W.; He, L.; Li, K.; and Zomaya, A. Y. 2020. An efficiency-boosting client selection scheme for federated learning with fairness guarantee. IEEE Transactions on Parallel and Distributed Systems, 32(7): 1552–1564.
- Karimireddy et al. (2020) Karimireddy, S. P.; Kale, S.; Mohri, M.; Reddi, S.; Stich, S.; and Suresh, A. T. 2020. Scaffold: Stochastic controlled averaging for federated learning. In International Conference on Machine Learning, 5132–5143. PMLR.
- Krizhevsky, Hinton et al. (2009) Krizhevsky, A.; Hinton, G.; et al. 2009. Learning multiple layers of features from tiny images.
- Li et al. (2020) Li, T.; Sahu, A. K.; Zaheer, M.; Sanjabi, M.; Talwalkar, A.; and Smith, V. 2020. Federated optimization in heterogeneous networks. Proceedings of Machine Learning and Systems, 2: 429–450.
- Li et al. (2019) Li, X.; Huang, K.; Yang, W.; Wang, S.; and Zhang, Z. 2019. On the Convergence of FedAvg on Non-IID Data. arXiv:1907.02189.
- McMahan et al. (2017) McMahan, B.; Moore, E.; Ramage, D.; Hampson, S.; and y Arcas, B. A. 2017. Communication-efficient learning of deep networks from decentralized data. In Artificial intelligence and statistics, 1273–1282. PMLR.
- Meng, Rambhatla, and Liu (2021) Meng, C.; Rambhatla, S.; and Liu, Y. 2021. Cross-node federated graph neural network for spatio-temporal data modeling. In Proceedings of the 27th ACM SIGKDD Conference on Knowledge Discovery & Data Mining, 1202–1211.
- Peng (2007) Peng, B. 2007. The determinant: A means to calculate volume. Recall, 21: a22.
- Pisinger (1999) Pisinger, D. 1999. Exact solution of p-dispersion problems. DIKU.
- Ribando (2006) Ribando, J. M. 2006. Measuring solid angles beyond dimension three. Discrete & Computational Geometry, 36(3): 479–487.
- Ribero, Vikalo, and De Veciana (2022) Ribero, M.; Vikalo, H.; and De Veciana, G. 2022. Federated Learning Under Intermittent Client Availability and Time-Varying Communication Constraints. arXiv:2205.06730.
- Shundong, Mengyu, and Wenting (2021) Shundong, L.; Mengyu, Z.; and Wenting, X. 2021. Secure Scalar Product Protocols. Chinese Journal of Electronics, 30(6): 1059–1068.
- Wang et al. (2009) Wang, I.-C.; Shen, C.-H.; Zhan, J.; Hsu, T.-s.; Liau, C.-J.; and Wang, D.-W. 2009. Toward empirical aspects of secure scalar product. IEEE Transactions on Systems, Man, and Cybernetics, Part C (Applications and Reviews), 39(4): 440–447.
- Wang et al. (2020) Wang, J.; Liu, Q.; Liang, H.; Joshi, G.; and Poor, H. V. 2020. Tackling the objective inconsistency problem in heterogeneous federated optimization. Advances in neural information processing systems, 33: 7611–7623.
- Xiao, Rasul, and Vollgraf (2017) Xiao, H.; Rasul, K.; and Vollgraf, R. 2017. Fashion-MNIST: a Novel Image Dataset for Benchmarking Machine Learning Algorithms. arXiv:1708.07747.
- Xu and Lyu (2020) Xu, X.; and Lyu, L. 2020. A Reputation Mechanism Is All You Need: Collaborative Fairness and Adversarial Robustness in Federated Learning. arXiv:2011.10464.
- Xu et al. (2021) Xu, X.; Lyu, L.; Ma, X.; Miao, C.; Foo, C. S.; and Low, B. K. H. 2021. Gradient driven rewards to guarantee fairness in collaborative machine learning. Advances in Neural Information Processing Systems, 34: 16104–16117.
- Yan et al. (2020) Yan, Y.; Niu, C.; Ding, Y.; Zheng, Z.; Wu, F.; Chen, G.; Tang, S.; and Wu, Z. 2020. Distributed Non-Convex Optimization with Sublinear Speedup under Intermittent Client Availability. arXiv:2002.07399.
- Zhang et al. (2021) Zhang, C.; Zhang, S.; James, J.; and Yu, S. 2021. FASTGNN: A topological information protected federated learning approach for traffic speed forecasting. IEEE Transactions on Industrial Informatics, 17(12): 8464–8474.
- Zhao et al. (2018) Zhao, Y.; Li, M.; Lai, L.; Suda, N.; Civin, D.; and Chandra, V. 2018. Federated Learning with Non-IID Data. arXiv:1806.00582.
Appendix A A. Proof of Theorem 1
Proof.
Supposing there are types of data in the global dataset, the global dataset can be represented by the data ratio vector , where each data type’s ratio is and . Then, the local data distribution of each client can also be represented by . We slightly modify the way of constructing 3DG as
where and the principle of the smaller similarity corresponding to the larger distance still holds. Given that 3DG is a complete graph, we demonstrate that the shortest-path distance matrix is the same to , since is always established for any .
In each communication round , the server samples clients to participate. By denoting the sampled clients’ normalized data distribution as , the average shortest-path distance of these selected clients is
| (24) | ||||
| (25) | ||||
| (26) |
After receiving the local models, the server aggregates their uploaded models to obtain
| (27) |
where is the aggregation weight of the selected client and . Now, the question is how possible can the aggregated model update recover the true model update that is computed on all the clients?
To answer this question, we first simply consider the model update computed on all the th type of data to be and , then we can approximate the true model update by
| (28) | ||||
| (29) |
Similarly, each client ’s model update can also be represented by
| (30) |
Then, the aggregated model update is
| (31) | ||||
| (32) | ||||
| (33) |
When there exists an optimal weight vector such that , we demonstrate that the sampled subset can well approximate the true model update, which requires the true weight to fall into the region of the convex cone . Given the assumption that is uniformly distributed in the simplex of , the problem becomes how to compare the probability for different .


Let’s first consider the 2-dimension case (i.e. the left one of Fig.6). Given two vectors and , the probability can be measured by the ratio of the angle between and as . For the cases where the dimension is higher than (i.e. the right one in Fig.6.), (Ribando 2006) defines the normalized measurement of solid angle
| (34) |
where is the usual volume form in , is the unit ball in and is the unit -sphere. Further, they provide a way to compute the solid angle for unit positive vector
| (35) |
which represents the probability of the optimal weight in the convex cone by projecting and each ray (i.e. column) in onto the surface of a unit sphere centered at in .
For the case where the number of sampled clients is smaller than or but , we have (i.e. simply repeating one of the vectors in when until the number of vectors reaches ), which means it’s nearly impossible to recover the uniformly distributed optimal weight by directly modifying the aggregation weights of the sampled clients. One way to approximate the global model update in this case is to choose clients with higher data quality in priority (i.e. local data distribution similar to the global one), which needs and are already known and is out of the scope of our discussion. Therefore, we limit our discussion to the case where and (i.e. the solid angle for can be computed by first dissecting into simplicial cones (Ribando 2006)).
Based on the equation (35), we demonstrate that the large average shortest-path distance will encourage a large . We rearrang the equation (35) as
| (36) |
Now we respectively show how enlarging the average shortest-path distance (i.e. the equation (24)) leads to the increasing of the two terms on the right hand side of the equation (36).
The Impact on The First Term.
To study how the determinant is impacted by the average shortest-path distance of the sampled clients, we compute the volume of the parallelepiped with the columns in (i.e. Definition 1 and Definition 2) to obtain according to Lemma 1 (Peng 2007).
Definition 1.
Let . A parallelepiped is the set
| (37) |
Definition 2.
The -dimensional volume of a parallelepiped is
where and the unique chosen of satisfies .
Lemma 1.
Given a -dimensional parallelepiped in -dimensional space defined by columns in , we have
By denoting , the absolute value of the determinant of is
| (38) | |||
| (39) |
Since , we have
| (40) | ||||
| (41) |
Thus, the inner product of with itself is
| (42) | |||
| (43) |
Given , we have that is a real symmetric matrix and full rank, which indicates that it is orthogonally diagonalizable. Thus, we orthogonally diagonalize into to obtain its inverse where . And we rewrite the equation (43) with as:
| (44) | ||||
| (45) | ||||
| (46) |
From the equation (46), we can see that keeping less similar with all the other vectors (i.e. ) will increase . In addition, the analysis doesn’t specify the th vector in to be any particular client. Therefore, enlarging will also enlarge the absolute value of the determinant of .
The Impact on The Second Term.
According to Cauchy–Schwarz inequality,
| (47) | ||||
| (48) | ||||
| (49) | ||||
| (50) |
which indicates that enlarging in the equation (24) can improve the lower bound of the second term of the solid angle.
Therefore, we conclude that keeping the average shortest-path distance of the sampled subset to be large will increase the chance to find a proper aggregation weight to well approximate the true model update.
∎
Appendix B B. Results on Constructed 3DG
We also run FedGS on the 3DG constructed by using the proposed functional similarity and cosine similarity of model parameters. We vary the same for and , and list the optimal results of them with the same settings of Table 2, as is listed in Table 4. For Synthetic dataset, outperforms FedGS and under most of the client availability, which suggests that our definition of the oracle graph on Synthetic dataset is not the true oracle one. For CIFAR10, ’s performance is competitive with the results obtained by FedGS, and the two methods consistently outperform in most cases. For FashionMNIST, and suffer more performance reduction than CIFAR10. However, they still outperform MDSample and UniformSample when client availability changes (0.313 v.s. 0.333 in YC).
| Setting | FedGS | |||
|---|---|---|---|---|
| Synthetic | IDL | 0.306 | 0.304 | 0.304 |
| LN | 0.305 | 0.306 | 0.304 | |
| SLN | 0.318 | 0.319 | 0.318 | |
| LDF | 0.308 | 0.306 | 0.307 | |
| MDF | 0.310 | 0.310 | 0.309 | |
| CIFAR10 | IDL | 0.968 | 0.963 | 0.971 |
| LN | 0.972 | 0.972 | 0.973 | |
| SLN | 0.996 | 0.991 | 0.994 | |
| LDF | 0.966 | 0.975 | 0.967 | |
| MDF | 0.963 | 0.962 | 0.965 | |
| Fashion | IDL | 0.299 | 0.305 | 0.304 |
| YMF | 0.303 | 0.307 | 0.307 | |
| YC | 0.307 | 0.314 | 0.313 | |
Appendix C C. Experimental Details
Datasets
Synthetic.
We follow the setting in (Li et al. 2020) to generate this dataset by
| (51) |
where is the th example in the local data of client . For each client , its local optimal model parameter is generated by , and its local data distribution is generated by . The local data size for each client is . In our experiments, we generate this dataset for 30 clients with .
CIFAR10.
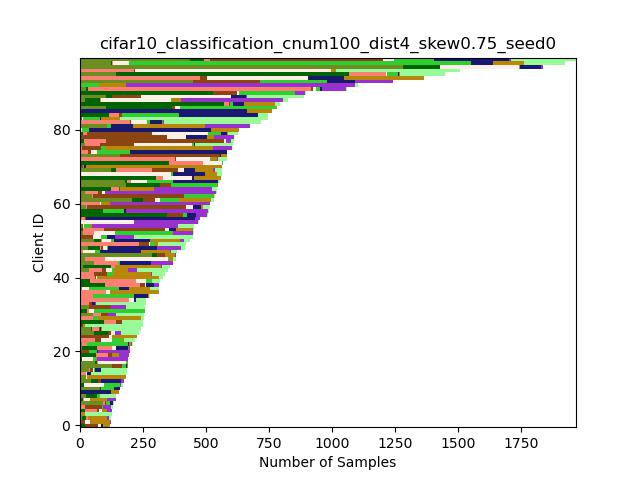
The CIFAR10 dataset (Krizhevsky, Hinton et al. 2009) consists of totally 60000 32x32 colour images in 10 classes (i.e. 50000 training images and 10000 test images). We partition this dataset into 100 clients with both data size imbalance and data heterogeneity. To create the data imbalance, we set each client’s local data size to keep the mean data size is . Then, we generate the local label distribution for each client, where is the label distribution in the original dataset. Particularly, we loop replacing the local label distribution of clients with the new generated one from the same distribution until there exists no conflict with the allocated local data sizes, which allows the coexisting of controllable data imbalance and data heterogeneity. We use in our experiments and provide the visualized partition in Fig.7(a).
FashionMNIST.
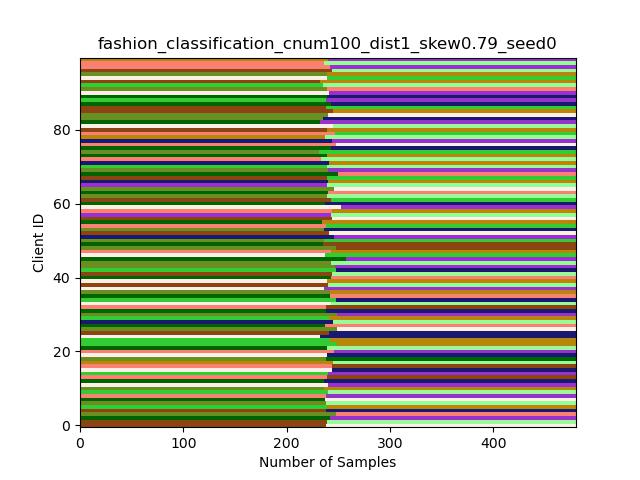
The dataset (Xiao, Rasul, and Vollgraf 2017) consists of a training set of 60,000 examples and a test set of 10,000 examples, where each example is a size image of fashion and associated with a label from 10 classes. In this work, we partition this dataset into 100 clients and equally allocate the same number of examples to each one, where each client owns data from two labels according to (McMahan et al. 2017). A direct visualization of the partitioned result is provided in Fig.7(b).
Models.
Hyperparameters
For each dataset, we partition each client’s local data into training and validating parts. Then, we tune the hyperparameters with FedAvg(McMahan et al. 2017) by grid search on the validation datasets under the ideal client availability. The batch size is for Synthetic and for both CIFAR10 and FashionMNIST. Specifically, we fixed the local updating steps instead of epochs to avoid unexpected bias caused by imbalanced data (Wang et al. 2020). We search the number of local update steps in for all the datasets and the learning rate . For CIFAR10, the optimal parameters are and we train the model for 1000 rounds. For Synthetic, we train the model for 1000 round using . For FashionMNIST, we train the model for 500 rounds with the optimal parameters . We round-wisely decay the learning rate by a factor of for all the datasets. To simulate the communication constraint of the server, we fixed the proportion of selected clients to be for CIFAR10 and FashionMNIST, and for Synthetic dataset, respectively.
Client Availability Modes
To obtain the results in Table 2, we conduct experiments under the client availability modes of IDL, LN0.5, SLN0.5, LDF0.7, MDF0.7, YMF0.9 and YC0.9 across different datasets, where the float number at the end of the name of these settings is the coefficient that controls the degree of the global unavailability of clients. For each client availability mode, we visualize the active states of clients in each communication round, which provides an intuitive way to distinguish the difference between the client availability modes. In Fig.8, we respectively visualize the IDL, LDF0.7, MDF0.7 in Synthetic, LN0.5, SLN0.5 in CIFAR10 and YMF0.9, YC0.9 in FashionMNIST. For a fair comparison of different methods, we use an independent random seed (i.e. independent to the other random seeds used to optimizing the model) to control the active states of clients in each communication round, which promises that the active states of clients will remain unchanged when running different methods.
Oracle 3DG For Datasets
For FashionMNIST and CIFAR10, we use the local data distribution vectors as the features to calculate the similarities among clients. For Synthetic, since the difference between clients’ local data mainly locates in the optimal model, we directly use the local optimal model parameters as the feature vectors. Then, we use the inner dot as the similarity function to compute the similarity matrix . We further normalize the similarity value to by computing , and finally use the normalized similarity matrices to construst the oracle 3DGs as mentioned in Sec.3.2.
Appendix D D. Scalar Product Protocol
In our first method to construct the 3DG, we use techniques based on Secure Scalar Product Protocols (SSPP) to compute the dot product of private vectors of parties. We argue that any existing solution of SSPP can be used in our settings. Here we introduce (Du and Zhan 2002) to our FL scenario. The original protocol works as follows. Alice and Bob have different features on the same individuals and want to calculate the scalar product of their private vectors and , both of size where is the sample size of the datasets. They will do this with the help of a commodity server named Merlin. The protocol consists of the following steps. First, Merlin generates two random vectors , of size and two scalars and such that , where either or is randomly generated. Merlin then sends to Alice and to Bob. Second, Alice sends to Bob, and Bob sends to Alice. Third, Bob generates a random number and computes , then sends the result to Alice. Fourth, Alice computes and sends the result to Bob. Finally, Bob calculates the final result . In our FL settings, since there are no communications between clients, we pass intermediate variables between clients through the server. The pseudo codes in Algorithm 2 summarizes the steps of scalar product in our FL settings.
Input:The client ’s feature vector , and the client ’s feature vector