Strong Dark Matter Self-interactions Diversify Halo Populations within and surrounding the Milky Way
Abstract
We perform a high-resolution cosmological zoom-in simulation of a Milky Way (MW)–like system, which includes a realistic Large Magellanic Cloud analog, using a large differential elastic dark matter self-interaction cross section that reaches at relative velocities of , motivated by the diverse and orbitally dependent central densities of dwarf galaxies within and surrounding the MW. We explore the effects of dark matter self-interactions on satellite, splashback, and isolated halos through their abundance, central densities, maximum circular velocities, orbital parameters, and correlations between these variables. We use an effective constant cross section model to analytically predict the stages of our simulated halos’ gravothermal evolution, demonstrating that deviations from the collisionless – relation can be used to select deeply core-collapsed halos, where is a halo’s maximum circular velocity, and is the radius at which it occurs. We predict that a sizable fraction () of subhalos with masses down to is deeply core collapsed in our SIDM model. Core-collapsed systems form of the isolated halo population down to the same mass; these isolated, core-collapsed halos would host faint dwarf field galaxies with extremely steep central density profiles. Finally, most halos with masses above are core-forming in our simulation. Our study thus demonstrates how self-interactions diversify halo populations in an environmentally dependent fashion within and surrounding MW-mass hosts, providing a compelling avenue to address the diverse dark matter distributions of observed dwarf galaxies.
1 Introduction
Self-interacting dark matter (SIDM) has long been considered a promising alternative to the cold, collisionless dark matter (CDM) paradigm, particularly due to its effects on small-scale structure. For example, SIDM has been studied in the context of cored halo inner density profiles, subhalo tidal evolution, the diversity of galactic rotation curves, gravitational lensing, and the interplay with baryonic feedback (e.g., see Tulin & Yu 2018; Adhikari et al. 2022 for reviews). A growing number of idealized and cosmological simulations show that dark matter (DM) self-interactions can yield diverse effects on halo properties as a function of halo mass (e.g., Vogelsberger et al. 2012; Rocha et al. 2013; Zavala et al. 2013; Dooley et al. 2016; Robles et al. 2019; Nadler et al. 2020a, 2021a; Turner et al. 2021; Ebisu et al. 2022; Shirasaki et al. 2022; Silverman et al. 2023). Moreover, these effects depend on halos’ secondary properties, including concentration (e.g., Kaplinghat et al. 2016; Kamada et al. 2017; Essig et al. 2019; Correa et al. 2022; Zeng et al. 2022).
Various SIDM simulations have been used to predict the impact of self-interactions on small-scale structure. These simulations suggest that a cross section on relative velocity scales of can address potential small-scale structure tensions associated with CDM (Rocha et al. 2013; Kamada et al. 2017; Ren et al. 2019). Because observations of galaxy clusters imply that on larger velocity scales (; e.g., Peter et al. 2013; Harvey et al. 2015; Kaplinghat et al. 2016; Andrade et al. 2022), SIDM models that significantly affect small-scale structure therefore likely feature velocity-dependent scattering (e.g., Correa 2021; Kim & Peter 2021; Silverman et al. 2023). A velocity-dependent cross section is naturally realized in particle physics models that feature, e.g., Rutherford or Møller scattering (Feng et al., 2009, 2010; Buckley & Fox, 2010; Loeb & Weiner, 2011; Tulin et al., 2013; Agrawal et al., 2017; Girmohanta & Shrock, 2022; Yang & Yu, 2022). Moreover, velocity-dependent SIDM models can be tuned to agree with cosmological observables over a wide range of scales and yield novel, scale-dependent effects on structure formation (e.g., Kaplinghat et al. 2016; Feng et al. 2021; Gilman et al. 2021, 2022; Yang & Yu 2021; Correa et al. 2022; Loudas et al. 2022; Lovell & Zavala 2023; Meshveliani et al. 2022).
In this context, it is interesting to consider how velocity-dependent self-interactions affect the properties of the low-mass halos that host the faintest galaxies. Self-interactions do not significantly affect halo evolution at early times (e.g., Rocha et al. 2013), when the bulk of star formation occurs in low-mass galaxies (Simon, 2019); thus, dwarf galaxy formation is expected to be similar in CDM and SIDM. Meanwhile, late-time (sub)halo properties can be altered due to the gravothermal and orbital evolution of SIDM (sub)halos, which may, in turn, affect the properties of the galaxies they host. In SIDM, halos with low stellar-to-halo mass ratios and concentrations are usually expected to have flat inner density profiles due to core formation, where core sizes depend on the SIDM model and halo properties (e.g., Spergel & Steinhardt 2000; Davé et al. 2001; Vogelsberger et al. 2012; Rocha et al. 2013). However, if the scattering rate is sufficiently large, some compact halos can evolve into a core-collapse phase where both the central density and velocity dispersion rise in time in a runaway fashion (e.g., Lynden-Bell & Wood 1968; Balberg et al. 2002; Koda & Shapiro 2011; Feng et al. 2022). Tidal effects can further accelerate the gravothermal evolution of some subhalos (e.g., Nishikawa et al. 2020), hence increasing the probability of observing satellite galaxies hosted by subhalos with high central densities. This mechanism has been demonstrated by simulating subhalos on the orbits chosen to resemble individual galaxies, e.g., for systems with properties similar to the MW satellite galaxies with high inner densities, such as Draco (Kahlhoefer et al., 2019; Sameie et al., 2020; Correa, 2021).
The halo of our own Milky Way (MW) galaxy harbors low-mass subhalos that host dwarf galaxies spanning several orders of magnitude in subhalo and stellar mass, down to the smallest ultra-faint dwarf galaxies with only hundreds of stars (for a review, see Simon 2019). Over candidate MW satellite galaxies are now known (McConnachie, 2012; Drlica-Wagner et al., 2020), and this population continues to motivate small-scale studies. For example, the “too-big-to-fail” problem (TBTF; Boylan-Kolchin et al. 2011, 2012) suggests that the largest subhalos of MW-mass hosts have significantly higher maximum circular velocity () values than inferred observationally for the brightest MW satellites. This problem can be alleviated by a variety of baryonic mechanisms, including tidal stripping by the central galactic disk and internal feedback (e.g., Brook & Di Cintio 2015; Garrison-Kimmel et al. 2019), or simply if the mass of the MW halo is lighter than commonly assumed (e.g., Wang et al. 2012; Jiang & van den Bosch 2015). Velocity-independent SIDM models with interactions at the level can also alleviate the tension because self-interactions significantly reduce the central densities of the corresponding halos in these scenarios (e.g., Zavala et al. 2013); however, this may come at the cost of producing too few surviving subhalos, and too few high-density systems (e.g., Kim & Peter 2021; Turner et al. 2021; Silverman et al. 2023). Meanwhile, following the proper-motion measurements of MW satellites delivered by Gaia in recent years (e.g., Simon 2018; Pace et al. 2022), an anticorrelation between satellites’ inferred inner DM densities and pericentric distances has been reported (e.g., Kaplinghat et al. 2019). Such an anticorrelation may be produced if only the densest subhalos survive in the inner regions of the MW, and potentially by observational selection effects. Nonetheless, SIDM scenarios in which low-mass subhalos efficiently core collapse may intrinsically predict such an anticorrelation if these extremely dense systems can survive the MW’s tides.
Going beyond the MW satellite population, intriguing properties of field dwarf galaxies have also been reported, including a potential TBTF problem for isolated Local Group dwarfs (e.g., Garrison-Kimmel et al. 2014; Papastergis et al. 2015). In addition to the low-density systems in question for TBTF-like tensions, recent observations also hint that some field dwarf galaxies have surprisingly high inner densities. For example, the Tucana dwarf galaxy is inferred to have a very-high-amplitude and steep central density profile (Gregory et al. 2019; however, see Taibi et al. 2020), and may be tidally affected as a splashback system of Andromeda (e.g., Santos-Santos et al. 2023). Such overly dense systems are thought to be rare in CDM, particularly because feedback from galaxy formation primarily cores halos at these mass scales via supernova feedback (e.g., Dutton et al. 2020). Taken together, the existence of overdense and underdense outliers among the Local Group isolated dwarf population is similar to the well-studied “diversity problem” of galactic rotation curves (e.g., Kuzio de Naray et al. 2010; Oman et al. 2015; Ren et al. 2019; Santos-Santos et al. 2020). Once again, strong, velocity-dependent SIDM models provide intriguing ways to address such tensions, because they can yield sizable populations of both core-collapsed and core-forming halos that may respectively correspond to overdense and underdense field galaxies, further beyond previous SIDM studies on this subject, which focus on the core-forming regime (e.g., Creasey et al. 2017; Kamada et al. 2017; Ren et al. 2019; Santos-Santos et al. 2020; Zentner et al. 2022).
All of these considerations motivate a careful study of SIDM scenarios that produce (sub)halos in both the core-expansion and core-collapse phases, thereby yielding a large spread in their central densities. For halos with masses of - and a median concentration, we estimate the collapse timescale to be for a cross section amplitude of , based on analytic predictions for the core-collapse timescale (Essig et al., 2019). With such a large cross section, we expect a significant fraction of dwarf halos to be in the collapse phase. On the other hand, to avoid a substantial reduction of the number of subhalos due to evaporation associated with subhalo–-host halo interactions (Nadler et al., 2020a), the cross section must be suppressed at the velocity scale set by the MW host halo. Thus, we are led to consider a velocity-dependent cross section with at the velocity scale set by a host halo.
In this work, we study such a model by performing a high-resolution cosmological zoom-in simulation of an MW-like system, and we explore the effects of SIDM on halos both within and surrounding the MW-like host. Importantly, our simulation includes an analog of the Large Magellanic Cloud (LMC) system—i.e., a subhalo with a mass of that accreted into the MW halo ago, and is currently at a distance of from the center of the MW. Following our estimate above, we consider a strong and velocity-dependent cross section that features Rutherford-like scatterings among DM particles and reaches a momentum transfer cross section at relative velocity scales of , which roughly correspond to the (sub)halos that host ultra-faint dwarf galaxies (Jethwa et al., 2018; Graus et al., 2019; Nadler et al., 2020b; Silverman et al., 2023). We will show that this model yields a significant fraction of low-mass core-collapsed (sub)halos within and surrounding the MW, and that it naturally produces the anticorrelation between subhalo central density and pericentric distance hinted at by Gaia observations.
Importantly, we explore the environmental dependence of self-interactions’ effects on halos and subhalos using a large portion of the high-resolution region in our zoom-in simulations, out to from the center of the MW halo. This combination of resolution and volume allows us to analyze the SIDM effects on halos and subhalos both within and surrounding the MW. We specifically study subhalos of the MW, subhalos associated with its LMC analog, splashback subhalos of the MW, and isolated halos. Halos in each category are subject to distinct SIDM effects. For example, subhalos’ core formation may be enhanced by tidal stripping due to the MW (e.g., Vogelsberger et al. 2012; Dooley et al. 2016; Nadler et al. 2020a; Yang et al. 2020) or LMC (Nadler et al., 2021a), and their core collapse may be accelerated by these same tidal fields (e.g., Kahlhoefer et al. 2019; Nishikawa et al. 2020; Sameie et al. 2020; Yang & Yu 2021; Zeng et al. 2022). Meanwhile, splashback halos experience particularly strong tidal effects during their pericentric passages, and even isolated halos may core collapse if their initial concentration is sufficiently high. From an observational perspective, the environmentally dependent effects of SIDM on isolated halos, splashback halos, and subhalos are interesting because satellite and field dwarf galaxies with remarkable properties are rapidly being discovered in the Local Volume and beyond (e.g., Caldwell et al. 2017; Gregory et al. 2019; Torrealba et al. 2019; Li et al. 2022). At face value, some of these galaxies’ properties are difficult to explain in standard CDM scenarios (e.g., Crater II; see Borukhovetskaya et al. 2022), motivating careful comparisons to full-fledged cosmological SIDM simulations that self-consistently predict the correlated properties of isolated halo and subhalo populations.
As part of our analysis, we apply a constant effective cross section model, which has recently been discussed in Yang & Yu (2022), Yang et al. (2023), and Outmezguine et al. (2022), to analytically predict the gravothermal evolution stages of halos in our SIDM simulation. This model captures the leading-order effects of a generic velocity-dependent elastic cross section on halo dynamics. By quantifying halos’ gravothermal evolution, we gain additional insights into the resulting SIDM effects on halo populations in comparison to CDM. For example, we show that a combination of halos’ maximum circular velocity, , and the radius at which it occurs, , can be used to accurately select deeply core-collapsed halos. Furthermore, although this constant effective cross section approach has only been validated using isolated halos, we show that it is useful to explain the behavior of both halos and subhalos in our simulations. In future work, we plan to further explore this analytic approach to distinguish the effects of different SIDM models on halo and galaxy properties.
The paper is organized as follows. Section 2 introduces our cosmological zoom-in simulations, including our SIDM model implementation, simulation setup, and halo categorization. Section 3 presents detailed evolution histories of core-collapsed and core-forming halos, discusses the physics of gravothermal evolution, presents the – relation for isolated halos and subhalos in our simulations, and proposes a criterion for selecting deeply core-collapsed systems based on their halo properties. Section 4 compares the characteristics of halos within and surrounding the MW in our SIDM and CDM simulations, and places these results in the context of satellite and isolated dwarf galaxy observations. Section 5 discusses our findings in light of recent SIDM studies, as well as future work; Section 6 summarizes and concludes.
2 Simulations
2.1 SIDM Implementation
We consider a strong and velocity-dependent SIDM model that features Rutherford-like scatterings among DM particles, with a differential cross section
| (1) |
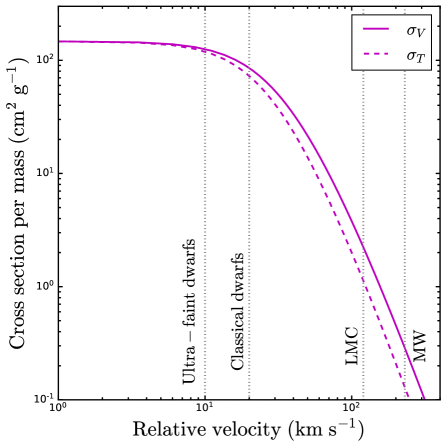
where is a velocity parameter, and controls the normalization (Feng et al., 2010; Ibe & Yu, 2010). Requiring the momentum transfer cross section , at , and , at , (equivalent to the “vd100” model in Turner et al. 2021), we obtain , . Figure 1 shows the velocity dependence of the viscosity and momentum transfer cross sections for this model (see Yang & Yu 2022 for details). The large cross section and strong velocity dependence of our model is expected to cause a sizable fraction of low-mass halos and subhalos in our simulations to core collapse by (e.g., see Turner et al. 2021; Lovell & Zavala 2023).
We implement elastic DM self-interactions in the public GADGET-2 code following the approach described in Yang & Yu (2022), which in turn follows the procedure in Robertson et al. (2017) with a few modifications. For isolated simulations, the details of our implementation are described in Yang & Yu (2022); in this work, we extend the SIDM module to enable cosmological simulations. Briefly, our module allows a particle to scatter with multiple particles in each time step, where the scattering partners are selected based on a probabilistic approach, considering a neighbor search radius that equals the spline length, , where is the comoving Plummer-equivalent gravitational softening length in our simulations (see Section 2.2). In Appendix A, we provide more details on our implementation and validate our approach by showing that a cosmological simulation of an isolated halo with yields an equivalent density profile as in a Newtonian simulation.
Our SIDM implementation fully accounts for the angular dependence of the differential scattering cross section, as in previous idealized (Robertson et al., 2017) and cosmological simulations (e.g., Banerjee et al. 2020; Nadler et al. 2020a, 2021a). Note that we do not distinguish the species of the incoming scattering particles in our simulation. Thus, our result is equivalent to a physical scenario of Rutherford scattering where the simulation particles are divided into two species of equal amounts, and the cross section is four times the simulated one (Yang & Yu, 2022).
2.2 Cosmological Zoom-in Simulations
We perform a cosmological zoom-in simulation of an MW-like system using the SIDM model described above, and we compare our results to a corresponding CDM simulation with identical initial conditions. A lower-resolution version of this MW-like simulation was originally presented in Mao et al. (2015), used in Nadler et al. (2020b, 2021b), Mau et al. (2022) to model the MW satellite galaxy population, and resimulated in a velocity-independent SIDM model to study the effects of self-interactions on subhalos associated with the LMC in Nadler et al. (2021a). The higher-resolution CDM simulation that we use here was first presented in Nadler et al. (2020b), and our high-resolution SIDM simulation with a velocity-dependent cross section is presented here for the first time.
Our CDM and SIDM zoom-in simulations have a high-resolution particle mass of , with a Plummer-equivalent gravitational softening of . The simulations are performed using GADGET-2 (Springel, 2005); halos are identified using ROCKSTAR (Behroozi et al., 2013a), and merger trees are constructed using consistent-trees (Behroozi et al., 2013b). The cosmological parameters for both runs are , , , , and (Hinshaw et al., 2013).111This choice of yields an LMC analog that falls into the MW at the correct lookback time (see the discussion in Appendix A of Mau et al. 2022). We report virial masses using the Bryan & Norman (1998) definition, which corresponds to times the critical density of the universe at given our cosmological parameters.
At , the mass of the MW host halo in both our CDM and SIDM simulation is . This mass is consistent with many recent MW mass measurements (e.g., see Shen et al. 2022 for a recent compilation). Furthermore, the virial concentration of both our CDM and SIDM host halos is , which is also broadly consistent with the inferred concentration of the MW halo (e.g., Callingham et al. 2019). As discussed in Nadler et al. (2021b), we emphasize that our host halo’s mass and concentration measurements are performed in the absence of baryons, which alter the MW’s inferred mass and concentration (e.g., Cautun et al. 2020).
In both runs, an analog of the LMC with a mass of accretes into the MW (i.e., first crosses within the MW’s virial radius) ago. These properties are consistent with recent estimates of the LMC’s mass (e.g., based on its dynamical impact on stellar streams; Erkal et al. 2019), and the orbits of our LMC analogs are consistent with the LMC’s measured orbital properties (e.g., Kallivayalil et al. 2013). In addition to these LMC analogs, our hosts experience major mergers between with halos that are broadly similar to Gaia-Enceladus (see Nadler et al. 2020b). Our hosts have quiescent merger histories after this event, and therefore have formation histories that resemble the MW’s reconstructed merger history (e.g., see Helmi 2020 for a review).
Finally, we emphasize that the high-resolution zoom-in regions in both our CDM and SIDM simulations extend to times the virial radius of the MW host halo, corresponding to .222In particular, greater than of the particles within of the MW host halo center are high-resolution particles (Wang et al., 2021). Thus, we only study halos within this radius from the center of the MW host. Thus, there is a substantial population of halos outside the virial radius of the MW host halo in both simulations. This population includes isolated “field” halos that do not reside within the virial radius of larger systems, subhalos of lower-mass hosts in the region surrounding the MW, and “splashback” halos of the MW—i.e., halos that previously orbited inside of the MW but are outside of its virial radius today (e.g., Adhikari et al. 2014; Diemer & Kravtsov 2014; More et al. 2015). Here, we study four halo populations: (1) MW subhalos, (2) LMC-associated subhalos (i.e., MW subhalos that accreted into the MW as subhalos of the LMC), (3) splashback subhalos of the MW, and (4) isolated halos. We defer a study of subhalos (and splashback halos) of lower-mass hosts throughout the zoom-in region to future work.
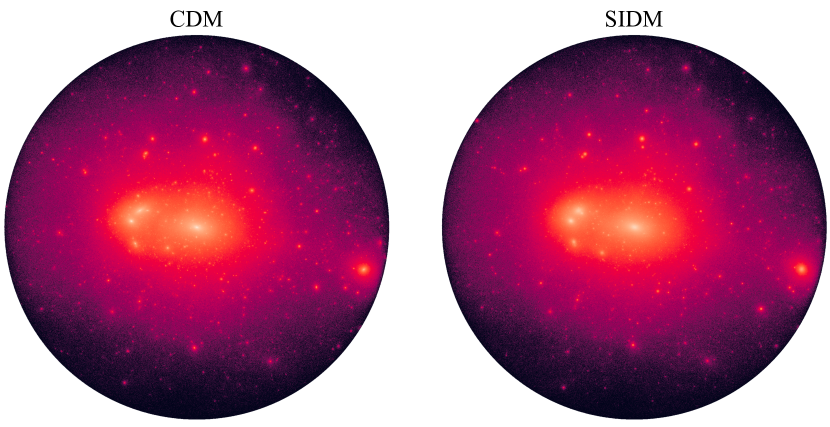
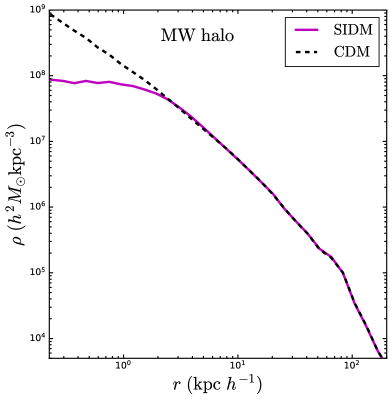
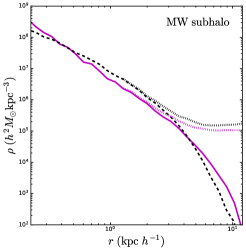
Figure 2 shows projected DM density fields within the virial radius of our CDM (left) and SIDM (right) hosts, and Figure 3 shows the CDM (black) and SIDM (magenta) MW host halo density profiles. The MW host halo exhibits a core in our SIDM simulation, which is expected given that our cross section is greater than at the MW halo velocity scale (e.g., Nadler et al. 2020a). Note that this core is not expected to remain in a full hydrodynamic setting because SIDM efficiently responds to a baryon-dominated central gravitational potential, thus regenerating a cusp (Kaplinghat et al., 2014; Sameie et al., 2018; Robles et al., 2019; Rose et al., 2023).
Visually, our SIDM model has little effect on the spatial distribution and abundance of MW subhalos. This is qualitatively expected; due to the strong velocity dependence of our SIDM model (Figure 1), the scattering cross section decreases as at large velocities, suppressing evaporation due to subhalo–host halo interactions, which may reduce the subhalo masses and potentially completely unbind them at late times (Vogelsberger et al., 2012; Nadler et al., 2020a; Slone et al., 2021; Zeng et al., 2022). We return to this point in detail when discussing the subhalo mass function in Section 4. However, due to the mass and concentration dependence of the velocity profile in a halo, we also expect the SIDM effects to be stronger in inner regions of more compact and lower-mass halos. Thus, although the projected density fields in our CDM and SIDM simulations are similar, the details of subhalos’ positions and internal density structure are clearly affected by SIDM on small scales. As we will demonstrate, our SIDM model facilitates both core formation (in massive, low-concentration halos) and core collapse (in low-mass, high-concentration halos), for halos both within and surrounding the MW.
2.3 Categorizing Halos
We use the ROCKSTAR (Behroozi et al., 2013a) halo finder to identify halos in our simulation snapshots, and we use the consistent-trees (Behroozi et al., 2013b) merger tree code to reconstruct merger histories of these halos. Our simulations’ resolution allows us to robustly resolve both isolated halos and tidally evolved subhalos with present masses greater than , corresponding to systems with particles at . In particular, this cut is well above the convergence limit for subhalo abundance measurements in zoom-in simulations (Nadler et al., 2023), and is comparable to the particle count threshold necessary to robustly resolve the tidally stripped density profiles of CDM subhalos (Errani & Navarro, 2021).
In Appendix B, we demonstrate that—even for tidally evolved subhalos at our resolution cut—gravothermal evolution in our cosmological simulation is in good agreement with idealized simulations that pass stringent convergence tests for halos above our fiducial mass threshold. We will also show that the core-collapse timescales of halos in our SIDM simulation are in reasonable agreement with those predicted by an empirical SIDM fluid model. Nonetheless, we note that the gravothermal evolution of the lowest-mass halos in our SIDM simulation may potentially suffer from convergence issues because detailed convergence tests have not been carried out for core-forming or core-collapsed systems in a cosmological setting. Because insufficient resolution in low-mass halos generally leads to less efficient collisional relaxation than desired, the population of core-collapsed halos we identify is conservative, in the sense that an even higher-resolution simulation is expected to yield a larger fraction of core-collapsed systems down to a fixed halo mass.
Figure 4 illustrates the halo populations we study, highlighting the objects that show signs of core collapse based on the analyses discussed below. In particular, we define the following categories of halos:
-
1.
MW subhalos are halos that reside within the virial radius of the MW at and are not associated with the LMC, including higher-order subhalos (specifically, the upid of these systems must equal the id of the MW host halo at in the ROCKSTAR halo list).
-
2.
LMC-associated subhalos are objects that were within the virial radius of the LMC halo at the time of LMC infall into the MW ( ago, in our simulation), following the “fiducial definition” in Nadler et al. (2020b). Many of these objects still reside within the virial radius of the LMC at , and thus are higher-order subhalos of the MW because the LMC itself is an MW subhalo.
-
3.
Splashback halos are halos that have orbited within the virial radius of the MW halo at , but reside outside the MW virial radius today. These systems are usually characterized by a single, strong tidal stripping and heating event along their evolution history, corresponding to a pericentric passage around the MW.
-
4.
Isolated halos reside outside of the virial radius of any larger halo at (specifically, the upid of these systems must equal in the ROCKSTAR halo list), have never passed within the virial radius of the MW halo, and are within of the MW halo center. These systems are subject to much less significant tidal effects than those of subhalos; thus, the effects of SIDM on these halos are expected to exhibit less scatter than for tidally affected systems.
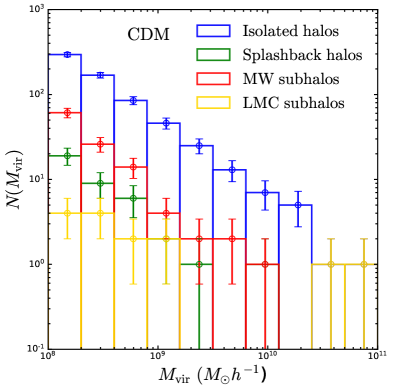
According to these definitions, there are 647 (626) isolated halos within, 110 (96) MW subhalos, 15 (19) LMC-associated subhalos, and 38 (35) splashback halos above our fiducial mass threshold of in our CDM (SIDM) simulation.
In Figure 4, we see by eye that a significant population of core-collapsed halos exists both within and surrounding the MW. In the following sections, we explore the signatures of SIDM on each class of halos defined above.

| Name | () | ||||
|---|---|---|---|---|---|
| LMC analog | |||||
| MW subhalo | |||||
| Isolated | |||||
| Splashback |
Note. — The first column lists the identity of each benchmark halo, the second (third) column lists virial mass (virial radius) at , the fourth (fifth) column lists maximum circular velocity (the radius at which the maximum circular velocity is achieved), and the sixth column lists effective concentration (Equation 3). The LMC analog resides in the core-forming phase and all other benchmark halos reside in the core-collapsed phase; these halos have significantly larger in SIDM compared to CDM.
3 Halos in the Core-collapse and Core-formation Phases
In this section, we explore the effects of self-interactions on the gravothermal evolution of halos—in both the core-formation and core-collapse regions—in our SIDM simulation. To motivate the halo properties that we study, we present evolution histories of representative core-forming and core-collapsed halos in Section 3.1; we then compare analytic estimates of SIDM effects on halo structure in terms of maximum circular velocity, , and the radius at which this maximum occurs, , in Section 3.2; with these predictions and measurements in hand, we define conservative criteria for selecting core-collapsed and core-forming systems based on these halo properties in Section 3.3.
3.1 Halo Evolution Histories
By visually inspecting the density profiles of halos in our SIDM simulation, we find that core-forming halos and deeply core-collapsed halos exhibit clear changes in their density profiles relative to CDM. To motivate our subsequent population analyses, which will be focused on the most extreme core-collapsed and core-forming halos, we therefore begin by studying the structure and evolution history of a representative halo in each regime, in detail. Specifically, we choose the LMC analog halo as a clear (and particularly well-resolved) example of a core-forming system, and we choose a representative low-mass, core-collapsed MW subhalo. We also identify representative, low-mass core-collapsed isolated and splashback halos; we present their evolution histories in Appendix D. Table 1 lists the properties for each of our four benchmark systems, both in our SIDM simulation and for their matched counterpart in CDM.
In the following examples, and throughout the paper, we measure density profiles of halos above our resolution cut as follows: we compute the kinetic and potential energies of particles near each halo and use bound particles to compute halo properties. To compute the potential energy more precisely, we iterate the bound particle selection five times, each time removing some unbound particles; we find that the number of bound particles stabilizes after five iterations.
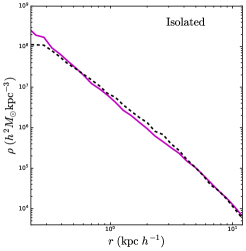
3.1.1 Benchmark Core-forming LMC Halo
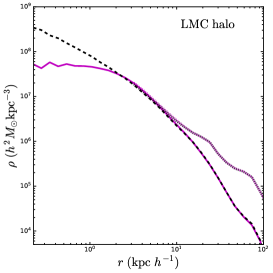
The LMC analog halo in our SIDM simulation, which has a mass of , has formed a prominent core by . Given this mass, our analytic effective cross section model described in Section 3.3 predicts a core-collapse timescale of . Hence, the LMC analog is expected to reside well within the core-forming phase. Note that we do not attempt to compare our LMC analog’s predicted density profile to observations; although the LMC is relatively well observed, inferring its inner kiloparsec DM distribution is challenging because of its proximity and central bar.
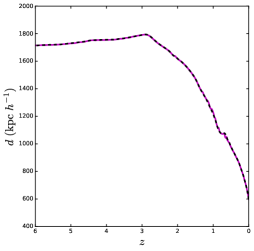
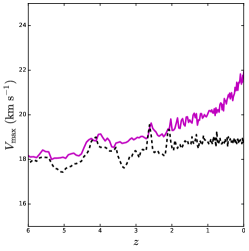
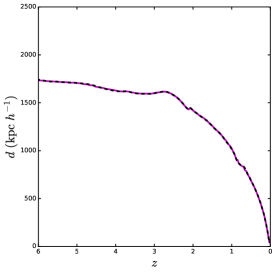
We match LMC analog halos in our CDM and SIDM simulations based on their orbital and evolution histories, which are illustrated in the bottom left and bottom middle panels of Figure 5. We observe that the LMC accreted into the MW at , or ago—consistent with the LMC’s inferred infall time based on proper-motion measurements (e.g., Kallivayalil et al. 2013)—coinciding with the peak in its history before it begins to be tidally stripped by the MW.
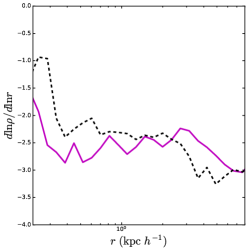
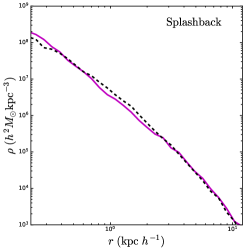
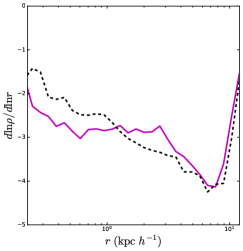
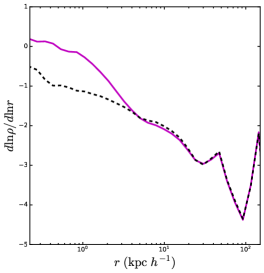
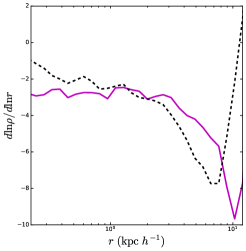
The top left and top middle panels of Figure 5 respectively show the density profile and density profile logarithmic slope of the LMC analog halo in our CDM and SIDM simulations. SIDM thermalizes the inner halo region, reducing the central density; we have also checked that self-interactions increase the inner velocity dispersion, as expected. In our SIDM simulation, the density profile slope starts to become shallower than that in CDM at , and approaches zero in the subkiloparsec regions. At large radii, both the CDM and SIDM LMC analogs have nonconstant density slopes. This is reasonable, because many subhalos are better fit by Einasto profiles with rolling logarithmic density slopes at large radii rather than Navarro–Frenk–White (NFW) profiles (Springel et al., 2008). We analyze density profiles using only bound particles, with results shown as solid lines for SIDM and dashed lines for CDM; for demonstration, we also plot density profiles using all the particles in dotted lines. At large radii, the contribution of unbound particles to the density profiles becomes significant.
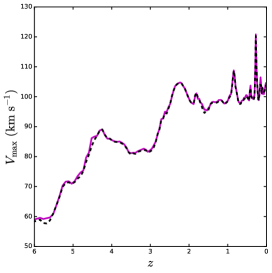
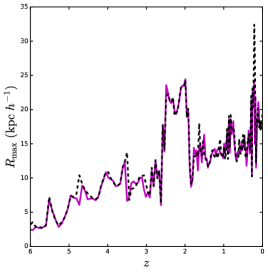
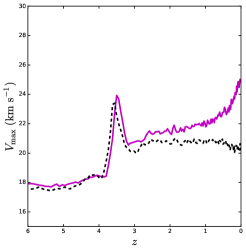
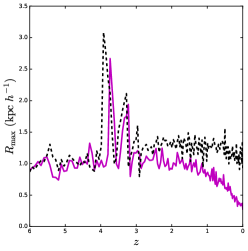
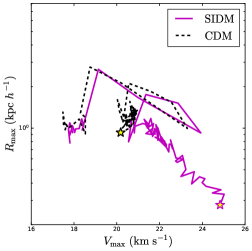
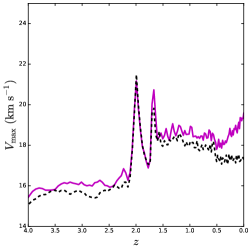
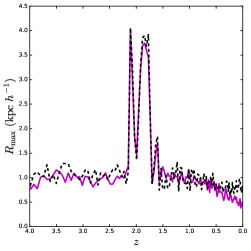
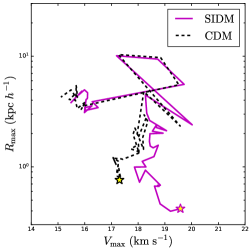
In the bottom panels, we show the evolution of the LMC analog halo’s maximum circular velocity, , and the radius at which this maximum occurs, , as well as the relation between these two variables over time. The core-forming LMC analog halo in our SIDM simulation exhibits a very similar and evolution compared to its CDM counterpart. By visually inspecting many pairs of matched profiles, we find that core-forming halos in SIDM do not appreciably differ from their matched CDM counterparts in terms of their or evolution, in general. This is expected because core formation mainly affects the circular velocity profile inside the core radius, which is in general much smaller than until the final stages of halos’ gravothermal evolution. We note that a small number of halos are actively transitioning from the core-forming to core-collapse phase at ; these halos display moderate changes in and compared to those of CDM. In our analyses of the core-collapsed halos below, we focus on systems that show unambiguous signs of core collapse at , in order to avoid incorrectly identifying a larger fraction of core-collapsed halos than is warranted by our simulation results.
3.1.2 Benchmark Core-collapsed MW Subhalo
Figure 6 shows similar plots as Figure 5, but for a benchmark MW subhalo that shows clear signs of core collapse at . For this subhalo, we find that the CDM density profile is again better fit by an Einasto profile, where the density slope runs with radius, even at large radii, and that its logarithmic density slope approaches in the inner regions, as expected. Unlike core-forming halos, core-collapsed halos have cuspy central density profiles, with an inner logarithmic density slope between and (Balberg et al., 2002); both of these features are clearly visible in the benchmark subhalo.
We find that a clear, consistent indicator of core collapse is an enhancement in and a coincident decrease in at late times, as the gravothermal cusp forms and collapses to smaller radii. In the 2D – planes, we mark the points at redshift zero with stars filled with yellow; near , and particularly after infall into the MW, the SIDM subhalo sharply diverges from its CDM counterpart in this parameter space. Thus, the core-collapse process is likely accelerated after infall by tidal effects (e.g., Kahlhoefer et al. 2019; Nishikawa et al. 2020; Sameie et al. 2020).
In addition, by visually inspecting the evolution histories of many halos, we consistently observe that core-collapse signatures in and begin prior to infall, often after major merger events in a halo’s growth history (e.g., the event at for our benchmark MW subhalo), and are then accelerated by tides at late times. This is perhaps surprising, because major mergers are canonically thought to reset the timescale for gravothermal evolution (Yoshida et al., 2000; Davé et al., 2001). However, realistic halos in a cosmological setting experience upward fluctuations in their concentration following mergers (e.g., Wang et al. 2020), which may facilitate rapid subsequent gravothermal evolution even if core collapse is not dynamically linked to merger events; this mechanism may also increase the core-collapse rates of subhalos relative to isolated halos, as subhalos tend to experience more active early accretion histories due to their environments. Exploring the relationship between major mergers and core-collapse dynamics is an interesting area for future study.
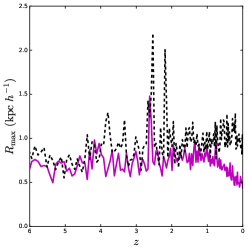
In Appendix D, we present similar evolution histories for benchmark isolated and splashback halos that show signs of core collapse. Many isolated halos that show signs of core collapse, including the benchmark case studied in Appendix D, also undergo major mergers and/or tidal events (around host halos other than the MW) at early times, which manifest as rapid increases in their histories. Thus, major mergers and tidal evolution can play an important role in facilitating core collapse, even for halos that end up isolated today. This is particularly relevant for splashback halos, which usually experience a single pericentric passage around the MW before reaching their apocenter at today. We find that SIDM splashback halos’ evolution differs from its CDM evolution significantly only at late times, after these pericentric passages.
Thus, our SIDM simulation predicts the existence of a population of isolated, core-collapsed halos that are expected to host faint, dense galaxies. Interestingly, only of all isolated halos we consider previously (before ) orbited inside larger hosts; thus, even relatively quiescent formation histories are sufficient to drive core collapse in our SIDM model, although tidal interactions accelerate its onset. Observational searches for such isolated dwarf galaxies with extremely steep DM density profiles (potentially reminiscent of the Tucana dwarf galaxy) are particularly interesting in this context.
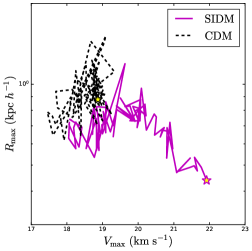
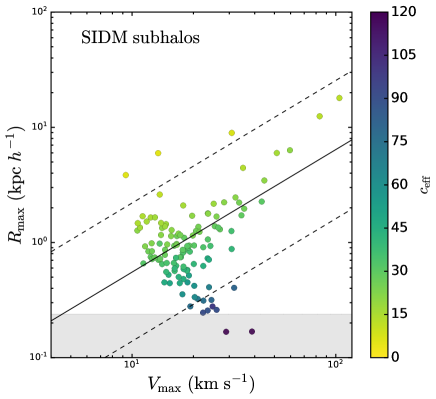
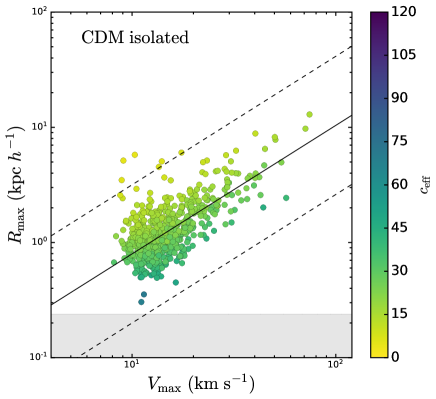
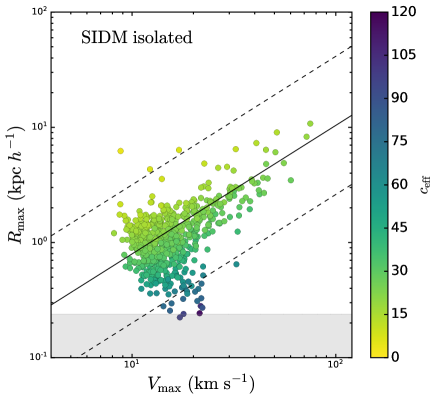
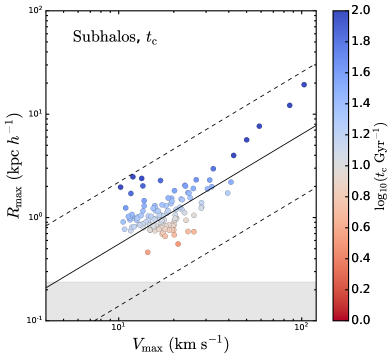
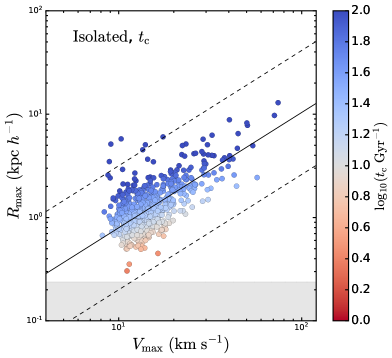
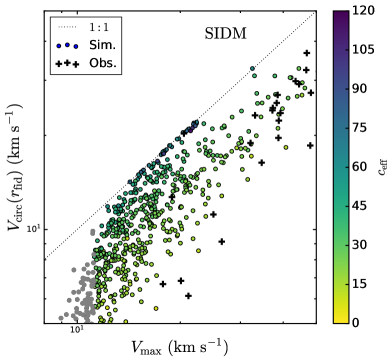
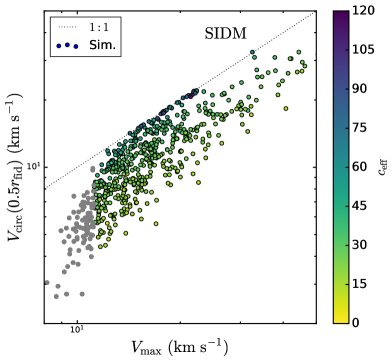
3.2 SIDM Features in the – plane
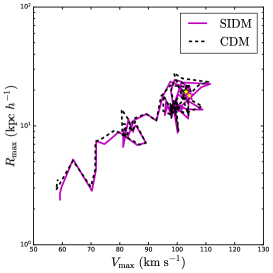
As suggested by Figure 6, core-collapsed halos are shifted toward larger and smaller than their CDM counterparts, with a more significant shift in . Thus, to study the statistical impact of SIDM on halo properties, we consider the distribution of halos in the – plane. In Figure 7, we show the – distribution of all MW subhalos (top) and isolated halos (bottom) that have masses higher than in our CDM (left) and SIDM (right) simulations. For both isolated halos and subhalos in SIDM, a population of objects moves below the lower dashed curve, indicating that they are likely core collapsed. Isolated core-forming halos shift to slightly lower relative to CDM, as suggested by Figure 5, while some diffuse MW subhalos shift toward larger , indicating enhanced tidal stripping of these systems compared to their CDM counterparts.
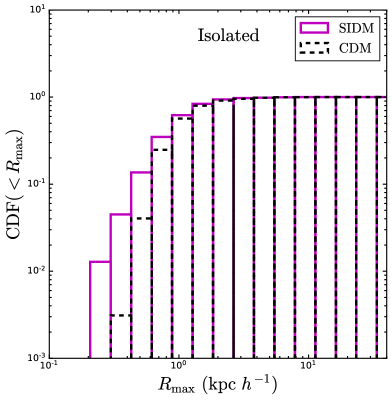
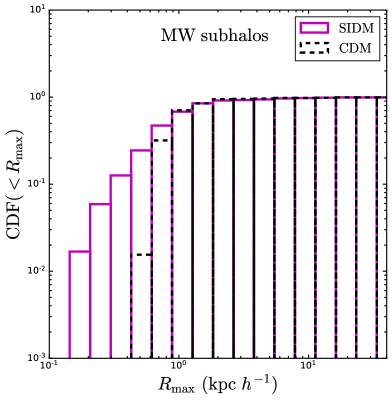
To better study the difference between the CDM and SIDM halo populations, we plot the median relation in the CDM cases, together with symmetric dex bands (see Appendix C for the numerical details of our – fit). We define the core-collapsed candidates as halos that reside below the dex curve from the median relation. Applying this selection, we find 18 isolated core-collapsed halos (two of which are splashback halos) and 10 core-collapsed MW subhalos (one of which is an LMC-associated subhalo). In Figure 8, we show the cumulative probability distribution functions (CDF) of for isolated halos (left) and subhalos (right). The excess of SIDM over CDM at low approximately indicates the rate of isolated and MW subhalo core-collapsed candidates. In particular, using a conservative threshold of to pick out core-collapsed candidates (see Figure 7), we can read off that roughly () of the isolated (MW subhalo) population has potentially core collapsed. The core-collapse rate is higher for subhalos because tidal interactions with the MW accelerate gravothermal evolution (e.g., Kahlhoefer et al. 2019; Nishikawa et al. 2020; Sameie et al. 2020), as suggested by our benchmark study in Figure 6.
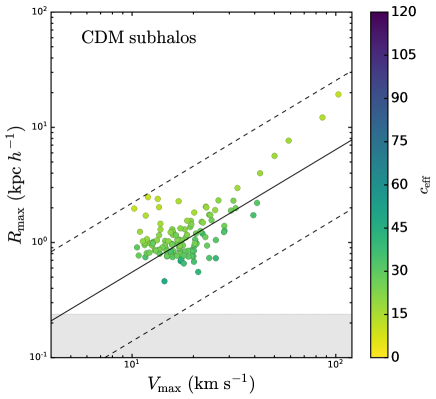
In Figure 7, we also color code the points by their corresponding effective concentrations, defined as
| (2) |
This quantity can be evaluated for both the CDM and SIDM halos and reduced to the common definition for NFW halos. From the gradient in the , we see that SIDM effects are strongly correlated with halo concentration, in agreement with many previous studies (Kaplinghat et al., 2016; Kamada et al., 2017; Essig et al., 2019; Zeng et al., 2022). In particular, the gradient in the – plane is almost perpendicular to the underlying relation, approximately pointing in the direction that differentiates core-collapsed and core-forming SIDM halos.
Aside from the core-collapsed candidates discussed above, we find a few isolated halos and MW subhalos residing to the upper left of the dex band from the median – relation in both our CDM and SIDM simulations. Due to their large sizes and slowly rising rotation curves, the isolated halos in this region of parameter space with can potentially host ultra-diffuse field dwarf galaxies (UDGs; e.g., see Jiang et al. 2019). However, due to the volume of the high-resolution region that we study halos within, we cannot statistically probe the observed UDG populations in the current study; in future work, it will therefore be interesting to consider larger zoom-in volumes in different environments to compare with halo properties inferred for samples of observed UDGs in the field (e.g., Kong et al. 2022; Mancera Piña et al. 2022).
At the low- end, our simulations predict that a handful of diffuse low-mass halos may host faint, low-density isolated dwarf galaxies in the Local Volume. These systems may be field analogs of the lowest surface brightness MW satellite galaxies (e.g., Crater 2 and Antlia 2; Torrealba et al. 2016, 2019). We do not observe significant differences between the isolated CDM and SIDM halo populations in the diffuse, high- region of the – plane; this is expected, as those halos have low concentrations and suppressed self-interaction rates (Kong et al., 2022).
On the other hand, we find that several SIDM subhalos remain in (or evolve to) very diffuse states, whereas no comparably diffuse CDM subhalos exist in our simulation. This may result from mass loss due to ram pressure stripping as a consequence of subhalo–host halo interactions in our SIDM simulation (e.g., Dooley et al. 2016; Nadler et al. 2020a). At the same time, cored SIDM subhalos may be more efficiently tidally heated, particularly because our MW host has a slightly higher density at intermediate radii compared to CDM to compensate for its central core (Banerjee et al., 2020; Slone et al., 2021); all of these effects underscore the diversity and environmental dependence of SIDM (sub)halo populations. We investigate SIDM effects on diffuse halos further in Section 4.5.
3.3 Analytic Predictions for the Core-collapsed Population
To provide theoretical context for the core-collapsed candidate halos identified with large and small above, we analytically estimate the expected number of core-collapsed halos expected in our SIDM model as follows. First, we reduce our differential cross section into an effective constant cross section following Yang & Yu (2022), Yang et al. (2023), and Outmezguine et al. (2022):
| (3) |
where is a characteristic velocity dispersion scale, with , and . Both and reduce to the and parameters for NFW halos. With calculated for every halo in our CDM simulation, we then estimate core-collapse timescales according to
| (4) |
where for an NFW halo (see Pollack et al. 2015; Essig et al. 2019).
We use this model to estimate the distribution of for our isolated halo and subhalo CDM populations. We find that the distributions peak at large values, , because they are dominated by low-mass halos (for which our cross section is large; see Figure 1) due to the underlying halo mass function. The resulting predictions for are shown in Figure 9.333Note that we compute using CDM (rather than SIDM) halo properties because Equation 4 is calibrated on and values derived from NFW profiles, which do not accurately describe SIDM halos. We find that is shorter than the age of the universe for CDM halos with high concentration and small , implying that these halos’ SIDM counterparts should core collapse by . In particular, counting the number of halos with Gyr, we find isolated halos, MW subhalos, LMC subhalo, and splashback halos. Thus, the number of core-collapsed halos predicted by our analytic model is roughly double of that found in our SIDM simulation using the – criteria described in the previous section. For this reason, we argue that our fiducial core-collapsed criteria based on and is conservative, in that it selects the most extreme core-collapsed objects.
4 Population Statistics of Halos within and surrounding the Milky Way
Having identified the effects of self-interactions on specific halo properties, we now compare various observationally relevant properties of MW subhalos and isolated halos in our CDM and SIDM simulations. We also discuss the general trends displayed by our subhalos and isolated halos, in the context of observed MW satellite galaxies and field dwarf galaxies, respectively. We note that our predictions should not be interpreted directly in the space of observables; such predictions would require forward-modeling that accounts for observational selection effects and systematic uncertainties. Furthermore, our simulations do not include baryons or a central MW-like galaxy, both of which affect such comparisons, particularly for MW subhalos. Nevertheless, our study provides a benchmark case for highlighting the effects of SIDM with respect to the CDM limit in light of observations. Note that, for isolated halos toward the lower-mass end, we expect that the baryonic feedback has a negligible effect on the halo density profile.
4.1 Mass Functions
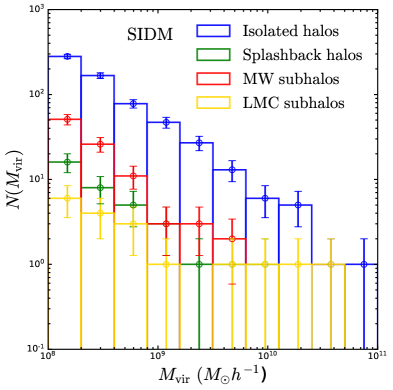
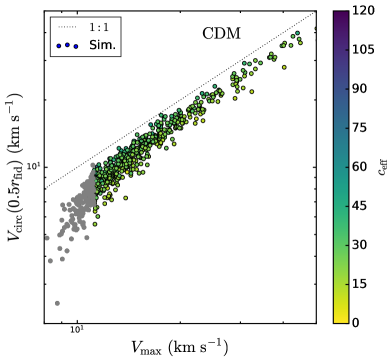
Figure 10 compares the CDM and SIDM mass functions for halos in our four main categories. Because of the volume of our high-resolution region, which extends to of the MW host halo, there are significantly more isolated halos than subhalos. All mass functions rise toward low halo masses, with slopes consistent with previous measurements in zoom-in simulations (e.g., Nadler et al. 2023). Interestingly, for halos down to our fiducial mass resolution limit of , the SIDM mass function is nearly unchanged compared to the CDM case. This is expected for isolated halos, which are only affected by internal self-interactions and are thus not subject to mass loss or disruption.
On the other hand, the similarity between our CDM and SIDM subhalo mass functions is nontrivial. As discussed extensively in Nadler et al. (2020a), self-interactions can potentially affect the subhalo mass function at a significant level due to ram pressure stripping caused by self-interactions between subhalo and host halo particles. This mechanism depends on the amplitude of the cross section at the typical relative velocity between subhalo and host halo particles, for the MW host we consider here. At this velocity scale, our momentum transfer cross section is much smaller than (see Figure 1), so it is plausible that evaporation is a small effect for typical subhalos in our simulations, consistent with other previous studies (e.g., Dooley et al. 2016; Slone et al. 2021; Zeng et al. 2022). Another contributing factor may be that a fraction of low-mass subhalos in our SIDM simulation is core-collapsed (or at least in the core-collapse phase), and is thus more resilient to tidal disruption than its core-forming counterpart. In this context, it is reassuring that our comparison between the CDM and SIDM mass functions agrees reasonably well with those of Turner et al. (2021), who performed a zoom-in simulation of the same SIDM model.
4.2 MW Subhalo Rotation Curves
MW satellite galaxies are expected to reside in halos with sufficiently high peak virial temperatures, e.g., above the atomic hydrogen cooling limit of K, which corresponds to a peak maximum circular velocity of (Graus et al. 2019; also see Nadler et al. 2020b and references therein). Meanwhile, the stellar velocity dispersion measurements suggest that many of the observed MW satellites occupy halos with today, although there are large observational uncertainties in the halo properties for many of these systems (e.g., see Bullock & Boylan-Kolchin 2017; Sales et al. 2022 for reviews). We use these ranges of halo properties to hone in on the subhalos expected to host observable satellite galaxies in our simulations.
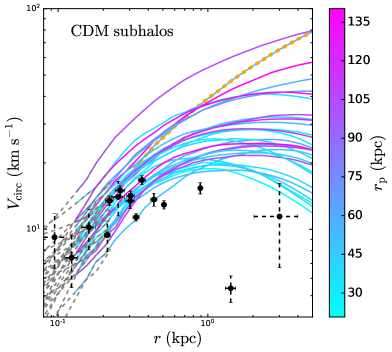
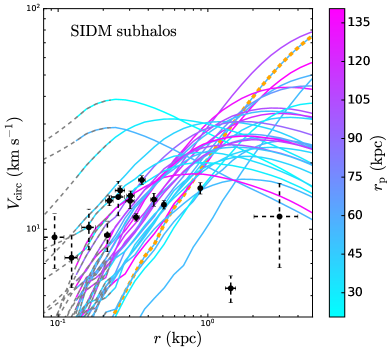
In the top panels of Figure 11, we plot the circular velocities of the 30 MW subhalos with the highest values of , and that reside at least 30 kpc from the MW center, in our CDM and SIDM simulations. For comparison, the circular velocity measurements at the half-light radius for the observed MW satellites are shown for the nine classical MW satellite galaxies (i.e., satellites with -band luminosity , excluding the LMC and SMC; solid black error bars), and for fainter dwarf galaxies (including a handful of ultra-faint dwarfs; dashed black error bars), using the data compiled in Silverman et al. (2023). Many of the subhalo rotation curves in our CDM simulation are higher than the observed points, even if we exclude our LMC analog when comparing to the data, thus reproducing the canonical TBTF problem (Boylan-Kolchin et al., 2011, 2012).
Several baryonic mechanisms may alleviate the TBTF tension in SIDM (Zolotov et al., 2012; Sawala et al., 2016; Wetzel et al., 2016), including enhanced tidal stripping or complete disruption due to the Galactic disk, along with internal feedback for sufficiently massive systems. In particular, the former could be a dominant effect (Sawala et al., 2016; Garrison-Kimmel et al., 2017). For example, Robles et al. (2019) showed that the inclusion of a disk can reduce the circular velocities of subhalos at by %, bringing CDM predictions into better agreement with the data. However, these authors also found that the least dense subhalos (among the most massive ones) tend to have the smallest pericentric distances from the Galactic center, inconsistent with the trend observed for the brightest MW satellites (Kaplinghat et al., 2019); we discuss this point further below.
Our SIDM simulation demonstrates a much larger scatter for the most massive subhalos’ rotation curves, underscoring the diversity of halo populations resulting from self-interactions. For SIDM subhalos with large pericentric distances of , the circular velocity profiles are systematically shifted lower compared to CDM as a result of core formation and tidal stripping. For those with small pericentric distances of , the subhalos with a relatively large mass have lower circular velocities as well, but many low-mass subhalos have enhanced velocity profiles due to core collapse (note that there are 9 deeply core-collapsed MW subhalos in our sample). Since our SIDM simulation does not include a Galactic potential, we cannot make a concrete comparison with the data. Nevertheless, our SIDM model produces both core-forming and core-collapsed subhalos, resulting in a more diverse DM distribution than that predicted in CDM, hence reproducing certain features of the data that are difficult to explain otherwise.
We further comment on the SIDM solution to the TBTF problem. Previous DM-only simulations of MW-like systems showed that the TBTF problem could be resolved due to SIDM core formation (Vogelsberger et al., 2012; Zavala et al., 2013). However, detailed kinematic analyses of the classical MW satellites found that their inner densities are so diverse that the self-interacting cross section inferred from individual dwarfs can vary by order of magnitude for core-forming subhalos (Read et al., 2018; Valli & Yu, 2018; Hayashi et al., 2020). More recently, SIDM simulations with an MW disk potential showed that the TBTF problem can actually be oversolved due to core formation and additional tidal stripping from the disk, if all subhalos are in the core-forming phase (Silverman et al., 2023). Our SIDM simulation predicts that some core-collapsed subhalos can have inner densities comparable to or higher than their CDM counterparts (see also Turner et al. 2021; Correa et al. 2022), a necessary condition for the model to pass the test in the presence of an MW disk potential.
Interestingly, the impact of the baryonic mechanisms discussed above may differ for SIDM subhalos in comparison to CDM. For example, SIDM subhalos that already have prominent cores before a pericentric passage may be disrupted more easily by the MW disk than their cuspy CDM counterparts, while SIDM subhalos approaching core collapse may be accelerated in this process due to tides. Dedicated simulations will be needed to test whether such core-collapsed subhalos can withstand tidal disruption by the MW. At the same time, SIDM halo profiles may be more robust due to internal baryonic feedback processes than those in CDM due to thermalization (Kaplinghat et al., 2014; Ren et al., 2019), implying that halo responses may further distinguish the models (e.g., Robles et al. 2017; Robertson et al. 2018).
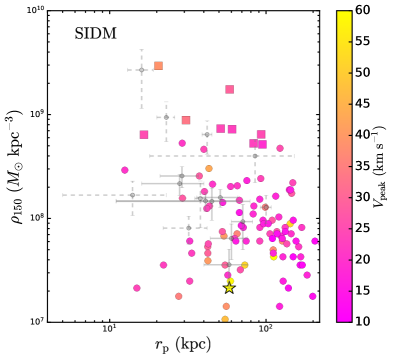
4.3 MW Subhalo Central Densities and Pericentric Distances
In addition to internal halo properties, the correlation between MW satellites’ orbital kinematics and their inferred density profiles may further help distinguish between CDM and SIDM scenarios (e.g., Nadler et al. 2020a). Indeed, Kaplinghat et al. (2019) reported an anticorrelation between DM density at pc () and pericentric distance () for classical MW satellite galaxies. This anticorrelation is unexpected if tidal stripping is the dominant mechanism that reduces subhalos’ central densities during pericentric passages. On the other hand, “survivor bias”—i.e., the fact that high-density subhalos are less prone to tidal disruption in the host’s inner regions—may counteract this effect and bring the central density–pericenter relation into agreement with that inferred observationally, even in a CDM context (Kaplinghat et al., 2019; Hayashi et al., 2020), although a reassessment is needed when the tidal effects of the stellar disk are included (Robles et al., 2019). A similar mechanism is known to bias the radially dependent mass–concentration relation for subhalos (e.g., Moliné et al. 2017, 2023). Observational selection effects can also potentially influence this relation because fainter satellites, which are expected to occupy lower-mass and thus (initially) more concentrated subhalos, are easier to detect near the pericenter. We therefore focus on the correlation between these properties, which responds nontrivially to SIDM physics.
In the bottom panels of Figure 11, we show the distribution predicted in our CDM (left) and SIDM (right) simulations, compared to data points for the classical (solid gray) and ultra-faint (dashed gray) dwarfs from Kaplinghat et al. (2019). The data points differ in the two panels because of the assumptions used to extrapolate measurements from large radii to pc. In particular, an NFW profile is used in the CDM case, while a cored-isothermal profile is used in the SIDM case. An anticorrelation between and is observed in both cases; however, it is only statistically significant for the SIDM density profile extrapolation according to a Spearman correlation test. Interestingly, both our CDM and SIDM simulations yield statistically significant anticorrelations, with Spearman coefficients of and , respectively. It is important to note that, for CDM, this anticorrelation is mainly driven by low- subhalos. In fact, the trend vanishes in our CDM simulation if we only consider the subhalos with the largest values of (consistent with the results of Kaplinghat et al. 2019), but it remains for SIDM. Since the most massive subhalos are expected to host the brightest satellite galaxies, our result suggests that the observed anticorrelation for the brightest MW satellites cannot be reproduced in our CDM simulation. We also caution that comparing these predictions to data requires more realistic simulations (e.g., including a Galactic disk) and detailed forward-modeling (e.g., accounting for observational selection effects); we leave this analysis to future work.
There are some additional subtleties regarding the differences between the central density–pericenter relations in CDM and SIDM. First, SIDM subhalos show a much larger scatter in their inner densities. Core-forming subhalos, which tend to have large , are shifted lower compared to their CDM counterparts, while core-collapsed subhalos are shifted higher and are marked by squares. In CDM, the halos of higher have systematically higher inner densities measured at a fixed radius, as expected. This trend is reversed in our SIDM model, where higher- subhalos tend to have lower inner densities due to core formation, and vice versa for lower- subhalos due to core collapse. We contrast this with the results in Ebisu et al. (2022), which suggest that velocity-independent self-interactions of and tend to erase the anticorrelation between central density and pericentric distance, because in such SIDM models all subhalos are in the core-expansion phase, and their central densities are reduced relative to CDM (e.g., see Robles et al. 2019; Silverman et al. 2023).
We expect that the inclusion of a central disk (or disk potential) will affect this relation by reducing the densities of subhalos with small pericenters due to enhanced tidal stripping. Robles et al. (2019) showed that the inner density of CDM and core-forming SIDM subhalos becomes relatively lower for a smaller pericenter due to the presence of a disk, and one would expect a positive correlation between and , instead of an anticorrelation as indicated by the observational data. On the other hand, if core-collapsed subhalos are more resilient to the tidal stripping associated with the Galactic disk than their CDM (or core-forming) counterparts, our strong velocity-dependent SIDM model could produce an even stronger anticorrelation between and in the presence of a disk compared to our current DM-only simulation. We will explore this intriguing possibility in future work.
4.4 Isolated Halo Rotation Curves
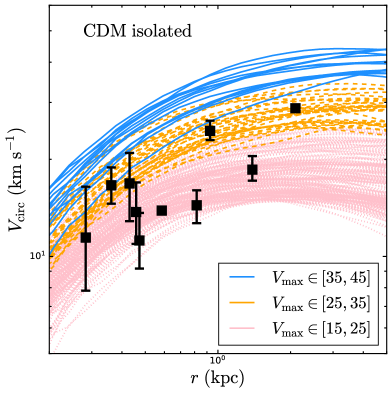
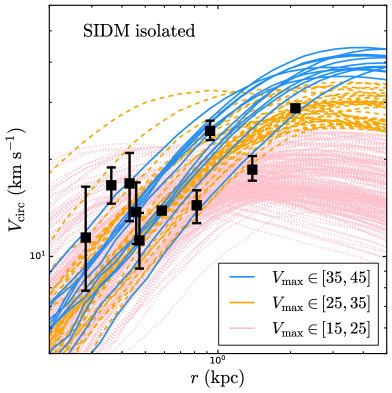
Figure 12 shows rotation curves for isolated halos with (light-blue curves) with distances between and kpc from the MW host halo center, roughly chosen to resemble the sample of 10 observed field dwarf galaxies in the Local Group as compiled in (Elbert et al., 2015, black error bars). According to standard abundance matching relations, the host halos of these galaxies have (Garrison-Kimmel et al., 2014). In the CDM panel, we find a discrepancy similar to the TBTF problem for satellites, here for field galaxies. This discrepancy has been studied previously (e.g., Garrison-Kimmel et al. 2014). Interestingly, DM self-interactions alleviate this issue without the need to invoke strong baryonic feedback because the isolated halos with are predicted to reside in the core-forming phase (Figure 7). Our results are broadly consistent with those in Elbert et al. (2015), where they simulated isolated SIDM dwarf halos with constant cross sections in the range and found that the TBTF problem in the local field can be alleviated for .
From Figure 12, we also see that, for lower masses (orange), and (pink), many of our simulated halos are in the core-collapse phase, resulting in high inner circular velocities; the population of core-collapsed halos increases as decreases. For CDM halos, the inner circular velocity at a given radius decreases with , but the trend can be reversed in SIDM because core collapse occurs predominantly for low-mass halos in our SIDM model. This behavior is similar to our findings for SIDM subhalos, as discussed in the previous subsection. Thus, our SIDM model predicts the existence of dense core-collapsed isolated halos in the Local Group that could host unexpectedly dense galaxies. The correlation between the gravothermal behavior of subhalos and isolated halos is inevitable for models that lead to sufficiently rapid core collapse.
As shown in Papastergis et al. (2015), there is also a TBTF problem in the field beyond the Local Volume, which could also be difficult to solve in CDM with baryonic feedback (Papastergis & Shankar, 2016). On the other hand, Schneider et al. (2017) demonstrated that velocity-dependent SIDM models (e.g., , at ) may alleviate or solve the problem. It would be interesting to reassess the SIDM solution in light of our simulations, where both core-forming and core-collapsed halos are populated. We expect that a careful forward-modeling procedure (e.g., based on the subhalo and functions) is necessary for a detailed comparison aimed at constraining these galaxies’ halo properties.
4.5 Diversity of Isolated and Splashback Halos
To further study the effects of SIDM on isolated halos, we follow Santos-Santos et al. (2020) by computing halo circular velocities evaluated at a fiducial radius,
| (5) |
where . This quantity captures the amplitude of the rotation curve halos’ inner regions; thus, the relation probes both the shape and magnitude of rotation curves; see also Oman et al. (2015) for a similar approach based on a relation.
In the top panels of Figure 13, we show the – distribution from our CDM (left) and SIDM (right) simulations, color-coded by the effective halo concentration. For halos that have smaller than the our spatial resolution limit, we shade them in gray. For comparison, we include the data points of observed galaxies compiled in Santos-Santos et al. (2020). Since our simulated halos mainly populate the low- region of this parameter space, we focus on comparing to observed galaxies with inferred values of . Our CDM simulation results are consistent with those in Santos-Santos et al. (2020), and exhibit much smaller scatter, compared to the observed data, a manifestation of the so-called “diversity problem” of galactic rotation curves (Kuzio de Naray et al., 2010; Oman et al., 2015; Ren et al., 2019; Santos-Santos et al., 2020). In particular, the median – is close to the 1:1 line in CDM, meaning that there are more rapidly rising rotation curves in the simulation compared to the sample of dwarf galaxies shown in Figure 13. For dwarf galaxies with , the effects of baryonic feedback in changing the inner density profiles begin to diminish (e.g., Bullock & Boylan-Kolchin 2017).
On the other hand, the isolated halos in our SIDM simulation exhibit a much larger scatter in the plane, compared to CDM, in better agreement with the data points.444Note that secondary halo properties are also nontrivially correlated with the resulting UDG properties in CDM (e.g., Benavides et al. 2021, 2022). In particular, core-forming halos have shallower rotational curves in their inner halo region and reside toward the lower right of the median relation, while core-collapsed halos have faster-rising rotational curves and shift upward from the median. Some of the SIDM halos are deeply in the collapse phase, and they are placed on the 1:1 line. If rotation curves are measured at smaller radii, e.g., , this separation between core-forming and core-collapsed halos is even more clear, as shown in the bottom panels of Figure 13 for our CDM (left) and SIDM (right) simulations.
Overall, we therefore find that our strong, velocity-dependent SIDM model produces both core-forming and core-collapsed isolated halos and significantly increases the diversity of halos’ inner densities. Hence, this potentially provides a better match to the observed diversity of field dwarf galaxy rotation curves. Previous studies on the SIDM solution to the galactic diversity problem mainly focused on the core-formation regime (e.g. Creasey et al. 2017; Kamada et al. 2017; Ren et al. 2019; Santos-Santos et al. 2020; Zentner et al. 2022), and showed that, compared to CDM, SIDM can produce a larger spread in the inner circular velocity profile after accounting for scatter in halo concentration and the impact of baryons on SIDM halo profiles (Kaplinghat et al., 2014). We show that the spread can be further amplified in our SIDM model due to core collapse. Thus, we expect outlier galaxies with while being low baryon concentration as highlighted in Santos-Santos et al. (2020) can be easily accommodated in our SIDM model.
As in previous sections, we note that our comparisons are not carried out in a full, forward-modeling framework capable of including all relevant observational and theoretical systematics. For example, rotation curve measurements are known to be biased toward recovering artificially flat velocity profiles and cored density profiles, purely due to projection effects, noncircular motions, and dynamical equilibrium assumptions (e.g., Read & Steger 2017; Oman et al. 2019; Genina et al. 2020; Chang & Necib 2021; Roper et al. 2023). In addition, the diverse rotation curves are also correlated with the stellar surface densities of spiral galaxies, and hence understanding the origin of baryon distributions is needed to fully address the problem. Here, we have highlighted the trends imprinted by SIDM on the field halo population, which can form the basis of future comparison studies.
5 Discussion
We now discuss our main results in the context of previous SIDM studies, focusing on the diversity of SIDM halo populations in Section 5.1, comparisons to previous simulations in Section 5.2, and areas for future work in Section 5.3.
5.1 The Diversity of Isolated Halos and Subhalos in SIDM
One of the most distinctive features of SIDM is its ability to diversify the properties of DM halos at roughly fixed mass, depending on their secondary properties (e.g., Kaplinghat et al. 2019; Kahlhoefer et al. 2019; Ren et al. 2019; Sameie et al. 2020). Although the extent to which larger diversity than predicted by CDM is necessary, particularly in the presence of baryons (e.g., Kaplinghat et al. 2020; Santos-Santos et al. 2020; Zentner et al. 2022), upcoming observational facilities will considerably improve measurements of individual galaxies’ dynamics, sharpening this test (Chakrabarti et al., 2022). Thus, it is crucial to achieve self-consistent predictions for the full diversity of SIDM halo populations.
In this context, our results are the first to self-consistently explore the connection between the diversity of SIDM isolated halo and subhalo populations in a realistic cosmic environment. Specifically, the high-resolution region of our zoom-in simulation extends to distances of from the MW center, between the size of the Local Group and Local Volume. Although our simulation is not constrained to match the overdensity of the MW’s actual local environment (which may itself be rare; e.g., see Neuzil et al. 2020), we expect it to accurately capture the correlated nature of isolated halo and subhalo populations in our SIDM model. Moreover, our results bridge commonly studied subhalo and isolated halo populations by explicitly including halos in the splashback regime and a realistic LMC analog system.
Consistent with previous studies, we find that a sizable population of MW subhalos likely undergoes core collapse in the presence of strong, velocity-dependent DM self-interactions (e.g., Turner et al. 2021). Furthermore, many isolated and splashback halos show similar core-collapse signatures, albeit at a smaller rate than that for subhalos, likely due to tidal acceleration of gravothermal evolution (consistent with the findings of, e.g., Nishikawa et al. 2020; Sameie et al. 2020; Zeng et al. 2022). We recover a well-known correlation between halo concentration and the efficiency of core collapse at fixed halo mass (e.g., Essig et al. 2019; Kaplinghat et al. 2019), and we quantify how gravothermal evolution can be captured using the halo properties and . An analytic gravothermal model is able to predict shifts in the – plane relative to CDM fairly well, hinting that the detailed effects of SIDM captured by cosmological simulations can likely be captured by appropriate (semi) analytic modeling as a function of the SIDM cross section (e.g., see Jiang et al. 2023 for an example along these lines). We intend to explore this avenue in future work.
A particularly intriguing correlation revealed by our simulations can be phrased as follows. If the densest ultra-faint MW satellite galaxies with small pericenters are explained via core collapse of SIDM subhalos and the low densities of the brightest MW satellites are explained by core formation (see Figure 11), then two corresponding populations of field dwarf galaxies exist: (1) a bright field dwarf population that occupies cored DM halos (e.g., corresponding to the rotation curves with high at small radii in the bottom right panel of Figure 11), and (2) a rarer population of faint and ultra-faint field dwarf galaxies that occupy core-collapsed halos. These correlated predictions are sensitive to the SIDM cross section, implying that a joint fit to these observables would provide a stringent test of SIDM physics.
This latter population has not been remarked on in previous studies, which largely used idealized, noncosmological simulations to model gravothermal evolution and find long core-collapse timescales of isolated halos. Meanwhile, because our simulation self-consistently resolves structure formation in a cosmic environment, gravothermal evolution is often significantly accelerated for the halos that end up as isolated objects at due to major mergers or orbital evolution around the MW (or other nearby hosts) throughout their histories; thus, we predict that a population of MW splashback galaxies also occupy core-collapsed halos. Observationally, these dense, isolated dwarf galaxies predicted in our SIDM model are potentially reminiscent of the Tucana dwarf galaxy, which may have an unusually high inner density as a splashback galaxy of Andromeda (Gregory et al. 2019; Santos-Santos et al. 2023; however, see Taibi et al. 2020).
Finally, we remark on the LMC analog in our SIDM simulations and the potential observational implications of its subhalo population. Although only one LMC-associated subhalo in our SIDM simulation shows signs of core collapse, there are not a large number of LMC-associated subhalos above our conservative halo mass limit. Thus, the implied core-collapse rate of for LMC-associated subhalos is consistent with that for our isolated halo population. A lack of accelerated core collapse is perhaps expected, because our LMC analog system falls into the MW at very late times and thus does not experience significant and prolonged tidal stripping, unlike most MW subhalos. Furthermore, it appears that tidal evolution of LMC-associated subhalos above our mass threshold, as they orbit the LMC before the LMC falls into the MW, does not play a major role in accelerating their gravothermal evolution.555On the other hand, Nadler et al. (2021a) found that evaporation due to subhalo–host halo interactions in velocity-independent SIDM models may be enhanced for LMC-associated subhalos, highlighting the sensitivity of halo evolution to SIDM physics. Conversely, there may be a population of extremely low-mass halos below our resolution limit that were stripped by the LMC at early times and fall into the MW near .
Our results therefore highlight that the impact of SIDM on particular halo populations is dependent on both environmental factors and the SIDM cross section. Observationally, as the number of known MW satellite galaxies—including LMC-associated satellites—continues to increase (e.g., Kallivayalil et al. 2018; Drlica-Wagner et al. 2020; Patel et al. 2020), the discovery of a population of very dense ultra-faint dwarf satellite galaxies would be an interesting hint of SIDM-induced core collapse that is difficult to recreate via baryonic effects or other nonstandard DM physics.
5.2 Comparison to Previous Simulations
Several authors have simulated SIDM models similar to that considered in this paper. Here, we compare our results to these studies, focusing on comparisons between cosmological simulations. A detailed comparison between the gravothermal evolution of halos in idealized, noncosmological simulations (e.g., Yang & Yu 2022) versus those found in realistic cosmic environments is an interesting area for future work that will benefit the development of semianalytic models (e.g., Jiang et al. 2023; Outmezguine et al. 2022; Yang et al. 2023).
The most direct comparison we can draw is with the cosmological zoom-in simulations presented in Zavala et al. (2019); Turner et al. (2021). In particular, the “vd100” cross section model presented in Zavala et al. (2019) and studied in detail by Turner et al. (2021), Meshveliani et al. (2022) is nearly identical to our SIDM model, and their zoom-in simulation setup is similar to ours, focusing on an MW-mass host halo at similar resolution. The resulting MW subhalo population studied in Turner et al. (2021) is also broadly similar to ours; for example, the subhalo mass function is not significantly altered relative to a corresponding CDM simulation. Interestingly, SIDM subhalos that show signs of core collapse according to the criteria in Turner et al. (2021) outnumber uncollapsed subhalos by a factor of , which implies a much larger core-collapse rate than our fiducial result of , at face value. This is likely due to our very conservative criteria for identifying core-collapsed halos, which effectively requires them to be outliers compared to the CDM – relation. The true rate of core-collapsed subhalos in our simulation may therefore be significantly higher, in agreement with the results of Turner et al. (2021).
We also note that Lovell & Zavala (2023) applied an analytic model based on SIDM scaling relations derived from the Turner et al. (2021) vd100 simulation to the COCO-CDM simulation (Hellwing et al., 2016) to predict SIDM subhalo population statistics. This technique is, by construction, less accurate than a full SIDM simulation that captures the correlated, environmentally dependent effects of self-interactions on halo and subhalo populations; on the other hand, it is significantly faster because it avoids running a new simulation for each SIDM system of interest. Quantitatively, the results of Lovell & Zavala (2023) corroborate our finding that core collapse is necessary to explain the full diversity of inferred MW satellite inner densities in an SIDM scenario (also see, e.g., Kim & Peter 2021).
Importantly, our MW host halo stands out from those used in many previous SIDM simulations, including those described above (Zavala et al., 2019; Turner et al., 2021; Lovell & Zavala, 2023), because (1) its early merger history resembles that of the MW, and (2) it hosts a massive LMC analog on recent infall (Nadler et al., 2020b). This host has been used to fit the MW satellite galaxy population in CDM and alternative models (Nadler et al., 2020b, 2021b; Mau et al., 2022), and it has been resimulated in velocity-independent SIDM models (Nadler et al., 2021a). These properties add to the realism of our MW subhalo population predictions, and allow us to study the LMC-associated subhalo population in a scenario that includes gravothermal core collapse for the first time.
We also highlight an important difference between our analysis and that of many previous SIDM simulation studies, including Zavala et al. (2019); Turner et al. (2021). In particular, we leveraged the entire high-resolution volume of our zoom-in region to self-consistently study the effects of SIDM on isolated halos, splashback halos, and MW and LMC-associated subhalos. This is crucial because, as we have shown, the gravothermal evolution and other properties of isolated halos and subhalos are intrinsically linked in an SIDM model like ours. This allows us to make novel predictions concerning the population of field dwarf galaxies hosted by core-forming and core-collapsed halos, including in the ultra-faint regime, and assuming that the densest observed MW satellite galaxies are interpreted as core-collapsed systems. Imminent observational advances, e.g. delivered by the Rubin Observatory Legacy Survey of Space and Time (Ivezić et al., 2019), will increase the census of faint dwarf galaxies known in the local universe (e.g., Mutlu-Pakdil et al. 2021). Combined with spectroscopic follow-up (including from next-generation observational facilities; Chakrabarti et al. 2022), these measurements will significantly sharpen the power of dwarf galaxy internal dynamics as a probe of SIDM physics.
Finally, note that Correa et al. (2022) also studied the vd100 SIDM model in a large-volume cosmological simulation. These authors studied both isolated halos and subhalos in a volume, which includes several massive halos and thus, in principle, provides excellent statistical power for unified studies of isolated halos’ and subhalos’ gravothermal evolution. However, compared to zoom-in simulations, there is necessarily a tradeoff in resolution when simulating such a large volume; for example, the mass resolution and softening used by Correa et al. (2022) were and , which are factors of and larger than in our simulation, respectively. Our study is thus highly complementary to that of Correa et al. (2022); in particular, these authors did not study the effects of SIDM on very-low-mass halos with masses of , where we the effects of our SIDM model are most pronounced. Investing in simulations that combine the statistical power of large-volume simulations with the resolution of zoom-ins is therefore important for future SIDM studies.
5.3 Future Work
As discussed above, our study has several unique advantages relative to recent SIDM work. However, as we have emphasized throughout, several aspects of the simulations and analysis presented in this paper are simplified. We now summarize the most important areas for improvement, and avenues for future work aimed at more realistic modeling of halo and galaxy population in SIDM.
First, we have presented DM-only simulations. Galaxy formation and baryonic feedback is known to affect halo properties in a manner that can be degenerate with SIDM physics (e.g., Pontzen & Governato 2012; Brook & Di Cintio 2015; Burger et al. 2022). However, simulations using the FIRE-2 galaxy formation model show that SIDM density cores are much more robust to the inclusion of baryonic physics compared to CDM on dwarf galaxies (Robles et al., 2017); we therefore do not expect core formation of low-mass halos in our SIDM simulation to be strongly affected by baryonic feedback (e.g., see Ren et al. 2019). In future work, it will be particularly interesting to perform hydrodynamic simulations in the presence of core collapse. We expect that the cuspy density profiles of collapsed halos remain resilient to feedback as self-interactions can redistribute energy rapidly (e.g., see Sameie et al. 2021; Rose et al. 2023 for studies of MW-mass SIDM halos). This may provide a mechanism to form compact dwarf galaxies in SIDM even when feedback is strong.
Second, and related to the previous point concerning baryonic physics, our MW host halo is expected to host a massive central galaxy in reality. The central baryonic component, and particularly the Galactic disk, is known to have a major impact on the evolution of subhalos that pass sufficiently close to the host halo center, potentially reducing the abundance of surviving subhalos relative to a corresponding CDM-only simulation by (e.g., Garrison-Kimmel et al. 2017; Nadler et al. 2018; Kelley et al. 2019; Richings et al. 2020; Samuel et al. 2020; however, also see Webb & Bovy 2020; Green et al. 2022). The interplay between the effect of the disk and SIDM has only received limited attention, e.g. in Robles et al. (2019), and is likely nontrivial. For example, SIDM responds to the gravitational potential of the MW galaxy efficiently (e.g., Kaplinghat et al. 2014), implying that the central core of our MW host halo likely remains a cusp in the presence of a disk, while many MW subhalos are cored in our SIDM scenario, increasing the efficiency of tidal disruption as they orbit the central potential (e.g., Errani et al. 2023).
On the other hand, the low-mass core-collapsed subhalos produced by our strongly velocity-dependent SIDM model are likely more resilient to tidal disruption than their CDM counterparts, particularly in the presence of a central galaxy. Taken together, these effects can potentially enhance the diversity of MW subhalos in our SIDM model even further. In the presence of the Galactic disk, a particularly intriguing possibility is that the combination of enhanced tidal disruption relative to CDM for massive, core-forming subhalos and increased resilience for low-mass, core-collapsed subhalos amplifies the anticorrelation between subhalos’ central densities and pericentric distances studied in the bottom panels of Figure 11. We therefore plan to pursue SIDM simulations with embedded, analytic disk potentials to model the tidal effects of the MW galaxy in future work.
Third, we have not attempted to forward-model the galaxies compared to those in Section 4, including the MW satellite population or the populations of local field dwarf galaxies presented there. A forward-modeling study would affect the comparisons we have presented in several ways. For example, a careful abundance matching procedure that accounts for uncertainties in the global and satellite luminosity functions, as well as the (uncertain) intrinsic scatter in the faint-end stellar mass–halo mass relation, is necessary to robustly associated halos and subhalos in our simulations with observed galaxies, in a statistical fashion (e.g., see Nadler et al. 2019, 2020b for examples in the context of MW satellite galaxies). Furthermore, for many of the halo and subhalo properties we have studied, observational selection effects and systematics play an important role when inferring observed systems’ halo properties. For example the difficulty of accurately inferring field galaxy rotation curves was discussed in Section 4.5; meanwhile, MW satellite galaxies are subject to significant selection effects as a function of their distance, size, and luminosity (e.g., Drlica-Wagner et al. 2020), and all of these properties are correlated with the expected distribution of underlying halo properties, in a given DM model. Thus, follow-up studies that forward-model properties of observable galaxies predicted to inhabit halos and subhalos in our simulations are worth pursuing.
6 Conclusions
We explored the impact of strong, velocity-dependent DM self-interaction cross section (Figure 1) on halo populations within and surrounding the MW. In particular, we compared high-resolution CDM and SIDM cosmological zoom-in simulations focused on a host halo with a mass, merger history, and LMC analog that resembles the MW. Crucially, we analyze high-resolution halos out to from the MW center, allowing us to self-consistently analyze the gravothermal evolution of SIDM halos in different environments, including MW and LMC-associated subhalos, splashback halos of the MW, and isolated halos. Our main findings are summarized below:
-
•
The stage of SIDM halos’ gravothermal evolution is correlated with their concentration, formation history, and environment, and imprints as a shift toward larger and smaller for halos in the core-collapse phase (Figure 7).
-
•
Environmental effects lead to subtle differences among the gravothermal evolution of subhalos and isolated halos; at a fixed mass, the fraction of core-collapsed subhalos is times higher for subhalos, likely due to tidal evolution (Figure 8).
-
•
Mass functions for subhalos and isolated halos in our CDM and SIDM simulations are nearly identical (Figure 10). Thus, the evaporation due to subhalo–host halo interactions, which can reduce the amplitude of the subhalo mass function for SIDM models with large cross sections at the MW host halo’s infall velocity scale, is less important in our model because of its strong velocity-dependence and possibly because some subhalos are more resilient to tidal disruption due to core collapse.
-
•
Our SIDM model yields diverse inner DM distributions for both subhalos isolated halos (top right panel, Figure 11; also see Figure 12). If dense, ultra-faint MW satellite galaxies are hosted by core-collapsed subhalos, then we predict an undiscovered population of dense, isolated faint dwarf galaxies in the field, which are compelling observational targets.
-
•
Strong self-interactions produce a significant anticorrelation between MW subhalos’ inner densities and pericentric distance (bottom right panel, Figure 11). This may help explain the observed trend for MW satellites; this comparison is limited by uncertainties in these galaxies’ inferred DM profiles, which will be reduced by upcoming observational facilities.
We conclude with a few speculative remarks hinted by our results. First, the matched evolution of SIDM halos and subhalos that show signs of core collapse (Figure 5 and Appendix D) suggests that halos’ detailed merger histories are correlated with their gravothermal evolution. In particular, even the isolated core-collapsed halos we identify undergo early tidal evolution and/or major mergers, which seem to facilitate a rapid approach toward core collapse relative to the core-forming isolated halos of similar masses. It is not clear whether this relationship is causal, in the sense that merger dynamics or tidal evolution accelerate core collapse, or due to more rapid evolution of higher-concentration remnants of early mergers. In either case, comparing the gravothermal evolution we measured in a realistic cosmic environment to idealized simulations and predictions from (semi) analytic gravothermal predictions and isothermal Jeans models is an important area for future study. If core collapse strongly correlates with certain features of halos’ merger histories, this would have interesting implications for how SIDM physics may manifest in observable galaxy population statistics.
Second, our analysis in Section 3.3 and Figure 9 indicates that core-collapse timescales estimated using an analytic effective cross section model predict the impact of SIDM on simulated halos’ and surprisingly well. This is compelling because it suggests that SIDM effects resulting from detailed, cosmological simulations can be predicted analytically—to a reasonable degree of accuracy—as a function of the effective cross section. Thus, we can use our formalism to predict SIDM signatures for cross section models that have not yet been simulated in order to analytically transform the results of any CDM simulation into a corresponding SIDM run. It will be interesting to test how well such analytic transformations recover the gravothermal evolution predicted by simulations in as-yet untested regions of SIDM parameter space.
References
- Adhikari et al. (2014) Adhikari, S., Dalal, N., & Chamberlain, R. T. 2014, J. Cosmology Astropart. Phys, 2014, 019
- Adhikari et al. (2022) Adhikari, S., Banerjee, A., Boddy, K. K., et al. 2022, arXiv e-prints, arXiv:2207.10638
- Agrawal et al. (2017) Agrawal, P., Cyr-Racine, F.-Y., Randall, L., & Scholtz, J. 2017, J. Cosmology Astropart. Phys, 2017, 022
- Andrade et al. (2022) Andrade, K. E., Fuson, J., Gad-Nasr, S., et al. 2022, MNRAS, 510, 54
- Balberg et al. (2002) Balberg, S., Shapiro, S. L., & Inagaki, S. 2002, ApJ, 568, 475
- Banerjee et al. (2020) Banerjee, A., Adhikari, S., Dalal, N., More, S., & Kravtsov, A. 2020, J. Cosmology Astropart. Phys, 2020, 024
- Behroozi et al. (2013a) Behroozi, P. S., Wechsler, R. H., & Wu, H.-Y. 2013a, ApJ, 762, 109
- Behroozi et al. (2013b) Behroozi, P. S., Wechsler, R. H., Wu, H.-Y., et al. 2013b, ApJ, 763, 18
- Benavides et al. (2022) Benavides, J. A., Sales, L. V., Abadi, M. G., et al. 2022, arXiv e-prints, arXiv:2209.07539
- Benavides et al. (2021) Benavides, J. A., Sales, L. V., Abadi, M. G., et al. 2021, Nature Astronomy, 5, 1255
- Borukhovetskaya et al. (2022) Borukhovetskaya, A., Navarro, J. F., Errani, R., & Fattahi, A. 2022, MNRAS, 512, 5247
- Boylan-Kolchin et al. (2011) Boylan-Kolchin, M., Bullock, J. S., & Kaplinghat, M. 2011, MNRAS, 415, L40
- Boylan-Kolchin et al. (2012) Boylan-Kolchin, M., Bullock, J. S., & Kaplinghat, M. 2012, MNRAS, 422, 1203
- Brook & Di Cintio (2015) Brook, C. B. & Di Cintio, A. 2015, MNRAS, 450, 3920
- Bryan & Norman (1998) Bryan, G. L. & Norman, M. L. 1998, ApJ, 495, 80
- Buckley & Fox (2010) Buckley, M. R. & Fox, P. J. 2010, Phys. Rev. D, 81, 083522
- Bullock & Boylan-Kolchin (2017) Bullock, J. S. & Boylan-Kolchin, M. 2017, ARA&A, 55, 343
- Burger et al. (2022) Burger, J. D., Zavala, J., Sales, L. V., et al. 2022, MNRAS, 513, 3458
- Caldwell et al. (2017) Caldwell, N., Walker, M. G., Mateo, M., et al. 2017, ApJ, 839, 20
- Callingham et al. (2019) Callingham, T. M., Cautun, M., Deason, A. J., et al. 2019, MNRAS, 484, 5453
- Cautun et al. (2020) Cautun, M., Benítez-Llambay, A., Deason, A. J., et al. 2020, MNRAS, 494, 4291
- Chakrabarti et al. (2022) Chakrabarti, S., Drlica-Wagner, A., Li, T. S., et al. 2022, arXiv e-prints, arXiv:2203.06200
- Chang & Necib (2021) Chang, L. J. & Necib, L. 2021, MNRAS, 507, 4715
- Correa (2021) Correa, C. A. 2021, MNRAS, 503, 920
- Correa et al. (2022) Correa, C. A., Schaller, M., Ploeckinger, S., et al. 2022, MNRAS, 517, 3045
- Creasey et al. (2017) Creasey, P., Sameie, O., Sales, L. V., et al. 2017, MNRAS, 468, 2283
- Davé et al. (2001) Davé, R., Spergel, D. N., Steinhardt, P. J., & Wandelt, B. D. 2001, ApJ, 547, 574
- Diemer & Kravtsov (2014) Diemer, B. & Kravtsov, A. V. 2014, ApJ, 789, 1
- Dooley et al. (2016) Dooley, G. A., Peter, A. H. G., Vogelsberger, M., Zavala, J., & Frebel, A. 2016, MNRAS, 461, 710
- Drlica-Wagner et al. (2020) Drlica-Wagner, A., Bechtol, K., Mau, S., et al. 2020, ApJ, 893, 47
- Dutton et al. (2020) Dutton, A. A., Buck, T., Macciò, A. V., et al. 2020, MNRAS, 499, 2648
- Dutton & Macciò (2014) Dutton, A. A. & Macciò, A. V. 2014, MNRAS, 441, 3359
- Ebisu et al. (2022) Ebisu, T., Ishiyama, T., & Hayashi, K. 2022, Phys. Rev. D, 105, 023016
- Elbert et al. (2015) Elbert, O. D., Bullock, J. S., Garrison-Kimmel, S., et al. 2015, MNRAS, 453, 29
- Erkal et al. (2019) Erkal, D., Belokurov, V., Laporte, C. F. P., et al. 2019, MNRAS, 487, 2685
- Errani & Navarro (2021) Errani, R. & Navarro, J. F. 2021, MNRAS, 505, 18
- Errani et al. (2023) Errani, R., Navarro, J. F., Peñarrubia, J., Famaey, B., & Ibata, R. 2023, MNRAS, 519, 384
- Essig et al. (2019) Essig, R., McDermott, S. D., Yu, H.-B., & Zhong, Y.-M. 2019, Phys. Rev. Lett., 123, 121102
- Feng et al. (2009) Feng, J. L., Kaplinghat, M., Tu, H., & Yu, H.-B. 2009, J. Cosmology Astropart. Phys, 2009, 004
- Feng et al. (2010) Feng, J. L., Kaplinghat, M., & Yu, H.-B. 2010, Phys. Rev. Lett., 104, 151301
- Feng et al. (2021) Feng, W.-X., Yu, H.-B., & Zhong, Y.-M. 2021, ApJ, 914, L26
- Feng et al. (2022) Feng, W.-X., Yu, H.-B., & Zhong, Y.-M. 2022, J. Cosmology Astropart. Phys, 2022, 036
- Garrison-Kimmel et al. (2014) Garrison-Kimmel, S., Boylan-Kolchin, M., Bullock, J. S., & Kirby, E. N. 2014, MNRAS, 444, 222
- Garrison-Kimmel et al. (2013) Garrison-Kimmel, S., Rocha, M., Boylan-Kolchin, M., Bullock, J. S., & Lally, J. 2013, MNRAS, 433, 3539
- Garrison-Kimmel et al. (2017) Garrison-Kimmel, S., Wetzel, A., Bullock, J. S., et al. 2017, MNRAS, 471, 1709
- Garrison-Kimmel et al. (2019) Garrison-Kimmel, S., Hopkins, P. F., Wetzel, A., et al. 2019, MNRAS, 487, 1380
- Genina et al. (2020) Genina, A., Read, J. I., Frenk, C. S., et al. 2020, MNRAS, 498, 144
- Gilman et al. (2021) Gilman, D., Bovy, J., Treu, T., et al. 2021, MNRAS, 507, 2432
- Gilman et al. (2022) Gilman, D., Zhong, Y.-M., & Bovy, J. 2022, arXiv e-prints, arXiv:2207.13111
- Girmohanta & Shrock (2022) Girmohanta, S. & Shrock, R. 2022, Phys. Rev. D, 106, 063013
- Graus et al. (2019) Graus, A. S., Bullock, J. S., Kelley, T., et al. 2019, MNRAS, 488, 4585
- Green et al. (2022) Green, S. B., van den Bosch, F. C., & Jiang, F. 2022, MNRAS, 509, 2624
- Gregory et al. (2019) Gregory, A. L., Collins, M. L. M., Read, J. I., et al. 2019, MNRAS, 485, 2010
- Harvey et al. (2015) Harvey, D., Massey, R., Kitching, T., Taylor, A., & Tittley, E. 2015, Science, 347, 1462
- Hayashi et al. (2020) Hayashi, K., Chiba, M., & Ishiyama, T. 2020, ApJ, 904, 45
- Hellwing et al. (2016) Hellwing, W. A., Frenk, C. S., Cautun, M., et al. 2016, MNRAS, 457, 3492
- Helmi (2020) Helmi, A. 2020, ARA&A, 58, 205
- Hinshaw et al. (2013) Hinshaw, G., Larson, D., Komatsu, E., et al. 2013, ApJS, 208, 19
- Ibe & Yu (2010) Ibe, M. & Yu, H.-b. 2010, Phys. Lett. B, 692, 70
- Ivezić et al. (2019) Ivezić, Ž., Kahn, S. M., Tyson, J. A., et al. 2019, ApJ, 873, 111
- Jethwa et al. (2018) Jethwa, P., Erkal, D., & Belokurov, V. 2018, MNRAS, 473, 2060
- Jiang et al. (2019) Jiang, F., Dekel, A., Freundlich, J., et al. 2019, MNRAS, 487, 5272
- Jiang & van den Bosch (2015) Jiang, F. & van den Bosch, F. C. 2015, MNRAS, 453, 3575
- Jiang et al. (2023) Jiang, F., Benson, A., Hopkins, P. F., et al. 2023, MNRAS, arXiv:2206.12425 [astro-ph.CO]
- Kahlhoefer et al. (2019) Kahlhoefer, F., Kaplinghat, M., Slatyer, T. R., & Wu, C.-L. 2019, J. Cosmology Astropart. Phys, 2019, 010
- Kallivayalil et al. (2013) Kallivayalil, N., van der Marel, R. P., Besla, G., Anderson, J., & Alcock, C. 2013, ApJ, 764, 161
- Kallivayalil et al. (2018) Kallivayalil, N., Sales, L. V., Zivick, P., et al. 2018, ApJ, 867, 19
- Kamada et al. (2017) Kamada, A., Kaplinghat, M., Pace, A. B., & Yu, H.-B. 2017, Phys. Rev. Lett., 119, 111102
- Kaplinghat et al. (2014) Kaplinghat, M., Keeley, R. E., Linden, T., & Yu, H.-B. 2014, Phys. Rev. Lett., 113, 021302
- Kaplinghat et al. (2020) Kaplinghat, M., Ren, T., & Yu, H.-B. 2020, J. Cosmology Astropart. Phys, 2020, 027
- Kaplinghat et al. (2016) Kaplinghat, M., Tulin, S., & Yu, H.-B. 2016, Phys. Rev. Lett., 116, 041302
- Kaplinghat et al. (2019) Kaplinghat, M., Valli, M., & Yu, H.-B. 2019, MNRAS, 490, 231
- Kelley et al. (2019) Kelley, T., Bullock, J. S., Garrison-Kimmel, S., et al. 2019, MNRAS, 487, 4409
- Kim & Peter (2021) Kim, S. Y. & Peter, A. H. G. 2021, arXiv e-prints, arXiv:2106.09050
- Koda & Shapiro (2011) Koda, J. & Shapiro, P. R. 2011, MNRAS, 415, 1125
- Kong et al. (2022) Kong, D., Kaplinghat, M., Yu, H.-B., Fraternali, F., & Mancera Piña, P. E. 2022, ApJ, 936, 166
- Kuzio de Naray et al. (2010) Kuzio de Naray, R., Martinez, G. D., Bullock, J. S., & Kaplinghat, M. 2010, ApJ, 710, L161
- Li et al. (2022) Li, J., Greene, J. E., Greco, J. P., et al. 2022, arXiv e-prints, arXiv:2210.14994
- Loeb & Weiner (2011) Loeb, A. & Weiner, N. 2011, Phys. Rev. Lett., 106, 171302
- Loudas et al. (2022) Loudas, N., Pavlidou, V., Casadio, C., & Tassis, K. 2022, A&A, 668, A166
- Lovell & Zavala (2023) Lovell, M. R. & Zavala, J. 2023, MNRAS, 520, 1567
- Lynden-Bell & Wood (1968) Lynden-Bell, D. & Wood, R. 1968, MNRAS, 138, 495
- Mancera Piña et al. (2022) Mancera Piña, P. E., Fraternali, F., Oosterloo, T., et al. 2022, MNRAS, 512, 3230
- Mao et al. (2015) Mao, Y.-Y., Williamson, M., & Wechsler, R. H. 2015, ApJ, 810, 21
- Mau et al. (2022) Mau, S., Nadler, E. O., Wechsler, R. H., et al. 2022, ApJ, 932, 128
- McConnachie (2012) McConnachie, A. W. 2012, AJ, 144, 4
- Meshveliani et al. (2022) Meshveliani, T., Zavala, J., & Lovell, M. R. 2022, arXiv e-prints, arXiv:2210.01817
- Moliné et al. (2017) Moliné, Á., Sánchez-Conde, M. A., Palomares-Ruiz, S., & Prada, F. 2017, MNRAS, 466, 4974
- Moliné et al. (2023) Moliné, Á., Sánchez-Conde, M. A., Aguirre-Santaella, A., et al. 2023, MNRAS, 518, 157
- More et al. (2015) More, S., Diemer, B., & Kravtsov, A. V. 2015, ApJ, 810, 36
- Mutlu-Pakdil et al. (2021) Mutlu-Pakdil, B., Sand, D. J., Crnojević, D., et al. 2021, ApJ, 918, 88
- Nadler et al. (2020a) Nadler, E. O., Banerjee, A., Adhikari, S., Mao, Y.-Y., & Wechsler, R. H. 2020a, ApJ, 896, 112
- Nadler et al. (2021a) Nadler, E. O., Banerjee, A., Adhikari, S., Mao, Y.-Y., & Wechsler, R. H. 2021a, ApJ, 920, L11
- Nadler et al. (2019) Nadler, E. O., Mao, Y.-Y., Green, G. M., & Wechsler, R. H. 2019, ApJ, 873, 34
- Nadler et al. (2018) Nadler, E. O., Mao, Y.-Y., Wechsler, R. H., Garrison-Kimmel, S., & Wetzel, A. 2018, ApJ, 859, 129
- Nadler et al. (2020b) Nadler, E. O., Wechsler, R. H., Bechtol, K., et al. 2020b, ApJ, 893, 48
- Nadler et al. (2021b) Nadler, E. O., Drlica-Wagner, A., Bechtol, K., et al. 2021b, Phys. Rev. Lett., 126, 091101
- Nadler et al. (2023) Nadler, E. O., Mansfield, P., Wang, Y., et al. 2023, ApJ, 945, 159
- Neuzil et al. (2020) Neuzil, M. K., Mansfield, P., & Kravtsov, A. V. 2020, MNRAS, 494, 2600
- Nishikawa et al. (2020) Nishikawa, H., Boddy, K. K., & Kaplinghat, M. 2020, Phys. Rev. D, 101, 063009
- Oman et al. (2019) Oman, K. A., Marasco, A., Navarro, J. F., et al. 2019, MNRAS, 482, 821
- Oman et al. (2015) Oman, K. A., Navarro, J. F., Fattahi, A., et al. 2015, MNRAS, 452, 3650
- Outmezguine et al. (2022) Outmezguine, N. J., Boddy, K. K., Gad-Nasr, S., Kaplinghat, M., & Sagunski, L. 2022, arXiv e-prints, arXiv:2204.06568
- Pace et al. (2022) Pace, A. B., Erkal, D., & Li, T. S. 2022, ApJ, 940, 136
- Papastergis et al. (2015) Papastergis, E., Giovanelli, R., Haynes, M. P., & Shankar, F. 2015, A&A, 574, A113
- Papastergis & Shankar (2016) Papastergis, E. & Shankar, F. 2016, A&A, 591, A58
- Patel et al. (2020) Patel, E., Kallivayalil, N., Garavito-Camargo, N., et al. 2020, ApJ, 893, 121
- Peter et al. (2013) Peter, A. H. G., Rocha, M., Bullock, J. S., & Kaplinghat, M. 2013, MNRAS, 430, 105
- Pollack et al. (2015) Pollack, J., Spergel, D. N., & Steinhardt, P. J. 2015, ApJ, 804, 131
- Pontzen & Governato (2012) Pontzen, A. & Governato, F. 2012, MNRAS, 421, 3464
- Read & Steger (2017) Read, J. I. & Steger, P. 2017, MNRAS, 471, 4541
- Read et al. (2018) Read, J. I., Walker, M. G., & Steger, P. 2018, MNRAS, 481, 860
- Ren et al. (2019) Ren, T., Kwa, A., Kaplinghat, M., & Yu, H.-B. 2019, Physical Review X, 9, 031020
- Richings et al. (2020) Richings, J., Frenk, C., Jenkins, A., et al. 2020, MNRAS, 492, 5780
- Robertson et al. (2017) Robertson, A., Massey, R., & Eke, V. 2017, MNRAS, 465, 569
- Robertson et al. (2018) Robertson, A., Massey, R., Eke, V., et al. 2018, MNRAS, 476, L20
- Robles et al. (2019) Robles, V. H., Kelley, T., Bullock, J. S., & Kaplinghat, M. 2019, MNRAS, 490, 2117
- Robles et al. (2017) Robles, V. H., Bullock, J. S., Elbert, O. D., et al. 2017, MNRAS, 472, 2945
- Rocha et al. (2013) Rocha, M., Peter, A. H. G., Bullock, J. S., et al. 2013, MNRAS, 430, 81
- Roper et al. (2023) Roper, F. A., Oman, K. A., Frenk, C. S., et al. 2023, MNRAS, 521, 1316
- Rose et al. (2023) Rose, J. C., Torrey, P., Vogelsberger, M., & O’Neil, S. 2023, MNRAS, 519, 5623
- Sales et al. (2022) Sales, L. V., Wetzel, A., & Fattahi, A. 2022, Nature Astronomy, 6, 897
- Sameie et al. (2018) Sameie, O., Creasey, P., Yu, H.-B., et al. 2018, MNRAS, 479, 359
- Sameie et al. (2020) Sameie, O., Yu, H.-B., Sales, L. V., Vogelsberger, M., & Zavala, J. 2020, Phys. Rev. Lett., 124, 141102
- Sameie et al. (2021) Sameie, O., Boylan-Kolchin, M., Sanderson, R., et al. 2021, MNRAS, 507, 720
- Samuel et al. (2020) Samuel, J., Wetzel, A., Tollerud, E., et al. 2020, MNRAS, 491, 1471
- Santos-Santos et al. (2023) Santos-Santos, I. M. E., Navarro, J. F., & McConnachie, A. 2023, MNRAS, 520, 55
- Santos-Santos et al. (2020) Santos-Santos, I. M. E., Navarro, J. F., Robertson, A., et al. 2020, MNRAS, 495, 58
- Sawala et al. (2016) Sawala, T., Frenk, C. S., Fattahi, A., et al. 2016, MNRAS, 457, 1931
- Schneider et al. (2017) Schneider, A., Trujillo-Gomez, S., Papastergis, E., Reed, D. S., & Lake, G. 2017, MNRAS, 470, 1542
- Shen et al. (2022) Shen, J., Eadie, G. M., Murray, N., et al. 2022, ApJ, 925, 1
- Shirasaki et al. (2022) Shirasaki, M., Okamoto, T., & Ando, S. 2022, MNRAS, 516, 4594
- Silverman et al. (2023) Silverman, M., Bullock, J. S., Kaplinghat, M., Robles, V. H., & Valli, M. 2023, MNRAS, 518, 2418
- Simon (2018) Simon, J. D. 2018, ApJ, 863, 89
- Simon (2019) Simon, J. D. 2019, ARA&A, 57, 375
- Slone et al. (2021) Slone, O., Jiang, F., Lisanti, M., & Kaplinghat, M. 2021, arXiv e-prints, arXiv:2108.03243
- Spergel & Steinhardt (2000) Spergel, D. N. & Steinhardt, P. J. 2000, Phys. Rev. Lett., 84, 3760
- Springel (2005) Springel, V. 2005, MNRAS, 364, 1105
- Springel et al. (2008) Springel, V., Wang, J., Vogelsberger, M., et al. 2008, MNRAS, 391, 1685
- Taibi et al. (2020) Taibi, S., Battaglia, G., Rejkuba, M., et al. 2020, A&A, 635, A152
- Torrealba et al. (2016) Torrealba, G., Koposov, S. E., Belokurov, V., & Irwin, M. 2016, MNRAS, 459, 2370
- Torrealba et al. (2019) Torrealba, G., Belokurov, V., Koposov, S. E., et al. 2019, MNRAS, 488, 2743
- Tulin & Yu (2018) Tulin, S. & Yu, H.-B. 2018, Phys. Rep., 730, 1
- Tulin et al. (2013) Tulin, S., Yu, H.-B., & Zurek, K. M. 2013, Phys. Rev. D, 87, 115007
- Turner et al. (2021) Turner, H. C., Lovell, M. R., Zavala, J., & Vogelsberger, M. 2021, MNRAS, 505, 5327
- Valli & Yu (2018) Valli, M. & Yu, H.-B. 2018, Nature Astronomy, 2, 907
- Vogelsberger et al. (2012) Vogelsberger, M., Zavala, J., & Loeb, A. 2012, MNRAS, 423, 3740
- Wang et al. (2012) Wang, J., Frenk, C. S., Navarro, J. F., Gao, L., & Sawala, T. 2012, MNRAS, 424, 2715
- Wang et al. (2020) Wang, K., Mao, Y.-Y., Zentner, A. R., et al. 2020, MNRAS, 498, 4450
- Wang et al. (2021) Wang, Y., Nadler, E. O., Mao, Y.-Y., et al. 2021, ApJ, 915, 116
- Webb & Bovy (2020) Webb, J. J. & Bovy, J. 2020, MNRAS, 499, 116
- Wetzel et al. (2016) Wetzel, A. R., Hopkins, P. F., Kim, J.-h., et al. 2016, ApJ, 827, L23
- Yang & Yu (2021) Yang, D. & Yu, H.-B. 2021, Phys. Rev. D, 104, 103031
- Yang & Yu (2022) Yang, D. & Yu, H.-B. 2022, J. Cosmology Astropart. Phys, 2022, 077
- Yang et al. (2020) Yang, D., Yu, H.-B., & An, H. 2020, Phys. Rev. Lett., 125, 111105
- Yang et al. (2023) Yang, S., Du, X., Zeng, Z. C., et al. 2023, ApJ, 946, 47
- Yoshida et al. (2000) Yoshida, N., Springel, V., White, S. D. M., & Tormen, G. 2000, ApJ, 544, L87
- Zavala et al. (2019) Zavala, J., Lovell, M. R., Vogelsberger, M., & Burger, J. D. 2019, Phys. Rev. D, 100, 063007
- Zavala et al. (2013) Zavala, J., Vogelsberger, M., & Walker, M. G. 2013, MNRAS, 431, L20
- Zeng et al. (2022) Zeng, Z. C., Peter, A. H. G., Du, X., et al. 2022, MNRAS, 513, 4845
- Zentner et al. (2022) Zentner, A., Dandavate, S., Slone, O., & Lisanti, M. 2022, J. Cosmology Astropart. Phys, 2022, 031
- Zolotov et al. (2012) Zolotov, A., Brooks, A. M., Willman, B., et al. 2012, ApJ, 761, 71
Appendix A Cosmological SIDM Implementation
The SIDM simulation performed in this paper is based on a module that extends the public GADGET-2 (Springel, 2005) program to incorporate elastic DM scatterings. It adopts the parallelization implementation in Robertson et al. (2017), with a few modifications. For isolated halo simulations, details of the program have been introduced in Yang & Yu (2022). For cosmological simulations, the evaluation of differential cross section and scattering probability needs to be updated to incorporate the expansion of the universe.
The extension from isolated to cosmological simulation is based on the time integration scheme of GADGET-2 (Springel, 2005), where the kick and drift of positions and momenta are implemented as follows:
| (A1) | |||||
where refers to the components of comoving coordinates, refers to the canonical momentum, and , are the Hubble and relative matter density today. The program uses the comoving coordinates, and a velocity variable , which is consistently translated into the peculiar velocity when evaluating a velocity-dependent cross section.
The scattering probability between a pair of neighboring particles is evaluated in a single time step of displacement as follows:
| (A2) |
where is a (velocity-dependent) cross section, is the separation between the two particles, is a weighting kernel, and the factor removes double counting from looping over the particle indices . We choose the kernel function to be the same as the smoothing kernel in GADGET-2 (Springel, 2005); also see the discussion in Yang & Yu (2022).
A halo virialized in a static background maintains virialized in a comoving background. We make use of this feature to test if an isolated virialized halo evolves similarly under SIDM in a cosmological (comoving) versus static background. We perform this test for a dwarf-sized halo with a constant cross section and obtained almost identical results in physical coordinates, which verified our cosmological implementation of the SIDM module.
Appendix B Convergence tests
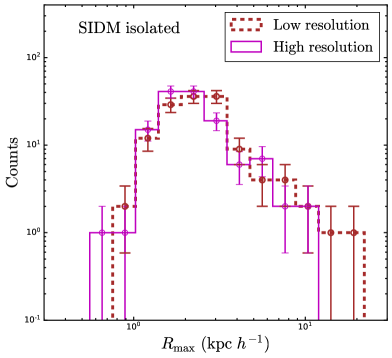
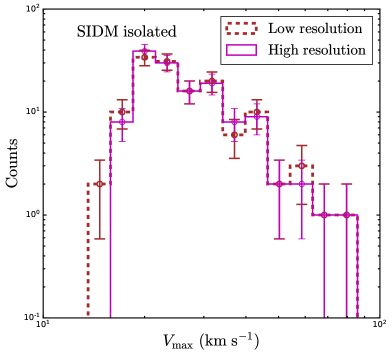
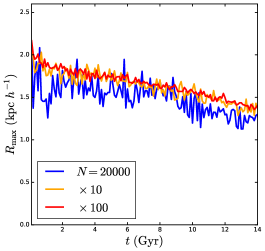
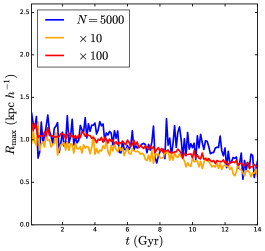
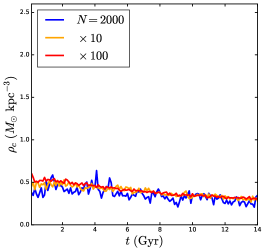
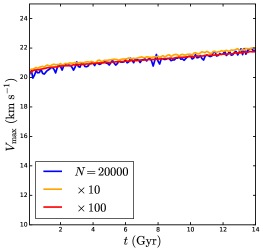
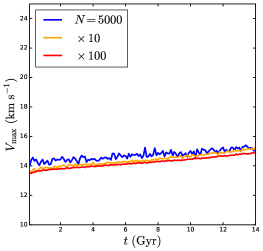
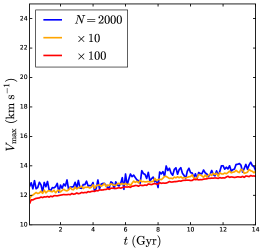
We perform two tests to evaluate the convergence properties of our halos in our SIDM simulation. As shown in the main text, the core-forming halos in our simulation are typically more massive than the core-collapsed halos; we therefore expect better convergence for core-forming halos, in general. In Figure 14, we show the distribution of and for isolated SIDM halos that are more massive than , in the fiducial high-resolution simulation used in the paper, and in a lower-resolution simulation that uses an times larger particle mass and times larger softening, with an equal time-stepping criteria. This mass threshold selects the halos in the lower-resolution simulation containing at least simulation particles; hence, the selected halos are expected to have converged properties, which is confirmed by Figure 14. The minor shifts we find in these distributions are not systematic, and may be caused by, for example, subtle differences in ROCKSTAR’s reconstruction of halo properties at varying resolution.
To test the convergence properties of core-collapsed halos, which have relatively low particle counts even in our high-resolution simulation, we take a different approach. In particular, we perform isolated, noncosmological simulations of the three representative core-collapsed halos from our cosmological simulation. We generate initial conditions using the SpherIC code Garrison-Kimmel et al. (2013) and assuming the NFW profile parameters similar to those reported by ROCKSTAR at . Simulation parameters of the three halos are collected in Table 2. In all cases, the force softening lengths are fixed to be pc. For an extreme test, we take the third benchmark to be an isolated core-collapsed halo close to the mass threshold of used throughout the analysis, corresponding to high-resolution particles.
We simulate the gravothermal evolution of these halos using the same simulation particle mass in our fiducial high-resolution simulation; to test for convergence, we also simulate the same systems with and smaller particle masses and larger particle counts. The results are shown in Figure 15. From top to bottom rows, the evolution of the central density (i.e., the average density within the force softening length), , and , are shown for the three different resolutions. In all cases, we obtained reasonably converged results, with differences at the sub level at most times for , comparable to the size of statistical fluctuations given the particle count. Convergence is particularly good in terms of , with differences at the level among our convergence runs, and is converged at the level. We have also checked that the convergence is as good as shown in Figure 15 for the central density evaluated within and .
| Name | () | |||
|---|---|---|---|---|
| Isolated 1 | ||||
| Splashback | ||||
| Isolated 2 |
Appendix C Fitting the relation
Here, we describe our method for fitting the relation and the results. Assuming that is at most a first-order polynomial in , we derive the median relation by minimizing the median absolute error. To quantify the deviation from the median, we measure statistical fluctuations based on the residual distributions and evaluate the percentiles of upward and downward fluctuations at () and () coverage probabilities. This yields the following:
In Figures 7 and 9, we show the median relation and dex uncertainties to emphasize the differences between the CDM and SIDM results. For this purpose, we show the same curves in all planes, which is based on the CDM simulation. For completeness, we also quantify the statistical deviations of the dex lines from the CDM median: the dex line corresponds to a () upward fluctuation in the isolated halo (subhalo) case, while the dex line corresponds to a () downward fluctuation in the isolated halo (subhalo) case.
Appendix D Benchmark Isolated and Splashback Halo Histories
We present the evolution histories of the isolated and splashback benchmark core-collapsed halos from Table 1 in Figures 16 and 17, respectively. Comparing the isolated benchmark with the MW subhalo benchmark from Figure 6, we see that the isolated one has a large distance to the MW center at all times but does not go beyond Mpc due to our distance cut. This halo has a high concentration of in the CDM case, which is higher than the median concentration mass relation from Dutton & Macciò (2014) at . Limited by the resolution, the density profile inside the NFW scale radius is not very well resolved. Aside from that, its density profile is consistent with an NFW profile, as can be seen from the density slope plot in Figure 16, where the slope increases from to .
The splashback halo is characterized by a single pericenter passage that is close to the MW center, with . From the evolution of its and , we see that its SIDM evolution differs from its CDM evolution significantly only at late times, after its pericentric passage. Thus, this halo shows a rather extreme case of accelerated gravothermal evolution due to tidal effects.