An H Impression of Ly Galaxies at with Deep JWST/NIRCam Imaging
Abstract
We present a study of seven spectroscopically confirmed (Ly emitting) galaxies at redshift using the JWST/NIRCam imaging data. These galaxies, with a wide range of Ly luminosities, were recently observed in a series of NIRCam broad- and medium-bands. We constrain the rest-frame UV/optical continua and measure the H line emission of the galaxies using the combination of the JWST/NIRCam and archival HST/WFC3 infrared photometry. We further estimate their escape fractions of Ly photons () and the production efficiency of ionizing photons (). Among the sample, 6/7 galaxies have Ly escape fractions of , which might be the status for most of star-forming galaxies at . One UV-faint Ly galaxy with an extremely blue UV slope owns a large value of reaching . These galaxies spread a broad range of over log10 (Hz erg-1) . We find that UV-fainter galaxies with bluer UV continuum slopes likely have higher escape fractions of Ly photons. We also find that galaxies with higher Ly line emission tend to produce ionizing photons more efficiently. The most Ly-luminous galaxy in the sample has a very high of log10 (Hz erg-1) . Our results support that Ly galaxies may have served as an important contributor to the cosmic reionization. Blue and bright Ly galaxies are excellent targets for JWST follow-up spectroscopic observations.
1 Introduction
The James Webb Space Telescope (JWST; Gardner et al. 2006) has begun to explore the very distant Universe, allowing us to gain deep insight on the high-redshift (high-) objects at the epoch of reionization (EoR). The major sources of reionization are presumably star-forming (SF) galaxies (e.g., Robertson et al., 2015; Finkelstein et al., 2019; Yung et al., 2020a). This viewpoint has been conclusively demonstrated by Jiang et al. (2022). As a population of SF galaxies, Ly emitting galaxies are generally low-mass with low metallicity and dust content (e.g., Hao et al., 2018; Arrabal Haro et al., 2020; Santos et al., 2020). They should play a non-negligible role to drive the reionization because the processes responsible for the emission of Ly and Lyman continuum (LyC) photons relate to each other (e.g., Dijkstra, 2014; Verhamme et al., 2015; de Barros et al., 2016; Dijkstra et al., 2016) while Ly escape fraction () generally exceeds LyC escape fraction (; e.g., Izotov et al., 2016, 2020; Leitherer et al., 2016; Shapley et al., 2016; Verhamme et al., 2017; Flury et al., 2022).
Large ground-based telescopes and Hubble Space Telescope (HST) helped us to find a large number of Ly-emitting galaxies with redshift reaching , corresponding to the end of EoR. Most of them are Ly emitters (LAEs) selected by the narrowband (Ly) technique (e.g., Kashikawa et al., 2006, 2011; Hu et al., 2010; Shibuya et al., 2018; Taylor et al., 2021). The rest of them are Lyman-break galaxies (LBGs) selected by the dropout technique and identified by Ly lines (e.g., Steidel et al., 1996; Jones et al., 2012; Inami et al., 2017; Pentericci et al., 2018). The LAEs and LBGs (with Ly lines) are probably indistinguishable in terms of their intrinsic properties such as age, stellar mass, and star formation rate (SFR; e.g., Dayal & Ferrara, 2012; Jiang et al., 2016; de La Vieuville et al., 2020). We thus call both of them as Ly galaxies in the following text.
To understand how SF galaxies contribute to the ionizing photon budget, their rest-frame optical properties (continua and line emission) are necessary to be constrained. However, this task is difficult to execute before JWST era, especially for galaxies. For example, due to a lack of near-/mid- infrared (IR) bands, it is challenging to break the degeneracy between prominent nebular emission from young galaxies and strong Balmer breaks from old galaxies (e.g. Schaerer & de Barros, 2009; Jiang et al., 2016). On the other hand, even if the galaxies are spectroscopically confirmed (by Ly line for instance) at , the optical emission lines (mainly [O iii]+H and H+[N ii]) simultaneously boost the IRAC1 and IRAC2 channels of Spitzer Space Telescope (e.g. Faisst et al., 2016; Harikane et al., 2018; Stefanon et al., 2021), leaving lines and continua coupled together. Such problems are being well solved in the current JWST era.
For building a large and homogeneous sample of high- galaxies, we have carried out the Magellan M2FS spectroscopic survey to identify LAEs and LBGs at (Jiang et al. 2017; Ning et al. 2020, 2022; Fu et al. in preparation). A fraction of them will be covered by the upcoming JWST imaging survey, such as COSMOS-Webb (GO 1727; Kartaltepe et al., 2021; Casey et al., 2022) and PRIMER (GO 1837; Dunlop et al., 2021). The multiple IR bands can reveal their individual properties in detail. Recently, one of our identified LBGs has been covered by parallel JWST/NIRCam imaging of PRIMER MIRI observations. In this work, we compare it with spectroscopically confirmed galaxies at from from previous literatures (Pentericci et al., 2018) to give a pilot investigation on the H properties of luminous Ly galaxies.
This paper is organized as follows. In Section 2, we briefly present the sample of Ly galaxies, JWST/NIRCam imaging observations, data reduction, and photometry. In Section 3, we give the measurement results of the Ly, ultraviolet (UV), and H-related properties of the galaxy sample. We discuss their Ly escape fractions and ionizing photon production rates in Section 4. We summarize this work in Section 5. Throughout the paper, we use a standard flat cosmology with , and . All magnitudes refer to the AB system (Oke, 1974).
2 Sample and Data
In this section, we describe our sample of Ly galaxies at , JWST/NIRCam imaging observations, data reduction, and photometry. We summarize the sample information in Table 1.
| ID | SC-1 | SC-2 | SC-3 | SC-4 | SC-5 | SC-6 | SC-7 |
|---|---|---|---|---|---|---|---|
| RA (J2000.0) | 02:17:43.25 | 02:17:48.31 | 02:17:25.12 | 03:32:28.19 | 03:32:36.47 | 03:32:38.28 | 03:32:39.06 |
| Dec (J2000.0) | 05:06:47.5 | 05:10:31.7 | 05:11:35.0 | 27:48:18.7 | 27:46:41.4 | 27:46:17.2 | 27:45:38.7 |
| Redshift | 6.087 | 5.810 | 6.297 | 5.939 | 5.938 | 6.108 | 5.916 |
| CANDELS field | (UDS)aafootnotemark: | UDS | UDS | GOODS-S | GOODS-S | GOODS-S | GOODS-S |
| JWST ObsID | PRIMER-o022 | PRIMER-o022 | PRIMER-o014 | UDF-MB | UDF-MB | UDF-MB | UDF-MB |
| F090W (mag) | 26.58 0.07 | 26.02 0.04 | … | … | … | … | … |
| F105W (mag) | … | … | … | 26.15 0.06 | 25.76 0.03 | 26.31 0.03 | 27.64 0.07 |
| F115W (mag) | 26.56 0.07 | 25.56 0.03 | … | … | … | … | … |
| F125W (mag) | … | 25.56 0.09 | 26.39 0.17 | 26.15 0.07 | 25.70 0.02 | 26.35 0.02 | 27.73 0.06 |
| F150W (mag) | 26.76 0.08 | 25.30 0.02 | … | … | … | … | … |
| F160W (mag) | … | 25.49 0.10 | 26.51 0.16 | 26.04 0.07 | 25.70 0.02 | 26.32 0.02 | 28.06 0.08 |
| F182M (mag) | … | … | … | 26.32 0.01 | 26.20 0.01 | 26.32 0.01 | 27.46 0.02 |
| F210M (mag) | … | … | … | 26.21 0.01 | 26.07 0.01 | 26.28 0.01 | 27.15 0.02 |
| F200W (mag) | 26.57 0.07 | 25.22 0.02 | … | … | … | … | … |
| F277W (mag) | 26.20 0.04 | 24.80 0.01 | 25.97 0.03 | … | … | … | … |
| F356W (mag) | 25.06 0.01 | 24.57 0.01 | 25.21 0.01 | … | … | … | … |
| F410M (mag) | 25.93 0.07 | 24.66 0.02 | 26.26 0.09 | … | … | … | … |
| F444W (mag) | 24.73 0.02 | 24.53 0.02 | 25.67 0.04 | … | … | … | … |
| F430M (mag) | … | … | … | 26.42 0.09 | 26.03 0.06 | 26.27 0.08 | 27.67 0.34 |
| F460M (mag) | … | … | … | 25.06 0.03 | 24.56 0.02 | 25.51 0.04 | 25.80 0.07 |
| F480M (mag) | … | … | … | 26.31 0.09 | 25.92 0.06 | 25.79 0.05 | 27.62bbfootnotemark: |
The parenthesis indicates that SC-1 is located close to the CANDELS-UDS imaging region.
bbfootnotemark: This value correspond to a upper limit.
2.1 Sample of Ly Galaxies at
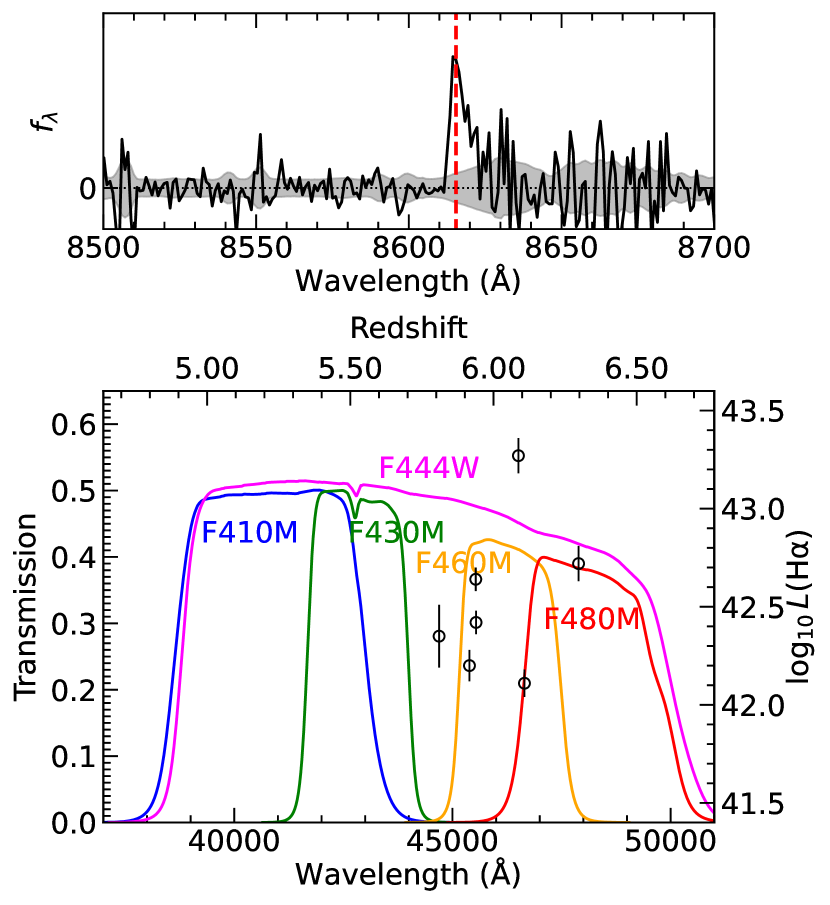
The sample includes seven spectroscopically confirmed galaxies at . The first one (SC-1) is confirmed at redshift with a strong Ly line by our spectroscopic survey (see the upper panel of Figure 1; Fu et al. in preparation). In this survey, we carried out spectroscopic observations using the fiber-fed, multi-object spectrograph Michigan/Magellan Fiber System (M2FS; Mateo et al. 2012) on the 6.5 m Magellan Clay telescope. The science goal is to build a large and homogeneous sample of high- galaxies (see Jiang et al. 2017 for an overview of the program), including LAEs at and 6.6 (Ning et al., 2020, 2022), and LBGs at (Fu et al. in preparation). These high- galaxies are located in the famous fields including the Subaru XMM-Newton Deep Survey (SXDS), the Extended Chandra Deep Field-South (ECDFS), A370, COSMOS, and SSA22. The total sky area is around deg2. SC-1 has an estimated Ly equivalent width of EW0(Ly) Å. It is thus one of the largest-EW0(Ly) LBGs in a wide area covered by our spectroscopic survey.
The rest six sources (SC-2–7) are from a previous work, Pentericci et al. (2018, hereafter P18). They used VLT/FORS2 to conduct the CANDELSz7 survey, an ESO Large Program, to spectroscopically confirm SF galaxies at in three HST CANDELS Legacy fields (GOODS-South, UDS, and COSMOS). SC-2 and SC-3 locate in the CANDELS UDS field while SC-4–7 locate in the CANDELS GOODS-South (GOODS-S) field. Among them, SC-2 was detected with no emission line and a continuum discontinuity which is interpreted as a Ly break (see P18). Due to the limited sensitivity of instruments and depth of observations, we treat this source as a Ly galaxy with an upper limit of EW0(Ly) from P18. Figure 1 shows redshift distribution of the sample in the lower panel.
2.2 Imaging Data
The three sources SC-1–3 in/around the CANDELS UDS field are covered by the JWST Cycle-1 program (GO 1837), Public Release IMaging for Extragalactic Research (PRIMER; Dunlop et al. 2021). The PRIMER survey pays attention to the two key equatorial HST CANDELS Fields (COSMOS and UDS) by delivering 10-band NIRCam+MIRI imaging observations. It owns the parallel NIRCam imaging in eight bands including F090W, F115W, F150W, and F200W in the short wavelength (SW), and F277W, F356W, F444W, and F410M in the long wavelength (LW). Note that the F410MF444W color is a good indication of H emission of the SF galaxies at . SC-1–3 have been imaged by PRIMER #14 and #22 observations with individual exposure lengths of hours in the SW bands and hours in the LW bands.
The other four sources SC-4–7 are covered by the JWST Cycle-1 program (GO 1963), UDF medium-band survey (UDF-MB; Williams et al. 2021). The UDF-MB survey images the (Hubble) Ultra Deep Field (UDF) with a single NIRCam pointing (field of view ) in a series of medium-bands including F182M, F210M, F430M, F460M, and F480M (NIRISS F430M and F480M in parallel). Total integration time reaches hours for each F182M, F210M, and F480M and hours for each F430M and F460M. In Figure 1, we plot the transmission curves of the five JWST/NIRCam LW filters to compare and illustrate the H locations of the galaxies in the observed-wavelength frame.
Except SC-1 and 2, other sources are not covered by enough JWST SW bands especially SC-3 is located in the gap region of NIRCam SW imaging. We thus utilize the archival HST/WFC3 (Wide Field Camera 3) near-IR imaging data from the CANDELS program (Grogin et al., 2011; Koekemoer et al., 2011; Guo et al., 2013; Galametz et al., 2013). We download the data products provided by the High Level Science Products111https://archive.stsci.edu/hlsp/candels. SC-2 and SC-3 have HST/WFC3 F125W and F160W observations while SC-1 is a little bit outside the CANDELS UDS region. SC-4–7 in the CANDELS GOODS-S region have HST/WFC3 observations in three near-IR bands (F105W, F125W and F160W).
2.3 Data Reduction and Photometry
We reduced the NIRCam imaging data with the standard JWST pipeline222https://github.com/spacetelescope/jwst (v1.7.2) up to stage 2 using the reference files “jwst_0999.pmap” for PRIMER and “jwst_1008.pmap” for UDF-MB. Then we use the Grizli333https://github.com/gbrammer/grizli reduction pipeline to process the output images. Grizli mitigates 1/f noises and mask the “snowball” artifacts from cosmic rays (Rigby et al., 2022). It further converts the world coordinate system (WCS) information in the headers to the SIP format for each exposure so that images can be drizzled and combined with Astrodrizzle444https://drizzlepac.readthedocs.io/en/latest/astrodrizzle.html. For the SW and LW images, the WCS of final mosaics are registered based on the catalogs of DESI Legacy Imaging Surveys Data Release 9 and the pixel scale was resampled to 0.03″ with pixfrac . We also subtract an additional background on the final mosaics. Figure 2a shows the thumbnail images of the sample in a series of the JWST/NIRCam (and/or HST/WFC3 near-IR) bands.
We run SExtractor (Bertin & Arnouts, 1996) to perform photometry in the JWST/NIRCam multi-band images. The aperture has a radius of triple FWHMs of the point-spread function (PSF) in each wavelength band. The aperture correction is calculated from the PSF in each band. We first obtain initial measurements by matching the output catalogs to the targets within a distance tolerance of a FWHM. For each target, we select its brightest band to feed the detection image. Specifically, we adopt the F444W band for three sources covered by the PRIMER survey and the F460W band for the four sources covered by the UDF-MB survey because their H lines boost these bands. We then rerun SExtractor in the dual image mode with the detection images. For each measurement image, we also adopt an aperture with a radius of triple PSF FWHMs in this band. Only for the SC-7 source, we use a radius of 1.5 PSF FWHM, in order to minimize the amount of abnormal pixels within the photometric aperture, caused by the fact that SC-7 is located very close to the image edge. Table 1 lists the multi-band photometry results of the galaxy sample.
| ID | (Ly) | EW0(Ly) | (Ly) | (H) | EW0(H) | SFR(H) | ||||
|---|---|---|---|---|---|---|---|---|---|---|
| () | (Å) | () | (Å) | (Hz erg-1) | (M⊙ yr-1) | |||||
| (1) | (2) | (3) | (4) | (5) | (6) | (7) | (8) | (9) | (10) | (11) |
| SC-1 | 6.087 | -2.03 | -20.11 | 43.16 | 147 | 0.066 0.014 | 43.27 0.09 | 2756 596 | 26.45 0.19 | 100 22 |
| SC-2 | 5.810 | -1.46 | -21.06 | 41.92 | 4 | 0.03 | 42.35 0.16 | 113 40 | 25.15 0.31 | 12 4 |
| SC-3 | 6.297 | -2.53 | -20.46 | 42.54 | 23 | 0.055 0.011 | 42.72 0.09 | 994 204 | 25.77 0.18 | 28 6 |
| SC-4 | 5.939 | -1.73 | -20.51 | 42.44 | 20 | 0.088 0.013 | 42.42 0.06 | 663 94 | 25.45 0.12 | 14 2 |
| SC-5 | 5.938 | -1.88 | -20.93 | 42.15 | 7 | 0.027 0.004 | 42.64 0.06 | 767 102 | 25.49 0.12 | 23 3 |
| SC-6 | 6.108 | -2.00 | -20.39 | 42.10 | 10 | 0.082 0.013 | 42.11 0.07 | 267 42 | 25.18 0.13 | 7 1 |
| SC-7 | 5.916 | -3.01 | -19.08 | 42.94 | 186 | 0.470 0.085 | 42.20 0.08 | 1261 227 | 25.79 0.16 | 8 2 |
3 Results
In this section, we give the measured results of UV and H quantities of the galaxy sample. Their UV properties are derived from JWST/NIRCam SW bands and/or HST/WFC3 near-IR bands. We utilize the NIRCam medium-bands to constrain their (rest-frame) optical continuum. We then measure their H flux by combining the corresponding LW broad- or medium-bands. We further obtain their H-related properties including the Ly escape fraction and the ionizing photon production efficiency. The results are listed in Table 2.
3.1 UV Continua
We measure the UV continuum of the galaxies with the commonly used method (e.g., Pentericci et al., 2018; Jiang et al., 2020). As in these works, we assume a power-law form for the UV continuum of each source, i.e.: . As we work in AB magnitude units, we fit a linear relation to the SW photometric data, from which we obtain the UV continuum slope and the absolute UV magnitude at the rest-frame wavelength 1500Å.
For a galaxy at , its observed Ly line locates in the wavelength range of the Subaru/ and JWST/F090W bands. The corresponding broad-band flux usually differs from the flux level of UV continuum due to the Ly emission or break (IGM absorption bluewards of Ly). So in the measurements for UV continua, we abandon the F090W photometric data for SC-1 and SC-2. We then subtract the fit power-law UV continuum from the - or F090W-band photometry to constrain Ly flux and EW0(Ly) for SC-1. The IGM continuum absorption blueward of Ly line is considered in the computation (Madau, 1995). For SC-3–7, the CANDELz7 galaxies, we directly adopt the observed Ly flux given by P18 to compute the Ly luminosity and EW0(Ly) with our obtained power-law UV continua. For SC-2 which is undetected in Ly, we use the upper limit of EW0(Ly) given by P18 to compute its Ly flux. Note that Ly flux may be slightly underestimated due to the potential Ly emission from the circumgalactic medium (e.g., Cai et al., 2019; Wu et al., 2020).
3.2 H Line Emission
We combine the medium- and broad-bands (covering the rest-frame optical wavelength at ) to estimate the flux and EW of H emission lines. In Figure 2, the (red) color of F410MF444W and F430MF460M clearly show the flux excess due to strong H lines. In the F444W broad-band which covers the F410M, F430M, F460M, and F480M medium-bands, H+[N ii] lines dominate the flux estimation (e.g., Anders & Fritze-v. Alvensleben, 2003). We thus ignore other optical lines except H+[N ii]. We assume that [N ii] contribute line flux at the H wavelength due to the small wavelength difference relative to the wavelength range of . We also assume that the emission line has a gaussian profile with FWHM = 300 km s-1 (see the black lines in Figure 2b).
SC-4–7 are covered by the UDF-MB survey with five NIRCam medium-bands. For SC-4, 5, and 7, we use the F430M and F480M magnitude ( upper limit for SC-7) to constrain the rest-frame optical continuum with a power-law form because the H+[N ii] emission only fall into the F460M band. For SC-6, the H+[N ii] emission fall into the F460M and F480M bands. We thus match the continuum plus line model to the three LW medium-band photometric data. Figure 2b illustrates the above procedure in the lower panel. For these four sources, we obtain similar power-law indices with a median value of . SC-1–3 are covered by the PRIMER NIRCam multi-band (7 broad + 1 medium) observations. As no strong nebular lines fall into the F410M band, we use the F410M magnitude to constrain the (rest-frame) optical continuum and the F410MF444W color to estimate H+[N ii] flux. We start with a power-law continuum with an index of (from the other four sources) to match the F410M flux density. Then we integrate the known continuum plus unknown line emission weighted by the F444W filter transmission curve to match the F444M flux density and compute the H+[N ii] flux. We also vary the continuum slope in a reasonable range of to obtain the deviations of the measured line flux which would be included into the errors of the final values. Figure 2b illustrates the above procedure in the upper panel.
After estimating the line flux, we assume that H accounts for 85% of the H+[N ii] flux, which is similar to previous studies (e.g., Rasappu et al., 2016; Faisst et al., 2019; Sun et al., 2022). To be conservative, we also feed the 10% flux into the error of the final H flux. With the measured flux of H line, we obtain the SFR(H) using the canonical H-SFR calibration relation (listed in Column 11 of Table 2; Hao et al., 2011; Murphy et al., 2011; Kennicutt & Evans, 2012). We further compute the EW0(H) with the rest-frame optical continuum level. The results are plotted in the second and third rows of Figure 3. Note that the H flux and EW may be underestimated because the optical continuum is overestimated due to the existence of some faint optical lines. But such an underestimation is supposed to be included into the enlarged measurement errors. EW0(H) indicates the specific SFR (sSFR) of galaxies. Our sample spread a larger range of EW0(H) than the low- LAEs (Matthee et al. 2021) and local analogs (Yang et al. 2017). Recently, Sun et al. (2022) serendipitously found a sample of strong H/[O iii] emitters in the JWST/NIRCam wide-field slitless spectroscopy (WFSS) data. Our median EW0(H) is twice higher than theirs because in our sample the 6/7 galaxies emitting Ly lines are supposed to have higher sSFR while the SF galaxies of Sun et al. (2022) are found based on H/[O iii] detections. SC-7 is undetected in Ly and its EW0(H) is similar to the lowest one of the sample in Sun et al. (2022).
3.3 H-related Properties
3.3.1 Escape Fraction of Ly Photons
We estimate the escape fraction of Ly photons () for the sample. With the obtained H flux, we adopt the canonical ratio (e.g., Henry et al., 2015) to calculate the intrinsic Ly flux and obtain:
| (1) |
under the assumption of case-B recombination in (Osterbrock & Ferland, 2006). We also apply a dust correction using the reddening law of Calzetti et al. (2000). We can not well constrain the extinction for nebulae due to a lack of the Balmer decrement (H/H) information. Thus, we perform SED fitting using BAGPIPES (Carnall et al., 2018) and obtain for SC-2 thanks to the abundance of multi-band photometric data for this source. For others, we adopt a lower and modest value of as a reasonable assumption because they have higher EW0(Ly) with lower dust content. Note that is supposed to be smaller for the six galaxies but the difference is only dex for the computed . The results are listed in the Column 7 of Table 2. We can see that 6/7 galaxies have even though they spread over a large range of EW0(Ly) and EW0(H). This may imply the upper limit of for most of galaxies at . Note that is supposed to be smaller than the (e.g., Dijkstra et al., 2016; Izotov et al., 2020). SC-7 has the largest value of reaching while it is relatively faint in the rest-frame UV ( ) with an extremely blue UV slope ( ). In Section 4.1, we discuss the relevant, potential trends.
3.3.2 Production Efficiency of Ionizing Photons
With the measured flux of UV continua and H line, we estimate the Hydrogen ionizing photon production efficiency by
| (2) |
where (s-1) is the intrinsic production rate of Hydrogen ionizing photons from stellar populations and (erg s-1 Hz-1) is the (mono-chromatic) UV continuum luminosity per photon frequency which can be derived from the above measured . intrinsically depends on the assumed stellar-population model (e.g., Robertson et al., 2013; Eldridge et al., 2017; Yung et al., 2020b). can be computed from H emission by
| (3) |
in the () case-B recombination (Kennicutt et al., 1994; Leitherer & Heckman, 1995; Madau et al., 1998). We then obtain the production efficiency of ionizing photons which do not escape from the galaxy, assuming = 0.
The (dust-uncorrected) results are shown in the downmost row of Figure 3. Note that the dust-corrected values are lower by dex assuming the canonical stellar/nebular extinction ratio of 0.44 which is obtained from local starbursts (Calzetti et al., 2000). The results are listed in the Column 10 of Table 2. Our obtained distribute over a broad range of log10 . The median value is consistent with that of a large UV-faint galaxy sample from Prieto-Lyon et al. (2022). This median is also close to that of a H-emitter sample from Sun et al. (2022). Among our sample, SC-1 is the most luminous in Ly and has the highest reaching log10 while SC-2 is not detected in Ly and has the lowest . We further give an extensive discussion in next section.
4 Discussion
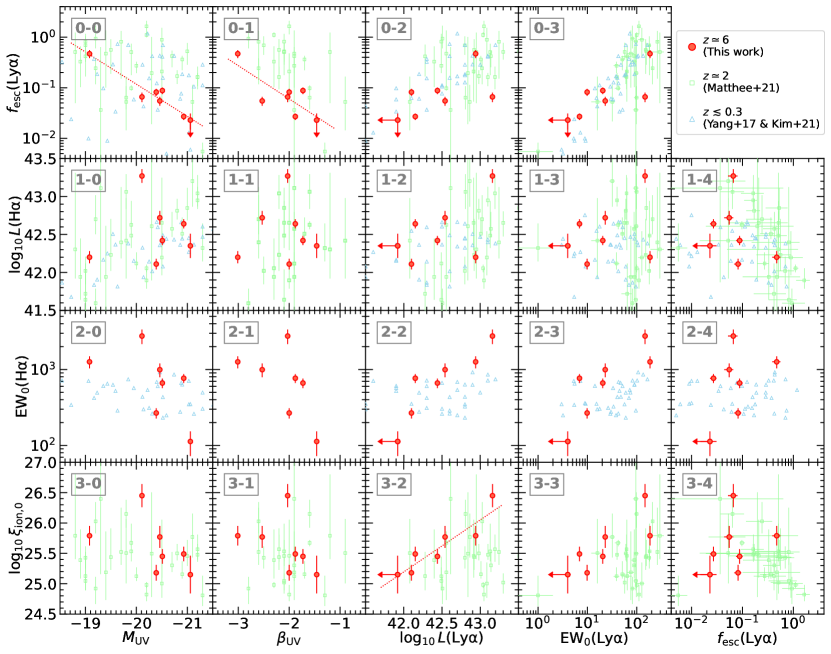
Thanks to the excellent capability of JWST (Rigby et al., 2022), we have measured the H-related properties of the SF galaxies at . In this section, we discuss the obtained properties of the galaxy sample. We compare our results with previous studies in Figure 3. The H-related properties are assigned by rows and Ly/UV quantities are assigned by columns. The is assigned again at the rightmost column to compare with the H-related properties.
4.1 -UV Correlation
We compare the obtained in the upmost row and rightmost column of Figure 3. The measured results show that positively correlates with (Ly) and EW0(Ly), and negatively correlates with and (in the upmost row). The positive trends are natural because is inferred through Ly flux, which is similar to those found from the low- samples (e.g., Hayes et al., 2014; Yang et al., 2017; Matthee et al., 2021). Yang et al. (2017) (and Kim et al. 2021) use a statistical sample of local Green Pea galaxies as high- analogs to reveal that. Matthee et al. (2021) use a LAE sample at and also found such a relation. For the negative trends of changing as UV properties, we obtain a linear relation between and ,
| (4) |
shown as a red dotted line in panel 0-0; we also obtain another linear relation between and ,
| (5) |
shown as a red dotted line in panel 0-1. The - relation seems to exist in the current high- sample, although the sign is weak for the two samples of Ly galaxies at lower redshifts. Chisholm et al. (2022) found that increases for fainter using a sample of LyC-leaking SF galaxies at , which is overall lower than our obtained - trend. Such difference is consistent with the scenario of (e.g., de Barros et al., 2016; Dijkstra et al., 2016).
The - trend may exist at like at (e.g., Snapp-Kolas et al., 2022; Prieto-Lyon et al., 2022). The reason can be simply interpreted as that bluer galaxies have younger stellar population and/or lower dust content. They emit harder ionizing photons suffering lower extinction, which accounts for higher escape fraction of Ly photons. The trend is steeper, which is consistent with the current consensus that galaxies at higher redshift are bluer (e.g., Bouwens et al., 2014; Jiang et al., 2020). Chisholm et al. (2022) shows that scales strongly with for the LyC-leaker sample at , while those with have an averaged which is smaller than estimated from our linear fit (panel 0-1 of Figure 3). SC-7 is the bluest one in our sample with . This galaxy and the luminous LAEs with very blue UV continua ( ) reported by Jiang et al. (2020) are supposed to be strong LyC leakers to contribute ionizing photons. They are thus excellent targets to carry out JWST IR spectroscopic followup for the ionization lines.
4.2 -Ly Correlation
The panel 3-2 (3-3) of Figure 3 shows a potential correlation between the and Ly luminosity (Ly equivalent width) for the sample in this work. We obtain a linear relation between and :
| (6) |
shown as a red dotted line in panel 3-2. Saldana-Lopez et al. (2022) also found a similar trend in a sample of SF galaxies at . We notice that such correlations does not always keep for the LAEs at from Matthee et al. (2021), especially for those with relative bright Ly flux. A direct reason is that the LAEs in Matthee et al. (2021) generally have higher , even reaching . Matthee et al. (2017b) also obtained several galaxies have and they explained it using the mechanisms including, for example, Ly emission is produced by a different mechanism (like cooling radiation; Dijkstra 2014). We look forward to compare their results updated with the additional H information.
The - trend can be reasonably expected because harder ionizing radiation of more young stellar populations (higher sSFR shown by the panel 2-2) tend to produce more ionizing photons per non-ionizing photons (e.g., Balestra et al., 2013; Mainali et al., 2017) and ionize the ISM more efficiently, eventually enhancing Ly production, transfer, and escape. Note that EW0(Ly) can be inferred to be proportional to (e.g., Harikane et al., 2018). This trend implies that galaxies with (Ly) (at the bright end of Ly luminosity function) may have a high ionizing photon production efficiency reaching log10 . Conversely speaking, SF galaxies with low () may tend to emit negligible Ly emission. If such a trend exists, the very (Ly) luminous galaxies could fully ionize their surrounding neutral H i gas with a modest or even small value. This situation is also consistent in which the scenario that luminous Ly galaxies in the EoR power large ionizing bubbles (e.g., Zheng et al., 2017; Yajima et al., 2018; Hu et al., 2021; Ning et al., 2022).
4.3 Implications of High
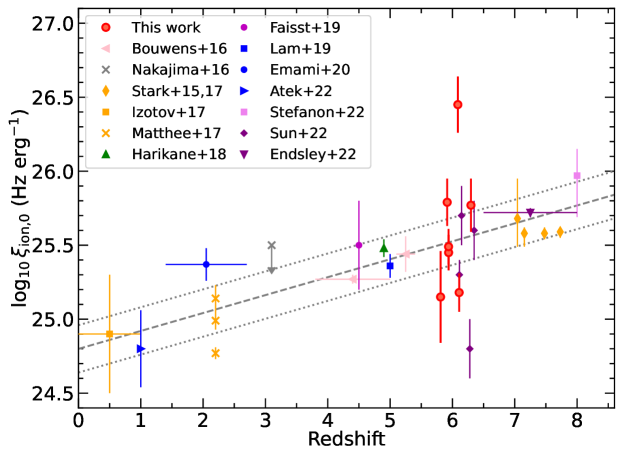
We plot the redshift evolution of for the SF galaxies in Figure 4. The red circle symbols indicate our results for the Ly galaxies at the end of EoR. The figure shows that the of SF galaxies increases with redshift. Among the seven Ly galaxies, three of them (SC-1, 3, and 7) have high production efficiency of ionizing photons of log10 . This fact reveals the possibility that a portion of galaxies have high values of . Maseda et al. (2020) also found an elevated mean (log10 ) in a sample of UV-faint and high-EW LAEs at . Finkelstein et al. (2019) presented a reionization model dominated by low-mass and UV-faint galaxies, which would requires such high . Our results provide an observation evidence. The high values of have not been well explained in galaxy simulations. For example, Wilkins et al. (2016) explored the range of EoR galaxies in the BlueTides simulation, in which they used low-metallicity stellar population (with binary systems) models to obtain their highest of log10 . Yung et al. (2020b) could not also provide such high with the semi-analytical models of galaxy formation. Note that their models only predict a rather weak dependence of with redshift, which means we have not well understood the physical processes responsible for the redshift evolution shown in Figure 4 (the gray lines). In the meanwhile, a larger sample of fainter galaxies is necessary to be built to overcome the sampling bias at the higher redshift ().
The median of our Ly galaxy sample is consistent the overall trend (gray lines). Previous results indicate EoR SF galaxies with on the overall trend can provide enough ionizing photon budget (e.g., Harikane et al., 2018; Stefanon et al., 2022). Our sample implies that Ly galaxies may also play a similar role and contribute to the total balance of ionizing photons at . Note that the most luminous Ly galaxy in the sample, SC-1 (identified by our Magellan M2FS survey), has a very high (log10 ) relative to other SF galaxies even though its Ly luminosity of (Ly) is only a little larger than the characteristic luminosity of Ly luminosity function (e.g., Hu et al., 2010; Kashikawa et al., 2011; Zheng et al., 2017; Ning et al., 2022). Its nature need to be revealed based on further spectroscopic observations. Our results support that Ly galaxies, especially those with intrinsically high EW0(Ly), may significantly contribute the ionizing photons during the EoR. We look forward to comparing our findings with the ionizing photon production efficiency estimated for other Ly-luminous galaxies (from, e.g., Ning et al., 2020, 2022) which will be covered by the JWST observations.
5 Summary
In this work, we present a pilot study of a spectroscopically confirmed sample of (Ly emitting) galaxies at redshift based on the JWST/NIRCam imaging data. The sample includes seven targets: one identified by our Magellan/M2FS spectroscopic survey and six observed by the previous CANDELSz7 survey. All the seven sources we analyze are Lyman break galaxies showing large differences in their Ly luminosity, ranging from no observed Ly line up to strong Ly line of (Ly) . These objects have been covered by two JWST/NIRCam imaging surveys, PRIMER and UDF-MB, which employ a serious of SW and LW bands.
We have obtained their Ly- and H-related properties by combining the NIRCam broad- and/or medium-bands. Based on the results, we also revealed the potential correlations among the properties of Ly galaxies at . We summarize our findings as follows:
-
•
6/7 galaxies have Ly escape fractions of regardless of their EW0(Ly) and EW0(H), which might be the status for most of star-forming galaxies at .
-
•
One Ly galaxy which is relatively faint in the rest-frame UV ( ) with an extremely blue UV slope ( ) has a Ly escape fraction reaching .
- •
-
•
Our sample spread over a broad range of the ionizing photon production efficiency over log10 with a median value close to those of the galaxy samples at similar redshifts from other studies.
-
•
Galaxies with more luminous Ly emission probably have higher production efficiency of ionizing photons (Equation [6]).
-
•
Our identified source (SC-1 analyzed in this study) which is very luminous in Ly has a very high ionizing photon production efficiency of log10 (Hz erg-1) . Its nature merits further investigation.
Our results agree with the scenario in which Ly galaxies may serve as a significant contributor to cosmic reionization. The bluer and/or more luminous Ly galaxies are ideal targets for JWST spectroscopic followup observations. We need a larger sample of Ly galaxies observed by JWST for further analysis on the reionization sources.
References
- Anders & Fritze-v. Alvensleben (2003) Anders, P., & Fritze-v. Alvensleben, U. 2003, A&A, 401, 1063
- Arrabal Haro et al. (2020) Arrabal Haro, P., Rodríguez Espinosa, J. M., Muñoz-Tuñón, C., et al. 2020, MNRAS, 495, 1807
- Atek et al. (2022) Atek, H., Furtak, L. J., Oesch, P., et al. 2022, MNRAS, 511, 4464
- Balestra et al. (2013) Balestra, I., Vanzella, E., Rosati, P., et al. 2013, A&A, 559, L9
- Bertin & Arnouts (1996) Bertin, E., & Arnouts, S. 1996, A&AS, 117, 393
- Bouwens et al. (2016) Bouwens, R. J., Smit, R., Labbé, I., et al. 2016, ApJ, 831, 176
- Bouwens et al. (2014) Bouwens, R. J., Illingworth, G. D., Oesch, P. A., et al. 2014, ApJ, 793, 115
- Cai et al. (2019) Cai, Z., Cantalupo, S., Prochaska, J. X., et al. 2019, ApJS, 245, 23
- Calzetti et al. (2000) Calzetti, D., Armus, L., Bohlin, R. C., et al. 2000, ApJ, 533, 682
- Carnall et al. (2018) Carnall, A. C., McLure, R. J., Dunlop, J. S., & Davé, R. 2018, MNRAS, 480, 4379
- Casey et al. (2022) Casey, C. M., Kartaltepe, J. S., Drakos, N. E., et al. 2022, arXiv e-prints, arXiv:2211.07865
- Chisholm et al. (2022) Chisholm, J., Saldana-Lopez, A., Flury, S., et al. 2022, MNRAS, 517, 5104
- Dayal & Ferrara (2012) Dayal, P., & Ferrara, A. 2012, MNRAS, 421, 2568
- de Barros et al. (2016) de Barros, S., Vanzella, E., Amorín, R., et al. 2016, A&A, 585, A51
- de La Vieuville et al. (2020) de La Vieuville, G., Pelló, R., Richard, J., et al. 2020, A&A, 644, A39
- Dijkstra (2014) Dijkstra, M. 2014, PASA, 31, e040
- Dijkstra et al. (2016) Dijkstra, M., Gronke, M., & Venkatesan, A. 2016, ApJ, 828, 71
- Dunlop et al. (2021) Dunlop, J. S., Abraham, R. G., Ashby, M. L. N., et al. 2021, PRIMER: Public Release IMaging for Extragalactic Research, JWST Proposal. Cycle 1, ID. #1837, ,
- Eldridge et al. (2017) Eldridge, J. J., Stanway, E. R., Xiao, L., et al. 2017, PASA, 34, e058
- Emami et al. (2020) Emami, N., Siana, B., Alavi, A., et al. 2020, ApJ, 895, 116
- Endsley et al. (2022) Endsley, R., Stark, D. P., Whitler, L., et al. 2022, arXiv e-prints, arXiv:2208.14999
- Faisst et al. (2019) Faisst, A. L., Capak, P. L., Emami, N., Tacchella, S., & Larson, K. L. 2019, ApJ, 884, 133
- Faisst et al. (2016) Faisst, A. L., Capak, P., Hsieh, B. C., et al. 2016, ApJ, 821, 122
- Finkelstein et al. (2019) Finkelstein, S. L., D’Aloisio, A., Paardekooper, J.-P., et al. 2019, ApJ, 879, 36
- Flury et al. (2022) Flury, S. R., Jaskot, A. E., Ferguson, H. C., et al. 2022, ApJ, 930, 126
- Galametz et al. (2013) Galametz, A., Grazian, A., Fontana, A., et al. 2013, ApJS, 206, 10
- Gardner et al. (2006) Gardner, J. P., Mather, J. C., Clampin, M., et al. 2006, Space Sci. Rev., 123, 485
- Grogin et al. (2011) Grogin, N. A., Kocevski, D. D., Faber, S. M., et al. 2011, ApJS, 197, 35
- Guo et al. (2013) Guo, Y., Ferguson, H. C., Giavalisco, M., et al. 2013, ApJS, 207, 24
- Hao et al. (2018) Hao, C.-N., Huang, J.-S., Xia, X., et al. 2018, ApJ, 864, 145
- Hao et al. (2011) Hao, C.-N., Kennicutt, R. C., Johnson, B. D., et al. 2011, ApJ, 741, 124
- Harikane et al. (2018) Harikane, Y., Ouchi, M., Shibuya, T., et al. 2018, ApJ, 859, 84
- Hayes et al. (2014) Hayes, M., Östlin, G., Duval, F., et al. 2014, ApJ, 782, 6
- Henry et al. (2015) Henry, A., Scarlata, C., Martin, C. L., & Erb, D. 2015, ApJ, 809, 19
- Hu et al. (2010) Hu, E. M., Cowie, L. L., Barger, A. J., et al. 2010, ApJ, 725, 394
- Hu et al. (2021) Hu, W., Wang, J., Infante, L., et al. 2021, Nature Astronomy, 5, 485
- Inami et al. (2017) Inami, H., Bacon, R., Brinchmann, J., et al. 2017, A&A, 608, A2
- Izotov et al. (2017) Izotov, Y. I., Guseva, N. G., Fricke, K. J., Henkel, C., & Schaerer, D. 2017, MNRAS, 467, 4118
- Izotov et al. (2016) Izotov, Y. I., Schaerer, D., Thuan, T. X., et al. 2016, MNRAS, 461, 3683
- Izotov et al. (2020) Izotov, Y. I., Schaerer, D., Worseck, G., et al. 2020, MNRAS, 491, 468
- Jiang et al. (2020) Jiang, L., Cohen, S. H., Windhorst, R. A., et al. 2020, ApJ, 889, 90
- Jiang et al. (2016) Jiang, L., Finlator, K., Cohen, S. H., et al. 2016, ApJ, 816, 16
- Jiang et al. (2017) Jiang, L., Shen, Y., Bian, F., et al. 2017, ApJ, 846, 134
- Jiang et al. (2022) Jiang, L., Ning, Y., Fan, X., et al. 2022, Nature Astronomy, 6, 850
- Jones et al. (2012) Jones, T., Stark, D. P., & Ellis, R. S. 2012, ApJ, 751, 51
- Kartaltepe et al. (2021) Kartaltepe, J., Casey, C. M., Bagley, M., et al. 2021, COSMOS-Webb: The Webb Cosmic Origins Survey, JWST Proposal. Cycle 1, ID. #1727, ,
- Kashikawa et al. (2006) Kashikawa, N., Shimasaku, K., Malkan, M. A., et al. 2006, ApJ, 648, 7
- Kashikawa et al. (2011) Kashikawa, N., Shimasaku, K., Matsuda, Y., et al. 2011, ApJ, 734, 119
- Kennicutt et al. (1994) Kennicutt, Robert C., J., Tamblyn, P., & Congdon, C. E. 1994, ApJ, 435, 22
- Kennicutt & Evans (2012) Kennicutt, R. C., & Evans, N. J. 2012, ARA&A, 50, 531
- Kim et al. (2021) Kim, K. J., Malhotra, S., Rhoads, J. E., & Yang, H. 2021, ApJ, 914, 2
- Koekemoer et al. (2011) Koekemoer, A. M., Faber, S. M., Ferguson, H. C., et al. 2011, ApJS, 197, 36
- Lam et al. (2019) Lam, D., Bouwens, R. J., Labbé, I., et al. 2019, A&A, 627, A164
- Leitherer & Heckman (1995) Leitherer, C., & Heckman, T. M. 1995, ApJS, 96, 9
- Leitherer et al. (2016) Leitherer, C., Hernandez, S., Lee, J. C., & Oey, M. S. 2016, ApJ, 823, 64
- Madau (1995) Madau, P. 1995, ApJ, 441, 18
- Madau et al. (1998) Madau, P., Pozzetti, L., & Dickinson, M. 1998, ApJ, 498, 106
- Mainali et al. (2017) Mainali, R., Kollmeier, J. A., Stark, D. P., et al. 2017, ApJ, 836, L14
- Maseda et al. (2020) Maseda, M. V., Bacon, R., Lam, D., et al. 2020, MNRAS, 493, 5120
- Mateo et al. (2012) Mateo, M., Bailey, J. I., Crane, J., et al. 2012, in Ground-based and Airborne Instrumentation for Astronomy IV, Vol. 8446, 84464Y
- Matthee et al. (2017a) Matthee, J., Sobral, D., Best, P., et al. 2017a, MNRAS, 465, 3637
- Matthee et al. (2017b) Matthee, J., Sobral, D., Darvish, B., et al. 2017b, MNRAS, 472, 772
- Matthee et al. (2021) Matthee, J., Sobral, D., Hayes, M., et al. 2021, MNRAS, 505, 1382
- Murphy et al. (2011) Murphy, E. J., Condon, J. J., Schinnerer, E., et al. 2011, ApJ, 737, 67
- Nakajima et al. (2016) Nakajima, K., Ellis, R. S., Iwata, I., et al. 2016, ApJ, 831, L9
- Ning et al. (2022) Ning, Y., Jiang, L., Zheng, Z.-Y., & Wu, J. 2022, ApJ, 926, 230
- Ning et al. (2020) Ning, Y., Jiang, L., Zheng, Z.-Y., et al. 2020, ApJ, 903, 4
- Oke (1974) Oke, J. B. 1974, ApJS, 27, 21
- Osterbrock & Ferland (2006) Osterbrock, D. E., & Ferland, G. J. 2006, Astrophysics of gaseous nebulae and active galactic nuclei
- Pentericci et al. (2018) Pentericci, L., Vanzella, E., Castellano, M., et al. 2018, A&A, 619, A147
- Prieto-Lyon et al. (2022) Prieto-Lyon, G., Strait, V., Mason, C. A., et al. 2022, arXiv e-prints, arXiv:2211.12548
- Rasappu et al. (2016) Rasappu, N., Smit, R., Labbé, I., et al. 2016, MNRAS, 461, 3886
- Rigby et al. (2022) Rigby, J., Perrin, M., McElwain, M., et al. 2022, arXiv e-prints, arXiv:2207.05632
- Robertson et al. (2015) Robertson, B. E., Ellis, R. S., Furlanetto, S. R., & Dunlop, J. S. 2015, ApJ, 802, L19
- Robertson et al. (2013) Robertson, B. E., Furlanetto, S. R., Schneider, E., et al. 2013, ApJ, 768, 71
- Saldana-Lopez et al. (2022) Saldana-Lopez, A., Schaerer, D., Chisholm, J., et al. 2022, arXiv e-prints, arXiv:2211.01351
- Santos et al. (2020) Santos, S., Sobral, D., Matthee, J., et al. 2020, MNRAS, 493, 141
- Schaerer & de Barros (2009) Schaerer, D., & de Barros, S. 2009, A&A, 502, 423
- Shapley et al. (2016) Shapley, A. E., Steidel, C. C., Strom, A. L., et al. 2016, ApJ, 826, L24
- Shibuya et al. (2018) Shibuya, T., Ouchi, M., Harikane, Y., et al. 2018, PASJ, 70, S15
- Snapp-Kolas et al. (2022) Snapp-Kolas, C., Siana, B., Gburek, T., et al. 2022, arXiv e-prints, arXiv:2211.00041
- Stark et al. (2015) Stark, D. P., Walth, G., Charlot, S., et al. 2015, MNRAS, 454, 1393
- Stark et al. (2017) Stark, D. P., Ellis, R. S., Charlot, S., et al. 2017, MNRAS, 464, 469
- Stefanon et al. (2022) Stefanon, M., Bouwens, R. J., Illingworth, G. D., et al. 2022, ApJ, 935, 94
- Stefanon et al. (2021) Stefanon, M., Labbé, I., Oesch, P. A., et al. 2021, ApJS, 257, 68
- Steidel et al. (1996) Steidel, C. C., Giavalisco, M., Dickinson, M., & Adelberger, K. L. 1996, AJ, 112, 352
- Sun et al. (2022) Sun, F., Egami, E., Pirzkal, N., et al. 2022, arXiv e-prints, arXiv:2209.03374
- Taylor et al. (2021) Taylor, A. J., Cowie, L. L., Barger, A. J., Hu, E. M., & Songaila, A. 2021, ApJ, 914, 79
- Verhamme et al. (2015) Verhamme, A., Orlitová, I., Schaerer, D., & Hayes, M. 2015, A&A, 578, A7
- Verhamme et al. (2017) Verhamme, A., Orlitová, I., Schaerer, D., et al. 2017, A&A, 597, A13
- Wilkins et al. (2016) Wilkins, S. M., Feng, Y., Di-Matteo, T., et al. 2016, MNRAS, 458, L6
- Williams et al. (2021) Williams, C. C., Maseda, M., Tacchella, S., et al. 2021, UDF medium band survey: Using H-alpha emission to reconstruct Ly-alpha escape during the Epoch of Reionization, JWST Proposal. Cycle 1, ID. #1963, ,
- Wu et al. (2020) Wu, J., Jiang, L., & Ning, Y. 2020, ApJ, 891, 105
- Yajima et al. (2018) Yajima, H., Sugimura, K., & Hasegawa, K. 2018, MNRAS, 477, 5406
- Yang et al. (2017) Yang, H., Malhotra, S., Gronke, M., et al. 2017, ApJ, 844, 171
- Yung et al. (2020a) Yung, L. Y. A., Somerville, R. S., Finkelstein, S. L., et al. 2020a, MNRAS, 496, 4574
- Yung et al. (2020b) Yung, L. Y. A., Somerville, R. S., Popping, G., & Finkelstein, S. L. 2020b, MNRAS, 494, 1002
- Zheng et al. (2017) Zheng, Z.-Y., Wang, J., Rhoads, J., et al. 2017, ApJ, 842, L22