Biomedical Research and Innovation Institute of Cadiz (INiBICA) Hospital Universitario Puerta del Mar, Cádiz, Spain \sameaddress1,2 \sameaddress1,2 \sameaddress2\secondaddressDepartment of Pediatric Hematology and Oncology, Hospital de Jerez, Cádiz, Spain \sameaddress1,2 \runningauthorsThe edpsmath documentclass users guide Version 2
Mathematical modeling of leukemia chemotherapy in bone marrow
Abstract.
Acute Lymphoblastic Leukemia (ALL) accounts for the of leukemias when coming down to pediatric ages. Survival of these patients has increased by a considerable amount in recent years. However, around of treatments are unsuccessful. For this reason, it is definitely required to come up with new strategies to study and select which patients are at higher risk of relapse. Thus the importance to monitor the amount of leukemic cells to predict relapses in the first treatment phase.
In this work we develop a mathematical model describing the behavior of ALL, examining the evolution of a leukemic clone when treatment is applied. In the study of this model it can be observed how the risk of relapse is connected with the response in the first treatment phase. This model is able to simulate cell dynamics without treatment, representing a virtual patient bone marrow behavior. Furthermore, several parameters are related to treatment dynamics, therefore proposing a basis for future works regarding childhood ALL survival improvement.
Key words and phrases:
Mathematical model, Leukemia, Treatment, Cancer1991 Mathematics Subject Classification:
92-10, 34A12La leucémie aiguë lymphoblastique (LAL) représente des leucémies
diagnostiquées chez l’enfant. La survie de ces patients a considérablement
augmenté ces dernières années. Malgré cela, environ à des traitements échouent. Pour cette raison, il est crucial de réaliser de nouvelles stratégies d’étude
et de sélectionner les patients présentant le risque de rechute le plus élevé. D’où
l’importance de contrôler le nombre de cellules leucémiques pour prédire les
rechutes dans la première phase du traitement.
Dans ce travail, un modèle mathématique est développé qui décrit le comportement de la LAL, en étudiant l’évolution du clone leucémique lorsque le traitement est appliqué. Dans l’étude de ce modèle, nous pouvons observer comment le risque de rechute est lié à la réponse à la première phase du traitement. Ce modèle est capable de simuler la dynamique cellulaire sans traitement, représentant le comportement de la moelle osseuse d’un patient virtuel. De plus, les différents paramètres liés à la dynamique du traitement sont étudiés. Par conséquent, la base des travaux futurs visant à améliorer la survie de la LAL chez l´enfant est proposée.
Introduction
Leukemia is a malignant disease originating in the bone marrow. Particularly, it arises from a disruption in hematopoiesis, the process in charge of blood cells production [1, 2]. Hematopoiesis is usually depicted as hierarchical tree, in which a hematopoietic stem cell (HSC) can differentiate into other cells from the lymphoid or myeloid line. Depending on the branch, platelet, red blood cells and lymphocytes are produced. Leukemia is not only distinguished by the linage but also depending on the maturation stage of the cancer cells. Acute Lymphoblastic Leukemia (ALL) is caused by cells with fast growth in the lymphoid branch, with special incidence in pediatric patients [3, 4].
Each type and subtype of leukemia has an associated protocol that specifies the therapeutic recommendations, and that varies from country to country [5]. In particular, SEHOP-PETHEMA-2013 protocol is used in Spain to treat pediatric patients with ALL. This protocol was designed by Spanish Society of Pediatric Hematology and Oncology along with Spanish Hematology Treatment Program and it is regularly reviewed [6, 7].
There are different treatments and medications depending on the risk group assigned to a patient: standard, intermediate or high. In such protocols, patients go through successive phases: induction, consolidation, re-induction and maintenance. Each phase consists of the combination of chemotherapeutic agents and corticoids with varying schedules. As reflected in other works [8, 9], the progressive improvement and modification of these protocols has increased survival rates to around to . Nonetheless, to of patients fail to achieve long term remission and therefore relapse [10]. Apart from adding to and modifying these protocols, recent reviews have highlighted the need for new therapies and approaches that would tackle the disease differently [11, 12]. This also includes the improvement of risk assignment, the management of secondary effects and the study of personalized medicine, whose power lies not only in treatment but also in prevention [13].
In this sense, mathematical models have recently found a wide variety of applications in medicine [14, 15]. In particular, the discipline of mathematical oncology has been able to approach recent oncological issues [16, 17]. To understand cell dynamics, several works have described biological processes related to cellular behaviour [18, 19] and also related to hematopoiesis and lymphopoiesis [20, 21, 22]. This has allowed the mathematical characterization of the hierarchical structure of blood cell lineages [23, 24, 25, 26] and their development in bone marrow.
Specifically, ALL has been considered in previous mathematical models [27, 28, 29] with an structural vision of leukemic cells similar to that of healthy cells. In order to fulfill their potential, these models should be validated against appropriate treatment data [30, 31, 32].
Based on the current protocols to treat ALL patients [33, 34], some mathematical models describe the drugs’ effect regardless of the leukemia type [35, 36], while other focus explicitly on the myeloid linage [37, 38, 39]. Other mathematical models describe alternative strategies to chemotherapy, such as CAR T-cell therapy [40, 41, 42, 43], which is successful in patients that do not respond to the standard treatment.
Inspired by the examples above, we set out in this study to build a mathematical model that describes the evolution of ALL and its response to treatment in the bone marrow. This type of leukemia has received less attention from the mathematical community, and can benefit just as much. The mathematical model would allow the derivation of theoretical results (like stability analysis) but also clinical information like the relative importance of parameters, the estimation of response times or the influence of dosage and schedule. It could eventually be used to fit individual patient data and obtain insights into the possibility of personalized therapy for this disease [5, 28].
In this paper, we focus on the simulation of standard risk ALL pediatric patients in the first phase of the treatment, or induction phase, which lasts 28 days. In terms of drugs, this phase comprises the corticosteroid Prednisone, the chemotherapeutic agents Vincristine and Daunorubicine, and Asparaginase, each with their own dosages and infusion times. In addition, triple intrathecal is given to prevent central nervous system disease involvement. The modelling of this treatment stage requires an analysis of the bone marrow environment in addition to the assumptions related to the growth of leukemic cells. We study this scenario and simulate how treatment affects both leukemia and the lymphoid linage in bone marrow. Besides, we propose a classification of the patients depending on their leukemic cells development to predict which patients will respond to treatment correctly.
The work has been organised as follows: In Sec. 1 we describe an existing healthy lymphopoiesis mathematical model and extend it to include leukemia. This extended model will also include treatment administration. In Sec. 2 we show model simulations of leukemia growth and its evolution under therapy, obtaining realistic ranges for parameters and highlighting the most relevant ones in terms of response. In Sec. 3 we discuss the results obtained.
1. Material and methods
In this section we describe a mathematical model of healthy, homeostatic lymphopoiesis in the bone marrow. We then include the appearance of a leukemic cell and study its evolution. We finally approximate a treatment function following the current treatment scheme during induction phase and model its effect in the previous models. An overview of all such models is shown in Figure 1.
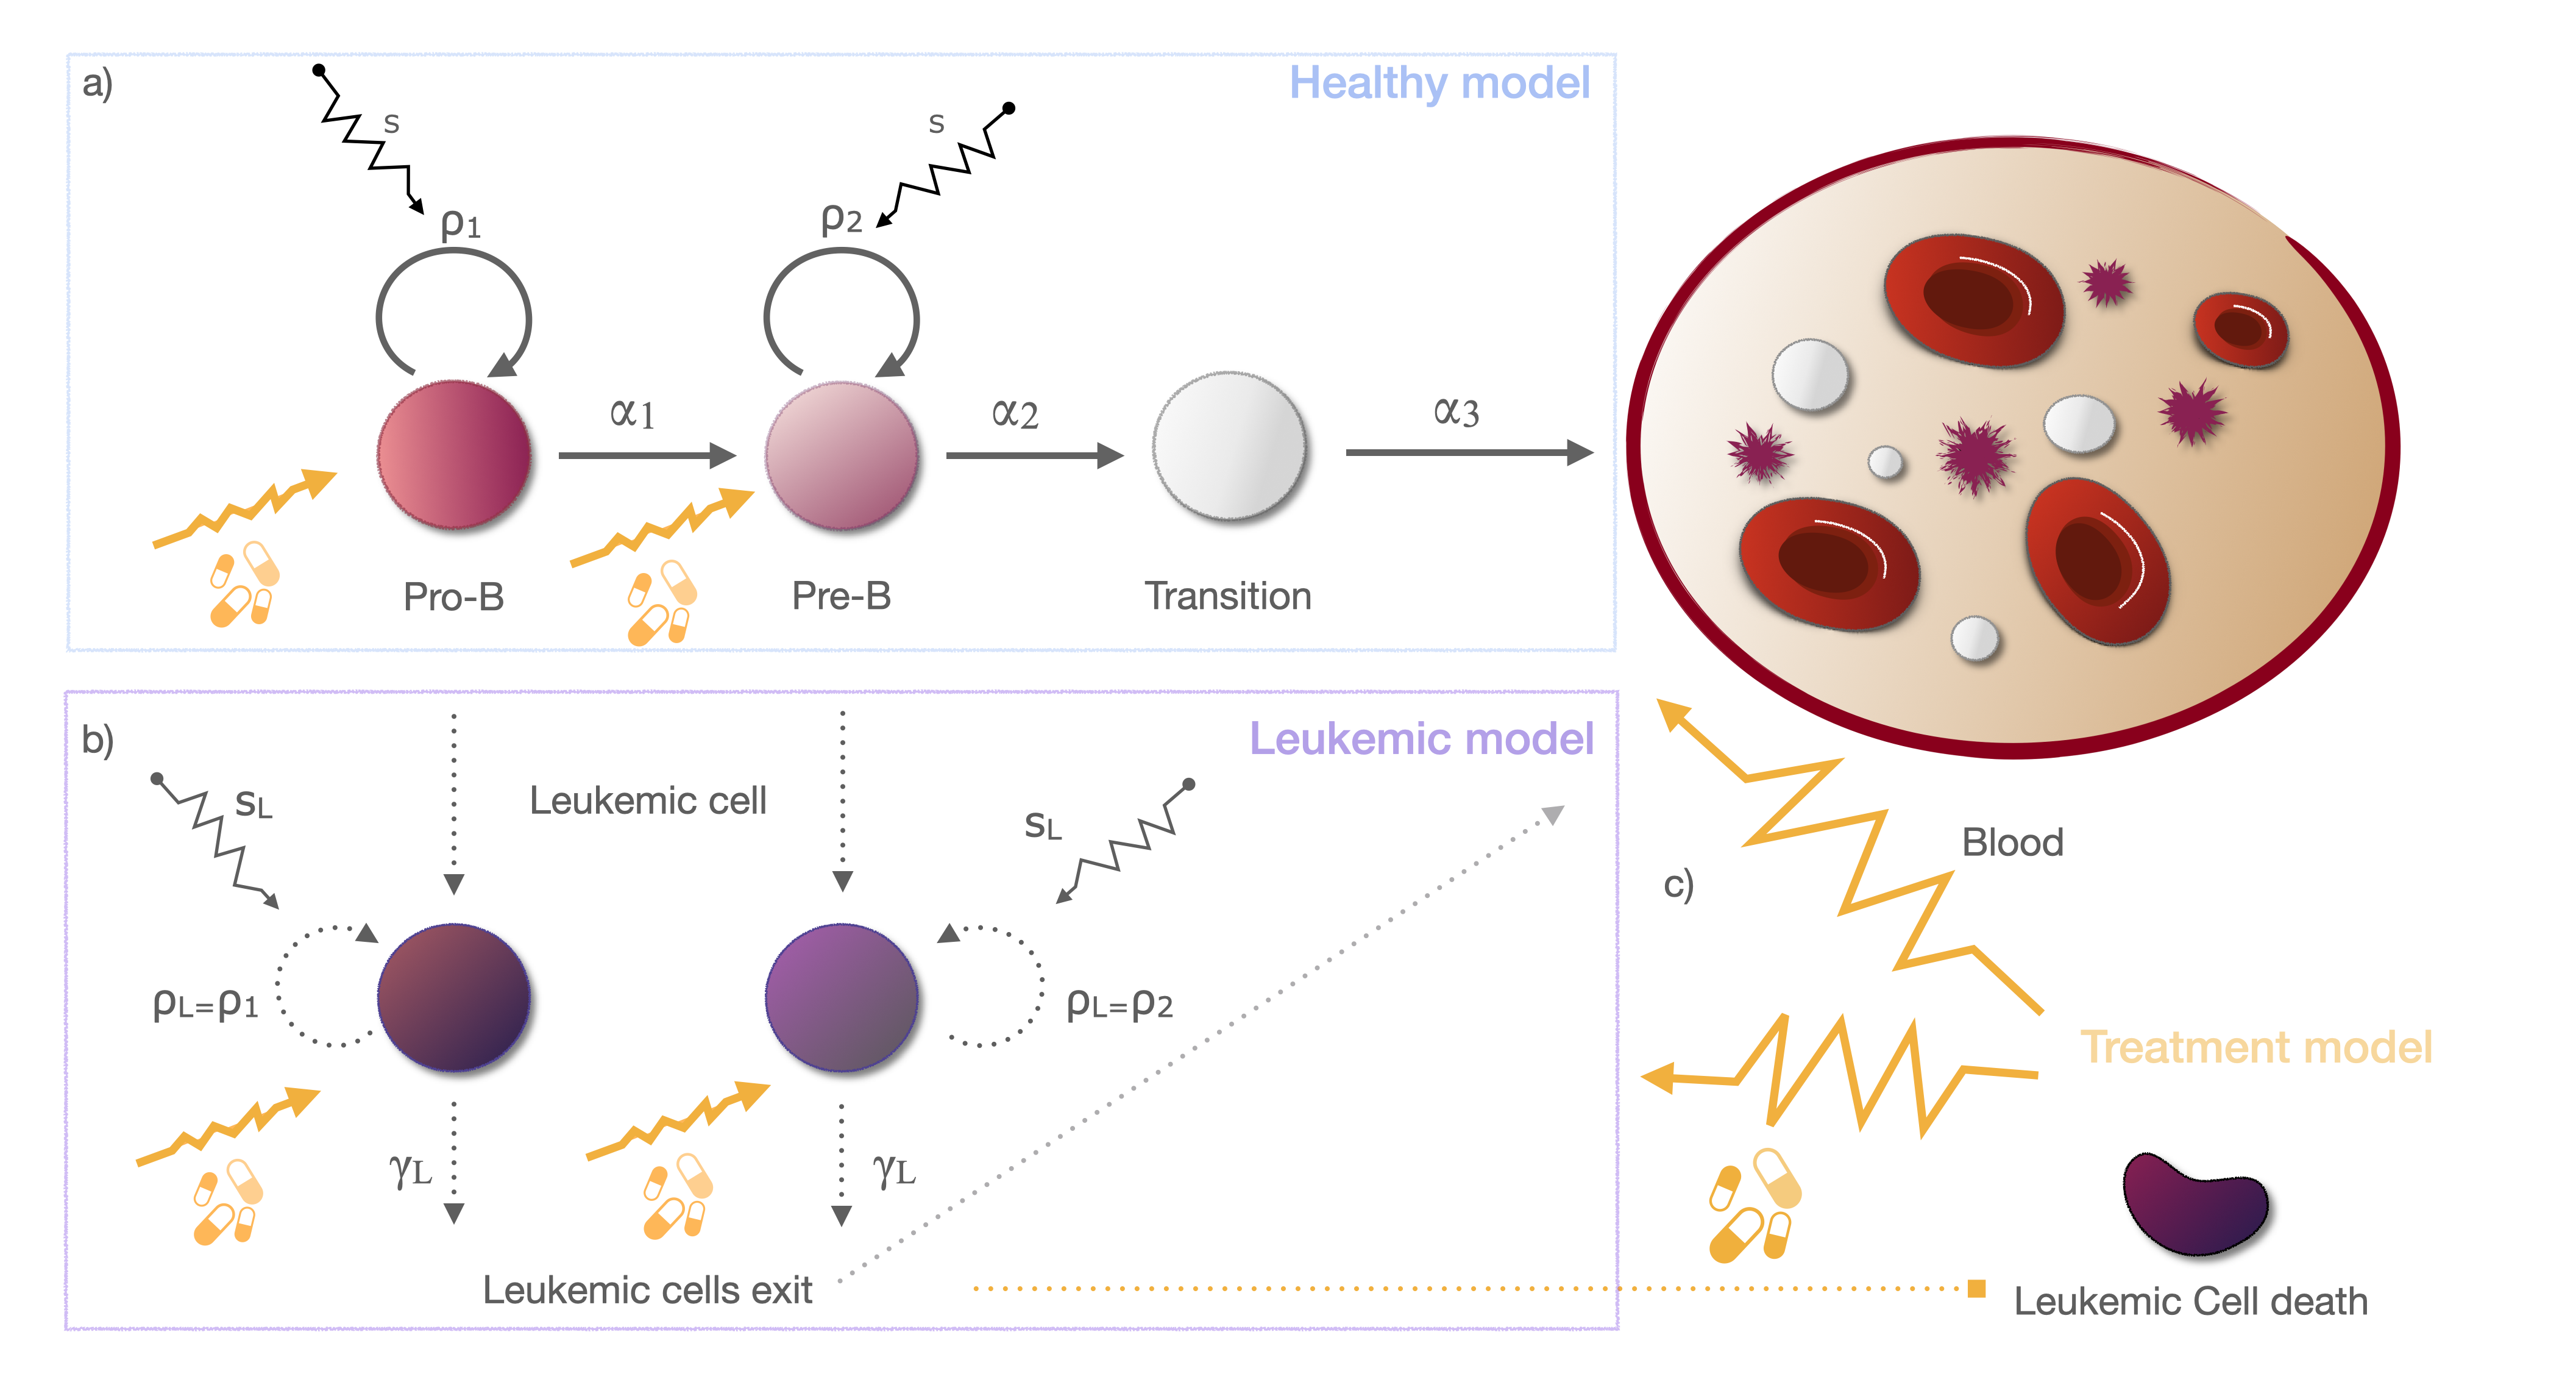
1.1. Healthy bone marrow model
Following the immunophenotypical characterization of B cells [21], previous mathematical models, have considered B lymphopoiesis as a sequential process dividing their maturation stages in Pro-B (early stage characterized by immunophenotypic markers CD10+/CD45-), Pre-B (intermediate stage with CD10+/CD45+) and Transition cells (last stage with CD10-/CD45+) [25, 27]. Mathematically, this can be regarded as three compartments respectively depending on each stage: , and , along with their associated parameters related to proliferation and differentiation. This was translated in [26] into the compartmental model presented below:
| (1a) | ||||
| (1b) | ||||
| (1c) | ||||
where , for , is the proliferation rate and , , is the transition rate related to each compartment .
In this model the authors also took into account a signal in charge of regulating cell dynamics, , with the following expression:
| (2) |
where is the inhibitory parameter and the cells subpopulation in charge of the feedback signalling. According to the results in [26], we consider here . This signalling was shown to affect predominately the proliferation rate due to biological reasons such as bounded growth or mathematical ones such as positivity of the solutions. Having reviewed this model, we expand it by including the appearance of a leukemic clone.
1.2. Modeling leukemia cells
Now, in addition to the three compartments , we consider a leukemic cells compartment, . We assume that leukemic cells grow as a logistic function where the curve’s maximum value is and is the logistic growth rate. Just like cells in a healthy hematopoiesis, a leukemic clone is characterized by a maturation stage [23, 27]. Therefore, we assume to depend on the stage where the leukemic clone originates, i.e., from the Pro-B stage () or from Pre-B stage (). Finally, would denote the blood exit rate of leukemic cells. Here we do not consider clones coming from the transition stage due to the fact that ALL is produced by immature, proliferating cells.
We consider then the following equation to define the flux in the leukemic cells compartment:
| (3) |
Finally, signalling in this compartment has a similar behavior to the healthy bone marrow compartments as in [26], and we assume it to affect the proliferation rate as in Model (1). Therefore,
| (4) |
assuming leukemic cells should not be affected by their own signalling due to the evasion of growth suppressors [44]. Nevertheless, healthy stages are influenced by cells in compartment , due to the fact that the more cells in , the less healthy cells develop due to the invasion of the bone marrow. Consequently, healthy signalling in Model (1) should be modified to:
| (5) |
In addition to these assumptions, we can also include a constant influx of healthy stem cells in our initial compartment [40], which results in the following model, including both leukemic and healthy B cells:
1.3. Modeling treatment for leukemia
As explained previously, there are different treatment protocols that can be applied [28], depending on the drugs used, their doses, or even the time of infusion. We consider the Induction I’A phase, as described by the SEHOP- PETHEMA-2013 protocol, for a standard risk patient. This phase consists of four drugs and lasts 37 days. Triple intrathecal is not included in the study since it does not affect the lymphoid branch. Each drug has a schedule with corresponding doses and days of administration, depending on the patient’s body surface, as indicated in Figure 2.
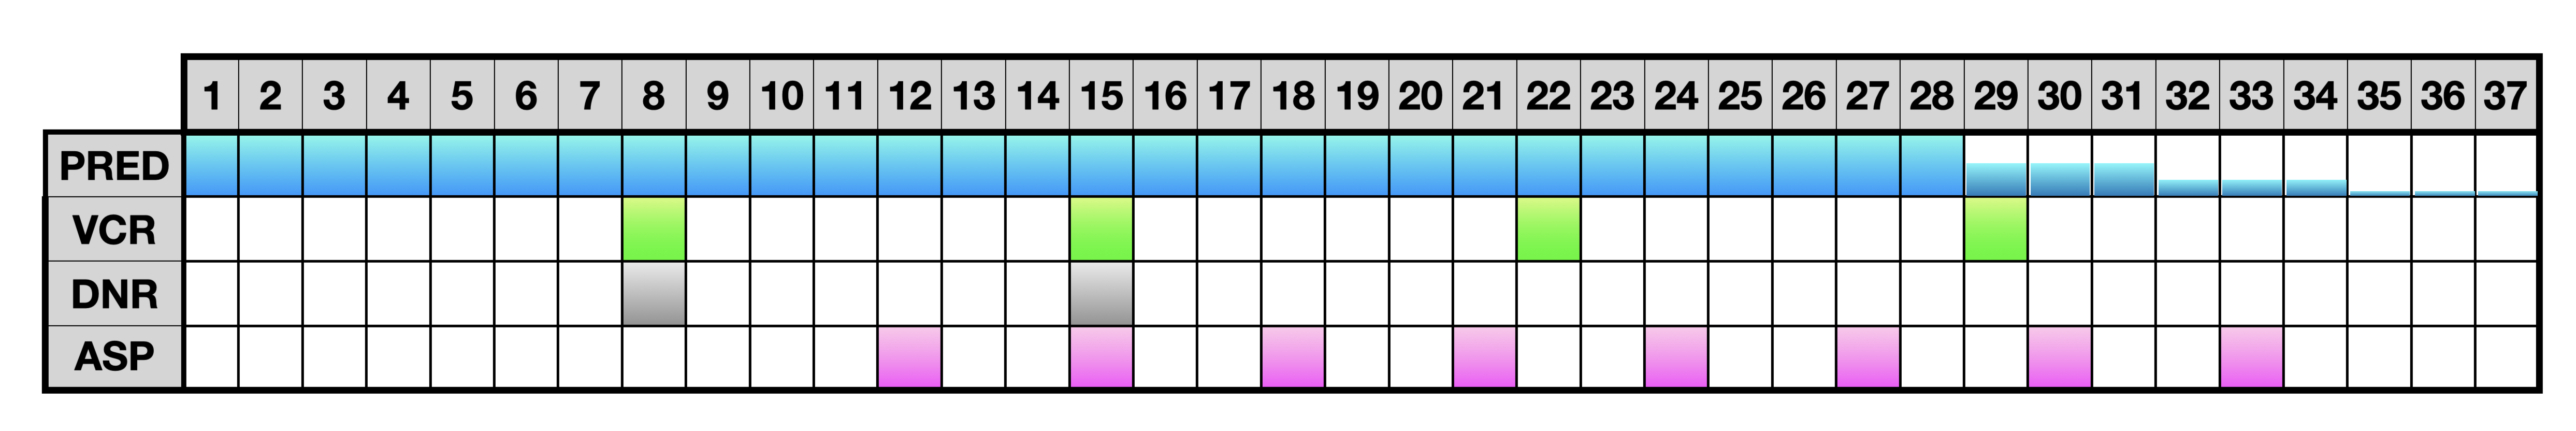
To simplify, we consider treatment days as a scale which corresponds leukemia detection day with day and treatment beginning with day . The most important days for monitoring the patient are treatment days , and . In those days, bone marrow sample extractions are carried out and lymphocyte levels are studied. In day a blood extraction is done to assess response to prednisone. According to SEHOP-PETHEMA-2013 protocol, there must be less than leukemic cells per milliliters of blood in day . The Minimal Residual Disease (MRD) is studied in bone marrow, whose positivity is defined by the presence of or more leukemic cells in bone marrow [46]. Therefore, patient responds to the treatment if leukemic cells involve at most in bone marrow in day , and there are no blasts in day .
Following studies on the behaviour of each drug [47, 48, 49, 50, 51], we consider the treatment as a function that describes the amount of drug in the bone marrow at time , being : Prednisone , Vincristine , Daunorubicin and Asparaginase . Once the dose is administered, the drug has an exponential decrease associated with that medicine half-life.
We then define as
| (7) |
with related to each drug half-life measured in days:
| (8) |
Each drug has a different dose in several days , as shown in Figure 2. We define the dose administered as:
| (9) |
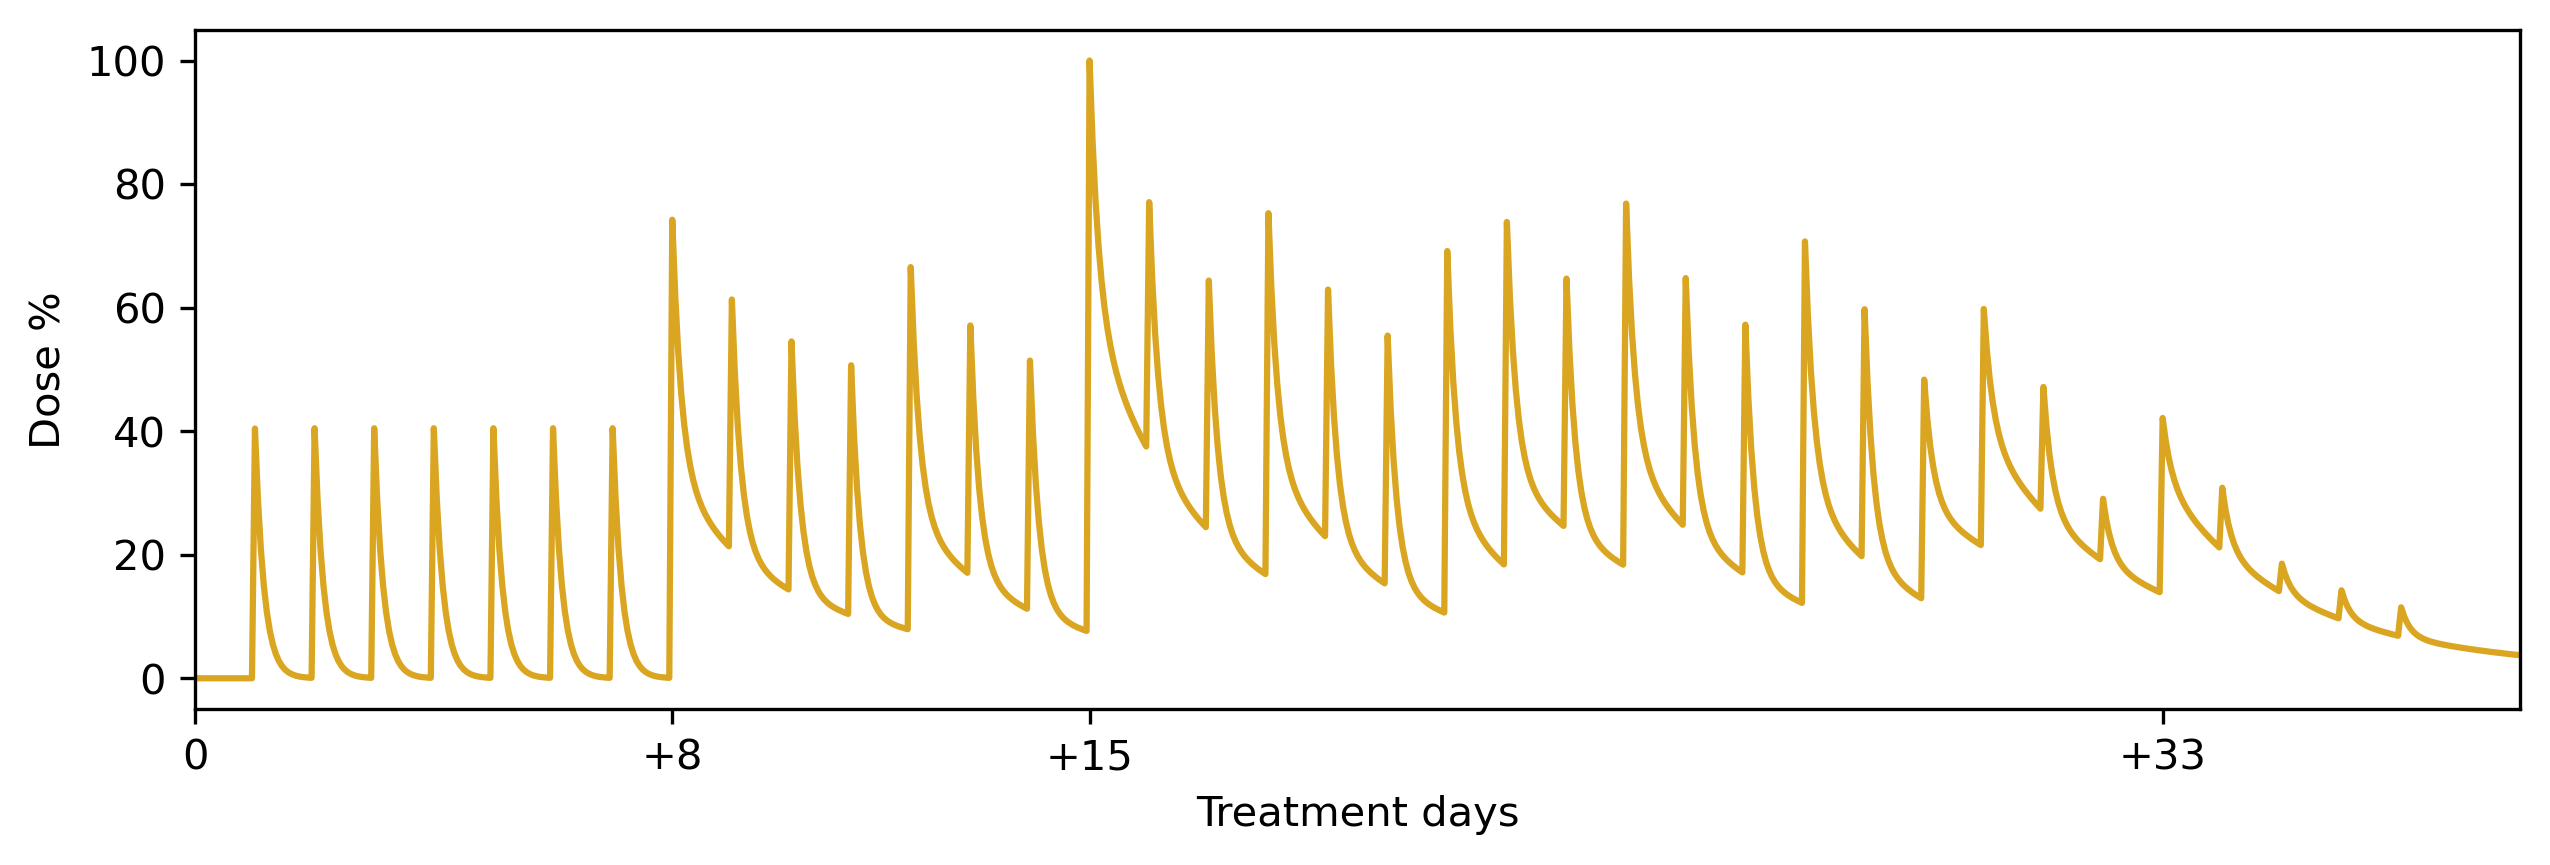
We finally consider the total treatment function , represented in Figure 3, as the weighted sum of all drugs:
| (10) |
where indicates the influence of drug on the total effect of the treatment.
Finally, we include a term in Model (6) that indicates cellular death by chemotherapy. We consider this does not affect transition cells, owing to the fact that they do not have any associated proliferation. The resulting model is shown below (11).
| (11a) | ||||
| (11b) | ||||
| (11c) | ||||
| (11d) | ||||
| (11e) | ||||
| (11f) | ||||
| (11g) | ||||
1.4. Parameters estimation
We consider literature data for healthy bone marrow properties [26] along with parameters related to leukemia [40]. Drugs half lives are taken from pharmacokinetics and pharmacodynamics studies. All parameter values are included in Table 1. The estimations for dosage assume a body mass for a child, which in turn implies a body surface area equivalent to [52].
Parameter Meaning Value Unit Source Influx cells from HSC Estimated from [40] Pro-B proliferation rate [26] Pre-B proliferation rate [26] Transition rate: Pro-B to Pre-B [26] Transition rate: Pre-B to Transition [26] Blood exit rate [26] Signal Intensity [40] Leukemic cells blood exit rate [40] Leukemic cells carrying capacity [40] Prednisone dose SEHOP-PETHEMA-2013 Vincristine dose SEHOP-PETHEMA-2013 Daunorubicin dose SEHOP-PETHEMA-2013 Asparaginase dose SEHOP-PETHEMA-2013 Prednisone influence Estimated Vincristine influence Estimated Daunorubicin influence Estimated Asparaginase influence Estimated Prednisone decaying rate [47] Vincristine decaying rate [48] Daunorubicin decaying rate [49] Asparaginase decaying rate [50] Pro-B cells [26] Pre-B cells [26] Transition cells [26] Leukemic cells Assumption
The study of all estimated parameters is presented in Supplementary Information document. Control parameters related to drug, with , have been selected by searching for values that implies that the patient responds to treatment correctly, i.e. considering an amount of blasts less than in blood in day and MRD in bone marrow in day [53]. In preliminary simulations we find that if , the dose administered is ineffective. We further consider that involves the death of the patient due to drug toxicity. We then set all to the same order of magnitude , . In this way we ensure Model (11) can represent a virtual patient whose behavior is similar to real patients according to the amount of cells in each bone marrow aspiration.
2. Results
2.1. Leukemic and healthy cells dynamics without treatment are properly represented by the model.
We now consider no treatment is applied, Model (6), i.e., Model (11) with , . This model combines the healthy dynamics of immature B-cells and how leukemic cells stability values as initial inputs for the model. We simulate the appearance of a leukemic cell (at ), depending on the leukemic clone originates, either in a Pro-B or a Pre-B stage . Results of solving in a range to days are shown in Figure 4, displaying the range of days with more information in each case.
We next show the simulations for each case. Figure 4 represents Model (6) cells evolution when is considered for the first case, and secondly, model for is simulated. In addition, for each time measured in days, the bone marrow cells proportions are shown for the different maturation compartments.
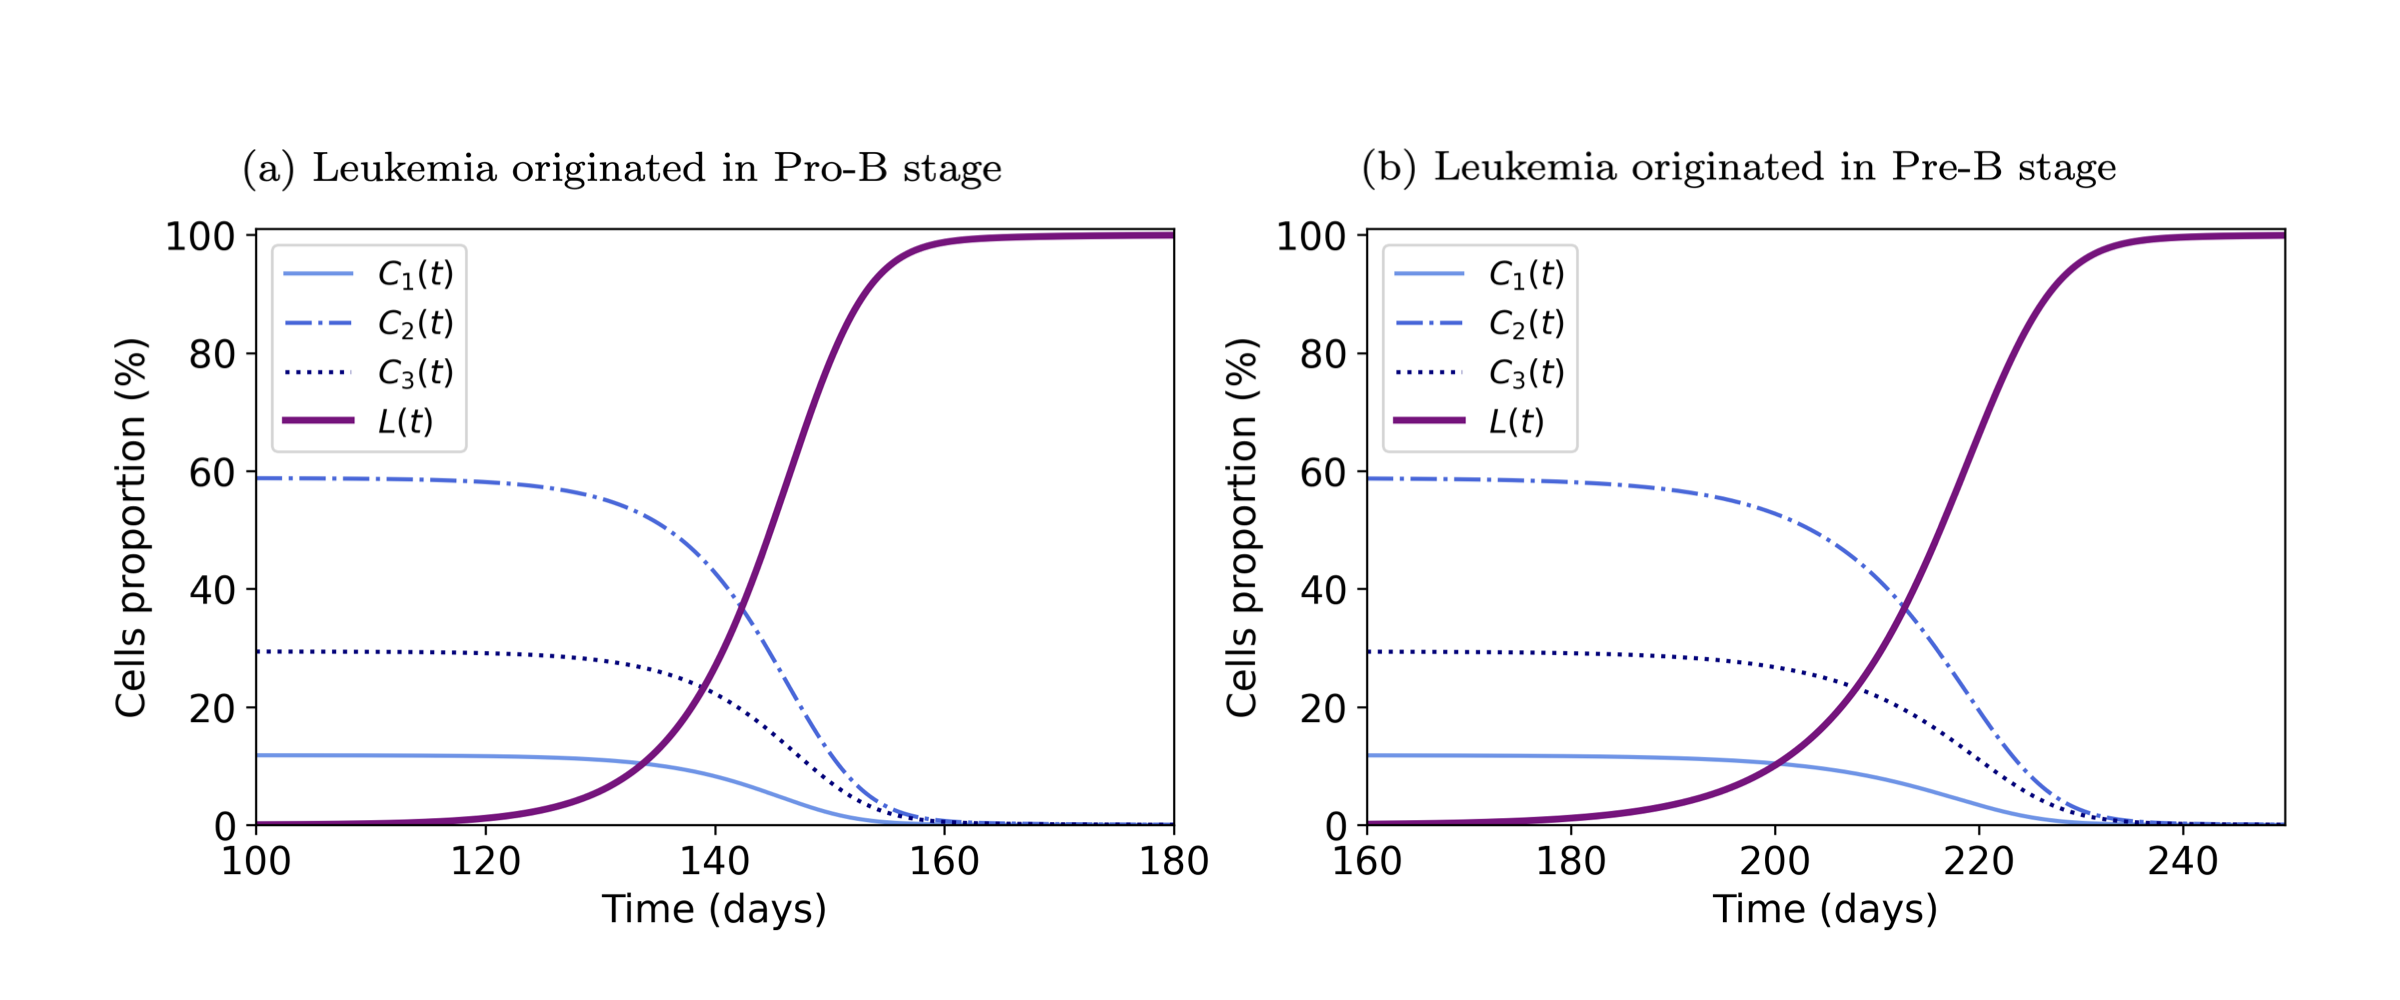
As it can be observed in Figure 4, both graphics represent the total bone marrow invasion by leukemia. Depending on the stage from which the first leukemic cell comes, leukemic cells proliferate more or less quickly. The appearance of a leukemic clone is set to be detected when the leukemic population accounts for of blasts from the total population of B lymphocytes, [54]. When the first leukemic cell is originated in Pro-B stage, , the disease is detected around day . However, if the original leukemic cell comes from the Pre-B stage, leukemia is appreciated from day . Both two cases imply a progressive decreasing in healthy cells due to the fact that the invasive ability of leukemic cells prevents the normal development of cells in the bone marrow.
2.2. The first blood extraction in day of treatment allows to approximate the influence of prednisone ().
Treatment begins according to treatment schedule in SEHOP-PETHEMA-2013 protocol, after of blasts are detected, producing a drop in both leukemic and healthy cells.
In order to find the optimal parameters to represent Model (11), we pay attention to the first blood extraction (day ). To do so, we estimate relations between blasts in bone marrow and blood, owing to the fact that there is a correlation between them [55, 56].
SEHOP-PETHEMA-2013 protocol defines a good response to prednisone if there is fewer than blasts per milliliter of blood. We assume a pediatric patient with body mass, and due to the blood - body mass correlation [57, 58], this assumption entails approximately liters of blood. We consider a patient with of blood to our study, and consequently, patients should have less than blasts in blood. It implies that leukemic cells limit in the bone marrow should be less than blasts at day to obtain a good response to prednisone. We analyze all possible values within our range in Table 1, taking into account leukemic cells evolution for the first eight days of treatment (see Figure 5).
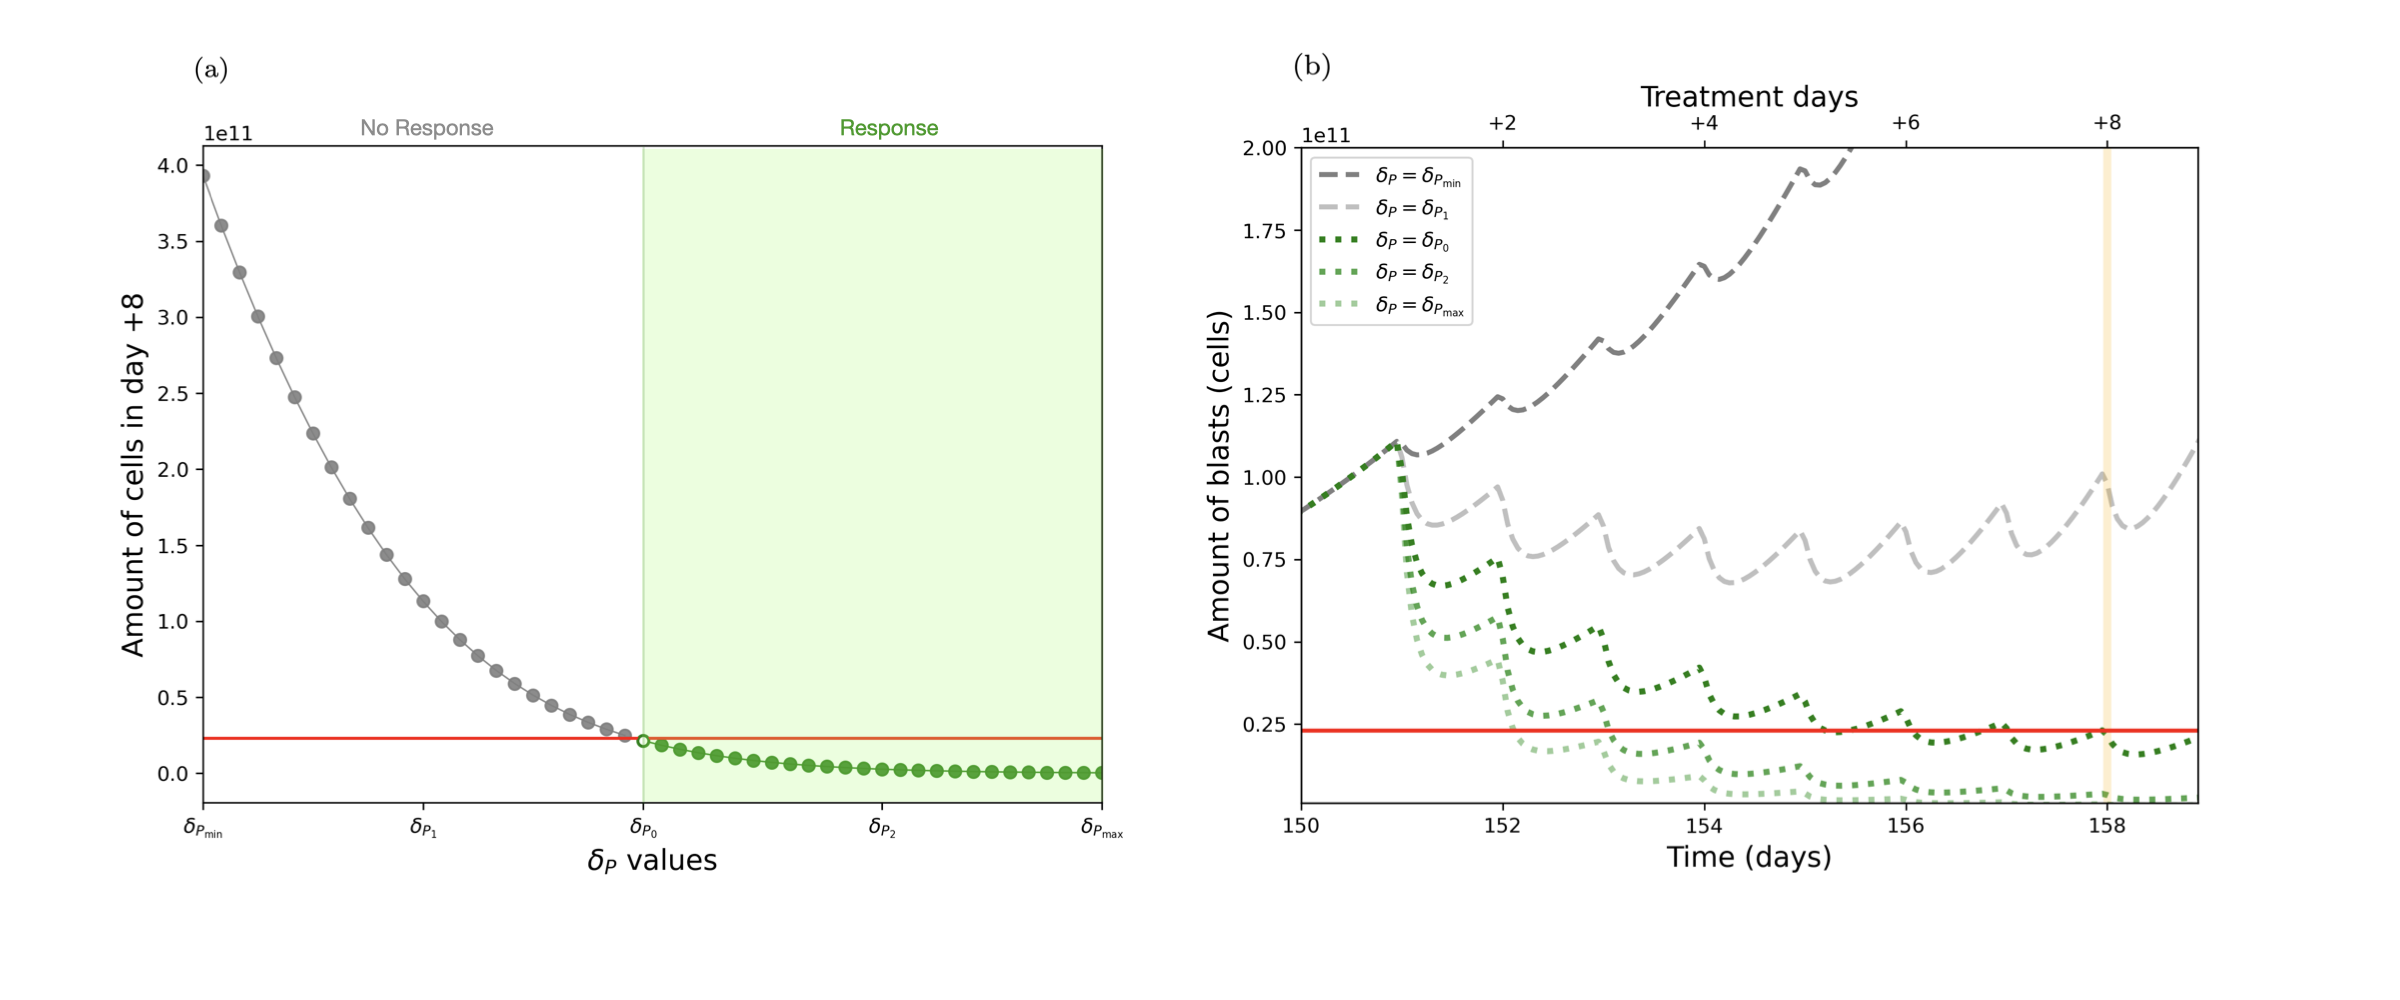
As it is shown in Figure 5 (a), the amount of blasts in bone marrow in day of treatment implies a direct consequence related to possible values.
Values lower than imply that patients do not response to prednisone, while values higher than entail a good prognosis for the patient due to the fact that in day of treatment reach less than the limit of blasts assumed.
2.3. Prednisone and Vincristine influence values analysis implies a classification of patients
Let us how consider all parameters in order to analyze their behaviour in Model (11), taking into account the number of blasts in bone marrow at day .
Based on the parameter sensitivity analysis (Supplementary Information), main influential parameter is . To study their influence, we vary parameters and , related, respectively, to prednisone and vincristine, and check how many leukemic cells are there day of treatment schedule in comparison to the healthy population (MRD). We fix parameters and given their minimal influence in the sensitivity analysis.
We focus on the variation of values in comparison with values to obtain the minimal value which implies the patient responds to treatment. We assume patient responds to treatment correctly if day of treatment leukemic cells represent less than of the whole lymphocyte population.
Values ranges considered for , are those in Table 1. In Supplementary Information, we show a heat map which takes parameters in the widest range. That range of parameter for such heat map has been adapted to a more meaningful range. We show in Figure 6 a heat map which connects parameters variation with the blasts percentage in day .
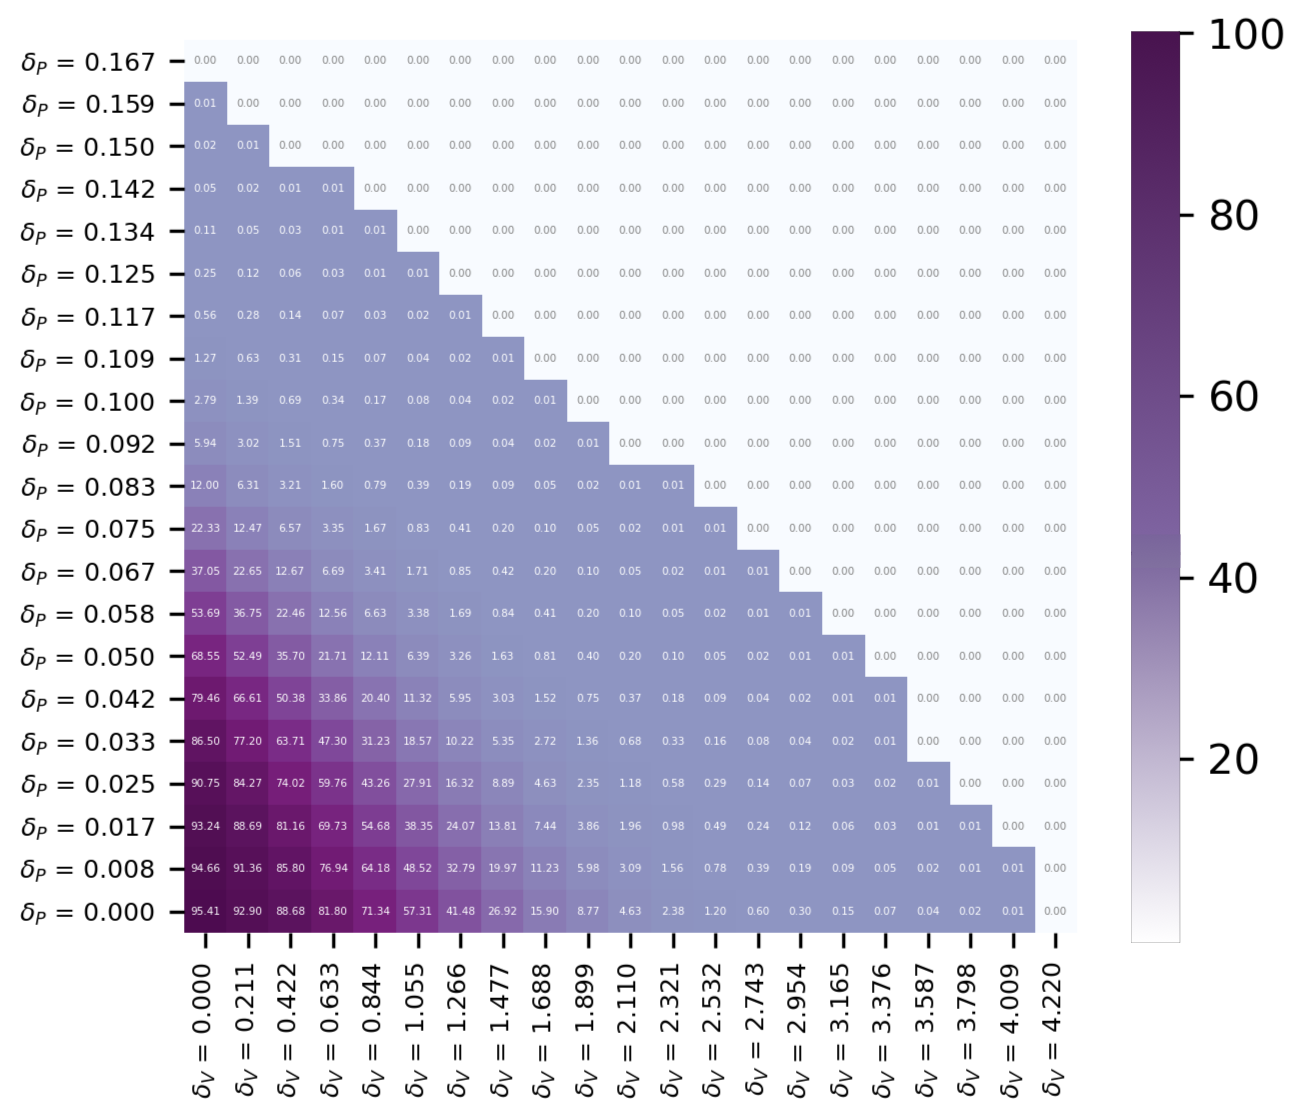
This heat map leads to associate all values with two semiplanes which will be able to predict if the patient responds correctly depending on the values which match his data.
Regarding Figure 6, we can approximate the influence of each drug in a patient and predict if the patient responds to the treatment correctly or not. Firstly, parameters related to the influence of drugs in cells death, , can be approximated for a set of data from a specific patient in several days of evolution of the treatment. Thus, we classify these parameters according to Figure 6 in purple or white zone to predict which percentage of leukemic cells will be there in bone marrow day . There will be a good prognosis if leukemic compartment entails less than (MDR) in bone marrow, white zone, while if those values are in the purple zone, the patient will not respond correctly to treatment.
According to choose the minimal values which implies a good prognosis of the patient, and will be parameters used in the next results.
2.4. A new model about bone marrow behavior in presence of treatment is proposed to study.
After proposing Model (11), we simulate the situation using data in Table 1 along with parameters associated to the values study in previous sections. As proposed in Sec. 1.2 it is possible to observe that leukemic cells have a higher proliferation than the rest of lymphocytes. Moreover, as said before, it is known that the blasts level in bone marrow when leukemia is detected is around . We assume that treatment starts the next day and present results in Figure 7.
Therefore, according to the available data about different patients, we have been able to approximate the evolution of bone marrow cells in the presence of treatment as it is shown in Figure 7. It can be observed that the treatment affects both healthy and leukemic cells and that once the disease is eliminated, healthy cells compartments return to normal levels.
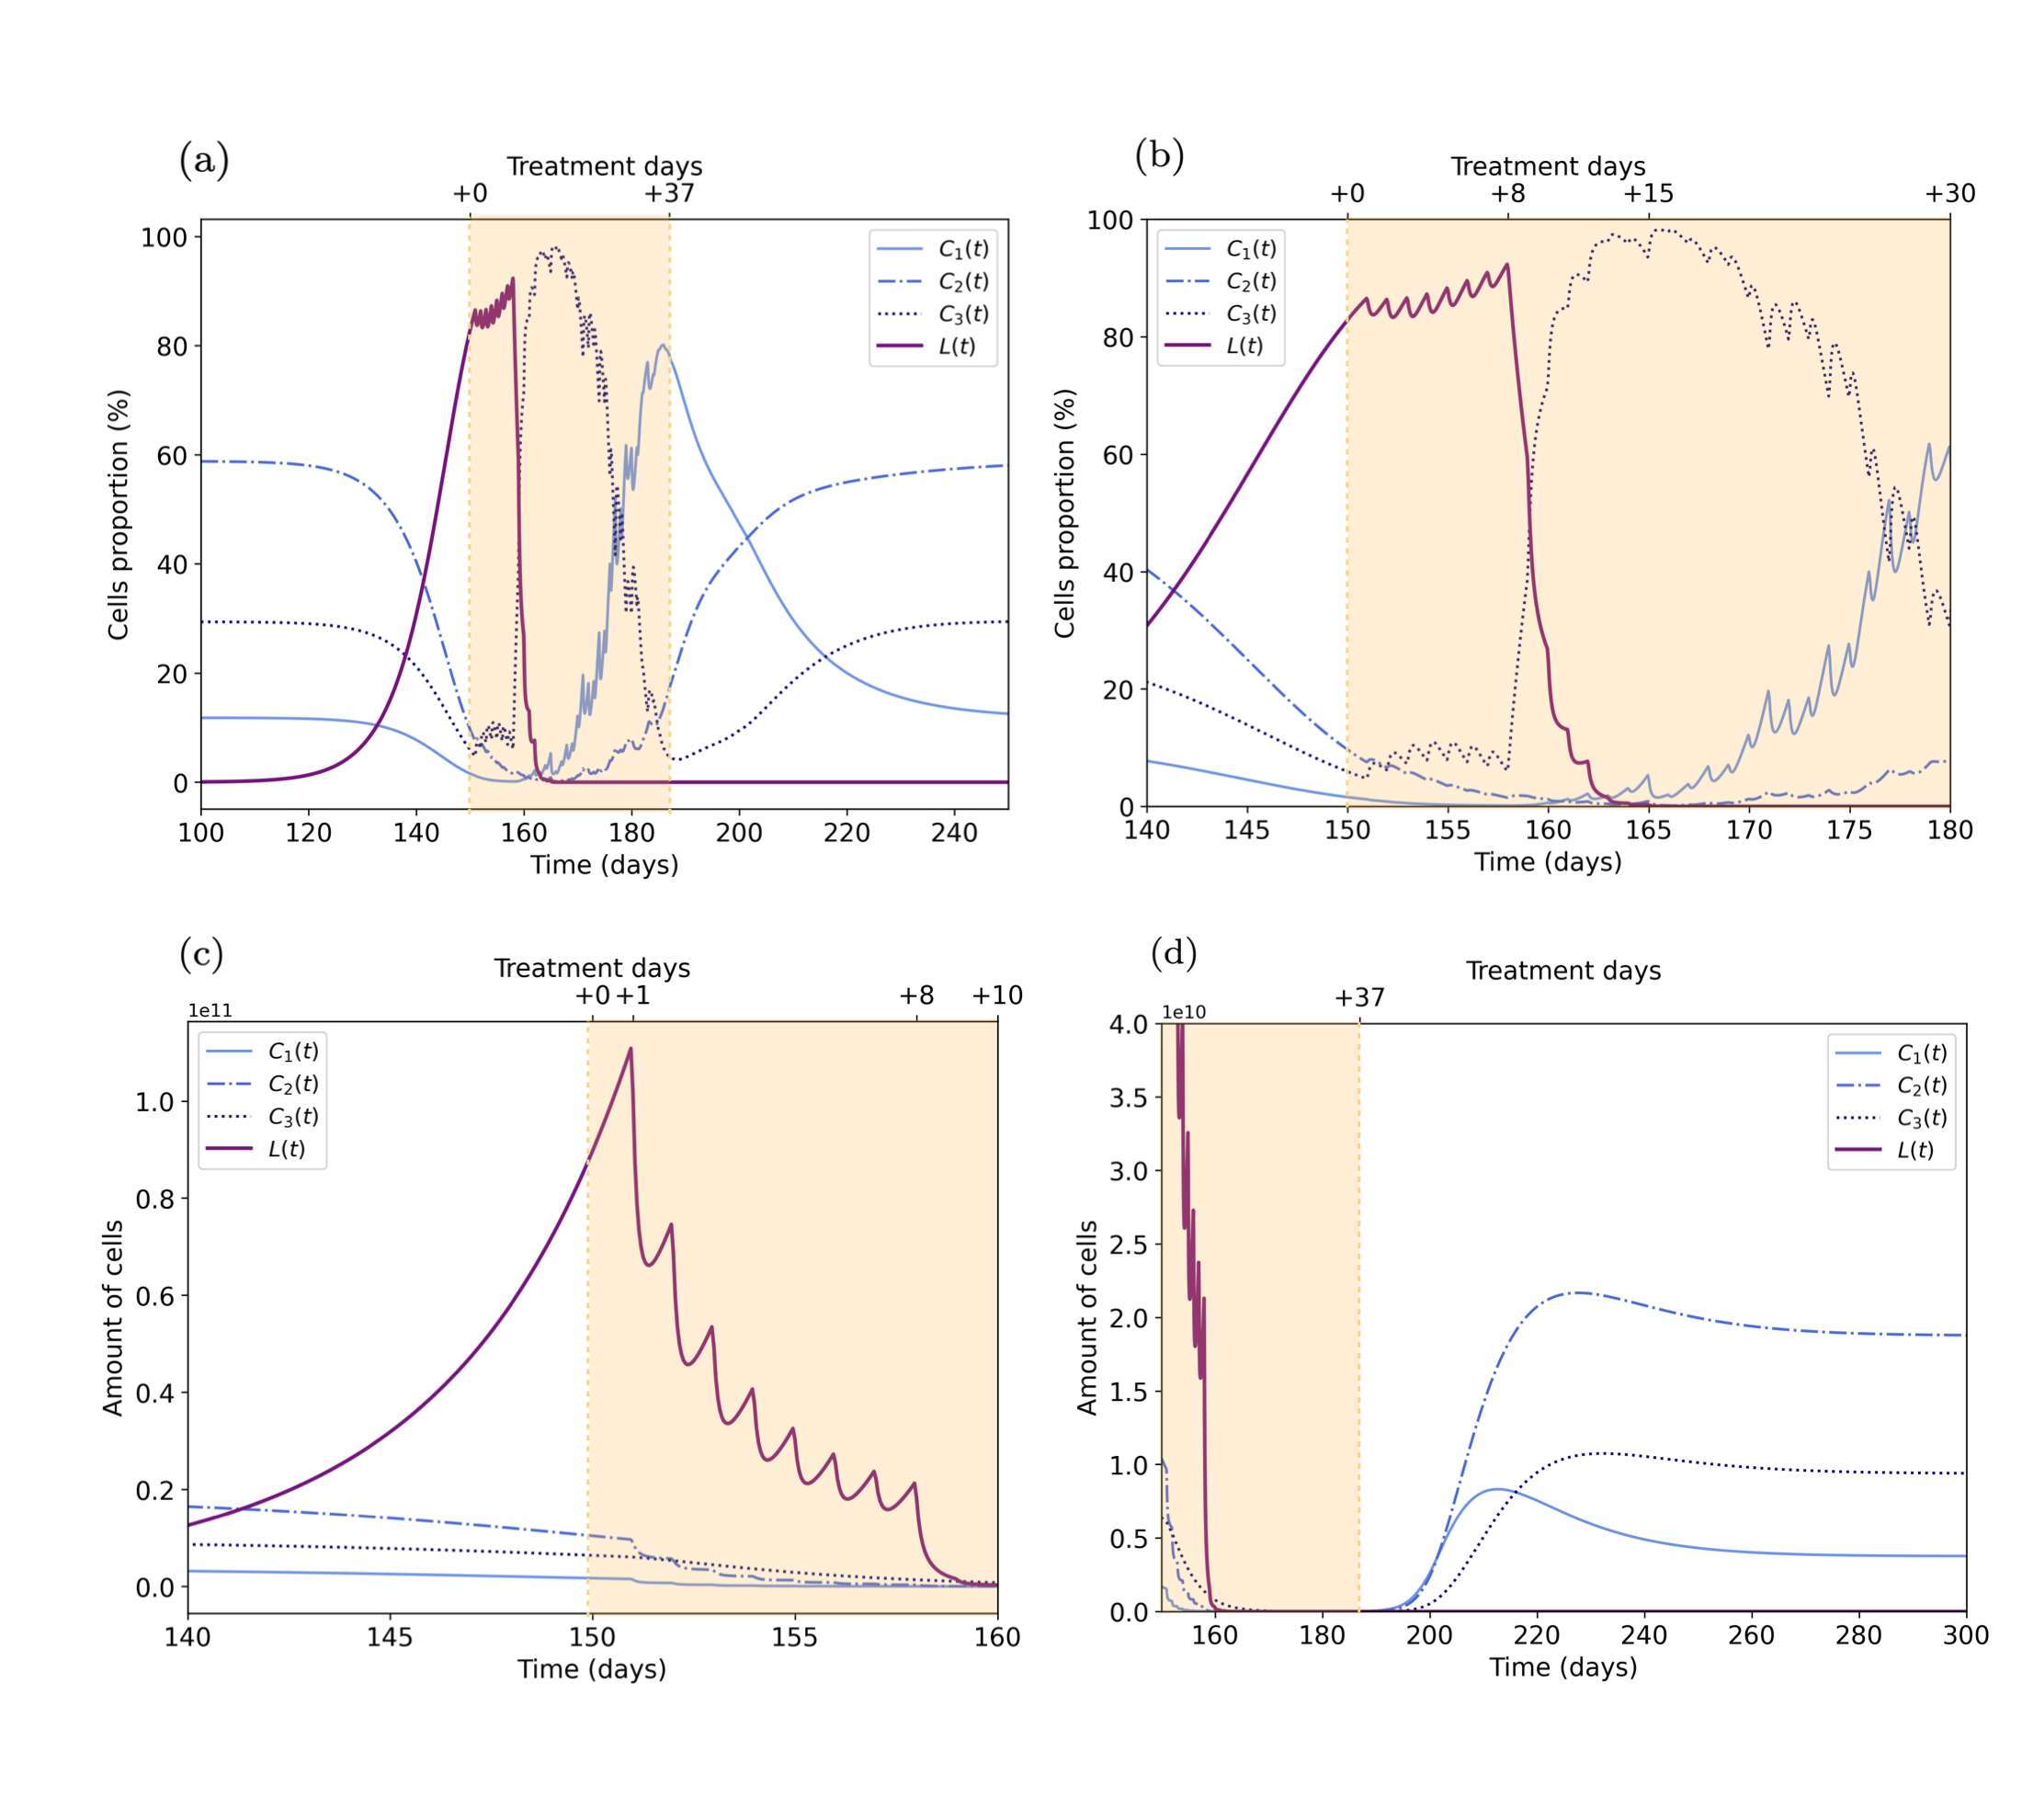
Generally, in Figure 7, a leukemic bone marrow with treatment is represented. From usual cells compartments proportions, leukemia develops until leukemic cells exceed of total occupancy in bone marrow. From those conditions, the therapy is applied for days, and then, bone marrow normal levels are recovered. In a reduced range of days (Figure 7(b)) it can be appreciated how cells proportions are modified according to drugs administered each day. In fact, day is the first aggressive day in which leukemic cells do not grow so fast, therefore, in following days this population continues its reduction. It is for that reason that the highest cells proportion in bone marrow for about days of treatment is the transition compartment, , which are not influenced by treatment since they do not proliferate. Paying attention to the amount of cells (Figure 7(c)-(d)), it is possible to verify that all of the cells in bone marrow decrease gradually and finally, return to normal levels.
3. Discussion
Leukemia is the cancer with the highest incidence in pediatric age, particularly, Acute Lymphoblastic Leukemia and of these diagnoses do not respond correctly to treatment, and as a consequence, there is a relapse. This problem is the main reason of our study and the principal question to answer is why the treatment does not work for those patients. Our intention is to find patterns in bone marrow along with medicines applied, so that, it is possible to predict relapses and improve current treatments. We approximate treatment influence in cell death to analyze the behavior of each bone marrow based on flow cytometry data throughout treatment time.
Modeling current treatment in leukemia B leads to advances towards optimizing the application of medicines. After studying leukemic cells behavior it is possible to analyze and advance in this area. Available clinical data are important to determinate parameters values according to different bone marrow samples from the same patient.
First of all, we have reviewed a healthy bone marrow model in Sec. 1.1. That study allows us to include the assumption of the appearance of a leukemic cell. It is found that leukemic cells have a strong development due to their properties of malignant disease. The leukemic cell develops as it has been described in Model (6), and it could be more or less accelerated depending on the inherited proliferation rate for , as shown in Figure 4. In fact, available data [30, 54] of hematologic patients reinforce that the disease is diagnosed when there are about leukemic cells in bone marrow. As it is mentioned in Sec. 2.1, six steady states are obtained by studying Model (6). The unique stable steady state is the one that represents the total occupancy of the bone marrow by leukemic cells. The rest of solutions are unstable. There are several possible explanations for this result. On one hand, both two solutions which have negative compartments, are biologically senseless results. In spite of the fact that there are two more solutions which are non negative, they lack biological meaning. Moreover, there is a solution which reproduces healthy bone marrow behavior without leukemia, Sec. 1.1. Therefore, Model (6) replicates reality and its study allows to adjust parameters related to leukemic population growth.
In the case in which leukemia appears in the Pro-B stage, for Model (6), the amount of leukemic cells is the same as Pro-B cells around 127 days; it is equal to Transition cells in the day 132; and Pre-B cells are reached by leukemic cells in 135 days.
Simulations for model which assume the appearance of the leukemic cell in Pre-B stage, , have a similar behavior, but the process is slower.
In general, both cases have the same behavior. Every simulation in the presence of the leukemic clone allow for deducing that healthy and leukemic cells coexist for a period of time which depends on the case, and then, leukemic cells take up all the bone marrow capacity, therefore, there is no space for healthy cells.
According to the Model (6) and its simulations, it is important to take into account that cells development is supposed without any treatment which is responsible for reducing the leukemic cells proportion. Hence, it explains why there are that suddenly changes three months later.
From the information collected in the SEHOP-PETHEMA-2013 protocol, we model the treatment behavior in the bone marrow when it is administered. Without loss of generality, we consider a leukemic cell originated in Pro-B compartment. From the first leukemic cell appearance, the proliferation of that population takes about 150 days to be diagnosed with the result that when it is detected, the disease reproduces more quickly. That is why treatment begins to be administered in the following days, thus, there are no data related to the same patient in different times without treatment. We have focused on a standard risk patient in Induction I’A which is the first phase of the treatment and it is a determining phase in the therapy. If there are signs which do not correspond to proper treatment response, the protocol for this patient is modified and associated to other risk level. Therefore, we consider a therapy based on Prednisone, Vincristine, Daunorubicine and Asparaginase, administered according to the schedule shown in Figure 2. Taking into account the total amount of drugs in the body during the treatment, we assume an exponential decay of each drug from its application in order to different references about timing and dosage drugs effects [28, 59, 60]. In addition, we include the term as the influence of each drug in cells death, to obtain the function which imply leukemic and healthy cells death by treatment depending on their proliferation.
When a sample from a patient is studied as a possible diagnosis of ALL is owing to the patient has previously developed some of the hallmarks of cancer [44]. Generally, bone marrow first extractions indicate that leukemia takes up around of bone marrow. Therefore, protocol is immediately activated. That treatment approximation implies an improvement about the perception related to drugs actions in the body. Depending on each patient, the influence of each drug will be more or less aggressive, hence, the importance of the personalized medicine [13]. It is for that reason that a detailed study about drugs influences must be contemplated to study those behaviors. The aim is to provide each new patient with the best treatment. A patient is considered with good prognosis if some conditions are reached. On the treatment day , blood sample should show less than blasts per milliliters of blood, on the day , leukemic cells must entail values smaller than and the day blasts in bone marrow must not be observed, considering that this is the moment of the transplant.
A theoretical model of the bone marrow dynamics, Model (11), is presented to study, based on previous works along with new assumptions about leukemic cells behaviour and treatment.
In order to study parameters related to prednisone, we have focused on the first eight days of treatment. In those days only prednisone is administered, therefore, it is possible to approximate optimal value which implies the good prognosis condition in day . From range of possible values in Table 1, Model (11) is solved for 50 values in that range, obtaining amount of blasts in blood in day related to each one. It is obtained a value from which, values imply blasts levels smaller than the limit of amount of cells, consequently, we obtain a range of values in which patient response to treatment. This result imply two important aspects to consider. On one hand, a patient whose sample is extracted in day could be associated to the corresponding and predict the evolution of the disease. On the other hand, if we analyze blood extraction in other day, for instance, we could be able to associated value before day and predict results in that day. Thus, it would be possible to change treatment protocol on time.
Apart from the study of the day conditions, we analyze good response conditions in day .
According to sensitivity study, prednisone and vincristine are the most significant parameters and hence, we propose a study about influence parameters related to them. On day , MRD should be less than to obtain good results in patients, therefore, we search for values which lead to those leukemic cells levels when Model (11) is solved for those values. Leukemic compartment percentages in bone marrow on day are obtained for each case and presented in Figure 6 in a heat map. As it is observed, there are two semiplanes corresponding to patients who response and patients who do not response correctly to treatment. With the purpose of minimizing both and , we take average minimal values which imply a good response. What is interesting in this result is the fact that the value obtained by this method is the same value found by the study of the blasts levels in day . This finding reinforces that studies must be based on fitting influence parameters to obtain more predictive information of each patient.
Finally, simulations supported by previous results in this work are presented. Previously, parameter
estimation is performed and the bone marrow behavior is studied assuming a leukemic cell appearance. The disease is diagnosed when it entails an important part of cells in bone marrow and it is treated according to protocol. As it is observed in the Figure 7 and generally, treatment application leads to patients recovery and the stabilization of healthy cells levels from fifty days after treatment finish. Treatment is applied when leukemia is diagnosed, that it is supposed in day from the first leukemic cell appearance since there are about of blasts in bone marrow. During eight days prednisone is applied and it is possible to observe a drop in all leukemic and healthy cells but in day is more significant because vincristine and daunorubicin are added to the therapy. From day in which asparaginase is administered, leukemic cells values are insignificant in comparison to healthy cells. The fact that this situation occurs agree with parameters choice which guarantee that MRD is less than on day . Graphs interpretation is facilitated by the comparison between amount of cells and proportions. In those simulations, it should be highlighted that leukemic cells do not appear the following days. For that reason, it is considered a partial patient recovery, not completely due to the logistic growth of leukemia. Moreover, the disease always tend to appear again and that idea explains why treatment should continue with other phases which drop the possibility of any rest of leukemic cells develops.
Being limited to available data, this study lacks accuracy related to drug influence estimated parameters. On one hand, an exhaustive study of each patient would required to be able to model the leukemia growth without treatment. To do so, two bone marrow must be extracted, to observe how cells develop and obtain the parameter related to leukemic proliferation, , in each patient.
This option is unfeasible since two bone marrow extractions are rare and unnecessary, as drugs are to be administered to the child as soon as possible. Hence, we propose a future study to relate blood blasts and search for a possible correlation.
Another limitation of our analysis would be the simplicity of the treatment function. Drugs evolution inside the body has a complicated and more detailed process which has been reduced and it produces a lack of information. Absorption time or action mechanism are some of the conditions to be taken into account in order to get closer to real data. Moreover, only the Induction A phase has been formulated instead of the full treatment. We have focused on this phase of treatment since effects of the next stages (Induction B and Consolidation) are not visible enough. In addition, Induction A is the most interesting phase to study owing to its critical influence throughout treatment.
Notwithstanding with these limitations, the study suggests that it is possible to approximate contemplated parameters related to treatment provided that parameters values for leukemia are corroborated. Additionally, different compartment levels in patients bone marrows with ALL corresponds to values obtained from this previous study in which a virtual patient is simulated.
These findings suggest several courses of action for improving techniques used by protocols. There is a definite need for personalizing medicine. We suggest, therefore, that studies consider mechanisms of action of drugs along with an exhaustive monitoring to prove how they inhibit healthy and leukemic cells proliferation as well as how they destroy cells and the environment. We propose a clinical study about model with those conditions. Comparisons between models including new assumptions will be able to offer some approximations to specific models capable of obtaining realistic parameters. Several patients data are essential to validate the results presented. The effectiveness of that resource will allow to predict relapses in patients who have been diagnosed with ALL in a short period of time after treatment begins. The challenge now is to model full treatment, which takes into account available data and suitable parameters which lead to new research to improve current protocols and, consequently, survival expectancy in childhood ALL.
In conclusion, in this paper, a mathematical model of the appearance of leukemic cells in a bone marrow has been presented based on a mathematical model of cells development in a healthy bone marrow. Therefore, we have studied leukemic cells behavior to characterise a model describing the lymphopoiesis process when a cancer cell appears.Furthermore, we have simulated the model proposed and obtained results which coincide with biological basis of cancer. Afterwards, treatment application is included according to current protocol, meaning healthy and leukemic cells death. Dynamics in bone marrow are modeled and studied based on parameters estimation to simulate a virtual patient who responds to treatment.This model provides a basis of future action protocols of treatments of ALL.
References
- [1] S. H. Orkin, L. I. Zon, Hematopoiesis: an evolving paradigm for stem cell biology, Cell 132 (4) (2008) 631–644.
- [2] M. Jagannathan-Bogdan, L. I. Zon, Hematopoiesis, Development 140 (12) (2013) 2463–2467.
- [3] C.-H. Pui, D. Campana, W. E. Evans, Childhood acute lymphoblastic leukaemia–current status and future perspectives, The lancet oncology 2 (10) (2001) 597–607.
- [4] C.-H. Pui, L. L. Robison, A. T. Look, Acute lymphoblastic leukaemia, The Lancet 371 (9617) (2008).
- [5] R. A. Egler, S. P. Ahuja, Y. Matloub, L-asparaginase in the treatment of patients with acute lymphoblastic leukemia, Journal of pharmacology & pharmacotherapeutics 7 (2) (2016) 62.
- [6] M. Mesegué, A. Alonso-Saladrigues, S. Pérez-Jaume, A. Comes-Escoda, J. L. Dapena, A. Faura, N. Conde, A. Català, A. Ruiz-Llobet, E. Zapico-Muñiz, et al., Lower incidence of clinical allergy with peg-asparaginase upfront versus the sequential use of native e. coli asparaginase followed by peg-asp in pediatric patients with acute lymphoblastic leukemia, Hematological Oncology 39 (5) (2021) 687–696.
- [7] A. Ruiz-Llobet, S. Gassiot, E. Sarrate, J. Zubicaray, J. L. Dapena, S. Rives, J. Sevilla, Á. Menárguez López, M. Panesso Romero, C. Montoya, et al., Venous thromboembolism in pediatric patients with acute lymphoblastic leukemia under chemotherapy treatment. risk factors and usefulness of thromboprophylaxis. results of lal-sehop-pethema-2013, Journal of Thrombosis and Haemostasis (2022).
- [8] S. P. Hunger, X. Lu, M. Devidas, B. M. Camitta, P. S. Gaynon, N. J. Winick, G. H. Reaman, W. L. Carroll, Improved survival for children and adolescents with acute lymphoblastic leukemia between 1990 and 2005: a report from the children’s oncology group, Journal of clinical oncology 30 (14) (2012) 1663.
- [9] H. Ma, H. Sun, X. Sun, Survival improvement by decade of patients aged 0–14 years with acute lymphoblastic leukemia: a seer analysis, Scientific reports 4 (1) (2014) 1–7.
- [10] Z. J. Ward, J. M. Yeh, N. Bhakta, A. L. Frazier, R. Atun, Estimating the total incidence of global childhood cancer: a simulation-based analysis, The Lancet Oncology 20 (4) (2019) 483–493.
- [11] D. Bhojwani, C.-H. Pui, Relapsed childhood acute lymphoblastic leukaemia, The Lancet Oncology 14 (6) (2013) e205–e217.
- [12] T. Terwilliger, M. Abdul-Hay, Acute lymphoblastic leukemia: a comprehensive review and 2017 update, Blood Cancer Journal 7 (6) (2017) e577–e577.
- [13] S. Mathur, J. Sutton, Personalized medicine could transform healthcare, Biomedical reports 7 (1) (2017) 3–5.
- [14] G. Bocharov, V. Volpert, B. Ludewig, A. Meyerhans, et al., Mathematical immunology of virus infections, Vol. 245, Springer, 2018.
- [15] A. Tosenberger, F. Ataullakhanov, N. Bessonov, M. Panteleev, A. Tokarev, V. Volpert, Modelling of thrombus growth in flow with a dpd-pde method, Journal of theoretical biology 337 (2013) 30–41.
- [16] R. A. Gatenby, P. K. Maini, Mathematical oncology: cancer summed up, Nature 421 (6921) (2003) 321–321.
- [17] P. M. Altrock, L. L. Liu, F. Michor, The mathematics of cancer: integrating quantitative models, Nature Reviews Cancer 15 (12) (2015) 730.
- [18] M. C. Mackey, R. Rudnicki, Global stability in a delayed partial differential equation describing cellular replication, Journal of Mathematical Biology 33 (1) (1994) 89–109.
- [19] N. L. Komarova, Principles of regulation of self-renewing cell lineages, PloS one 8 (9) (2013) e72847.
- [20] N. Bessonov, L. Pujo-Menjouet, V. Volpert, Cell modelling of hematopoiesis, Mathematical Modelling of Natural Phenomena 1 (2) (2006) 81–103.
- [21] E. G. Van Lochem, V. H. J. Van der Velden, H. K. Wind, J. G. Te Marvelde, N. A. C. Westerdaal, J. J. M. Van Dongen, Immunophenotypic differentiation patterns of normal hematopoiesis in human bone marrow: Reference patterns for age-related changes and disease-induced shifts, Cytometry Part B: Clinical Cytometry 60 (1) (2004) 1–13.
- [22] T. Stiehl, A. Marciniak-Czochra, Characterization of stem cells using mathematical models of multistage cell lineages, Mathematical and Computer Modelling 53 (7-8) (2011) 1505–1517.
- [23] D. Bonnet, J. E. Dick, Human acute myeloid leukemia is organized as a hierarchy that originates from a primitive hematopoietic cell, Nature medicine 3 (7) (1997) 730–737.
- [24] K. Anderson, C. Lutz, F. W. Van Delft, C. M. Bateman, Y. Guo, S. M. Colman, H. Kempski, A. V. Moorman, I. Titley, J. Swansbury, et al., Genetic variegation of clonal architecture and propagating cells in leukaemia, Nature 469 (7330) (2011) 356–361.
- [25] A. Marciniak-Czochra, T. Stiehl, A. D. Ho, W. Jäger, W. Wagner, Modeling of asymmetric cell division in hematopoietic stem cells regulation of self-renewal is essential for efficient repopulation, Stem cells and development 18 (3) (2009) 377–386.
- [26] S. Chulián, A. Martínez-Rubio, A. Marciniak-Czochra, T. Stiehl, C. B. Goñi, J. F. R. Gutiérrez, M. R. Orellana, A. C. Robleda, V. M. Pérez-García, M. Rosa, Dynamical properties of feedback signalling in b lymphopoiesis: A mathematical modelling approach, Journal of Theoretical Biology 522 (2021) 110685.
- [27] T. Lorenzi, A. Marciniak-Czochra, T. Stiehl, A structured population model of clonal selection in acute leukemias with multiple maturation stages, Journal of mathematical biology 79 (5) (2019) 1587–1621.
- [28] G. Clapp, D. Levy, A review of mathematical models for leukemia and lymphoma, Drug Discovery Today: Disease Models 16 (2015) 1–6.
- [29] A. Ducrot, V. Volpert, On a model of leukemia development with a spatial cell distribution, Mathematical Modelling of Natural Phenomena 2 (3) (2007) 101–120.
- [30] A. Möricke, M. Zimmermann, A. Reiter, H. Gadner, E. Odenwald, J. Harbott, W.-D. Ludwig, H. Riehm, M. Schrappe, Prognostic impact of age in children and adolescents with acute lymphoblastic leukemia: data from the trials all-bfm 86, 90, and 95, Klinische Pädiatrie 217 (06) (2005) 310–320.
- [31] Q. Dai, G. Zhang, H. Yang, Y. Wang, L. Ye, L. Peng, R. Shi, S. Guo, J. He, Y. Jiang, Clinical features and outcome of pediatric acute lymphoblastic leukemia with low peripheral blood blast cell count at diagnosis, Medicine 100 (4) (2021).
- [32] J. A. Bull, H. M. Byrne, The hallmarks of mathematical oncology, Proceedings of the IEEE (2022).
- [33] C.-H. Pui, W. E. Evans, Treatment of acute lymphoblastic leukemia, New England Journal of Medicine 354 (2) (2006) 166–178.
- [34] M. Ronghe, G. Burke, S. Lowis, E. Estlin, Remission induction therapy for childhood acute lymphoblastic leukaemia: clinical and cellular pharmacology of vincristine, corticosteroids, l-asparaginase and anthracyclines, Cancer treatment reviews 27 (6) (2001) 327–337.
- [35] D. Jayachandran, A. E. Rundell, R. E. Hannemann, T. A. Vik, D. Ramkrishna, Optimal chemotherapy for leukemia: a model-based strategy for individualized treatment, PloS one 9 (10) (2014) e109623.
- [36] C. L. Mouser, E. S. Antoniou, J. Tadros, E. K. Vassiliou, A model of hematopoietic stem cell proliferation under the influence of a chemotherapeutic agent in combination with a hematopoietic inducing agent, Theoretical Biology and Medical Modelling 11 (1) (2014) 1–14.
- [37] O. Nave, A new protocol applied to cancer treatment-mathematical model-singular perturbed vector field algorithm (2022).
- [38] S. Rubinow, J. Lebowitz, A mathematical model of the chemotherapeutic treatment of acute myeloblastic leukemia, Biophysical journal 16 (11) (1976) 1257–1271.
- [39] E. Pefani, N. Panoskaltsis, A. Mantalaris, M. C. Georgiadis, E. N. Pistikopoulos, Chemotherapy drug scheduling for the induction treatment of patients with acute myeloid leukemia, IEEE Transactions on Biomedical Engineering 61 (7) (2014) 2049–2056.
- [40] Á. Martínez-Rubio, S. Chulián, C. Blázquez Goñi, M. Ramírez Orellana, A. Pérez Martínez, A. Navarro-Zapata, C. Ferreras, V. M. Pérez-García, M. Rosa, A mathematical description of the bone marrow dynamics during CAR T-cell therapy in B-cell childhood acute lymphoblastic leukemia, International Journal of Molecular Sciences 22 (12) (2021) 6371.
- [41] V. M. Pérez-García, O. León-Triana, M. Rosa, A. Pérez-Martínez, CAR T cells for T-cell leukemias: Insights from mathematical models, Communications in Nonlinear Science and Numerical Simulation 96 (2021) 105684.
- [42] O. León-Triana, S. Sabir, G. F. Calvo, J. Belmonte-Beitia, S. Chulián, Á. Martínez-Rubio, M. Rosa, A. Pérez-Martínez, M. Ramirez-Orellana, V. M. Pérez-García, CAR T cell therapy in B-cell acute lymphoblastic leukaemia: Insights from mathematical models, Communications in Nonlinear Science and Numerical Simulation 94 (2021) 105570.
- [43] G. J. Kimmel, F. L. Locke, P. M. Altrock, The roles of T cell competition and stochastic extinction events in chimeric antigen receptor T cell therapy, Proceedings of the Royal Society B 288 (1947) (2021) 20210229.
- [44] D. Hanahan, R. A. Weinberg, Hallmarks of cancer: the next generation, Cell 144 (5) (2011) 646–674.
- [45] M. Karon, E. J. Freireich, E. Frei III, R. Taylor, I. J. Wolman, I. Djerassi, S. L. Lee, A. Sawitsky, J. Hananian, O. Selawry, et al., The role of vincristine in the treatment of childhood acute leukemia, Clinical Pharmacology & Therapeutics 7 (3) (1966) 332–339.
- [46] D. Campana, Minimal residual disease in acute lymphoblastic leukemia, Hematology 2010, the American Society of Hematology Education Program Book 2010 (1) (2010) 7–12.
- [47] D. Czock, F. Keller, F. M. Rasche, U. Häussler, Pharmacokinetics and pharmacodynamics of systemically administered glucocorticoids, Clinical pharmacokinetics 44 (1) (2005) 61–98.
- [48] M. Qweider, J. M. Gilsbach, V. Rohde, Inadvertent intrathecal vincristine administration: a neurosurgical emergency: case report, Journal of Neurosurgery: Spine 6 (3) (2007) 280–283.
- [49] F. M. Balis, J. S. Holcenberg, W. A. Bleyer, Clinical pharmacokinetics of commonly used anticancer drugs, Clinical pharmacokinetics 8 (3) (1983) 202–232.
- [50] B. Asselin, C. Rizzari, Asparaginase pharmacokinetics and implications of therapeutic drug monitoring, Leukemia & lymphoma 56 (8) (2015) 2273–2280.
- [51] G. M. Armstrong, C. P. Midgley, Applications: The exponential-decay law applied to medical dosages., Mathematics Teacher 80 (2) (1987) 110–13.
- [52] G. B. Haycock, G. J. Schwartz, D. H. Wisotsky, Geometric method for measuring body surface area: a height-weight formula validated in infants, children, and adults, The Journal of pediatrics 93 (1) (1978) 62–66.
- [53] T. Szczepański, Why and how to quantify minimal residual disease in acute lymphoblastic leukemia?, Leukemia 21 (4) (2007) 622–626.
- [54] H. Amin, Y. Yang, Y. Shen, E. Estey, F. Giles, S. Pierce, H. Kantarjian, S. O’Brien, I. Jilani, M. Albitar, Having a higher blast percentage in circulation than bone marrow: clinical implications in myelodysplastic syndrome and acute lymphoid and myeloid leukemias, Leukemia 19 (9) (2005) 1567–1572.
- [55] E. Bianconi, A. Piovesan, F. Facchin, A. Beraudi, R. Casadei, F. Frabetti, L. Vitale, M. C. Pelleri, S. Tassani, F. Piva, et al., An estimation of the number of cells in the human body, Annals of human biology 40 (6) (2013) 463–471.
- [56] J. Choi, S. J. Lee, Y. A. Lee, H. G. Maeng, J. K. Lee, Y. W. Kang, Reference values for peripheral blood lymphocyte subsets in a healthy korean population, Immune network 14 (6) (2014) 289–295.
- [57] A. Raes, S. Van Aken, M. Craen, R. Donckerwolcke, J. V. Walle, A reference frame for blood volume in children and adolescents, BMC pediatrics 6 (1) (2006) 1–8.
- [58] O. Linderkamp, H. Versmold, K. Riegel, K. Betke, Estimation and prediction of blood volume in infants and children, European journal of pediatrics 125 (4) (1977) 227–234.
- [59] R. Acharya, M. K. Sundareshan, Development of optimal drug administration strategies for cancer-chemotheraphy in the framework of systems theory, International journal of bio-medical computing 15 (2) (1984) 139–150.
- [60] K. Kay, I. M. Hastings, Improving pharmacokinetic-pharmacodynamic modeling to investigate anti-infective chemotherapy with application to the current generation of antimalarial drugs, PLoS computational biology 9 (7) (2013) e1003151.