Towards computer vision technologies:
Semi-automated reading of automated utility meters
Abstract
In this report we analysed a possibility of using computer vision techniques for automated reading of utility meters. In our study, we focused on two computer vision techniques: an open-source solution Tensorflow Object Detection (Tensorflow) and a commercial solution Anyline. This report extends our previous publication [51]: We start with presentation of a structured analysis of related approaches. After that we provide a detailed comparison of two computer vision technologies, Tensorflow Object Detection (Tensorflow) and Anyline, applied to semi-automated reading of utility meters. In this paper, we discuss limitations and benefits of each solution applied to utility meters reading, especially focusing on aspects such as accuracy and inference time. Our goal was to determine the solution that is the most suitable for this particular application area, where there are several specific challenges.
1 Introduction
Smart solutions are extensively used for many kind of utilities, e.g., electricity and gas. Therefore, development and application of smart devices, including smart meters, is an active research topic over the last decades [15, 8, 60]. Smart meters have many advantages, where the most important is the capability to record the data on energy consumption and sent this data automatically to the provider and/or to the corresponding customer. Having this detailed data we can provide additional monitoring and billing features, as well as a much more detailed analysis of the consumption patterns. On this basis, we could also provide suggestions to a customer on how to reduce consumption or to schedule the energy-consuming tasks for the time, which is mostly suitable for the energy network (in the terms of payment or the energy load).
However, even when smart utility meters provide many benefits and can be seen as the future direction of the industry, they also have a number of disadvantage that prevents an immediate replacement of old meters by the new smart solutions:
-
•
Cost: Implementation of smart meters on a large scale is expensive. In the case the upgrade is optional/voluntary, customers might prefer to refuse or delay an upgrade to a smart meter, if they have to pay for an upgrade. In the case the upgrade is compulsory, customers might struggle with payment of an extensive bill, and a subsidy from government might be needed.
-
•
Learning curve: A customer can benefit from using a smart meter only if they know well how exactly to use it. Some customers might refuse or delay an upgrade to a smart meter because they perceive that using smart meters is not so easy and requires reasonable learning efforts.
-
•
Privacy concerns: The data collected from the smart meters might be used to extract information on the usage pattern, which could provide a basis for identification whether/when the residents are currently at home, how many of residents are at home during the particular weekdays or day times, etc. This fact together with increased number of cyber-security attacks over recent years prevents some customers from using the smart meters.
By these reasons, in some countries the roll out to the smart meter systems is done phase-wise, where on the initial phase the roll out is voluntary. As the initial phase might take many years, we believe that even during this period a semi-automated solution would be beneficial. For example, a semi-automated solution it might benefit people with vision impairment.
In this report we analysed a possibility of using computer vision techniques for semi-automated reading of utility meters. This report extends our previous publication [51]. We start with presentation of a structured analysis of related approaches. After that we provide a detailed comparison of two computer vision technologies, Tensorflow Object Detection (Tensorflow) and Anyline, applied to semi-automated reading of utility meters. We compare application of these technologies with each other, as well as with our previous results presented in our earlier work [53].
In our earlier study, we conducted a project in collaboration with Energy Australia, which is an electricity and gas retailing private company that supplies electricity and natural gas to more than 2.6 million residential and business customers throughout Australia. Their solution for non-smart meters was to provide an online portal, where the consumers can update the records on the utility readings. While this solution provided many benefits for the customers during the initial phase of smart meters introduction, it also had some disadvantages: the consumers had to provide a lot of additional details, and to calculate their utility readings manually. The goal of our previous project was to elaborate an alternative method for the existing system, which would allow for a higher degree of automation to increase the usability of the system. The proposed solution was to use computer vision techniques for capturing readings. We analysed there the following computer-vision technologies: Google Cloud Vision (GCV), Amazon Web Services (AWS) Rekognition, Tesseract OCR, and Azure’s Computer Vision. The study demonstrated that AWS Rekognition provides better results for this application domain. However, it’s accuracy was far from ideal: the average accuracy values AWS Rekognition was only . In the current study, we used the same data sets, but applied other approaches. The current results are significantly better in the terms of recognition accuracy than the results of our early investigation study: the results of the current study demonstrate the accuracy up to , which is promising for real-life application of the proposed solution.
2 Related Work and Background
2.1 Smart meters
The research on the smart meter devices and the corresponding analytic was actively conducted over many years, which was reflected not only in research publications but also in patents, see e.g., [28, 37, 26, 31, 17, 23, 55].
Over the last decade, there were two core research directions in this area: (1) privacy and security aspects of the smart meter application, and (2) smart meters in combination with a smart grid system. In the rest of the section we discuss the most cited (as per Google Scholar, retrieved 23 November 2022) publications, grouped by the research directions.
A summary of most cited papers on privacy and security aspects of smart meters is presented in Table 1. This research direction is currently the most active one among the mentioned directions, because the privacy and security concerns provide one of the biggest obstacles for the (potential) users of smart meters. In many cases, data mining and data analytics techniques were applied on the meter reading data, to investigate the above issues questions. A summary of most cited papers on design of smart meters for smart grid is presented in Table 2.
| Ref. | Description / core contributions | Citations |
|---|---|---|
| [36] | Privacy-preserving smart meter architecture; a study to demonstrate that | 605 |
| the power consumption patterns can help to reveal how many people are in the home, | ||
| what are their sleeping and eating routines, etc. | ||
| [24] | Multimedia content identification through smart meter power usage profiles | 256 |
| [42] | Theoretical framework to analyse privacy aspects of smart meters | 271 |
| [5] | Survey on smart meter data privacy | 203 |
| [19] | Survey on privacy-aware smart metering | 97 |
| [35] | analysis on balancing consumer privacy concerns with legitimate applications | 406 |
| [18] | Influence of data granularity on smart meter privacy | 112 |
| [30] | An approach for occupancy detection from electricity consumption data | 268 |
| [29] | Household occupancy monitoring using electricity meters | 140 |
| [27] | Occupancy sensing using smart meters | 107 |
| [61] | Occupancy sensing using smart meters in commercial buildings | 96 |
| [40] | Formal framework to quantify the privacy trade off problem in smart meter data | 220 |
| [7] | Extraction of the households characteristics from the the smart meter data | 282 |
| [3] | Analysis on customer profiles based the consumption patterns from the smart meter data | 278 |
| [11] | Non-intrusive occupancy monitoring using smart meters, energy-efficiency optimisations | 207 |
| [10] | approach for re-identification of smart meter data | 82 |
| [9] | A privacy model for smart metering | 265 |
| Ref. | Description / core contributions | Citations |
|---|---|---|
| [16] | Approach for anonymizing the data sent by a smart meter to a smart grid | 784 |
| [39] | A privacy-preserving concept for smart grids | 90 |
| [32] | Smart meter data aggregation approach for smart grids | 660 |
| [60] | Overview of typical smart meter’s aspects and functions wrt. smart grid aspects | 383 |
| [57] | Overview of approaches for energy theft recognition from the meter data | 104 |
| [4] | Study on design and development of smart energy meter for the smart grid | 103 |
| [6] | Analysis of energy meters evolution in smart grids | 212 |
| [58] | Detection of energy theft and defective smart meters in smart grids using linear regression | 141 |
2.2 Computer-vision technologies
There are many computer-vision technologies that are potentially applicable for semi-automated reading of smart meters, for example,
-
•
Google Cloud Vision 111https://cloud.google.com/vision is a computer-vision technology provided by the Google platform ((Vertex AI Vision)),
-
•
AWS Rekognition222https://aws.amazon.com/rekognition is another cloud-based solution, provided by Amazon Web Services,
-
•
Tesseract OCR [44] is an optical character recognition engine, which is released under the Apache License.
-
•
Computer Vision AI service provided by Microsoft Azure333https://azure.microsoft.com/en-gb/products/cognitive-services/computer-vision/,
-
•
Tensorflow444https://www.tensorflow.org/guide/summaries_and_tensorboard is an open-source machine learning system that operates at large scale and offers a multitude of models to be retrained (more than 30), see [1, 2]. It provides visualisation tool TensorBoard [56] that allows to visualise TensorFlow graphs, plot corresponding quantitative metrics, etc.
-
•
Anyline555https://anyline.com/products/ocr-meter-reading is a commercial solution intended to read utility meters, which also offers a free sample app Anyline OCR Scanner that has been used during tests within our project.
2.3 Challenges of application of computer vision technologies
There are many challenges for application of computer vision technologies for the reading of utility meters. In what follows we discuss the most critical of them:
-
•
Reflections: Most meter models encountered has a transparent protective cover, which lead to reflections from it. This becomes problematic for computer vision technologies which includes thresholding/flooding techniques. Thresholding techniques are usually applied to OCR technologies in-order to minimize noise and or to convert to black-and-white images.
Flooding is a technique used to find similar neighbouring pixels. This technique can be used when finding contours of shapes. -
•
Clipped digits: The final digit in analogue meters usually rotate freely. This becomes problematic as the digit becomes clipped and the full digit is not displayed – instead of this a half of one digit and a half of another digit are presented. The computer vision technology would need to be able to deal with this issue and recognise clipped digits effectively.
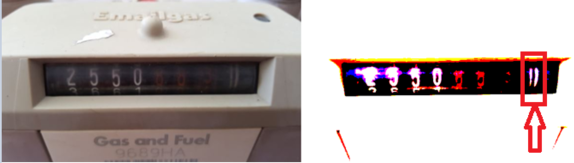
(a) (b)
Figure 1: Challenging case: (a) Original image; (b) Application of the thresholding technique over the original image
-
•
Not all characters and digits, which can be identified on the meter, actually belong to the meter reading: Utility meters commonly include other text consisting of letters and digits. The computer vision technology would need to be able to discriminate which digits are part of the meter reading, and which have to be ignored.
-
•
Blur, noise, and warping: Many meters observed during the project were not ideally clean as in real life the meters might become dirty and have grime even after few months of use. The grime adds noise to the observed meter. Grime with reflection creates a blur effect around some digits. Digits are also observed to be warped along with the shape of the cover, e.g., the digits appear “stretched” or “squashed” depending on observation angle. Furthermore, there can be a significant contrast difference in scenarios where the colour of the digits is mixed.
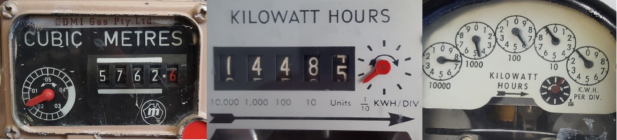
(a) (b) (c)
Figure 2: Different representation styles (scales, dials and digit) mixed within a meter interface
-
•
Different representation styles (scales, dials and digits) mixed within a meter interface, see Figure 2. The reading value of utility meters is not represented in a consistent manner. Utility models observed during the project presented their reading value either through: using rotational dials, using cyclometers, a combination of rotational dials and cyclometers or a singular digital display. The challenge becomes even more complex when the numeric value is displayed on a scale, e.g., as presented in Figure 2:
-
–
The meter (a) should be read as 5762.615m3 gas and not 57626,
-
–
The meter (b) should be read as 14485.68kWh energy and not 14485,
-
–
The meter (c) should be read as 75691.1kWh energy and not 756911.
The meters commonly include a decimal point. Most meters include the decimal point as the last digit and can be read and a tenth. Sometimes it is a mixture of a digit and a dial as in Figures 2(b) and (c).
Some models display three decimal points as seen in Figure 1 (the digits after decimal points are highlighted with red colour), which should read as 2550.883m3 and not 2550883. It’s easy to see from the image, that the red colour might make it more difficult to identify the digits in the case of manual reading. The aim of our work is to identify a computer vision technology that is capable of distinguishing between different numeric scales and be able to detect both digits and rotation of dials.
-
–
3 METHODOLOGY
To determine which of these technologies is most suitable for reading utility meters, we elaborated a set of tests that allows us to identify the limitations of each technology by gradually adjusting image blur, noise, gamma or scale.
The following methodology was applied to analyse the techniques:
-
1.
To create a training dataset for the Tensorflow Object Detection framework.
-
2.
To train all the different models using the dataset, which was elaborated at Step 1. This was done through Google ML Engine.
-
3.
To create evaluation datasets for which the technologies can be tested against.
-
4.
To create a test harness for the involved technologies.
-
5.
To run the test harness on the evaluation datasets created from Step 3.
The training dataset is a set of all images found during project duration. The final training dataset consisted of 395 images and 2000 annotations. Unfortunately, this is still considered limited as supplied Tensorflow models were created based upon 2000+ annotations per object.
As the evaluation dataset we used the same images as in our earlier work [53], which allowed us to compare the results of application of Tensorflow and Anyline not only with each other, but also with the results of AWS Rekognition (which demonstrated the best but not good enough accuracy in our previous study). Thus, in [53], a total of 30 images were selected based on their “uniqueness” – images with unique meters or images with unique lighting. These images were duplicated and modified with various effects in order to test the limitations of the different technologies. These effects are:
-
•
Scaling: The dataset was scaled in steps of 0.1 ranging from a scale of 0.1 to 0.9 (10 to 90) of the original dataset.
-
•
Blurring: Blurring was done in steps of 10 from 10 to 90 with an open source blur algorithm that is based on the normalised box filter, see [38]. The algorithm uses a normalised box filter, the numeral value adjusts the kernel size.
-
•
Gamma: The gamma algorithm was used with an open source lookup table algorithm [38]. The gamma correction to simulate different lightning conditions.
-
•
Noise: The noise algorithm is based upon the salt and pepper noise algorithm that adds sharp and sudden disturbances in the image in the form of sparsely occurring white and black pixels, see [22]. This algorithm was included to further test the performance of the various technologies as noise arguably emulates “dirt” on meters.
In contrast to Anyline, Tensorflow’s Tensorboard provides more in-depth evaluation of each model and how well each model detects objects for a given dataset, such as:
Our initial hypotheses in terms of accuracy and detection rates were as follows:
-
H1:
FRCNN model would significantly outperform other models.
-
H2:
SSD model would perform significantly worse than the other models in terms of accuracy.
-
H3:
The lower the image resolution is, the faster inference would occur.
-
H4:
FRCNN would require significantly more time than FPN and SSD models.
As Tensorflow Object Detection only detects objects, the results have to be filtered in order to give a reading. We applied the filtering algorithm presented in Algorithm 1 to
-
•
remove any junk data, i.e., any detected objects for what the identification confidence is ,
-
•
remove all duplicates within the geometric region, keeping the results withe the highest identification confidence.
The filtering algorithm can be further improved, if the previous reading of the meter is considered, for which an access to the customer’s account is required. We haven’t applied this improvement within the comparison study, as the supplied Anyline app cannot include any customer related data.
Results from each dataset and each technology were produced in
csv files (a comma-separated values file that allows data to be saved in a tabular format) with the following structure:
FileName, InferTime, FilteredReading,
ExpectedReading, IsCorrect
where InferTime denotes the interference time, which was measured in ms.
Similarly to [53], we calculated the accuracy of recognition calculated as the following simple formula (we measure the accuracy in percents, where means a totally accurate recognition):
| (1) |
where
is the number of results that match with the original readings completely,
presents the total number of images in a dataset.
As in our study, we had 30 images in each of the datasets, .
4 RESULTS AND DISCUSSION
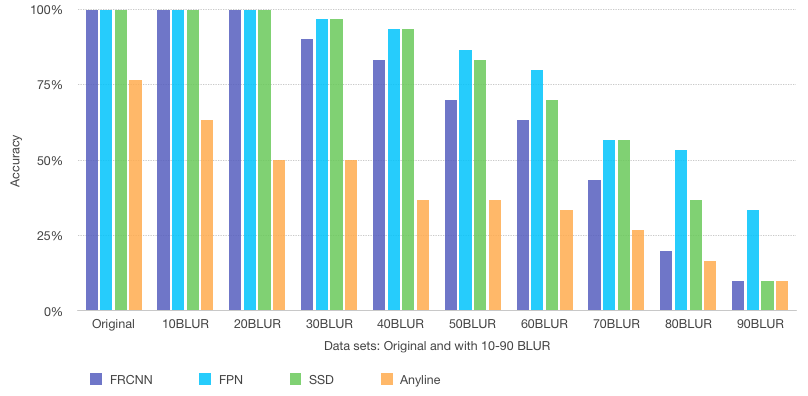
Figures 3-6 present the identified accuracy scores per dataset, where 50 indicates half of the dataset meter images were correctly read.
It is important to mention that both Tensorflow and Anyline were less sensitive to salt and paper issues (Figure 3), scaling (Figure 6), gamma issues (Figure 5), and than to blurring (Figure 4). However, for all data sets, the accuracy of Tensorflow was almost twice higher:
-
•
With low blurring (10BLUR and 20BLUR), Tensorflow performed with 100 accuracy, where the accuracy of Anyline dropped to approx. 63 and 50 respectively.
-
•
For the effect of 50BLUR, the accuracy of Tensorflow FPN and Anyline were approx. 87 and 37 respectively.
-
•
For the effect of 90BLUR, the accuracy for Tensorflow FRCNN, Tensorflow SSD and Anyline was only 10, where the accuracy of Tensorflow FPN was approx. 33. However, the 90BLUR effect means a very blurry image.
The overall performance of the Tensorflow models greatly surpass expectations in terms of accuracy, having an average performance of , and for FRCNN, SSD, and FPN, respectively. This is especially remarkable, if we compare it with the average accuracy values from AWS Rekognition was only that demonstrated the best (but not really satisfactory) results within the study presented in [53].
TensorBoard confirms the accuracy of the trained models. Scoring a near perfect score of 1.0 is extremely significant is a strong indication that Tensorflow Object Detection is a suitable framework for the automated meter reading.
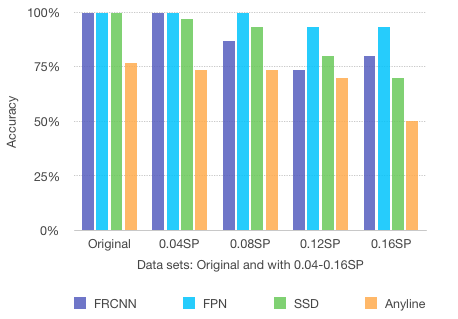
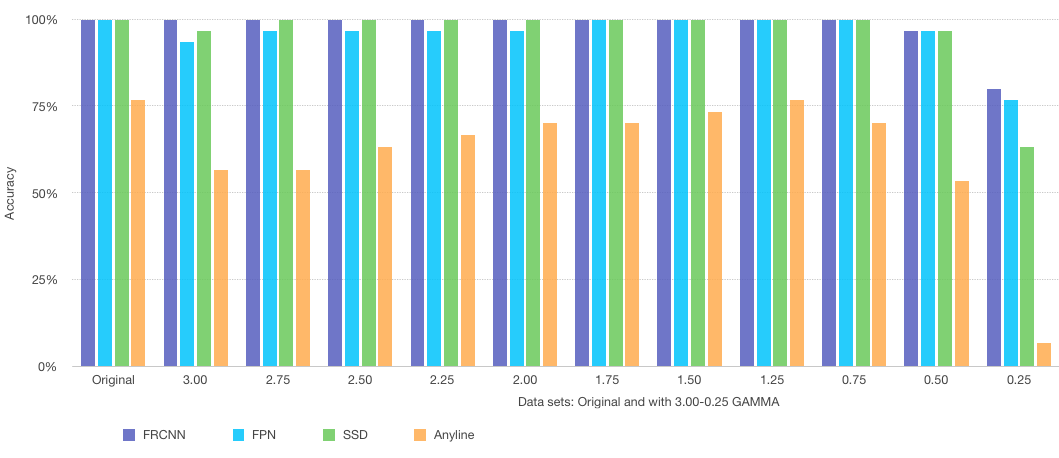
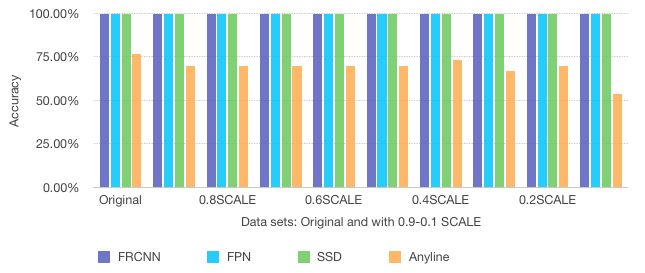
Anyline performed arguably well having an average performance of , and struggled on several utility meter models. The results indicate that Anyline may not have trained or tested their product on a similar utility meters models as used within the Australian market.
The accuracy of Anyline was significantly lower for all data sets: if compared with Tensorflow FPN, the accuracy of Anyline was in average lower approx. lower, where
-
•
the largest differences in the cases of 0.25GAMMA (approx. ) and 20BLUR (approx. );
-
•
the largest difference (approx. ) was in the cases of 1.25GAMMA, 0.12SP (noise), 90BLUR, and the original data sets.
![[Uncaptioned image]](/html/2211.13483/assets/x3.png)
![[Uncaptioned image]](/html/2211.13483/assets/x4.png)
With respect to our hypotheses H1-H4, the results of the conducted study can be summarises as follows:
-
•
H1 and H2 were disproved by the conducted study, see Table 3: In the terms of accuracy, the best performing model was FPN, where FRCNN and SSD were performing slightly worse than the other models.
-
•
H3 was proved as correct, see Table 4 (rows presenting the results for 0.1-0.09SCALE as well as the original dataset).
-
•
H4 was also proved as correct, see Table 4: In average, FRCNN was approx. 2.5 slower than FPM and approx. 3.2 times slower than SSD.
The results for both Tensorflow and Anyline are also significantly better than the results of our early investigation study conducted for the domain of meter reading recognition, where we analysed Google Cloud Vision (GCV) and Amazon Web Services (AWS) Rekognition using the same data sets. The average accuracy values for GCV and AWS Rekognition were just and respectively, see [53].
For an overall comparison of the the accuracy scores over all datasets, see also Table 3.
On this basis, we also performed interference analysis for Tensorflow models, see Table 4. The tests were run in the background of a laptop with an Intel i7-6700HQ CPU. However, the inference time could improve significantly (more than 10-fold) if a server-based CPU is used for the same experiment, see [25].
5 CONCLUSIONS
We presented the results of a research project, which goal was to provide an alternative, semi-automated, method for the current system to update the meter reading data, collected from non-smart utility meters.
Our early investigation study on the recognition accuracy of Google Cloud Vision and AWS Rekognition applied for recognition in utility meter readings, demonstrated very low average accuracy values ( and , respectively). For this reasons, we conducted a further study to analyse two other computer vision technologies, applied for recognition in utility meter readings:
-
•
an open-source Tensorflow technique (FRCNN, FPN, and SSD models), and
-
•
a commercial solution Anyline.
The study demonstrated that Tensorflow provides significantly better results for our application domain ( for the FPN model), in comparison to Anyline, as well as to Google Cloud Vision and AWS Rekognition.
This research project was conducted under the initiative Research embedded in teaching, see [59, 47, 43, 49]. This initiative was proposed at the RMIT University (Melbourne, Australia) within the Software Engineering projects (SEPs) conducted in collaboration with industrial partners. The aim of this initiative is to encourage students’ curiosity for Software Engineering and Computer Science research. To reach this aim we include research components as bonus tasks in the final year projects (on both undergraduate and postgraduate levels), which typically focus on software and system development. Few weeks long research projects have been sponsored by industrial partners, who collaborated with the students and academic advisers through the final year projects. Respectively, the topics of these short research projects focus align the topics final year projects. The successful results of this initiative are presented in [12, 14, 46, 45, 53, 54, 13, 20, 52, 50, 21, 48].
Future Work: We are going to implement a Tensorflow-based solution within the prototype we presented earlier in [53], where the implementation was based on AWS Rekognition. The prototype includes a mobile application for automated capturing of the meter readings and managing the customer’s account details, and a Web application for management customers’ accounts, details on the electricity and gas meters, etc.
Acknowledgements
We would like to thank Shine Solutions and Energy Australia for sponsoring this project under the research grant RE-03615.
REFERENCES
- [1] Martín Abadi, Paul Barham, Jianmin Chen, Zhifeng Chen, Andy Davis, Jeffrey Dean, Matthieu Devin, Sanjay Ghemawat, Geoffrey Irving, Michael Isard, et al. Tensorflow: a system for large-scale machine learning. In OSDI, volume 16, pages 265–283, 2016.
- [2] Martín Abadi, Michael Isard, and Derek G Murray. A computational model for tensorflow: an introduction. In Proceedings of the 1st ACM SIGPLAN International Workshop on Machine Learning and Programming Languages, pages 1–7. ACM, 2017.
- [3] Adrian Albert and Ram Rajagopal. Smart meter driven segmentation: What your consumption says about you. IEEE Transactions on power systems, 28(4):4019–4030, 2013.
- [4] A. Arif, M. Al-Hussain, N. Al-Mutairi, E. Al-Ammar, Y. Khan, and N. Malik. Experimental study and design of smart energy meter for the smart grid. In 2013 International Renewable and Sustainable Energy Conference (IRSEC), pages 515–520, 2013.
- [5] Muhammad Rizwan Asghar, György Dán, Daniele Miorandi, and Imrich Chlamtac. Smart meter data privacy: A survey. IEEE Communications Surveys & Tutorials, 19(4):2820–2835, 2017.
- [6] Danielly B Avancini, Joel JPC Rodrigues, Simion GB Martins, Ricardo AL Rabêlo, Jalal Al-Muhtadi, and Petar Solic. Energy meters evolution in smart grids: A review. Journal of cleaner production, 217:702–715, 2019.
- [7] Christian Beckel, Leyna Sadamori, Thorsten Staake, and Silvia Santini. Revealing household characteristics from smart meter data. Energy, 78:397–410, 2014.
- [8] Francesco Benzi, Norma Anglani, Ezio Bassi, and Lucia Frosini. Electricity smart meters interfacing the households. IEEE Transactions on Industrial Electronics, 58(10):4487–4494, 2011.
- [9] Jens-Matthias Bohli, Christoph Sorge, and Osman Ugus. A privacy model for smart metering. In 2010 IEEE International Conference on Communications Workshops, pages 1–5. IEEE, 2010.
- [10] Erik Buchmann, Klemens Böhm, Thorben Burghardt, and Stephan Kessler. Re-identification of smart meter data. Personal and ubiquitous computing, 17(4):653–662, 2013.
- [11] Dong Chen, Sean Barker, Adarsh Subbaswamy, David Irwin, and Prashant Shenoy. Non-intrusive occupancy monitoring using smart meters. In Proceedings of the 5th ACM Workshop on Embedded Systems For Energy-Efficient Buildings, pages 1–8. ACM, 2013.
- [12] Alber Christianto, Peng Chen, Osheen Walawedura, Annie Vuong, Jun Feng, Dong Wang, Maria Spichkova, and Milan Simic. Enhancing the user experience with vertical transportation solutions. Procedia computer science, 126:2075–2084, 2018.
- [13] Rachita Chugh, Nidhi Chawla, Rochelle Maria Gracias, Jitender Singh Padda, Songyan Li, Minh Tuan Nguyen, Maria Spichkova, and Nitin Mantri. Automated gathering and analysis of cannabinoids treatment data. Procedia Computer Science, 159:2570–2579, 2019.
- [14] Leroy Clunne-Kiely, Bijin Idicula, Luke Payne, Enrico Ronggowarsito, Maria Spichkova, Milan Simic, and Heinrich Schmidt. Modelling and implementation of humanoid robot behaviour. In 21st International Conference on Knowledge-Based and Intelligent Information & Engineering Systems, pages 2249–2258. Elsevier Science Publishers BV, 2017.
- [15] Soma Depuru, Lingfeng Wang, Vijay Devabhaktuni, and Nikhil Gudi. Smart meters for power grid. challenges, issues, advantages and status. In 2011 IEEE/PES Power Systems Conference and Exposition, pages 1–7. IEEE, 2011.
- [16] Costas Efthymiou and Georgios Kalogridis. Smart grid privacy via anonymization of smart metering data. In International Conference on Smart Grid Communications, pages 238–243. IEEE, 2010.
- [17] Lance A Ehrke, Kimbel A Nap, and Donn R Dresselhuys. Electronic electric meter for networked meter reading, 2003. US Patent 6,538,577.
- [18] Günther Eibl and Dominik Engel. Influence of data granularity on smart meter privacy. IEEE Transactions on Smart Grid, 6(2):930–939, 2014.
- [19] Sören Finster and Ingmar Baumgart. Privacy-aware smart metering: A survey. IEEE communications surveys & tutorials, 17(2):1088–1101, 2015.
- [20] Purwa Kishor Gaikwad, Chris Theodore Jayakumar, Eashan Tilve, Niraj Bohra, Wenfei Yu, and Maria Spichkova. Voice-activated solutions for agile retrospective sessions. Procedia Computer Science, 159:2414–2423, 2019.
- [21] Lettisia Catherine George, Yanan Guo, Denis Stepanov, Vikas Kumar Reddy Peri, Roshan Lakmal Elvitigala, and Maria Spichkova. Usage visualisation for the aws services. Procedia Computer Science, 176:3710–3717, 2020.
- [22] Rafael C. Gonzalez and Richard E. Woods. Digital Image Processing. Addison-Wesley Longman Publishing Co., Inc., 2nd edition, 2001.
- [23] Brian Douglas Grady, Raj Vaswani, and James Pace. Method and system of reading utility meter data over a network, 2016. US Patent 9,464,917.
- [24] Ulrich Greveler, Peter Glösekötterz, Benjamin Justusy, and Dennis Loehr. Multimedia content identification through smart meter power usage profiles. In Proceedings of the International Conference on Information and Knowledge Engineering (IKE), page 1. The Steering Committee of The World Congress in Computer Science, Computer …, 2012.
- [25] Jonathan Huang, Vivek Rathod, Chen Sun, Menglong Zhu, Anoop Korattikara, Alireza Fathi, Ian Fischer, Zbigniew Wojna, Yang Song, Sergio Guadarrama, et al. Speed/accuracy trade-offs for modern convolutional object detectors. In Computer Vision and Pattern Recognition (CVPR), pages 3296–3297. IEEE, 2017.
- [26] William P Jenney, Lawrence G Szydlowski, Richard D Ferguson, and Carl A Potaczala. Automatic meter reading system, 1999. US Patent 5,897,607.
- [27] Ming Jin, Ruoxi Jia, and Costas J Spanos. Virtual occupancy sensing: Using smart meters to indicate your presence. IEEE Transactions on Mobile Computing, 16(11):3264–3277, 2017.
- [28] Raymond H Kelley, Richard Christopher Carpenter, Robert H Lunney, and Maureen Martinez. Automated meter reading system, 2000. US Patent 6,088,659.
- [29] Wilhelm Kleiminger, Christian Beckel, and Silvia Santini. Household occupancy monitoring using electricity meters. In Proceedings of the 2015 ACM international joint conference on pervasive and ubiquitous computing, pages 975–986, 2015.
- [30] Wilhelm Kleiminger, Christian Beckel, Thorsten Staake, and Silvia Santini. Occupancy detection from electricity consumption data. In Proceedings of the 5th ACM Workshop on Embedded Systems For Energy-Efficient Buildings, pages 1–8. ACM, 2013.
- [31] Nelson E Knight and David M Banks. Remote meter reading system, 1998. US Patent 5,852,658.
- [32] Fengjun Li, Bo Luo, and Peng Liu. Secure information aggregation for smart grids using homomorphic encryption. In International Conference on Smart Grid Communications, pages 327–332. IEEE, 2010.
- [33] Tsung-Yi Lin, Piotr Dollár, Ross Girshick, Kaiming He, Bharath Hariharan, and Serge Belongie. Feature pyramid networks for object detection. In CVPR, volume 1, page 4, 2017.
- [34] Wei Liu, Dragomir Anguelov, Dumitru Erhan, Christian Szegedy, Scott Reed, Cheng-Yang Fu, and Alexander C Berg. Ssd: Single shot multibox detector. In European conference on computer vision, pages 21–37. Springer, 2016.
- [35] Eoghan McKenna, Ian Richardson, and Murray Thomson. Smart meter data: Balancing consumer privacy concerns with legitimate applications. Energy Policy, 41:807–814, 2012.
- [36] Andrés Molina-Markham, Prashant Shenoy, Kevin Fu, Emmanuel Cecchet, and David Irwin. Private memoirs of a smart meter. In ACM workshop on embedded sensing systems for energy-efficiency in building, pages 61–66. ACM, 2010.
- [37] Kimbel A Nap, Lance A Ehrke, and Donn R Dresselhuys. Automatic meter reading data communication system, 2001. US Patent 6,246,677.
- [38] OpenCV. Open source computer vision, 2018. https://docs.opencv.org/3.1.0.
- [39] Ronald Petrlic. A privacy-preserving concept for smart grids. Sicherheit in vernetzten Systemen, 18:B1–B14, 2010.
- [40] S Raj Rajagopalan, Lalitha Sankar, Soheil Mohajer, and H Vincent Poor. Smart meter privacy: A utility-privacy framework. In International conference on smart grid communications (SmartGridComm), pages 190–195. IEEE, 2011.
- [41] Shaoqing Ren, Kaiming He, Ross Girshick, and Jian Sun. Faster r-cnn: towards real-time object detection with region proposal networks. IEEE Transactions on Pattern Analysis & Machine Intelligence, (6):1137–1149, 2017.
- [42] Lalitha Sankar, S Raj Rajagopalan, and Soheil Mohajer. Smart meter privacy: A theoretical framework. IEEE Transactions on Smart Grid, 4(2):837–846, 2013.
- [43] M Simic, M Spichkova, H Schmidt, and I Peake. Enhancing learning experience by collaborative industrial projects. In ICEER 2016, pages 1–8. Western Sydney University, 2016.
- [44] Ray Smith. An overview of the tesseract ocr engine. In Ninth International Conference on Document Analysis and Recognition (ICDAR 2007), volume 2, pages 629–633. IEEE, 2007.
- [45] M. Spichkova, J. Bartlett, R. Howard, A. Seddon, X. Zhao, and Y. Jiang. SMI: Stack Management Interface. In 23rd International Conference on Engineering of Complex Computer Systems (ICECCS), pages 156–159, 2018.
- [46] Maria Spichkova. Automated analysis of the impact of weather conditions on medicine consumption. In 2018 25th Australasian Software Engineering Conference (ASWEC), pages 166–170. IEEE, 2018.
- [47] Maria Spichkova. Industry-oriented project-based learning of software engineering. In ICECCS, pages 51–61. IEEE, 2019.
- [48] Maria Spichkova, Biao Li, Lachlan Porter, Luke Mason, Ye Lyu, and Yi Weng. Vm2: Automated security configuration and testing of virtual machine images. Procedia Computer Science, 176:3610–3617, 2020.
- [49] Maria Spichkova and Milan Simic. Autonomous systems research embedded in teaching. In International Conference on Intelligent Interactive Multimedia Systems and Services, pages 268–277. Springer, 2017.
- [50] Maria Spichkova, Achal Vaish, David C Highet, Isthi Irfan, Kendrick Kesley, and Priyanga D Kumar. Gosecure: Securing projects with go. In 15th International Conference on Evaluation of Novel Approaches to Software Engineering. SCITEPRESS-Science and Technology Publications, Lda, 2020.
- [51] Maria Spichkova and Johan Van Zyl. Application of computer vision technologies for automated utility meters reading. In Proceedings of the 15th International Conference on Software Technologies (ICSOFT 2020), pages 521–528. SciTePress, 2020.
- [52] Maria Spichkova, Johan van Zyl, Siddharth Sachdev, Ashish Bhardwaj, and Nirav Desai. Comparison of computer vision approaches in application to the electricity and gas meter reading. In ENASE, pages 303–318. Springer, 2019.
- [53] Maria Spichkova, Johan van Zyl, Siddharth Sachdev, Ashish Bhardwaj, and Nirav Desai. Easy mobile meter reading for non-smart meters. In 14th International Conference on Evaluation of Novel Approaches to Software Engineering. IEEE, 2019.
- [54] Chong Sun, Jiongyan Zhang, Cong Liu, Barry Chew Bao King, Yuwei Zhang, Matthew Galle, Maria Spichkova, and Milan Simic. Software development for autonomous and social robotics systems. In International Conference on Intelligent Interactive Multimedia Systems and Services, pages 151–160. Springer, 2018.
- [55] Dan Winter. Methods and systems of reading utility meters and methods and systems of transmitting utility meter data, 2017. US Patent 9,752,895.
- [56] Kanit Wongsuphasawat, Daniel Smilkov, James Wexler, Jimbo Wilson, Dandelion Mané, Doug Fritz, Dilip Krishnan, Fernanda B Viégas, and Martin Wattenberg. Visualizing dataflow graphs of deep learning models in tensorflow. IEEE transactions on visualization and computer graphics, 24(1):1–12, 2018.
- [57] Zhifeng Xiao, Yang Xiao, and David Hung-Chang Du. Exploring malicious meter inspection in neighborhood area smart grids. IEEE Trans. Smart Grid, 4(1):214–226, 2013.
- [58] Sook-Chin Yip, KokSheik Wong, Wooi-Ping Hew, Ming-Tao Gan, Raphael C-W Phan, and Su-Wei Tan. Detection of energy theft and defective smart meters in smart grids using linear regression. International Journal of Electrical Power & Energy Systems, 91:230–240, 2017.
- [59] Jeffery Young, Maria Spichkova, and Milan Simic. Project-based learning within ehealth, bioengineering and biomedical engineering application areas. Procedia Computer Science, 192:4952–4961, 2021.
- [60] Jixuan Zheng, David Wenzhong Gao, and Li Lin. Smart meters in smart grid: An overview. In Green Technologies Conference, pages 57–64. IEEE, 2013.
- [61] Han Zou, Hao Jiang, Jianfei Yang, Lihua Xie, and Costas Spanos. Non-intrusive occupancy sensing in commercial buildings. Energy and Buildings, 154:633–643, 2017.