A detector system for ‘absolute’ measurements of fission cross sections at n_TOF in the energy range below 200 MeV
Abstract
A new measurement of the 235U(n,f) cross section was performed at the neutron time-of-flight facility n_TOF at CERN. The experiment focused on neutron energies from 20 MeV to several hundred MeV, and was normalized to neutron scattering on hydrogen. This is a measurement first of its kind at this facility, in an energy range that was until now not often explored, so the detector development phase was crucial for its success. Two detectors are presented, a parallel plate fission chamber (PPFC) and a recoil proton telescope (RPT), both dedicated to perform measurements in the incident neutron energy range from 30 MeV to 200 MeV. The experiment was designed to minimize statistical uncertainties in the allocated run time. Several efforts were made to ensure that the systematic effects were understood and under control. The results show that the detectors are suited for measurements at n_TOF above 30 MeV, and indicate the path for possible future lines of development.
1 Introduction
The cross section for neutron-induced fission at neutron energies above 20 MeV is of interest for basic nuclear physics [1] as well as for nuclear technology, especially for improving the predictive capability of neutron transport codes [2]. The emission of two kinematically correlated fission fragments with kinetic energies around 80 MeV is a very distinctive signature which makes fission an ideal reference reaction for the measurements of cross sections for other neutron-induced reactions [3]. For this reason, the cross sections for neutron-induced fission of 235U and 238U belong to the set of standard cross sections [4].
While most of the other reference cross sections are standards for selected neutron energy ranges below 20 MeV, the cross sections for 235,238U(n,f) are standards up to 200 MeV. The only other standard in this energy range is the neutron-proton (n-p) scattering cross section. The evaluated uncertainty of the integral and differential cross sections for n-p scattering is smaller than those of all other cross section standards [4]. Therefore, measurements of the fission cross section standards relative to the neutron-proton scattering cross section are of particular importance for reducing the uncertainties of neutron measurements, and there is a constant request for more data from such experiments [5]. Despite its importance for neutron measurements, there is only one experimental data set for the 235U(n,f) cross section at energies above 20 MeV which was determined relative to n-p scattering and has a continuous energy coverage [6]. These data were measured in the 1980s at the Weapons Neutron Research (WNR) spallation neutron source and determine the evaluated cross section in this energy range until today [4].
To cross-check these results and reduce the uncertainty on the evaluation, while also covering the largest possible neutron energy interval, and also to minimize the systematic uncertainties, two detection setups were designed to perform a new measurement of the 235U(n,f) cross section at the n_TOF neutron source of CERN [7]. Except for measurements of fission cross section ratios [8], the energy range above 20 MeV was not explored very much at n_TOF so far. Therefore, the present measurement was the first of this kind at this neutron source. One setup was developed aiming at improving the existing standard, with focus on the neutron energy range below 200 MeV. The other was designed to cover the largest possible neutron energy range, with the goal of extending the measurement to energies higher than 200 MeV. In this paper, they are also referred as the ‘low-energy’ and the ‘high-energy’ experiment.
The two experiments were carried out simultaneously, using the same neutron beam. In both setups, recoil proton telescopes (RPTs) of different designs were employed to measure the incident neutron energy distribution relative to the differential n-p scattering cross section. The fission detector for the low-energy experiment was a parallel-plate fission chamber (PPFC), while parallel-plate avalanche counters (PPAC) were used for the high-energy experiment. Such a measurement is usually termed ‘absolute’, although it is actually a measurement relative to the n-p scattering cross section. Above thermal neutron energies and below the pion production threshold, however, elastic neutron-proton scattering is the only open reaction channel in the neutron-proton system. In principle, the differential scattering cross section can be determined from a relative measurement of the angular distribution of recoil protons and a determination of the total cross section, which only requires a relative measurement as well. Although experimental details are a bit more complicated, this may justify calling the present experiment an absolute measurement.
In the energy range below 20 MeV, two measurements of fission cross sections [9, 10] were carried recently using monoenergetic neutrons and primary reference instruments for neutron fluence measurements. These instruments are compared to each other in regular key comparisons [11]. Hence, their uncertainty budget is well known and small remaining uncertainties can be achieved. A similar achievement is expected from the planned experiment by using two simultaneous but independent measurements to check for consistency and identify sources of systematic uncertainties.
The present publication reports about the technical design of the low-energy experiment and the properties of the detectors used. The decision to optimize the setup for the energy region from 30 MeV to 200 MeV was motivated by several reasons. Nuclear model codes such as GNASH, EMPIRE and TALYS used for producing the data libraries for neutron transport codes extend up to this energy while the intranuclear cascade (INC) model becomes applicable above this energy. From the practical point of view, the neutron energy range of interest in radiation protection and technological applications such as the design of accelerator-driven neutron sources extends to about 200 MeV because neutron energy distributions produced by bombardment of stopping-length targets with light ion beams exhibit a broad maximum around 100 MeV in addition to the evaporation peak in the MeV region.
The data shown in this paper were mostly acquired during detector tests. Not all configurations investigated in these runs could finally be used for the cross section measurement. The design of the high-energy experiment is reported in a second paper [12] and the results of the measurements will be reported in forthcoming publications.
2 Experimental setup
The measurements were carried out at n_TOF, the neutron time-of-flight facility of CERN. The pulsed white neutron beam of n_TOF is produced via spallation reactions by protons impinging on a massive lead target with a momentum of 20 GeV/. The protons are extracted from the Proton Synchrotron (PS) accelerator ring at a repetition rate of less than 1 Hz. They are grouped in 7 ns wide bunches formed by about (the so-called ‘dedicated’ pulses) or (‘parasitic’ pulses) particles. The interaction of the PS proton beam with the n_TOF target produces about 300 neutrons per proton which then travel along evacuated tubes to reach the experimental areas where the detection setups are installed. A detailed description of the facility can be found for example in [7] while the characteristics of the lead target and neutron beam are described in [13, 14].
The detectors for the 235U(n,f) cross section measurement were installed in the Experimental Area 1 (EAR1) at a distance of 183 m from the spallation target, where the neutron energy distribution extends from thermal energies up to several hundred MeV. The setup included ten 235U samples, mounted in two reaction chambers, and two polyethylene (PE) samples. The fission detectors were a parallel-plate fission chamber (PPFC) developed by PTB (Physikalisch-Technische Bundesanstalt) and a reaction chamber based on parallel plate avalanche counters (PPACs) developed by IPN (Institut de Physique Nucléaire d’Orsay). The light charged particles emitted from the PE samples were counted using three Recoil Proton Telescopes (RPTs), two designed by INFN (Istituto Nazionale di Fisica Nucleare) and one by PTB. The layout is also shown schematically in figure 1.
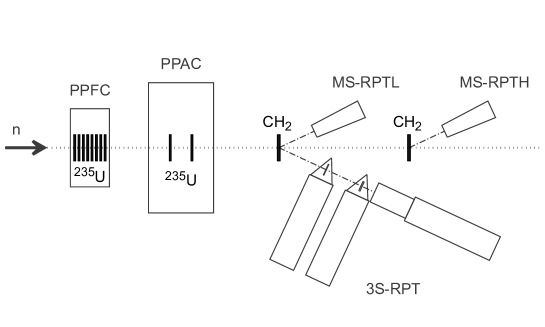
The ‘low-energy experiment’ consisted of the PPFC and the 3S-RPT, a triple-stage telescope composed of two transmission detectors and one stop detector. The reasons behind the choice of these detectors and their design are introduced in section 3. The technical details of the fission chamber and characteristics of the uranium samples are reported in section 4, while those of the polyethylene samples and of the RPT are in section 5.
The fission chamber was installed at about 183 m from the spallation target, the first polyethylene sample was placed about 1 m downstream and the second sample at an additional distance of 50 cm . The triple-stage telescope was mounted at an angle of 25.2(1)° with respect to the direction of the beam. The distance from the center of the radiator and the center of the transmission detectors, and the front face of stop detector, were 206.0(15) mm, 355.0(15) mm, and 410(2) mm, respectively.
The distances between PE samples and detectors were measured with sub-millimeter precision with laser trackers and reflectors positioned at strategic positions, as for example the center of the sample support and the center of the transmission detectors, or the front face of the stop detector, determining at the same time also the angles between beam and telescope axes. The position and direction of the neutron beam was known from previous surveys and measurements with Medipix detectors. The survey was carried out once, at the beginning of the measurement campaign, as it is very time consuming. Every time the setup was modified, e.g. when one of the RPT detectors was replaced, the measurements were controlled again using a rigid ruler with 0.5-mm precision. The frame supporting samples and telescopes was never moved, and whenever possible, the RPT detectors were replaced without removing the PMT from the frame. This resulted in a spread in the repeated measurements that was no more than 2 mm, which was used also to determine the uncertainties on distances and angle.
The alignment of the chambers and the PE samples was checked with Gafchromic films, and it was found that both were slightly off-center with respect to the beam. In the reference system with origin at the PPFC center, with the neutron beam pointing perpendicularly towards it, the beam center was positioned at (-2.5(5) mm, -2.2(5) mm) in the horizontal/vertical plane. As for PE sample, using the same reference system but with origin on the sample center, the beam spot was at (-4.4(5) mm, 16.9(5) mm). Considering the homogeneity of the PE samples and the large transversal size compared to the beam diameter (10 cm by 10 cm compared to a FWHM of less than 2 cm), the main effect of the misalignment for the RPTs was in the calculation of the angle relative to the beam axis, which was anyway determined independently during the laser tracking-system survey. For the fission chamber, this mainly affected the determination of the mass of uranium effectively irradiated with the neutron beam, as discussed in section 4.2.
The beam profile and its energy dependence were measured with the PPAC. The details are presented in [12], but to summarize briefly, the beam profile followed a bell-shaped ‘flat top’ function, with the flat top becoming larger with increasing energy, and a FWHM ranging from 1.6 cm to 1.7 cm.
The data acquisition system (DAQ) at n_TOF is based on SP Devices ADQ412-DC and ADQ14-DC-4C digitizers, with 12-bit and 14-bit resolution and variable sampling rates, set to 1 GS/s for this measurement. The DAQ is synchronized with the operation of PS: the n_TOF proton extraction signal is distributed to the cards as trigger and the detector signals are recorded over a time window that for EAR1 is about 100 ms long, which covers events from the detection of the gamma flash to that of thermal neutrons [15]. The digital waveforms are processed using the Pulse Shape Analysis (PSA) routine described in [16]. The PSA includes algorithms e.g. for pulse recognition, baseline subtraction, and determination of the arrival time of gamma flash and neutron-induced events, and produces files in which quantities such as timestamp, pulse height, or pulse integral are listed for each detected signal.
3 Conceptual considerations
The conceptual design for the low-energy experiment was guided by the goal of achieving sufficiently small statistical uncertainties with the granted number of protons on the n_TOF spallation target, which in EAR1 translates to neutrons with energies between 20 MeV and 200 MeV at the target position, over the beam’s cross-sectional area. With respect to the statistical uncertainty, the fission arm of the experiment sets the main constraint because the efficiency of any fission detector is given by the number of fissile nuclei intercepted by the neutron beam. Usually, this number is limited by the availability of samples of sufficient quality.
For the low-energy experiment, a parallel-plate fission ionization chamber was selected as the detector for fission events. The main advantage of this detector is simplicity. Its efficiency for the detection of fission fragments is close to unity and can be calculated easily if the composition, thickness and homogeneity of the fissile layer are well characterized. The eight available samples had an average 235U mass per unit area of about 300 µg/cm2. For neutron beams smaller than the sample diameter, this detector has a neutron detection efficiency
| (3.1) |
ranging between and for neutron energies between 20 MeV and 200 MeV. Here, denotes the number of neutrons in a given small energy interval, the zero-bias fission fragment detection efficiency and the number of detected fission events, respectively. The number of fissile layers is denoted by , the atomic mass of 235U by , and is the Avogadro number.
The neutron detection efficiency
| (3.2) |
of the recoil proton telescope (RPT) in the n-p scattering arm is determined by the mass per unit area of the polyethylene target (H/C ratio ), the differential proton emission cross section for n-p scattering at the proton emission angle and the solid angle covered by the RPT. The neutron detection efficiency of the RPT should match the neutron detection efficiency of the detector in the fission arm of the experiment detector to minimize the overall statistical uncertainty of the measured cross section ratio.
To reduce background and provide clear signatures for recoil proton events, triple-stage telescopes with two transmission () detectors and one stop () detector were used to identify recoil protons emitted from a polyethylene target, the so-called radiator. The neutron energy range covered by a RPT is limited by the thickness of the transmission detectors and the thickness of the radiator. The energy loss of the recoil protons in these elements should be small enough to avoid excessive energy and angular straggling of the protons. It should also leave enough kinetic energy to produce a clear signal in the stop detector. On the other hand, the signal in the detectors must be large enough to avoid losing valid recoil proton events below the noise level. The thickness of the radiator should increase with neutron energy to compensate for the decrease in the n-p scattering cross section and keep the recoil proton yield almost constant. These design constraints made it necessary to construct three different RPTs for overlapping energy ranges from 30 MeV to 80 MeV, 50 MeV to 100 MeV and 80 MeV to 150 MeV with neutron detection efficiencies ranging between and .
Neutron-induced reactions on the carbon nuclei in the PE targets of the RPTs will produce a background of protons and deuterons from 12C(n,px) and 12C(n,dx) reactions. While deuterons can be discriminated using the differential energy losses in the transmission detectors, protons have to be subtracted by supplementary measurements using matched graphite targets anyway. Hence, the demand on the particle discrimination properties of the RPTs are not very stringent.
The geometrical arrangement of the RPT, especially the emission angle of the recoil protons, is an important parameter for the uncertainty of neutron fluence measurements relative to the differential n-p scattering cross section. With respect to the uncertainty of the reference cross section, a proton emission angle of zero degree would be desirable because the majority of the data used for the phase shift analyses are for backward scattering of neutrons in the center-of-mass system. Hence, the uncertainty of the phase shift solutions is expected to be smaller than for smaller neutron scattering angles, although a precise statement about the uncertainty of the phase shift solutions is still lacking [17].
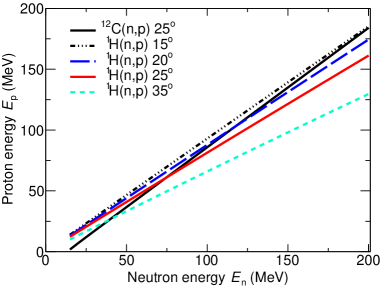
In the past, RPT configurations at zero degree were used at quasi-monoenergetic sources up to 100 MeV [18] and at spallation sources for energies up to 30 MeV [19]. In such configurations, an annular radiator is used and the RPT detectors must be shielded behind a massive shadow bar. This was not considered a viable option for an experiment at EAR1 of n_TOF because background problems were expected, and the simultaneous use of two telescopes would have been impossible. Moreover, the size of the available 235U samples (see below) made it necessary to use a collimator that limited the beam diameter to about 16 mm (FWHM). It is almost impossible to realize a zero-degree RPT in such a narrow beam. Therefore, a proton emission angle of 25 degrees in the laboratory system was selected for the present experiment, which allowed the RPT detectors to be placed outside of the neutron beam. An important aspect for the selection of the proton emission angle is the overlap of protons from reactions in carbon nuclei with the recoil proton. This is illustrated in figure 2 which shows the maximum proton energy from 12C(n,p)12B and n-p scattering for various emission angles. Only for emission angles smaller than 15 degrees it is possible to avoid interference of the two proton energy distributions for neutron energies up to about 200 MeV. For the emission angle of 25 degrees selected in the present experiment the recoil protons are only separated from the 12C(n,p) contribution up to a neutron energy of 70 MeV.
Because of a lack of space in the experimental area, it was impossible to use the three RPTs simultaneously. Instead, only one RPT could be used together with the PPFC at a time and the reduced number of neutrons available for one RPT had to be compensated by an increased efficiency, i.e. a larger solid angle covered by the telescope.
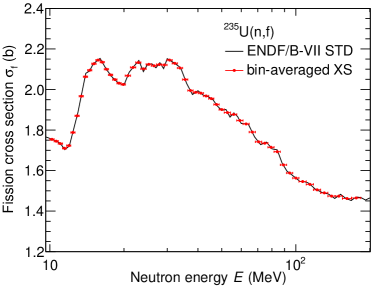
The energy resolution required for the present experiment is determined by the energy dependence of the 235U(n,f) cross section while the n-p scattering cross section is smooth and does not pose tight restrictions. As shown in figure 3, a five percent energy resolution is sufficient to resolve the structures for neutron energies between 20 MeV and 50 MeV. At higher energies, the cross section is rather smooth which allows increasing the required resolution to seven percent at 200 MeV. With this binning and for beam pulses with protons, the number of neutrons per energy bin varies between per beam pulse at 20 MeV and at 200 MeV. It should be noted that the energy resolution required by the 235U cross section is still larger than the energy resolution of the neutron beam for a given flight time which is determined by the duration of the proton beam pulse of about 7 ns. At a neutron energy of 200 MeV this translates into an energy resolution of about 5 MeV, i.e. 2.5 %. At lower energies, the energy resolution of the neutron beam becomes even smaller.
The energy range covered by the low-energy experiment is limited by the maximum proton energy which could be stopped in the last detector. For a given maximum length of the stop detector, the energy range could be extended by using larger scattering angles which would reduce the energy of the recoil protons at a given neutron energy. However, this would require separate measurements with this configuration, which was incompatible with the allocated run time, or a second dedicated telescope, which was ruled out by the available space. As shown in figure 2, a larger scattering angle would also increase the interference of recoil protons and protons from 12C(n,p) reactions.
As for every bremsstrahlung or spallation neutron source, the high-intensity prompt gamma flash determines the maximum neutron energy which can be handled with a given detector technology without significant saturation problems. The distance between the spallation target and the measurement position at EAR1 of n_TOF is about 183 m. At this distance, a neutron energy of 200 MeV corresponds to a time difference between the arrival of the gamma flash and the neutrons of about 400 ns. Hence, all detectors must recover from saturation effects induced by the gamma flash within this time. This requires low-mass designs and the use of low- materials to reduce the photon detection probability.
4 Parallel-plate fission chamber
4.1 Design
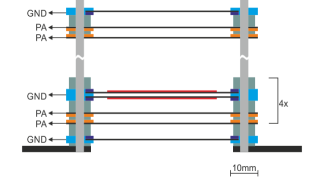
Figure 4 shows the layout of the PPFC. The focus of the PPFC design was to keep the mass intercepting the neutron beam at minimum to avoid saturation effects induced by the gamma flash and the high instantaneous neutron rate at high energies. The detector consists of a stack of eight fissile samples with a diameter of 42.00(3) mm and 235U masses per unit area ranging between 264 µg/cm2 and 372 µg/cm2. The backings of these samples are aluminum foils 30 µm in thickness which is much larger than the range of fission fragments in aluminum, i.e. the backings are ‘thick’. The foils are glued to 1 mm thick aluminum rings with inner and outer diameters of 49 mm and 52 mm, respectively. Two samples were inserted back-to-back in an aluminum holder ring 70 mm in diameter and 3 mm in thickness. The holder rings were connected to ground potential, i.e. the samples acted as cathodes. The anodes facing the samples consisted of 20 µm aluminum foils glued to rings made of fiber-reinforced plastic material (G10), 1 mm in thickness and with inner and outer diameters of 49 mm and 70 mm respectively. The thickness of the anode foils was sufficient to just stop fission fragments emitted from the adjacent fissile layer. The cathode and anode foils were held at a distance of 5 mm by six PEEK spacers. Four stacks containing two cathodes and two anodes each were stacked on top of each other with spacers between the adjacent anode such that the distance between the anode foils was 3 mm. Below and above the stack two cathodes with blank samples and the corresponding anodes were mounted. The whole stack was held together by six 3 mm Trovidur rods and plastic nuts.
The stack was mounted in a stainless steel vacuum chamber with Kapton windows 60 mm in diameter and 50 µm in thickness. The fission chamber was operated with Ar/CF4(10 vol%) at ambient pressure and a regulated gas flow rate of about 15 ml/min. Including the counting gas, the total mass per unit area intercepted by the neutron beam amounted to 147 mg/cm2. The ten anodes of the PPFC were biased at +230 V to maximize the drift velocity of the electrons [20]. Each anode was connected to a separate Canberra 2006 charge-sensitive preamplifier with a sensitivity of 235 mV per ion pairs. Hence, assuming a mean energy of 24 eV required to create an electron-ion pair, about 14 fission fragments could be detected simultaneously (within a time interval of about 50 ms, i.e. the decay time constant of the preamplifier) without saturating the preamplifier. This is sufficient for the expected number of fission events induced per proton beam pulse by neutrons with energies above 10 MeV. The preamplifier signals were fed into ORTEC 474 timing filter amplifiers, shaped to pulses with a width of about 130 ns (FWHM) and then digitized using the n_TOF data acquisition system.
The response of the PPFC to the n_TOF gamma flash was calculated with MCNPX [21] using the energy distribution of prompt photons from [14] as input. In these simulations photon and electron transport was switched on and the production of secondary bremsstrahlung was sampled in the analog mode. The energy deposition in each cathode - anode gap was calculated and compared with the maximum energy deposition resulting from fission fragments. The results showed that for beam pulses with the maximum number of protons the signal induced by the gamma flash amounts to about 30 % of the maximum signal expected for a fission fragment. The number of photofission events induced by the gamma flash in one fissile layer is about per proton beam pulse of protons. In summary, these results demonstrate that the energy deposition induced by the n_TOF gamma flash does not pose a significant challenge for the PPFC setup for this experiment.
4.2 Characterization of the uranium targets
The uranium deposits were provided by the EC Joint Research Centre in Geel (JRC-Geel). They were prepared via molecular plating from a solution of UO2(NO3)2 in isopropanol [22]. The enrichment of the isotope 235U was 99.9336(14) %. A mask 42.00(3) mm in diameter was used to define the size of the samples. The mass of each deposit was determined from the activity, measured via alpha counting, and the isotopic composition was measured by mass spectrometry. The diameter of the deposits was not measured directly, so for the average mass per unit area the diameter of the mask was used.
In [22], the chemical composition of deposits produced with the same technique is discussed; from their analysis it resulted that the samples obtained by molecular plating are not pure oxide, but contain traces of other elements, for example carbon. The morphology was also studied; it was found that deposits produced by molecular plating present a maze-like cracking pattern, with huge fluctuations on the local density for scales of the order of 10 µm. All these information were included in our considerations for the determination of the detection efficiency of fission fragments in section 4.3.
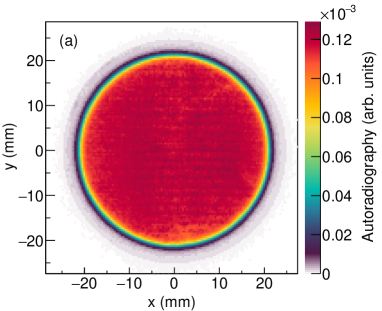
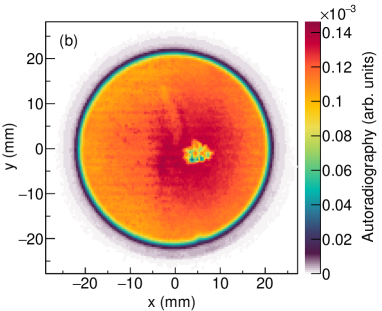
To determine the uniformity of the layers of fissile material, autoradiographies of all samples were produced by placing the samples on top a FUJIFILM BAS-IP MS storage phosphor screen at a distance of 1 mm. In figure 5, the digital scan of two autoradiographies is shown, selected to represent the variability among samples. As expected, the samples are not perfectly uniform: they are thinner at the borders and thicker in the center, the width of the borders varying from sample to sample. In some cases, irregular structures which were not evident by visual inspection were also revealed; that was the case for example for the sample shown in figure 5(b).
Considering the non-uniformity of the samples and the beam profile, the amount of fissile material effectively irradiated by the neutron beam cannot be simply determined from the average mass per unit area. A correction factor was therefore calculated as the convolution of the autoradiography images with the beam profile measured for neutron energies above 30 MeV:
| (4.1) |
where is the nominal radius of the deposits. The neutron beam profile was measured with the PPAC detector [12], while the alignment of the samples with respect to the axis of the beam was carried out using Gafchromic films. The uncertainty on was determined by varying the position of the neutron beam relative to the sample, and trying different parametrizations for (as for example the parametrizations obtained for neutron energies below 30 MeV). The results for each sample are reported in table 1. It was found that, globally, the non-uniformity of the samples and the beam resulted in a correction factor of 1.075 on the 235U areal density.
| Sample | ||||
|---|---|---|---|---|
| µg/cm2 | µg/cm2 | |||
| U1 | 337.6(21) | 1.058(21) | 503(16) | 0.901(3) |
| U2 | 316.5(20) | 1.033(9) | 510(18) | 0.900(4) |
| U3 | 264.1(17) | 1.044(9) | 344(14) | 0.9325(27) |
| U4 | 282.9(18) | 1.094(26) | 295(15) | 0.9418(29) |
| U5 | 289.4(18) | 1.086(19) | 402(20) | 0.921(4) |
| U6 | 279.1(18) | 1.083(14) | 415(17) | 0.918(4) |
| U7 | 280.5(18) | 1.105(26) | 560(18) | 0.889(4) |
| U8 | 307.3(20) | 1.101(17) | 550(21) | 0.892(4) |
4.3 Fragment detection efficiency
The main advantage of a PPFC for the measurements of fission cross sections compared with a parallel-plate avalanche counter is the large detection efficiency for fission fragment which is usually above 90 %. In a PPFC, only fragments emitted almost parallel to the fissile layer lose such a large fraction of their kinetic energy in the layer that the signal produced by the drifting secondary electrons falls below the detection threshold which is given by the maximum signal produced by alpha particles, recoil nuclei from neutron-induced reaction in the backing or electromagnetic noise.
The calculation of the fragment detection efficiency can be carried out by analytical formulas [23] or using the Monte Carlo method. In addition to energy-loss data for the fissile layer, this requires knowledge of the kinematic properties of the fission fragments, i.e. the angular distribution of the fission fragments in center-of-mass system and the partial transfer of linear momentum from the incident neutron to the fissioning compound nucleus.
The analytical formulas given in [23] are sufficient for calculating the probability that at least one of the two fragments deposits energy in the counting gas, the so-called zero-bias efficiency. The key assumption behind these formulas is that of a homogeneous fissile layer with well-determined stoichiometry. As discussed above, this assumption is not valid for the samples used for the present experiment. Moreover, the zero-bias efficiency is always several percent larger than the efficiency for a finite pulse-height threshold imposed by the experimental constraints which requires an extrapolation of the experimental pulse-height distribution to zero pulse height.
For the calculation of the zero-bias efficiency the effective mass was treated as an adjustable parameter that was determined from a comparison of experimental pulse-height distributions with predictions of a dedicated Monte Carlo model of a PPFC. Mass, charge and kinetic energy distributions of fission fragments were obtained from the GEF code [24] for neutron energies between 25.4 meV to 100 MeV, the maximum neutron energy in GEF. Above this energy the data for 100 MeV were used. In the energy range between 20 MeV and 200 MeV, experimental data for the angular distribution of fission fragments are available for 235U(n,f) [25, 26, 27]. Data for the effect of the partial transfer of linear momentum were taken from results for 235U(p,f) [28]. The energy loss of the fission fragments in the fissile layer and the counting gas were calculated using energy-loss or range data from the SRIM2013 code [29]. The effective stoichiometric composition of the layers was an average of the results reported in [22].
Correlated pairs of fragments were started at a random depth in the fissile layer and transported into the backing or into the gas volume. The charge induced on the anode by the drifting electrons was calculated in the usual way by applying the Shockley-Ramo theorem [30] and assuming a homogeneous electrical field is
| (4.2) |
where , and denote the mean energy required to produce an electron-ion pair, the anode-cathode distance, and the elementary charge, respectively. denotes the differential energy loss in the counting gas of a fission fragment with kinetic energy and is its range after leaving the fissile layer with kinetic energy . The angle of the fragment relative to the normal on the cathode and the distance along the fragment trajectory are denoted by and , respectively. Eq. 4.2 applies to fragments stopped in the counting gas. Wall effects are accounted for by restricting the integration to the distance traveled in the counting gas. The ionization quenching observed for fission fragments in Ar/CF4(10 vol%) gas [31] was included in the simulation. The electronic resolution of the whole signal processing chain is accounted for by folding the simulated pulse-height distributions with a Gaussian of constant relative width. The relative widths were adjusted individually for each signal-processing chain.
The adjustment of the effective thickness of the fissile layers was carried out for a neutron energy window around the thermal point at 25.4 meV, i.e. about 83 ms after the gamma flash, because electronic distortions induced by the gamma flash vanished at this large time of flight. Moreover, the angular distribution of the fission fragments is isotropic at thermal energies.
As shown in figure 6, an adjustment of the mass per unit area leads to a satisfactory agreement over the full pulse-height range, including the region above the maximum which contains fragments leaving the fissile layer at angles close to 90°. The effective 235U masses per unit area and the corresponding zero-bias fragment detection efficiencies of the PPFC for thermal neutrons are indicated in table 1. The comparison of experimental and calculated pulse height distribution also confirms that the usual constant extrapolation of the pulse-height distribution in the region dominated by alpha particles and noise can also be carried out for the present samples (see section 4.4).
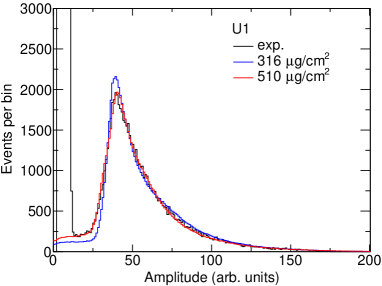
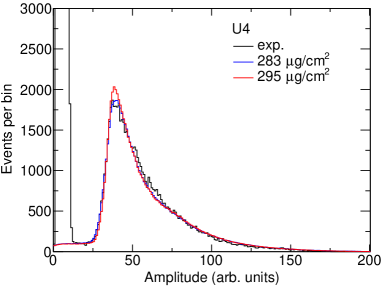
For the sample shown on the left side of figure 6 the effective mass exceeds the nominal mass by about 60 %. In contrast, there is only a slight deviation between the effective and the nominal mass for the sample shown on the right side. This shows that the ‘cracky’ microstructure of the layers obviously varies from sample to sample. It should be noted that this analysis is only sensitive to the cumulative effect of the fissile mass per unit area, the stoichiometric composition of the fissile layer and the range data for fragments in the fissile layer. However, range data for fission fragments calculated using the earlier version SRIM2008 were found to exceed experimental data by not more than 10 %-20 % [32] which is insufficient to explain the observed discrepancies. Therefore, the majority of the observed deviations must be due to the imperfections of the surface structure.
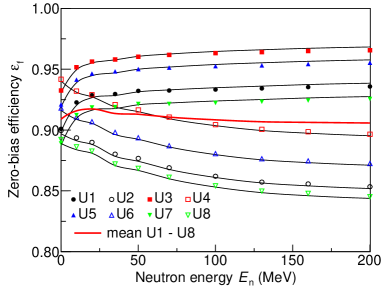
Figure 7 shows the fragment detection efficiency as a function of neutron energy for all 235U layers used in the low-energy experiment. Results are shown for the neutron incident from the layer and backing side. The difference between the two orientations reflects the effect of the partial transfer of linear momentum. This effect almost cancels if an equal number of samples with either orientation and similar mass per unit area is used.
The zero-bias efficiencies calculated using the Monte Carlo model are compared with Carlson’s analytical formulas [23]. The good agreement confirms that the analytical approach can be used to propagate the uncertainties of the various influence quantities to the total uncertainty of the zero-bias efficiency.
4.4 Data acquisition and analysis
The main problem that had to be solved via data analysis was the subtraction of the ringing noise generated in the interaction with the gamma flash. The gamma flash signal was not very intense per se, however it was followed by strong oscillations which were hindering the discrimination of alpha particles (low amplitude signals) and fission fragments (high amplitude signals) for about 5 µs. At 183 m distance from the neutron source, a time of flight of 5 µs corresponds to about 5 MeV in neutron energy, i.e. the disturbance was affecting the entire time interval of interest. The electromagnetic interference could be partially reduced by improving the grounding and the electric shielding of chamber and preamplifiers but, as it can be seen from figure 8(a), that was not sufficient to obtain a clean signal, and therefore the baseline distortion had to be corrected numerically during the waveform post-processing.
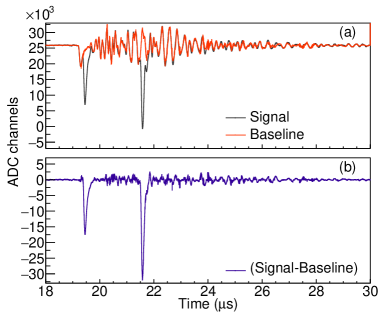
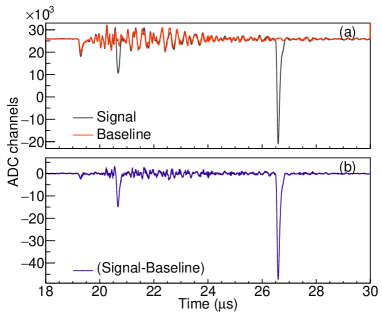
The amplitude of the oscillations was correlated with the intensity of the gamma flash, the shape however was found to be independent from the beam and rather being a feature of the electronics, as it was always the same at every beam pulse. By summing the first 12 µs of consecutive (arbitrarily chosen) signals, it was possible to filter out the signals from low probability events (alpha particles from radioactive decay, fission fragments from high-energy neutrons) and therefore to determine, in average, the shape of the ‘distorted baseline’. The baseline subtraction could be then carried out as usual with the PSA routine, with the sole caution of introducing a scale factor to take into account that noise amplitude was a function of the gamma flash intensity.
The subtraction, as shown for example in figure 8(b), did not completely cancel out the noise, but the pulse height of the residual fluctuations was similar or lower than that of the -particle signals, which was enough for the analysis purposes. As it can be seen in the figure, the gamma flash signal was also suppressed in this procedure, but that was not an issue as the PSA determined its timestamp before proceeding with the baseline subtraction. Beside the arrival time of the gamma flash (), and the baseline subtraction, the PSA determined also the timestamp of the pulses following the flash (), the pulse height, and the pulse integral (later denoted as , area), which is proportional to the charge induced on the anodes.
The time of flight of the neutrons was then obtained as:
| (4.3) |
where is the speed of light in vacuum, and is the flight path from neutron source to fission chamber. To take into account the spread in time caused by the moderation process inside the lead target following the neutron production, the conversion from time-of-flight to neutron energy was carried out following the procedure explained e.g. in [14]. The neutron velocity was therefore calculated considering the effective flight path:
| (4.4) |
where is the so-called neutron moderation distance, determined in extensive Monte Carlo simulations of the n_TOF spallation target. Finally, the neutron energy was calculated using:
| (4.5) |
in an iterative procedure. Here denotes the neutron mass. The value of in equation 4.3 was calibrated using as reference the position of the resonances in the 235U fission cross section between 200 eV and 300 eV reported in the ENDF/B-VIII.0 library. Summing and subtracting and in equation 4.4 was an expedient to avoid determining the relationship between and the scoring plane in the simulations.
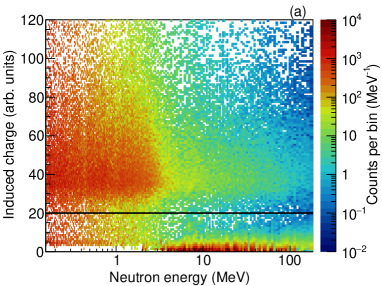
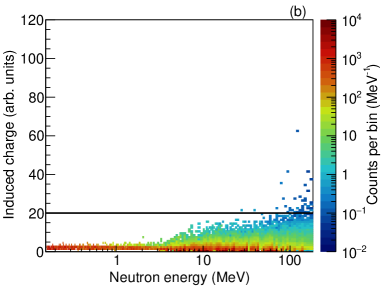
In figure 9 the pulses recorded for the uranium target U1 and the blank target B1 are sorted by area, or induced charge, and neutron energy. The residual noise that the baseline subtraction did not completely suppress is still noticeable, however the fission fragments are clearly separated. In case of the blank target, the events above threshold (the red line in the figure) are the product of neutron-induced light charged particle emission from aluminum. The threshold that was chosen to separate noise from (n,f) events (and light charged particles emitted in n-Al reactions) was different for every target as the noise level and the settings of the electronic chain were slightly different for each read-out channel.
The number of fission fragments detected for a given uranium sample as a function of time-of-flight or kinetic energy was obtained by summing the events with area above the noise threshold , and subtracting the contribution from the blank targets:
| (4.6) |
where and denote the integrated number of events above the pulse-height threshold for the uranium sample and the two blank samples, respectively, and is the dead-time correction.
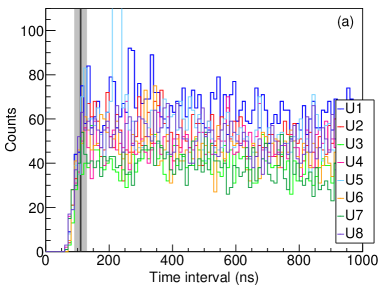
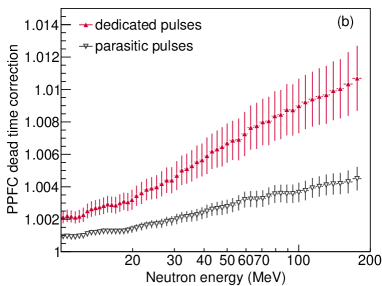
The dead-time correction was determined as a function of the time of flight using the method outlined in [33]. It is based on the assumption that all neutron pulses have the same intensity, which means that events produced by parasitic and dedicated PS proton pulses were treated separately. The dead time of 110(20) ns was obtained from the distribution of the time intervals between consecutive events, shown in figure 10(a), by taking the shortest time for which the recorded time-interval distribution differed less than 10 % from the expected exponential behavior. There were slight variations from sample to sample, but they all fell within the uncertainty. In figure 10(b) the average correction for the eight uranium samples is shown for both dedicated and parasitic pulses. The effect ranges from 0.1 % at low energy up to 1.1 % at high energies, with an absolute uncertainty of 0.2 % at worst.
The fission reaction yield, normalized by the number of 235U atoms per unit area, was then calculated as:
| (4.7) |
where . Here, denotes the Avogadro number and the atomic mass of 235U. The number of uranium atoms per unit area and its correction were discussed in section 4.2. The detection efficiency for fission fragments is the combination of two components, the zero-bias efficiency , introduced in section 4.3, and threshold-dependent correction factor to the efficiency , which takes into account the fact that the fission fragments distribution extends also below the threshold used for the separation from the noise. The fission reaction yield of the eight deposits replaces the product in equation 3.3.
To extrapolate the number of fission events below threshold, the Monte Carlo model for the transport of the fission fragments through the chamber (section 4.3) was used to obtain the shape of the pulse height distribution as function of the incident neutron energy. For each sample, and for each energy bin, the simulations were fit to the experimental histograms using only the events above the threshold. The results were then used to calculate the number of fission events below threshold and . The fit was carried out using ROOT-v6.18/04 [34] because it allows to analyze large amount of data efficiently. To quantify the uncertainty, however, the same fit was repeated, for a selected number of neutron energies, using also WinBUGS [35]. WinBUGS is Bayesian analysis software that uses Markov Chain Monte Carlo to fit statistical models, as for example measurement error models. The main advantage is that it produces the probability distributions of the model parameters, not only point estimates, which means that compared to analytical methods, the determination of the uncertainties is more robust.
Figure 11 shows for example the result of the fit of the pulse height distribution measured with thermal neutrons to that corresponding to incident energies from 103 MeV to 110 MeV. The fit was performed with both Root and WinBUGS, and the experimental thermal distribution was used instead of simulated energy-dependent distributions for the sake of simplicity. The fit model included a normalization factor, to match the number of events above threshold, and a linear adjustment of the horizontal scale (gain and offset), which was introduced to estimate if the gamma-flash-induced noise had any effect on the shape of the distribution at high energies.
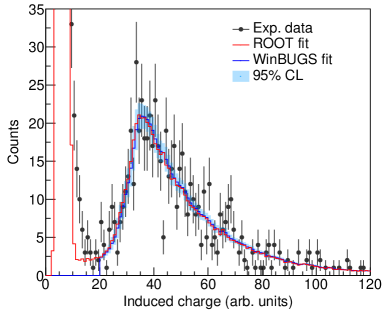
The fits performed with the two codes were always in agreement within the 95 % confidence level determined by WinBUGS. Moreover, within the uncertainties calculated with WinBUGS, there was no evidence of changes in gain or offset at all energies. The uncertainty on the normalization factor, which ultimately defines the uncertainty of the extrapolation of the events below threshold, was found to range from 2 % to 4.5 %; on average it was determined to be about 3 %.
5 Recoil proton telescope for flux measurements
5.1 Design
The design of the present RPTs was inspired by earlier experiments at ‘white’ [36] and quasi-monoenergetic [37, 38] neutron sources. In the latter two experiments, the use of a triple-coincidence requirements was crucial to suppress background and provide a clear signature for recoil proton events. For the present experiment, the surface barrier detectors, proportional counters and multiwire chambers used in [37] and [38] were replaced by fast plastic scintillators to reduce the sensitivity to photons from the gamma flash and increase the time resolution.
The transmission detectors consisted of square EJ 204 plastic scintillators. The lateral dimensions of the front transmission detector () were 45 mm 45 mm. The rear transmission detector () had lateral dimensions of 38 mm 38 mm. Detectors with thicknesses of 0.5 mm, 1 mm, 2 mm and 5 mm were used for different energy regions. The stop () detectors were cylindrical EJ 204 scintillators with a diameter of 80 mm and lengths of 50 mm, 75 mm, 100 mm and 150 mm.
As shown in figure 1, the scintillators of the detectors were mounted in tent-like housing using 4 mm lucite pins to fix the scintillators to the triangular parts of the housing. The charged particles produced in the radiator traverse the detectors through the square parts of the housing which consist of 0.2 mm thick aluminum foils. The inner surfaces of the housings were painted with diffusively reflecting white EJ 510 paint. The bottom of the housings had a circular opening for conical light guides made from UV-transparent polymethylmethacrylate (UVT-PMMA). The distance between the surfaces of the light guides and the lower edge of the scintillator were 7.5 mm () and 11 mm (), respectively. The light guides were 45 mm long and tapered from 60 mm to 50 mm. On the narrow side they were coupled to Valvo XP2020Q photomultipliers (PMTs) using silicone grease.
The cylindrical detectors were coupled to XP2020Q PMTs via conical light guides made from UVT-PMMA which tapered from 80 mm to 54 mm. The front face and the curved surface of the cylinders as well as the upper part of the light guides were coated with EJ510 paint. The detectors were mounted in cylindrical thin-walled aluminum housings which had 0.2 mm aluminum front windows.
The optical transport of scintillation light in the detectors was investigated for all detectors using 511 keV -rays from an actively collimated 22Na source. The active collimation was achieved by requesting a coincidence with an event in a 2"2" BaF2 detector about 1.5 m away from the source. Scans of the detectors along the cylindrical axis of the light guide and perpendicular to the square surface of the scintillator showed that the light collection efficiency decreased linearly by about 12 % from the bottom of the scintillator to the top. Perpendicular to this direction and along the square surface the variation of the collection efficiency was 6 %. For the 100 mm detector, a scan along the cylindrical axis showed a linear decrease of the collection efficiency of about 20 % from the front side to the PMT. These data went into the Monte Carlo models used to calculate the efficiency of the RPTs.
The different detectors were combined to four RPTs for different energy ranges (see table 2). The distance of the center of the and detectors from the center of the radiator were 206 mm and 355 mm, respectively. The front surface of the detector was located 55 mm behind the center of the scintillator. In all RPT configurations, the scintillator had the smallest cross-sectional area and determined the solid angle covered by the RPT when triple coincidences were requested. The geometric trajectories from any point on the radiator surface within the neutron beam profile to any point on the surface of the scintillator were always hitting the surface of the scintillator, i.e. a loss of coincident events can only occur due to angular straggling which was accounted for in the Monte Carlo models of the RPTs. The large cross-sectional area of the detector compared with the detector helped to reduce incomplete energy deposition in the detector, especially at higher proton energies. The large spatial separation between the and detector effected an angular acceptance of the RPTs of about 15 degree in the scattering plane which helped to suppress background originating from other parts of the experiment outside the radiator, e.g. from the PPFC or the two detectors of the high-energy experiment.
1) This configuration could not be employed for the final experiment because of time restrictions.
| Config. | Energy range | Radiators | ||||
|---|---|---|---|---|---|---|
| mm | mm | mm | ||||
| 1 | 25 MeV - 100 MeV | PE 1 mm, | C 0.5 mm | 0.5 | 0.5 | 50 |
| 2 | 35 MeV - 100 MeV | PE 2 mm, | C 1 mm | 1 | 1 | 50 |
| 3 | 50 MeV - 150 MeV | PE 5 mm, | C 2.5 mm | 2 | 2 | 100 |
| 4 | 75 MeV - 200 MeV 1) | PE 10 mm, | C 5 mm | 2 | 5 | 150 |
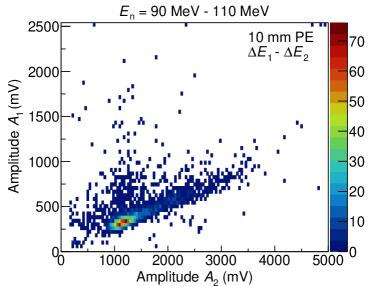
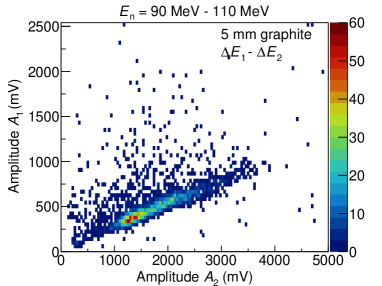
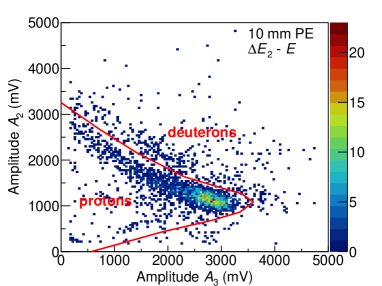
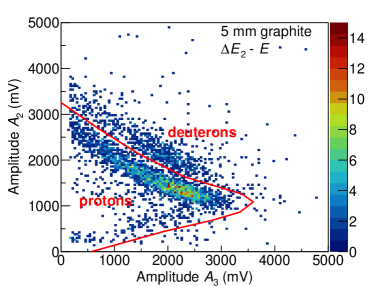
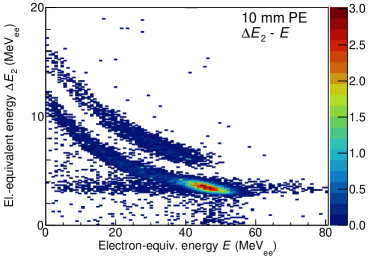
Figure 12 shows the and event distributions obtained during the test experiments with a 2 mm - 5 mm - 75 mm detector combination and 10 mm polyethylene and 5 mm graphite radiators. The neutron energy regions were restricted to windows from 90 MeV to 110 MeV. The event distributions are clearly separated from the base lines, i.e. loss of events close to the noise level can be excluded. The ridges in the distributions with proton events from n-p scattering and 12C(n,px) and deuteron events from 12C(n,dx) are clearly visible although the separation of protons from deuterons is not perfect due to the spatial variation of the light collection efficiency. Therefore, a conservative separation cut must ensure that no protons events are lost. The remaining deuteron events from 12C(n,dx) reactions leaking into the proton region must be subtracted together with the proton events from 12C(n,px) using the graphite sample.
A crucial aspect of for the calculation of the neutron detection efficiency of the RPTs is the definition of the solid angle using the detector. Due to edge effects, i.e. incomplete energy deposition by protons leaving the detector through the edges, such events could be lost below the pulse-height threshold. As a consequence, the effective cross-sectional area of the detector would be smaller than the geometrical one. Such effects were studied in more detail using single-ion proton beams at the PTB micro ion beam facility.
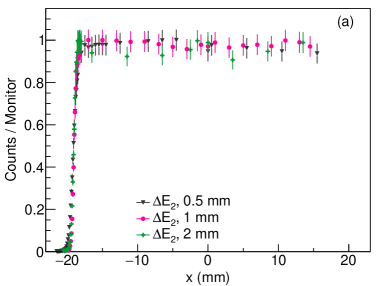
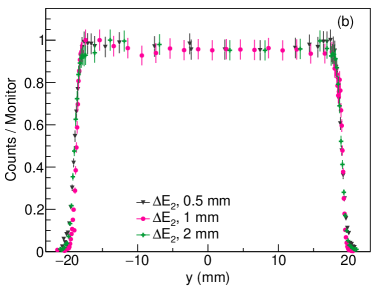
At this facility magnetic lenses are used to focus a charged particle beam, protons or particles, to a diameter of a few micrometers. To scan the scintillators, a proton beam of 15 MeV was used. The detectors were positioned in air at the distance of a few centimeters from the exit window of the beamline. They were mounted on a motorized stand programmed to move in steps of 10 µm along the axes and of the plane normal to the beam direction. Along the -axis, which corresponded to the PMT axis, the scan was not performed edge-to-edge but had to be stopped mid-way because otherwise the detector housing would have hit the beamline. The scintillator count rate was recorded, normalized by the beam monitor, as a function of the (,) coordinates. In figure 13, the profiles along the and axes are shown for the scintillators of 0.5 mm, 1 mm, and 2 mm thickness. These were obtained by averaging the single measurement points at a given or , excluding the corners of the detectors. These results were therefore included in the model for the calculation of the RPT efficiency, as described in section 5.3.
5.2 Polyethylene radiators
Table 3 summarizes the main characteristics of the polyethylene and graphite samples used as radiators during the 235U(n,f) cross section measurement at the upstream position.
| Sample | Thickness | Density | Areal density | |
|---|---|---|---|---|
| (mm) | g/cm3 | g/cm2 | (rel. unc.) | |
| PE 1 mm | 1.025(4) | 0.9534(20) | 0.0978(4) | (0.4%) |
| PE 2 mm | 1.824(11) | 0.9555(20) | 0.1743(11) | (0.6%) |
| PE 5 mm | 4.925(4) | 0.9597(20) | 0.4726(11) | (0.2%) |
| C 0.5 mm | 0.500(4) | 1.7749(27) | 0.0887(8) | (0.9%) |
| C 1 mm | 1.000(5) | 1.7364(86) | 0.1736(12) | (0.7%) |
| C 2.5 mm | 2.500(4) | 1.7512(32) | 0.4378(11) | (0.3%) |
The polyethylene samples were characterized at PTB. The density was measured by the Working Group ‘Solid State Density’ by hydrostatic weighing. The thickness of the samples was measured by the Working Group ‘Scientific Instrumentation’ using two touch probes (manufactured by HEIDENHAIN) and a measuring stand (Mahr), which allowed to map the sample lateral profile by measuring it from both sides simultaneously. Since the information of the orientation of the radiator during the beamtime was lost, the thickness values in table 3 were obtained by calculating the average thickness over the surface excluding the measurement points within 1 cm from the border. The uncertainty was obtained as the difference between maximum and minimum value.
The elemental composition and the stoichiometric relation of hydrogen to carbon atoms was independently measured by the ZEA-3 unit at the Forschungszentrum Jülich and the Institute for Inorganic and Analytical Chemistry at the Technische Universität Braunschweig. In both cases, combustion analysis was used to determine the amount of carbon and hydrogen. Since the analysis is destructive, even if it requires only a few milligrams of material, it was performed only after the cross section measurement. The stoichiometric ratio between hydrogen and carbon was found to be 1.98(3) and 2.00(3), i.e. it is compatible with the nominal stoichiometry within an uncertainty of about 1.5 %.
The graphite samples were only required to subtract those background protons not resulting from n-p scattering which were detected in the pulse-height region covered by the recoil proton peak. Hence, the uncertainty of the carbon mass per unit area had a less important impact on the uncertainty of the fission cross section. Therefore, dimensional measurements using a caliper and weighing on a precision balance were considered sufficient to determine the mean mass per unit area for the graphite samples.
5.3 Efficiency
The neutron detection efficiency of low-energy recoil telescopes with very thin radiators and detectors can be calculated semi-analytically by integrating over all geometric trajectories involved in the problem, neglecting the effect of angular straggling [39]. For high-energy RPTs this is not a viable option because thicker radiators must be used to compensate the decrease in the n-p scattering cross section. Moreover, the increased ranges of charged particles make edge effects much more important than at lower energies. Therefore, a detailed Monte Carlo model is required to account for such effects. For the present experiment, MCNPX ver. 2.7 [21] was chosen for simulating the transport of neutrons and charged particles in the RPT. Only protons and deuterons were transported in these simulations because alpha particles from 12C(n,x) reactions cannot produce triple coincidence events in the present RPTs because of their low kinetic energy and short range. Nuclear data for neutron and proton-induced nuclear reactions were taken from the LA150 library [40] which extends up to 150 MeV and contains tabular data for all nuclides of the relevant materials in the present experimental setup. Above 150 MeV, nuclear models (Bertini intranuclear cascade plus pre-equilibrium model) were used.
For n-p scattering, the LA150 library includes the results from the phase-shift solution VL40 [41]. Although this solution is rather old and certainly not the ‘best ’ solution, it is still recommended by the International Nuclear Data Committee (INDC) [42] to be used for the energy range from 20 MeV to 350 MeV, mostly to guarantee consistent results of measurements relative to the n-p scattering cross section.
To be consistent with the ENDF-6 format system for nuclear data, MCNPX uses non-relativistic kinematics to sample the emission angle and energy of recoil particles in elastic scattering. In the energy range above 20 MeV, however, the deviation from the correct relativistic description cannot be ignored. For n-p scattering, this manifests itself in a deviation of the ‘experimental’ differential proton emission cross section obtained by tallying recoil protons from the differential cross section calculated from the recommend differential n-p scattering cross section in the center-of-mass system using relativistic kinematics.
The left panel of figure 14 shows the ratio of the relativistic differential recoil proton emission cross sections in the laboratory system to the non-relativistic calculation as a function of the proton emission angle in the laboratory system. The solid lines show calculations starting from the differential VL40 cross section in the center-of-mass system. The symbols indicate the results of ‘numerical experiments’ using MCNPX to determine the non-relativistic differential proton emission cross section from the yield of recoil protons in the laboratory system. It is evident that the kinematic calculation and the numerical experiments give consistent result. Moreover, at the laboratory proton emission angle °, this ratio is very close to unity and depends only weakly on the neutron energy. The right panel shows this cross-section ratio as a function of neutron energy for several angles around 25°. The data around ° were used as a correction factor
| (5.1) |
for the Monte Carlo simulations used to analyze the PRT data (see section 5.4). More details on this problem and a comparison of MCNPX and Geant4 simulations will be presented in a forthcoming publication.
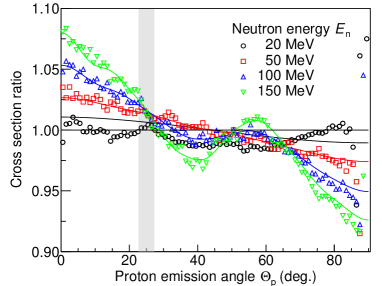
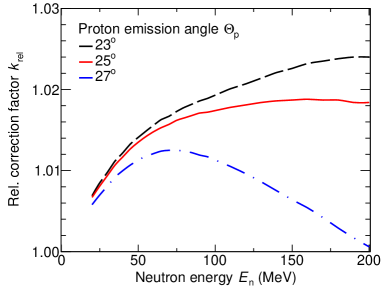
Figure 15 shows the full MCNPX model of the RPTs and details of the detector. The model contains detailed descriptions of those parts of the experiments which are hit by charged particles (radiator samples, scintillators, reflective housings and light guides of the and detectors) and more schematic models of the other parts. The simulation starts with a parallel beam of neutrons. The energy-dependent lateral fluence distribution of the beam is taken from the PPAC data of the high-energy experiment. When the neutrons hit the radiator, an interaction is forced and the weight of the secondary particles reduced accordingly from unity to , where and denote the macroscopic total cross section of the radiator material (polyethylene or graphite) and the thickness of the radiator layer traversed by the neutrons, respectively. To conserve the number of particles, a second ‘uncollided’ neutron is produced with the same momentum vector as the incident neutron and with the weight . These ‘uncollided’ neutrons can create secondary particles in the air behind the radiator and eventually produce rare events with a very high statistical weight but very large variance.
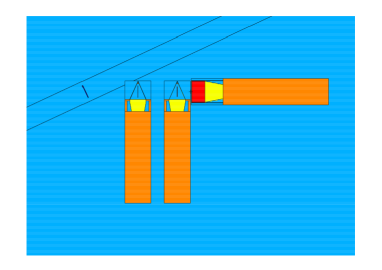
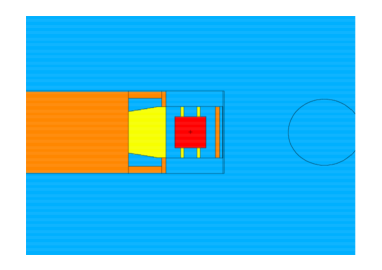
The secondary particles are followed through the full geometry. The particle tracking capability of MCNPX is used to write the complete history of a source neutron to a ‘PTRAC’ file [21] if at least one charged secondary particle hits one of the sensitive volumes of the scintillators. The PTRAC file is analyzed using a dedicated code which determines the coincidence pattern, the energy deposition and the amount of scintillation light produced in the scintillators by each of these source neutrons. It also identifies the type of nuclear interaction in the radiator and tracks proton-induced nuclear reactions effecting a loss of valid events. The information on the spatial inhomogeneity of light collection and on the edge effects in the scintillator (see section 5.1) are also included at this stage. Finally, histograms of the distribution of scintillation light are incremented by the weight for valid triple-coincidence events and compared with the experimental pulse-height distributions of triple coincidence events in the detector (see 5.4). As an example, figure 16 shows a - event distribution and a pulse-height distribution for the detector for the same RPT and neutron energy bin as the experimental data shown in figure 12.
It should be noted that the simulated data show a small number of events above the recoil peak resulting from n-p scattering. This is an artifact from the tabular sampling technique used by MCNPX for cross section data from nuclear data libraries when more than one particle is emitted in a nuclear reaction. In such cases MCNPX does not conserve energy on an event-by-event basis but only on average [21].
5.4 Data analysis
The n_TOF DAQ did not offer the possibility of on-board coincidences; the read-out channels however were all triggered using the same external signal coming from the PS. The three RPT detectors were therefore effectively synchronized and the time difference between events could be used to identify triple coincidences.
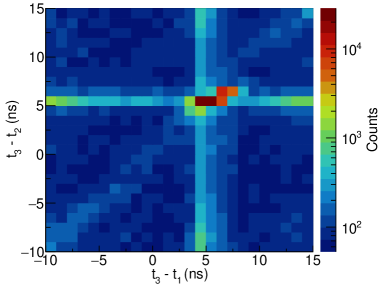
The coincidence filter worked in the following manner: for every neutron pulse, the events of the three scintillators were listed and all possible combinations were analyzed. The time difference between the transmission detectors and the stop detector were calculated, and among all triplets only that with the smallest time difference was selected. The result of this procedure is shown in figure 17, where , , and are used to indicate the timestamp of detector , , and , respectively. The ‘real’ coincidences form a peak in the -vs.- two-dimensional histogram in correspondence of the time matching the cable delay between detectors. The peak is surrounded by a background of random coincidences which is orders of magnitude lower. The events in the peak were therefore selected for further analysis, while the background counts were subtracted.
The time of flight of the neutrons incident on the PE radiators was calculated using as reference the timestamp of the detector. The event arrival time at the stop detector includes the time of flight of the neutron from the source to the radiator, and the time of flight of the recoil proton from the radiator to the detector. The proton time of flight can be determined using the MCNPX model of the RPT, and thus the neutron time of flight was calculated as:
| (5.2) |
Here is the time of arrival of the gamma flash in the stop detector, is the distance from the neutron source to the polyethylene sample, obtained by adding to the distance between PPFC and radiator, and is the distance from the center of the PE sample to the detector. The incident neutron energy was then calculated using equation 4.5, with and
| (5.3) |
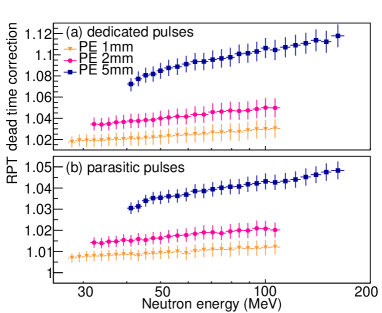
Similarly as for the fission chamber, the dead time correction for the RPT was calculated following the method of Whitten [33]. The formula reported in the paper however was modified to take into account the fact that the final count rate does not depend on a single detector but it is given by the coincidence of three independent detectors. The following expression was derived:
| (5.4) |
where is the correction applied to a given RPT configuration, indicates the index of the time-of-flight bin, is the dead time of the detector () expressed in time-of-flight bins, is the number of single events per bin recorded by each detector, is the number of the detected triple coincidences, is the number of the accelerator repetition cycles completed during the measurement run. The dead time was determined by analyzing the time interval distributions obtained for the single scintillators before applying the coincidence filter. It was found to range from 5(2) ns for the thinnest detector, to 19(2) ns for the thickest detector. The correction obtained then with equation 5.4 is shown in figure 18. Also in this case, the analysis of events acquired during dedicated and parasitic pulses was performed separately to comply with the underlying assumption that all neutron pulses have the same intensity. The absolute uncertainty on was obtained by varying the values of within their uncertainty, and it was found to be 1 % at worst.
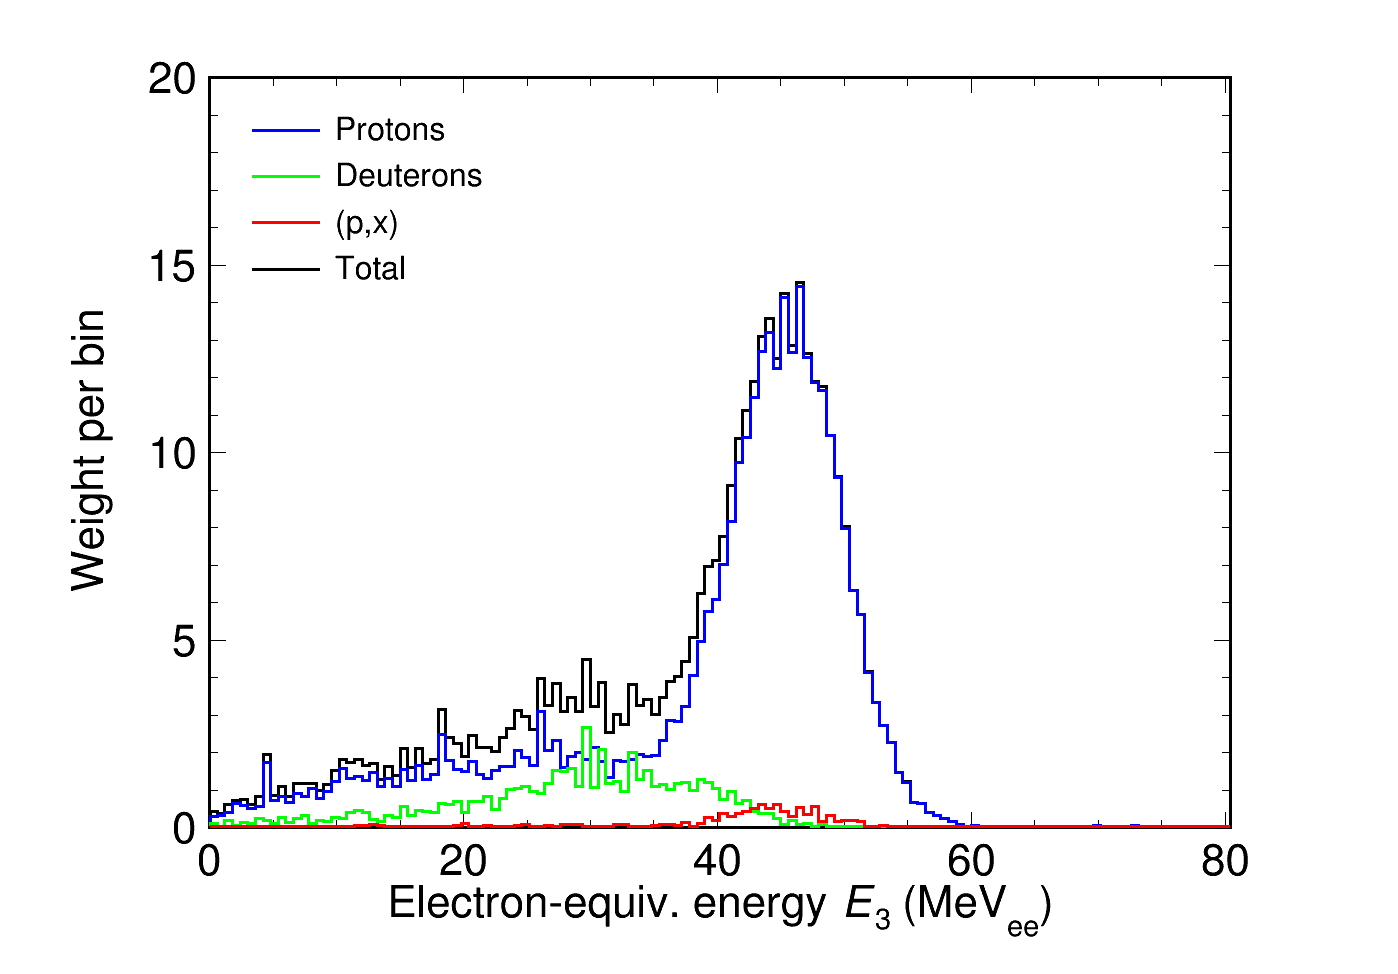
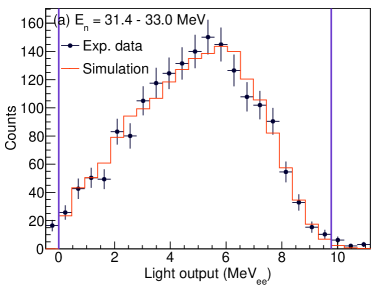
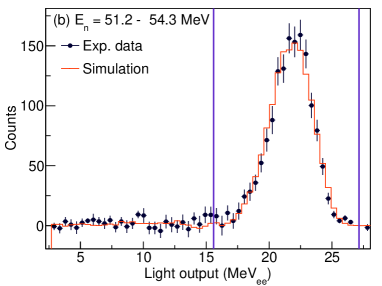
Protons produced in 1H(n,p) and 12C(n,p) reactions were separated from deuterons from 12C(n,dx) reactions by analyzing the light output distributions produced in the stop detector and in the second transmission detector , using the technique. The resulting two-dimensional distributions were already shown for the PE sample of 10 mm in figure 12 in section 5.1. The contribution of 12C(n,p) was determined by scaling the measurements with the graphite sample to PE. The scaling factor was calculated as the ratio of the carbon areal density in both samples, times the ratio of number of protons on target during the two runs. In figure 19, the light output distribution in the stop detector is shown before and after the subtraction for different neutron energies.
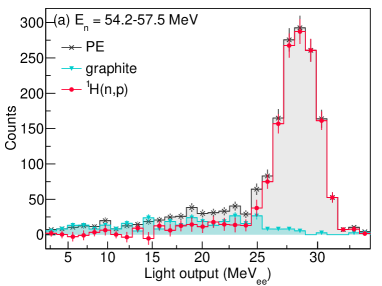
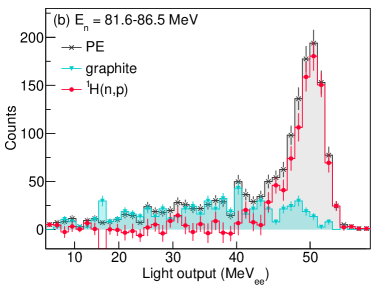
Finally, the number of neutron incident on the PE radiators was determined by fitting the results of the simulations, the light output distributions produced in the stop detector, to the experimental data, i.e. the 1H(n,p) light output distributions shown in figure 19. The numerical procedure mimicked the experimental one: for each neutron energy interval, two simulations, one for the PE sample and one for graphite, were run; then the carbon data were subtracted from the polyethylene data, using the ratio of the carbon number densities as scaling factor.
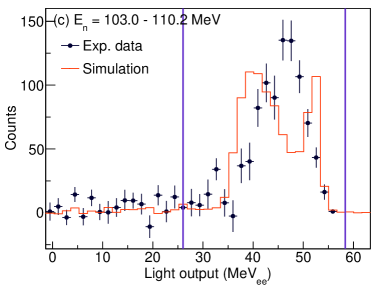
In figure 20 the results of the fit are shown for three incident neutron energy intervals. The fit is successful only for protons with sufficient energy to produce a clear signal in the stop detector, but not enough energy to ‘punch through it’, i.e. when the protons fully deposit their energy in the active volume of the detector. Such cases are shown in figures 20(a) and (b), where the centroid and the width of the proton peak can be defined unambiguously. In contrast, figure 20(c) shows an example where the proton is not completely stopped by the plastic scintillator but manages to escape: the issue is not that the protons do not produce a clear signal, but it is rather MCNPX that fails to describe the measurements, so the fit fails. These limitations on the proton energy and the fit are what ultimately defined the energy range where it was possible to reconstruct the incident neutron fluence.
The reason why MCNPX fails to represent light-output distribution when punch-through occurs might lie in the fact that the model does not include the light output production processes and the optical transport. This might explain why the two peaks in the modeled distribution, obtained by considering just nuclear interactions, stopping power data, and an empirical parametrization of the light-output function, are merged in a ‘single-peak’ in the experimental data. However, as developing an ad-hoc simulation code for the proper treatment of optical processes would have been an effort beyond the main objective, this issue has not been tackled yet.
To determine the uncertainty of the fit procedure, the fit was repeated changing the interval limits, first by narrowing them down around the proton peak, then enlarging them to include the low energy tail. It was found that by changing the fit interval the reconstructed fluence would change by 2.5 % in the worst case.
6 Conclusions and outlook
One of the main strengths of the experimental campaign for the measurement of the 235U(n,f) cross section was the availability of different detector setups measuring simultaneously. The comparison of the PPFC and the PPAC, and of the three RPTs, is what ultimately was also used to qualify the performance of the detectors. Its analysis and the reconstruction of the neutron fluence, however, are tightly connected to the cross section results and its final uncertainty, and therefore they will be discussed in dedicated publications (in preparation).
The uncertainties that could be estimated already during the technical development phase are summarized in tables 4 for the PPFC and 5 for RPT. These values are an indication of the expected systematic uncertainty of the ‘low-energy arm’ of the cross section measurement.
| Contribution | Uncertainty (average) | Single deposit |
|---|---|---|
| 235U mass fraction | 0.0014 % | 0.0014 % |
| 235U mass per unit area | 0.2 % | 0.6 % |
| 235U effective density correction | 0.6 % | 1-2.5 % |
| Zero-bias efficiency | 1.3 % | 1.1-1.3 % |
| Efficiency, extrapolation below thr. | 3 % | 2-4.5 % |
| Dead-time correction | 0.2 % | 0.04-0.2 % |
| Contribution | Uncertainty |
|---|---|
| Beam transmission through PPFC, PPAC | 0.5 % |
| Isotopic composition of PE | 1.5 % |
| Areal density of PE sample | 0.2-0.6 % |
| Areal density of C sample | 0.2-0.9 % |
| Cuts the - matrix for selecting proton events | 0.5 % |
| Fit of MCNPX simulations to the experimental light-output distributions | 2.5 % |
| Effective area of the detector | 0.5 % |
| Distance of the detectors from the PE or C sample | 0.8 % |
| Angle relative to the neutron beam | 0.1-0.6 % |
| Dead-time correction | 0.5-1.0 % |
Overall, the detector development can be considered successful since the observables of interest, the fission fragment yield in the case of the PPFC and the recoil proton yield for the RPT, could be measured up to a neutron energy of 150 MeV. The 200-MeV energy mark was not reached due to run time constraints that did not allow to use every available RPT configuration, however it was theoretically within the technical capabilities.
The main difficulty in the case of the fission chamber was the electromagnetic interference, which was nevertheless handled in the analysis. If further measurements will be necessary in future, it would be anyway advantageous to study a construction with better grounding and shielding to reduce the noise interference. Trying to extend the PPFC measurement range to higher energies, at the expense of its simplicity, is unnecessary as there already are detectors that are better suited for it (e.g. the PPACs). For the particle telescope, however, the extension to higher energies might be desirable e.g. for measurements of interest for hadrontherapy. This could be achieved for example by improving the numerical models to possibly extend the analysis to particles not completely stopped by the last detector. Other lines of development which are currently under study [43], include for example the use of gated PMT and preamplifiers to avoid saturation by signals induced by the gamma flash, and the use of inorganic scintillators as stop detectors to stop more efficiently energetic charged particles.
Acknowledgments
The authors would like to thank the colleagues of PTB for the technical support, in particular A. Eckert, F. Langner, S. Löb and M. Thiemig of the Department ‘Neutron Radiation’, and M. Ehlers of the Department ‘Radioactivity’. They are grateful to M. Reginatto for the assistance with the data analysis and the insights on Bayesian methods. They wish to thank the n_TOF local team for the assistance provided during and after the experimental campaign, especially O. Aberle, M. Bacak, and D. Macina. The very useful discussions with G. Sibbens of JRC Geel on the composition of the 235U samples were sincerely appreciated. The support provided by the PTB Working Groups ‘Solid State Density’ and ‘Scientific Instrumentation’, ZEA-3 unit at the Forschungszentrum Jülich, and the Institute for Inorganic and Analytical Chemistry at the TU Braunschweig, for the characterization of the polyethylene radiators, is also gratefully acknowledged. This project has received funding from the Euratom research and training programme 2014-2018 under grant agreement No 847594.
References
- [1] S. Lo Meo, D. Mancusi, C. Massimi, G. Vannini and A. Ventura, Fission induced by nucleons at intermediate energies, Nucl. Physics A 933 (2015) 43.
- [2] J.C. David, Spallation reactions. a successful interplay between modelling and applications, Eur. Phys. J. A 51 (2015) 468.
- [3] N. Colonna, A. Tsinganis, R. Vlastou, N. Patronis, M. Diakaki, S. Amaducci et al., The fission experimental programme at the CERN n_TOF facility: status and perspectives, Eur. Phys. J. A 56 (2020) 48.
- [4] A.D. Carlson, V.G. Pronyaev, R. Capote, G.M. Hale, Z.P. Chen, I. Duran et al., Evaluation of the neutron standards, Nucl. Data Sheets 148 (2018) 143.
- [5] B. Marcinkevicius, S. Simakov and V. Pronyaev, 209Bi(n,f) and natPb(n,f) cross sections as a new reference and extension of the 235U, 238U and 239Pu(n,f) standards up to 1 GeV, Tech. Rep. INDC(NDS)-0681, IAEA Nuclear Data Section (2015).
- [6] P.W. Lisowski, A. Gavron, E. Parker, J.L. Ullmann, S.J. Ballestrini, A.D. Carlson et al., Fission cross sections in the intermediate energy region, in Proceedings of a specialists’ meeting on neutron cross sections standards for the energy range above 20 MeV, vol. NEANDC-305, (Uppsala, Sweden), p. 177, 21 - 23 May, 1991.
- [7] C. Borcea, P. Cennini, M. Dahlfors, A. Ferrari, G.G. Muñoz, P. Haefner et al., Results from the commissioning of the n_TOF spallation neutron source at CERN, Nuclear Instruments and Methods in Physics Research Section A 513 (2003) 524.
- [8] D. Tarrío, L.S. Leong, L. Audouin, I. Duran, C. Paradela, L. Tassan-Got et al., Measurement of the angular distribution of fission fragments using a PPAC assembly at CERN n_TOF, Nucl. Instrum. and Methods in Phys. Res. A 743 (2014) 79.
- [9] C. Matei, F. Belloni, J. Heyse, A.J.M. Plompen and D.J. Thomas, Absolute cross section measurements of neutron-induced fission of 242Pu from 1 to 2.5 MeV, Phys. Rev. C 95 (2017) 024606.
- [10] F. Belloni, R. Eykens, J. Heyse, C. Matei, A. Moens, R. Nolte et al., Neutron induced fission cross section measurements of 240Pu and 242Pu relative to the neutron-proton scattering cross section at 2.5 MeV and 14.8 MeV, Eur. Phys. J. A 58 (2022) 227.
- [11] V. Gressier, A.C. Bonaldi, M. Dewey, D. Gilliam, H. Harano, A. Masuda et al., International key comparison of neutron fluence measurements in monoenergetic neutron fields – CCRI(III)-K11, Metrologia 51 (2014) 06009.
- [12] A. Manna, E. Pirovano, S. Amaducci, M. Barbagallo, D.M. Castelluccio, N. Colonna et al., Recoil proton telescopes and parallel plate avalanche counters for the 235U(n,f) cross section measurement relative to H(n,n)H between 10 and 500 MeV neutron energy, Nucl. Instrum. and Methods in Phys. Res. A (2022) Submitted.
- [13] M. Barbagallo, C. Guerrero, A. Tsinganis, D. Tarrío and et al. (The n_TOF Collaboration), High-accuracy determination of the neutron flux at n_TOF, The European Physical Journal A 49 (2013) 156.
- [14] C. Guerrero, A. Tsinganis, E. Berthoumieux, M. Barbagallo, F. Belloni, F. Gunsing et al., Performance of the n_TOF time of flight facility, Eur.Phys. J. A 49 (2013) 27.
- [15] A. Masi, A. Almeida Paiva, R. Cevenini, E. Chiaveri, M. Donzé, S. Gilardoni et al., The CERN n_TOF facility data acquisition system, in International Conference on Accelerator and Large Experimental Control Systems, (Barcelona, Spain), pp. 1900–1905, 8-13 October, 2017, DOI.
- [16] P. Žugec, C. Weiß, C. Guerrero, F. Gunsing, V. Vlachoudis, M. Sabate-Gilarte et al., Pulse processing routines for neutron time-of-flight data, Nuclear Instruments and Methods in Physics Research Section A 812 (2016) 134.
- [17] R. Arndt, Nucleon-nucleon elastic scattering analyses at VPI&SU, in Proceedings of a specialists’ meeting on neutron cross sections standards for the energy range above 20 MeV, vol. NEANDC-305, (Uppsala, Sweden), p. 39, 21 - 23 May, 1991.
- [18] Y. Shikaze, Y. Tanimura, J. Saegusa and M. Tsutsumi, Development of highly efficient proton recoil counter telescope for absolute measurement of neutron fluences in quasi-monoenergetic neutron calibration fields of high energy, Nucl. Instrum. and Methods in Phys. Res. A 615 (2010) 211.
- [19] A.D. Carlson, O.A. Wasson, P.W. Lisowski, J.L. Ullmann and N.W. Hill, A study of the 235U(n,f) cross section in the 3 to 30 MeV region, Proceedings of the International Conference ’Nuclear Data for Science and Technology’ (Mito 1988) (1988) 1029.
- [20] L.G. Christophorou, S.L. McCorkle, D.V. Maxey and C.J. G., Fast gas mixture for gas-filled particle detectors, Nucl. Instrum. and Methods 163 (1979) 141.
- [21] D.B. Pelowitz ed., MCNPX user’s manual, Tech. Rep. LA-CP-11-00438, Los Alamos National Laboratory (2011).
- [22] G. Sibbens, M. Ernstberger, T. Gouder, M. Marouli, A. Moens, A. Seibert et al., Morphological and compositional study of 238U thin film targets for nuclear experiments, AIP Conference Proceedings 1962 (2018) 030007.
- [23] G.W. Carlson, The effect of fragment anisotropy on fission-chamber efficiency, Nucl. Instrum. and Methods 119 (1974) 97.
- [24] K.-H. Schmidt, B. Jurado, C. Amouroux and C. Schmitt, General description of fission observables: GEF model code, Nucl. Data Sheets 131 (2016) 107.
- [25] A.S. Vorobeyev, A.M. Gagarski, O.A. Sherbakov and L.A. Vaishene, Angular distribution and anisotropy of fission fragments from neutron-induced fission in intermediate energy range 1 - 200 MeV, Eur. Phys. J. Web of Conf. 146 (2017) 04011.
- [26] V. Geppert-Kleinrath, F. Tovesson, J.S. Barrett, N.S. Bowden, J. Bundgaard, R.J. Casperson et al., Fission fragment angular anisotropy in neutron-induced fission of 235U measured with a time projection chamber, Phys. Rev. C 99 (2019) 064619.
- [27] E. Leal-Cidoncha, I. Durán, C. Paradela, D. Tarrío, L. Leong, L. Tassan-Got et al., Fission fragment angular distribution measurements of 235U and 238U at CERN n_TOF facility, Eur. Phys. J. Web of Conf. 111 (2016) 10002.
- [28] M. Fatyga, K. Kwiatkowski, H.J. Karwowski, L.W. Woo and V.E. Viola, Linear momentum transfer in 40 - 150 MeV proton-induced reactions with 238U, Phys. Rev. C 32 (1985) 1496.
- [29] J.F. Ziegler, M.D. Ziegler and J.P. Biersack, SRIM - the stopping and range of ions in matter, Nucl. Instrum. and Methods B 268 (2010) 1818.
- [30] H. Zhong, Review of the Shockley-Ramo theorem and its application to semiconductor gamma-ray detectors, Nucl. Instrum. and Methods in Phys. Res. A 463 (2001) 250.
- [31] M. Peck, A. Göök, J. Enders, F.-J. Hambsch and S. Oberstedt, Pulse-height defect of Ar+CF4 mixtures as a counting gas for fission-fragment detectors, Nucl. Instrum. and Methods in Phys. Res. A 919 (2019) 105.
- [32] P. Filliatre, C. Jammes and B. Geslot, Stopping power of fission fragments of 252Cf in argon: A comparison between experiments and simulation with the SRIM code, Nucl. Instrum. and Methods in Phys. Res. A 618 (2010) 294.
- [33] C. Whitten, Correction procedures for variable intensity neutron time-of-flight measurements, Nucl. Instrum. and Methods in Phys. Res. A 309 (1991) 264.
- [34] R. Brun and F. Rademakers, ROOT - an object-oriented data analysis framework, Nucl. Instrum. and Methods in Phys. Res. A 389 (1997) 81.
- [35] D. Lunn, A. Thomas, N. Best and D. Spiegelhalter, WinBUGS - a bayesian modelling framework: concepts, structure, an extensibility, Statistics and Computing 10 (2000) 325.
- [36] P. Doll, G. Fink, F.P. Brady, R. Garret, H.O. Klages and H. Krupp, E-E telescope systems for detecting charged particles produced with a "white" neutron beam, Nucl. Instrum. and Methods in Phys. Res. A 250 (1986) 526.
- [37] H. Schuhmacher, H.J. Brede, V. Dangendorf, M. Kuhfuss, J.P. Meulders, W.D. Newhauser et al., Quasi-monenergetic neutron beams with energies from 25 to 75 MeV, Nucl. Instrum. and Methods in Phys. Res. A 421 (1999) 284.
- [38] V. Dangendorf, R. Nolte, F. Roos, H. Schuhmacher, B.R.L. Siebert and M. Weyrauch, Recoil telescopes for fluence measurements in neutron beams of 20 - 200 MeV, Nucl. Instrum. and Methods in Phys. Res. A 469 (2001) 205.
- [39] D. Sloan and J.C. Robertson, The efficiency of a recoil proton monitor, Nucl. Instrum. and Methods 198 (1982) 365.
- [40] M.B. Chadwick, P.G. Young, S. Chiba, S. Frankle, G.M. Hale, H.G. Hughes et al., Cross section evaluations to 150 MeV for accelerator-driven systems and implementation in MCNPX, Nucl. Sci. Eng. 131 (1999) 293.
- [41] R.A. Arndt, J.S. Hyslop III and R.L. Roper, Nucleon-nucleon partial-wave analysis to 1100 MeV, Phys. Rev. D 35 (1987) 128.
- [42] A.D. Carlson, S. Chiba, F.-J. Hambsch, N. Olsson and A.N. Smirnov, Update to nuclear data standards for nuclear measurements, INDC(NDS) 368 (1997) .
- [43] R. Beyer, M. Dietz, A. Junghans, R. Nolte, E. Pirovano and P. Vaz, Measurement of double-differential charged-particle emission cross sections at n_TOF in the neutron energy range from 20 MeV to 200 MeV, Tech. Rep. CERN-INTC-2020-061, INTC-I-221, CERN, Geneva (Sep, 2020).