Universal scaling in fractional dimension
Abstract
The concept of universality has shaped our understanding of many-body physics, but is mostly limited to homogenous systems. Here, we present a first study of universality on a non-homogeneous graph, the long-range diluted graph (LRDG). Its scaling theory is controlled by a single parameter, the spectral dimension , which plays the role of the relevant parameter on complex geometries. The graph under consideration allows us to tune the value of the spectral dimension continuously and find the universal exponents as continuous functions of the dimension. By means of extensive numerical simulations, we probe the scaling exponents of a simple instance of symmetric models on the LRDG showing quantitative agreement with the theoretical prediction of universal scaling in fractional dimensions.
Universality lies at the core of the modern theory of critical phenomena. With this concept one refers to the property of the scaling laws, observed in the vicinity of a thermal phase transition (PT) or of a quantum critical point (QCP), not to depend on the microscopic details of the model at hand Kardar (2007); Sachdev (2011). In particular, in typical lattice systems with finite range interactions the critical exponents are not affected by any modification in the interaction range or in the structure of the regular lattice.
One of the fundamental consequences of universality is the possibility of identifying continuous field theories, whose universal properties exactly reproduce experimental and numerical observations of actual lattice models for given values of the dimension and the symmetry properties of the order parameter Guggenheim (1945); Bak (1997); Parisi (1998).
The most celebrated example of universality in this context is represented by -symmetric field theories, which describe the critical properties of a wide range of physical transitions, such as finite temperature ferromagnetic, quantum anti-ferromagnetic, liquid-vapour, superfluid and superconducting transitions Sachdev (2011). The microscopic action of field theory reads
| (1) |
where is an -component vector, runs over all the coordinates of the -dimensional Euclidean space, while and are the couplings of theory, which may depend on the details of the microscopic model under study.
The model in Eq. (1) undergoes a spontaneous symmetry breaking (SSB) transition at a critical value . In the symmetry broken phase a finite condensate or magnetization appears leading to a finite ground-state expectation of the field operator , i.e. . As the square mass approaches the critical point the thermodynamic functions and observables display scaling behaviour, whose scaling indices are universal as they depend only on and for any . Between this large set of critical exponents only two are independent Fisher (1967); Domb (1996); Cardy et al. (1996) and, in the following, we will mainly consider the correlation length critical exponent and the susceptibility exponent . The first is defined in terms of the two-point function in the symmetric phase, where the correlation length scales as . The second one is normally related with the divergence of the susceptibility at criticality .
By analytic continuation of perturbative field theoretic analysis and renormalization group investigations, it has been possible to derive continuous curves for the universal exponents of field theories as a function of both parameters Holovatch (1993); Brézin and Wadia (1993); Kleinert and Schulte-Frohlinde (2001); Pelissetto and Vicari (2002). Defining the anomalous dimension , one notices that the family of curves , and partially also , act as an order parameter for the appearance of non-mean-field universal scaling in field theories and can be used to quantify the strength of many-body correlations at criticality Codello and D’Odorico (2013); Codello et al. (2015). Most of the aforementioned field theoretic estimates accurately reproduce exact numerical simulations on regular lattices with integer dimensions Hasenbusch (2001); Pelissetto and Vicari (2002); Poland et al. (2019). In this perspective, it is fair to say that universality and critical scaling have been thoroughly scrutinized both via advanced theoretical tools and extensive numerical simulations, yielding a coherent quantitative description of universal properties on regular lattices.
On the other hand, complex systems, whose microscopic components occupy the sites of a non-homogeneous graph rather than a regular lattice, are also expected to display universality, but their scaling behaviour still presents several open questions. The importance of universal scaling on complex networks, and non-homogeneous structures in general, shall become increasingly more relevant as atomic, molecular and optical (AMO) physics experiments push the control of Rydberg states to the single-atom level, allowing the construction of tuneable structures where non-homogeneity and strong correlations coexist Defenu et al. (2021). At the same time, coherent Ising machines provide photonic realizations of large, programmable non-homogeneous networks operating near a phase transition Honjo et al. (2021).
I Spectral properties and universality on complex networks
Most numerical investigations of critical phenomena on complex networks focus on small-world networks, where critical fluctuations are Gaussian, leading to mean-field universal behaviour, which is not affected by network properties such as clustering coefficients, degree correlations and fractal dimension Herrero and Saboyá (2003); Herrero (2005); Dorogovtsev et al. (2008).
However, correlated scaling behaviour is expected to occur on complex networks with gapless Laplacian spectrum. There, the density of states (DOS) of the Laplacian spectrum displays power-law scaling at low energies (), leading to the definition of spectral dimension
| (2) |
see also Ref. Hattori et al. (1987) for a more rigorous definition in terms of the infrared singularities of a Gaussian model. An integer spectral dimension is typical of regular lattices, where it coincides with the Euclidean and the fractal dimension . The spectral dimension is commonly fractional on complex networks and its value controls the occurrence of SSB on these structures.
Indeed, for a discrete symmetry model on regular lattices, SSB occurs if and only if , while for continuous symmetries the corresponding condition is , as stated by the celebrated Mermin-Wagner theorem Mermin and Wagner (1966); Mermin (1967) and its inverse Fröhlich et al. (1976, 1976). The extension of this result to non-homogeneous structures with () for discrete (continuous) symmetries has been described in Refs. Cassi (1992); Burioni et al. (1999a). The definition of spectral dimension itself displays some universal characteristics, such as the equivalence between Laplacian spectrum, vibrational spectrum and random walk definitions as well as the independence of the mass distribution in a Gaussian model Burioni and Cassi (1996). Finally, the universal behaviour of models on complex networks is solely determined by the spectral dimension in the limit and coincides with the one of large- Heisenberg ferromagnets Burioni et al. (1998a); Cassi and Fabbian (1999).
All these findings indicate the spectral dimension as the natural control parameter for universality on complex networks, where it shall play the same role as the Euclidean dimension on regular lattices. However, at present no numerical simulations are available indicating that the universal behaviour of critical theories on complex networks with given do indeed reproduce the scaling behaviour of continuous field theories with . This may be due to the lack of proper examples of graphs with well defined spectral dimension in the appropriate range where correlated scaling behaviour appears. Here, we intend to provide substantial evidence that the universal scaling of microscopic statistical mechanics models on non-homogeneous structures is indeed described by an appropriate quantum field theory (QFT) in fractional dimension.
II Self-avoiding random walk on the long-range diluted graph
The microscopic model of our choice is a self-avoiding random walk (SARW), which hops between the vertices, along the edges, of a 2D long-range dilute graph (LRDG). The SARW is one of the simplest systems in statistical physics exhibiting correlated critical behaviour. We define as a measure of the extension of the SARW – such as the end-to-end distance or the gyration radius – after having performed steps. Then, in the limit one has
| (3) |
where is a non-universal constant and is a critical exponent, the celebrated Flory exponent. Moreover, in the same limit one can also define the critical exponent via
| (4) |
where is the survival probability for an -step SARW and is the non-universal connective constant of the lattice. Remarkably, such a simple model is also able to reproduce very realistically various aspects of polymers in a solution Edwards (1965); Sokal (1996a).
We employ the SARW as a prototypical example of universal behaviour as it possesses three highly valuable properties for our studies:
- (i)
- (ii)
-
(iii)
Scaling arguments can be used to derive the celebrated Flory estimate Flory and Leutner (1948); Bhattacharjee et al. (2013)
(5) for the correlation length exponent. These scaling arguments do not only reproduce the mean-field result in , but also give the exact result in Nienhuis (1982). As a consequence Eq. (5) provides a very reliable estimate for the universal exponent in the entire dimensional range with only a mismatch from the exact value in Cardy et al. (1996).
On the other hand, the choice of the LRDG builds up on our previous studies on the long-range random ring (LR3) Millán et al. (2021), where it was shown that the spectral dimension of a 1D lattice could be tuned in the range by the inclusion of additional links distributed according to a power-law distribution as a function of the links’ length , i.e. . With respect to the LR3, its 2D generalization, i.e. the LRDG, has two main advantages:
-
(i)
The disorder contribution to the spectral dimension is irrelevant, as we will argue in the following, suppressing the interplay between disorder and critical correlations and, hence, simplifying the comparison with the homogeneous model.
-
(ii)
In the limit, the “long-range” disorder contribution vanishes and the LRDG reproduces a regular 2D lattice, where the SARW critical exponents are known exactly, providing a straightforward benchmark for our investigations.
Our conjecture is that any critical model whose microscopic components occupy the edges of the LRDG will display the same universality class as its continuous counterpart in dimensions. The existence of the critical point both for the LRDG with dimension and the continuous model with is granted by the generalization of the Mermin-Wagner theorem and its inverse to graphs Cassi (1992, 1996); Burioni et al. (1999a, b). While these rigorous mathematical results on the existence of critical points on the LRDG have been confirmed numerically in Refs. Berganza and Leuzzi (2013); Cescatti et al. (2019), a numerical proof that the universality on graphs of dimension really corresponds to the one of the continuous theory in has been lacking up to now.
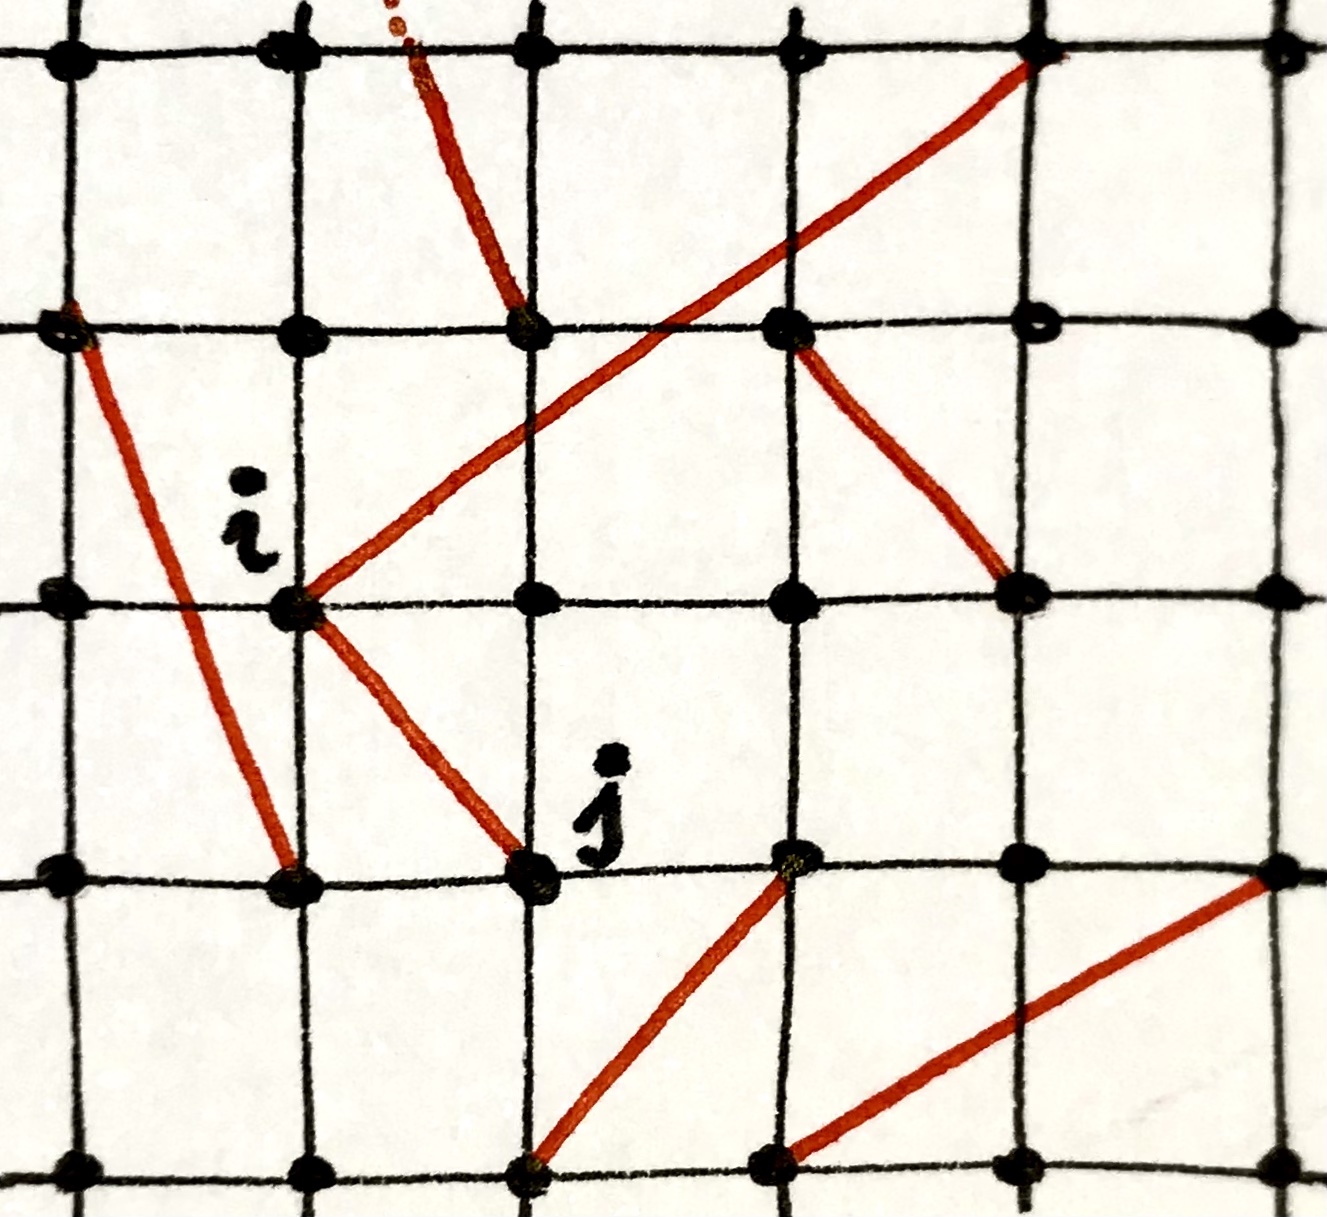
Let us now explain in detail how the LRDG is constructed: one starts considering a Euclidean 2D lattice, and builds a graph in which each node corresponds to a point in the lattice, and each edge joins first neighbours. We impose periodic boundary conditions at the borders. Subsequently, we consider all possible edges connecting non-first-neighbours and add them to the graph with probability for Euclidean distance between the two sites (see Fig. 1). For convenience we rewrite our decay exponent as and we consider the case from now on. Note that the in the limiting case we obtain the fully-connected – i.e. complete – graph, whereas for we recover the underlying Euclidean lattice with no additional edges. Several analytic expressions for the graph properties of LRDG and its generalizations are known Biskup (2004).
One may expect that the equivalent fractional dimension of the LRDG is related to via the relation
| (6) |
where is the (Euclidean) dimension of the underlying lattice, i.e. in our case. The quantity encodes the contribution arising due to disorder correlations. Indeed, averaging the adjacency matrix of the LRDG graph with respect to the probability distribution , one obtains a conventional fully connected long-range system Defenu et al. (2021, 2020). This procedure is referred to as annealed disorder average (ADA) and leads to the spectral dimension for , i.e. as expected. On the other hand, when the disorder is properly accounted for and the average is taken directly on the spectrum, i.e. a quenched disorder average (QDA), one finds for the LR3 model Millán et al. (2021). However, previous studies of the LRDG appeared to be consistent with also for QDA Berganza and Leuzzi (2013).
Once the graph is constructed, one has to work out a way of generating SARWs on top of it. Whereas exact enumeration approaches are possible Roerdink (1985), critical exponents and related quantities are better investigated by means of stochastic Monte Carlo (MC) approaches. Recently, high-precision MC tools for SARWs have been developed, essentially sophisticated refinements of the pivot algorithm Madras and Sokal (1988); Clisby (2010b), allowing to make the determination of the Flory exponent one of the most precise quantities ever measured in statistical mechanics Clisby (2010b), up to 6 significant digits. Remarkably, this class of algorithms proves wrong the conjecture by Sokal Sokal (1996b) that no effectively independent SARW can be generated from an existing one faster than for walks of length .
Unfortunately, these novel methods make use of the underlying symmetries of the Euclidean lattice, and cannot be extended to the LRDG. Therefore, for the present investigation we use an extension of the simpler ‘slithering-tortoise’ algorithm Berretti and Sokal (1985), a dynamic, local Monte Carlo algorithm, based on the simple idea of constructing an ergodic process, moving through the space of all SARW configurations on a given lattice, using two simple moves that can straightforwardly be adapted to our case. The moves consist simply in fixing one end of the SARW at one vertex in the graph, and start by considering a 0-length walk. The ‘+’ update will then extend the SARW by one step, selecting a candidate with probability , while the ‘-’ update will reduce the length of the SARW by one step with probability . In case an update leads to a self-intersection or tries to shorten a 0-length walk, the move is rejected – null transition – and the old configuration is counted again. The following choices for the acceptance probability of each update satisfy the detailed balance condition
| (7) |
where is the number of neighbours in the graph before proposing the update in , and after (eventually) accepting the update in . Furthermore, the parameter in the transition probabilities plays the role of a pseudo-chemical potential, regulating the average length of the walk; it can be easily demonstrated Berretti and Sokal (1985) that a walk will be sampled by this update scheme with probability
| (8) |
where is the length of the walk, and equals 1 for a SARW and for a self-intersecting walk. In practice, can be tuned empirically until the average length of the walks reaches the desired value. One immediately notices that the algorithm is ergodic also for SARWs – as any walk can be constructed simply be erasing the existing one and reconstructing the desidered walk – while also generating samples largely correlated, the autocorrelation time being .
In our simulations we considered Euclidean lattices up to as the backbone for the construction of an LRDG graph, with varying in the range . Our MC simulations consist of 128 averages over different realizations of the LRDG with the same effective dimension, while also averaging over 128 different walks on the same graph, also with different randomly-chosen starting sites. After an initial thermalization of MC steps, we perform MC steps, sampling the end-to-end radius – using the underlying Euclidean metric – and the survival probability as a function of the SARW length .
III Analysis and results
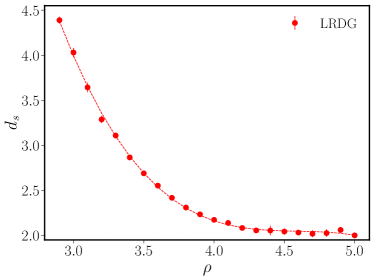
At first, we determine the spectral dimension of each different realization of the LRDG, by calculating the low-energy spectrum of the graph Laplacian van Mieghem (2010) associated to each graph, subsequently inferring the spectral dimension via a procedure detailed in the Appendix. A similar analysis has been performed for the 1D case in Ref. Millán et al. (2021) comparing it against other approaches; we verified that the Laplacian spectrum method provides the best estimates also in the LRDG case. The outcome of the numerical analysis presented in the App. A is reported in Fig. 2, where the spectral dimension of the LRDG model is compared with the equivalent result for fully connected long-range interactions reported in Eq. (6).
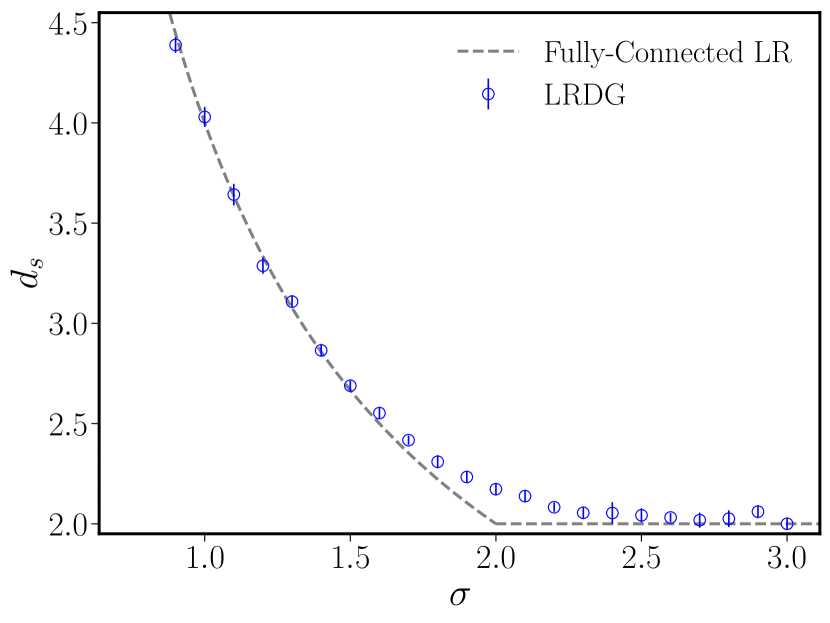
The numerical estimates of obtained for the LRDG (blue circles in Fig. 2) do not display any substantial shift away from the ADA prediction and are overall consistent with a correction for . At larger values of the deviation from the ADA estimate grows and reaches a maximum at . From this, one would at first glance conclude that also for the LRDG, as found already for the LR3 model Millán et al. (2021). However, while the LR3 produced a correction , which may be connected with the anomalous dimension of the Ising universality class in the standard theory of critical phenomena Millán et al. (2021), the deviation observed in Fig. 2 would yield a correction , which is not customary in conventional models of criticality, with the exception of percolation in Lorenz and Ziff (1998); Nakanishi and Stanley (1980); Adler et al. (1990). Therefore, the deviation observed for in Fig. 2 will not persist in the thermodynamics limit, in agreement with the results displayed in Ref. Berganza and Leuzzi (2013). Rather it originates from a systematic error produced by the presence of logarithmic corrections at the marginal value , due to the long-range nature of disorder becoming irrelevant beyond that threshold. A similar phenomenology is observed in multiple long-range models Defenu et al. (2020) and has proven extremely hard to capture Angelini et al. (2014); Defenu et al. (2015) due to the large sizes needed in the simulations Horita et al. (2017). As we are interested mostly in the neighbourhood of , which falls below , we leave the analysis of logarithmic corrections to future work.
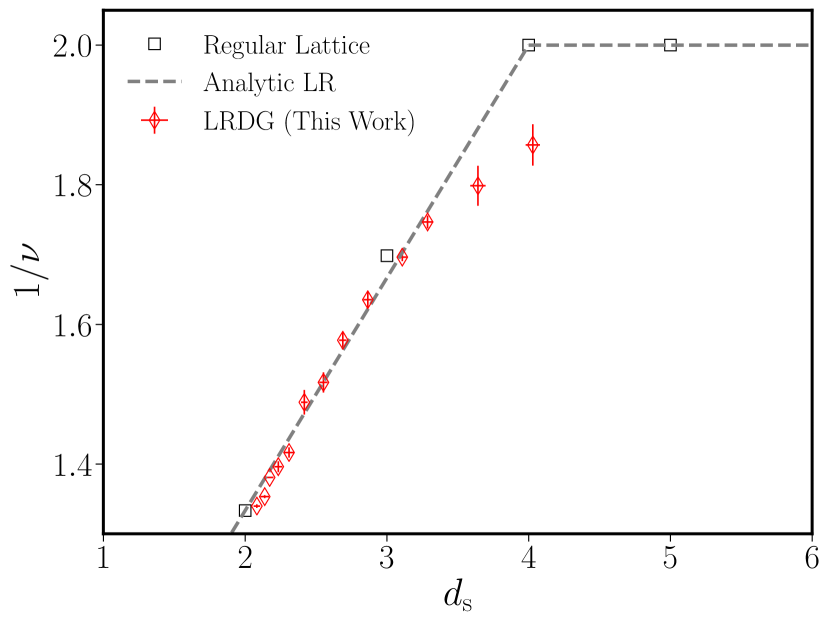
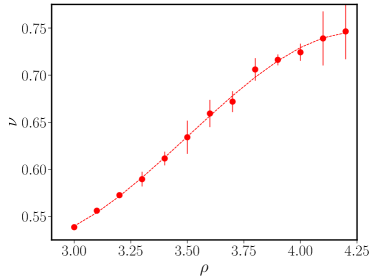
In order to validate the universality of scaling phenomena on the LRDG graph, we computed the correlation length exponent of the SARW on the graph. The results of this analysis are reported in Fig. 3 and compared with the theoretical expectation obtained by the Flory theory, replacing the integer dimension with the spectral dimension in Eq. (5). The MC data fall neatly on the theoretical curve in the entire range providing a very strong indication of universality in the LRDG. In the region the agreement is poorer, but as expected from the appearance of logarithmic corrections close to the mean-field threshold de Carvalho et al. (1983). Indeed, numerical studies at (and above) the upper critical dimension ( in our case) are plagued by logarithmic and finite-size corrections, which need to be explicitly accounted for in order to reproduce the expected universal predictions Luijten and Blöte (1996); Flores-Sola, Emilio J. et al. (2015); Flores-Sola et al. (2016). The impact of these logarithmic corrections on our numerical analysis is evident in the study of the curve collapse that we use to determine the universal scaling region, see the Method sections.
Another (much slighter) discrepancy is observed at , possibly due to the systematic error encountered in the determination of the spectral dimension at , see the discussion of Fig. 2. The evolution of the correlation length exponent as a function of substantially confirms the conjecture that the universality on the LRDG network only depends on the low-energy spectrum as it matches the Flory prediction, which derives solely from the low-energy scaling theory. Interestingly, this correspondence also extends to the case of self-avoiding Lévy flights (SALF) in 1D, where the length of the jump is distributed according to a power-law distribution, whose critical exponents were shown to coincide with the Flory estimate in Ref. Grassberger (1985).
IV Conclusions and future perspectives
We have presented a numerical study of self-avoiding random walks (SARW) on a simple graph with tuneable spectral dimension. The graph structure is depicted in Fig. 1, which we refer to as long-range diluted graph (LRDG). As a function of the decay exponent of the power-law probability distribution the graph realizes all possible spectral dimensions , similarly to the case of fully connected long-range interacting systems Defenu et al. (2020, 2021). However, the LRDG is merely a simple graph with constant couplings and, therefore, it rather corresponds to a nearest neighbour model on a complex topology Millán et al. (2021).
In this perspective, the model has already been used to investigate several properties of complex systems and spin glasses as a function of a continuous dimension Katzgraber et al. (2009); Larson et al. (2010); Leuzzi et al. (2008); Leuzzi and Parisi (2013); Sharma and Young (2011). Here, we employ the LRDG to investigate universal scaling on complex topologies. However, in contrast to previous studies in spin glasses, our model has no frustration and is perfectly self-averaging, as we have already shown in Ref. Millán et al. (2021) for the 1D version.
The self-averaging nature of the LRDG is crucial to ensure proper universality. In fact, it is known that pathological graphs exist where the local expectation of the spectral dimension does not coincide with the one observed on average Burioni et al. (1998b), leading to universality violations and, in particular, to the lack of spontaneous symmetry breaking in Merkl and Wagner (1994); Burioni and Cassi (1993); Wu and Yang (1995); Burioni and Cassi (1995); Cassi (1996).
To our knowledge, the dependence of the correlation length exponent on displayed in Fig. 3 is the first numerical evidence of correlated universality on non-homogeneous structures. Previous efforts focused on exactly solvable models Gefen et al. (1981); Burioni and Cassi (1996); Cassi and Fabbian (1999) or on the existence of SSB Berganza and Leuzzi (2013); Cescatti et al. (2019), while the study of critical indices as a function of a continuous spectral dimension appears here for the first time. The agreement between the numerical findings (red diamonds in Fig. 3) and the theoretical prediction in Eq. (5), which has been derived by simple scaling arguments (without any information on the structure of the LRDG), is a strong indication of universality on the LRDG graph. Moreover, the theoretical prediction in Eq. (5) has already been shown to reproduce the critical scaling of SALF Grassberger (1985), whose scaling theory is akin to the one of our model.
Although Fig. 3 furnishes a strong indication of universality on the LRDG graph, this universality has to be intended in the weak sense for two reasons:
-
i
A complete characterization of universality for models would require also the study of the critical exponent (or of any other independent critical exponent).
-
ii
The critical exponent of LRDG in appears not to coincide with the known result on the square lattice in (gray squares in Fig. 3).
Regarding point (i), it is worth noting that the critical exponent of the SARW has been conjectured to be non-universal Cardy (1994) based on conformal field theory arguments. Accordingly, numerical simulations have evidenced small variations of depending on the lattice under study Bennett-Wood et al. (1998); different authors attributed these corrections to strong finite-size scaling and eventually recovered universality Caracciolo et al. (1999). Until this issue is resolved, any study of the critical index of the SARW cannot shed any further light on the universality of simple graphs.
Point (ii) is more subtle. It is well known that the critical exponent of SARW deviates from the Flory estimate by 2.1% on the square lattice in Slade (2019). Nevertheless, Ref. Grassberger (1985) claims that SALF obey the Flory estimate in the entire range, although the accuracy of those numerical estimate does not seem sufficient to resolve a 2.1% deviation. Still, it is possible that SALF exactly reproduces the Flory estimate while the SAW on a regular lattice does not, since it is known that critical exponents of long-range models generally differ from the ones of their nearest-neighbour equivalents in an effective dimension Defenu et al. (2015); Gori et al. (2017). While we believe that the current model is closer to a nearest-neighbour model with complex topologies, having all the couplings of the same strength, the numerical estimates in Fig. 3 appear to be more consistent with the Flory estimates (gray dashed lines) rather than with the results on the regular lattices (gray empty square). Yet, the extent of the numerical uncertainties does not allow us to draw a final line under this issue. Interestingly, evidence of a possible weak universality has recently been discussed for percolation models on graphs, which, despite being closely related to SARW, do not have a direct field theoretic counterpart Halberstam and Hutchcroft (2022).
In the future, numerical analysis in the neighbourhood of shall be extended in order to increase the accuracy and to inspect possible deviations of the universal behaviour from the Flory prediction. Also, the study of different universality classes such as the Ising () or XY () are envisaged. With the progress in the manipulation of Rydberg atoms confined into optical tweezers, it will be possible to realize quantum simulations of complex systems on non-homogeneous topologies Barredo et al. (2018), similarly to the ones performed in fully-connected models Helmrich et al. (2020). This will certainly boost the importance of the study of universality on non-homogeneous structures.
Our studies pave the way to the use of diluted models to perform numerical simulations of universal physics on fully-connected long-range systems. Indeed, they both share the same scaling properties and, according to our studies, they are likely to exhibit the same universal phenomena. Since diluted models have a reduced degree of connectivity and, even, sparse coordination matrices Berganza and Leuzzi (2013); Millán et al. (2021), they may be used to perform large-scale quantum simulations of strongly interacting models with non-analytic spectral properties at a fraction of the effort.
V Methods
The present method section summarizes how we obtained the estimate for from the numerical simulations, while the procedure for the determination of is reported in the App. A. After having performed a MC simulation and obtained an estimate for the end-to-end distace , the main difficulty encountered by the numerical analysis derives from the presence of systematic corrections to the curve both at small and large values of . The small deviations naturally occur due to subleading corrections with , which modify the leading order scaling reported in Eq. (3). At large values of N, on the other hand, the universal scaling is disrupted by the finite size of the LRDG graph, which affects long walks that can wind around the boundary of the system.
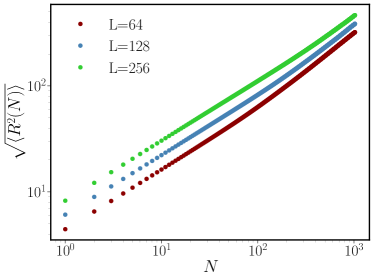
In order to extract the correlation length index from the scaling of , one needs to identify a suitable region of where one can reasonably apply the relation in Eq. (3). The aforementioned universal region may be identified by observing the collapse of different curves for different system sizes . This analysis is reported in Fig. 4,
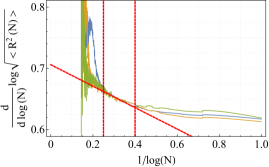
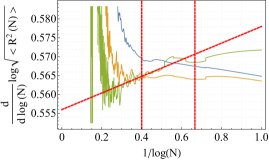
for both and . In both cases the collapse is rather evident in a wide region of . The “universal window” is identified as the range of where the disagreement of the three curves remains below 5%. The same analysis has been repeated for all values of resulting in very extended and well defined fitting regions for all , similarly to what is reported in the upper panel in Fig. 4. For the collapse region is less extended but still pronounced enough to obtain reliable estimates, at least up to , see the lower panel in Fig. 4. Finally, in the region (corresponding to ) it is not possible to identify a clear universal region and, accordingly, the estimates become less precise. As a consequence the agreement between our data and the theoretical line is poorer in this region, see Fig. 3.
Once the universal regime has been determined following the aforementioned procedure, the computation of the Flory critical exponent is rather straigthforward. The numerical data in the universal window are interpolated via a linear function of the inverse walk length and then extrapolated to , see more details in App. B.
Acknowledgements.
We gladly acknowledge Giacomo Gori for his help in determining the spectral dimension from the numerical data. N.D. acknowledges stimulating discussions with Mehran Kardar. This work is supported by the Deutsche Forschungsgemeinschaft (DFG, German Research Foundation) under Germany’s Excellence Strategy EXC2181/1-390900948 (the Heidelberg STRUCTURES Excellence Cluster). The authors acknowledge support by the state of Baden-Württemberg through bwHPC.Appendix A Determination of the spectral dimension
In order to determine the spectral dimension of the 2D long-range dilute graph (LRDG) as a function of , we generate 64 different graph realizations for each value of , for different sizes of the underlying lattice, from up to . For each realization we calculate the lattice Laplacian, defined as
| (9) |
where , run over all vertices , of the graph and is the degree of the -th vertex. Subsequently, we obtain the low-lying eigenvalues of the Laplacian matrix using the implicitly restarted Arnoldi-Lanczos method. Finally, we average over the different realizations of the graph. A typical averaged lattice Laplacian spectrum corresponding to is shown in Fig. 5; we observe that, in the present two-dimensional case, low-lying eigenvalues are arranged in quartets.
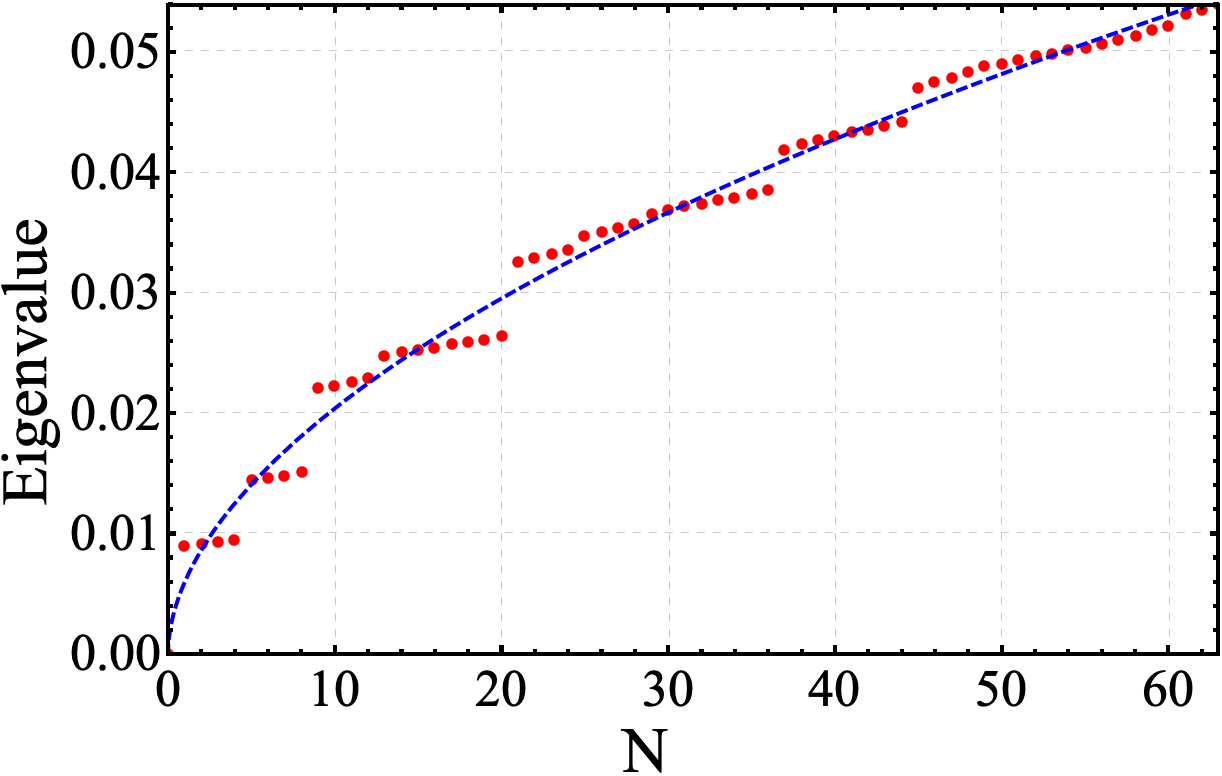
The Laplacian spectrum can be used to provide an accurate determination of the spectral dimension as a function of . In order to do so, we recall that the scaling of the -th eigenvalue , when varying the linear size of the underlying two-dimensional lattice, follows the relation
| (10) |
We then consider three averaged Laplacian spectra from graphs of different sizes , , extracting the spectral dimension from the scaling of the eigenvalues. We find that replacing every quartet with a single representative average yields slightly better precision.
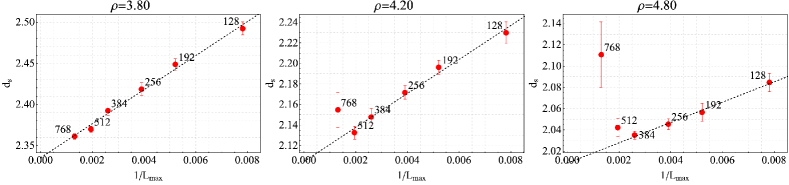
In addition to this, to correct for nonlinearities, we apply the method just described to several triplets of different lattice sizes, in particular using the triplets , , , , , and . For each triplet, we consider the result of the determination as a function of , where is the largest lattice size in the triplet. For we observe a consistently linear trend in this plot, allowing one to obtain a very precise extrapolation of the spectral dimension to infinite size, see Fig. 6, left panel. On the other hand, starting at one observes a breakdown of this linearity, see Fig. 6, middle and right panel. In this case we have to exclude the largest or the two largest sizes from the final extrapolation. Our final determination of the critical dimension , as used in the main text, follows this analysis, see Fig. 7.
Appendix B Determination of critical exponent
Let us consider a self-avoiding random walk (SARW) of length on a two-dimensional long-range dilute graph, and let us call the position at the -th step . Without loss of generality, for an infinite graph one can always take to coincide with the origin. We measure distances according the metric of the underlying square lattice. The spatial extent of the self-avoiding random walk is conventionally measured by the end-to-end distance
| (11) |
by the squared gyration radius
| (12) |
which is the mean squared distance of each monomer of the SARW with respect to the center of mass, or by the mean squared distance of a monomer from the endpoints
| (13) |
All these quantities exhibit the same asymptotic behaviour
| (14) |
where is a critical exponent, and the ratios of these quantities, e.g. , are constant and universal. Therefore, in the following analysis we focus on the end-to-end distance, and we define .
In order to determine numerically, we run Monte Carlo simulations using an extension of the tortoise algorithm — as explained in the main text — on graphs of dimensions , and . We consider 128 different graph realizations for each value of , and for each realization we average over 128 Monte Carlo runs, each run consisting of thermalization steps, followed by an additional sampling steps. The simulation parameter is preliminarily tuned as to obtain an average length of the SARW of .
While analyzing the Monte Carlo data for , one must note that the main difficulty comes from the fact that the simple power law in Eq. (14) is modified both at small and large values of . For small , one expects the scaling corrections to play a relevant role. Indeed, using RG arguments Wegner (1972); Havlin and Ben-Avraham (1983); Nickel (1991), one can derive the corrected scaling
| (15) |
where the exponents and the constants are non-universal. On the other hand, for large values of — more precisely for values comparable to the lattice size — one expects that the finite size of the lattice used in numerical simulations would also modify the expected scaling as a sizeable fraction of the walks span the entire graph.
One then aims to identify an intermediate region where the scaling corrections of Eq. (15) and finite-size effects are smaller than the desired precision. In order to find this region we consider as a function of for different lattice sizes, as shown in Fig. 8. It shows that the length of the walks for different lattice sizes, which depends on due to the long-range nature of the graph, scales with the same slope in the log-log plot, and hence with the same critical exponent . We can further refine this analysis by taking the derivative of the data in Fig. 8, which is shown in the main text in Fig. 4. A scaling region at intermediate values of is apparent where the curves for different lattice sizes overlap for in the top panel, as marked by the red dashed lines. We observe an unambiguous collapse region for large values of , while for smaller values of the collapse region is less pronounced (bottom panel).
This behaviour suggests how to carry out the final analysis for the determination of : at first one defines a ‘confidence region’ where the collapse of the curves is observed. In this collapse region one finds independent of and can extrapolate to as the intercept on the vertical axis (top panel of Fig. 4). For smaller values of , as shown in the bottom panel of Fig. 4, we find that a reliable procedure consists in extrapolating with a linear function tangent to the dataset for the largest lattice size (green curve). The final values resulting from this analysis are shown in Fig. 9.
References
- Kardar (2007) M. Kardar, Statistical Physics of Fields (Cambridge University Press, 2007).
- Sachdev (2011) S. Sachdev, Quantum Phase Transitions, 2nd ed. (Cambridge University Press, 2011).
- Guggenheim (1945) E. A. Guggenheim, J. Chem. Phys. 13, 253 (1945).
- Bak (1997) P. Bak, How Nature Works: The Science of Self-organized Criticality (Oxford University Press, 1997).
- Parisi (1998) G. Parisi, Statistical Field Theory (Avalon Publishing, 1998).
- Fisher (1967) M. E. Fisher, Rep. Prog. Phys. 30, 615 (1967).
- Domb (1996) C. Domb, The Critical Point: A Historical Introduction To The Modern Theory Of Critical Phenomena (CRC Press, 1996).
- Cardy et al. (1996) J. Cardy, P. Goddard, and J. Yeomans, Scaling and Renormalization in Statistical Physics, Cambridge Lecture Notes in Physics (Cambridge University Press, 1996).
- Holovatch (1993) Y. Holovatch, Theor. Math. Phys. 96, 1099 (1993).
- Brézin and Wadia (1993) E. Brézin and S. Wadia, The Large N Expansion in Quantum Field Theory and Statistical Physics: From Spin Systems to 2-dimensional Gravity (World Scientific, 1993).
- Kleinert and Schulte-Frohlinde (2001) H. Kleinert and V. Schulte-Frohlinde, Critical Properties Of Theories (World Scientific Publishing Company, 2001).
- Pelissetto and Vicari (2002) A. Pelissetto and E. Vicari, Phys. Rep. 368, 549 (2002).
- Codello and D’Odorico (2013) A. Codello and G. D’Odorico, Phys. Rev. Lett. 110, 141601 (2013).
- Codello et al. (2015) A. Codello, N. Defenu, and G. D’Odorico, Phys. Rev. D 91, 105003 (2015).
- Hasenbusch (2001) M. Hasenbusch, Int. J. Mod. Phys. C 12, 911 (2001).
- Poland et al. (2019) D. Poland, S. Rychkov, and A. Vichi, Rev. Mod. Phys. 91, 015002 (2019).
- Defenu et al. (2021) N. Defenu, T. Donner, T. Macrì, G. Pagano, S. Ruffo, and A. Trombettoni, “Long-range interacting quantum systems,” (2021), arXiv:2109.01063.
- Honjo et al. (2021) T. Honjo, T. Sonobe, K. Inaba, T. Inagaki, T. Ikuta, Y. Yamada, T. Kazama, K. Enbutsu, T. Umeki, R. Kasahara, K.-i. Kawarabayashi, and H. Takesue, Sci. Adv. 7, eabh0952 (2021).
- Herrero and Saboyá (2003) C. P. Herrero and M. Saboyá, Phys. Rev. E 68, 268 (2003).
- Herrero (2005) C. P. Herrero, Physical Review E 71, 12 (2005).
- Dorogovtsev et al. (2008) S. N. Dorogovtsev, A. V. Goltsev, and J. F. F. Mendes, Rev. Mod. Phys. 80, 1275 (2008).
- Hattori et al. (1987) K. Hattori, T. Hattori, and H. Watanabe, Prog. Theor. Phys. Suppl. 92, 108 (1987).
- Mermin and Wagner (1966) N. D. Mermin and H. Wagner, Phys. Rev. Lett. 17, 1133 (1966).
- Mermin (1967) N. D. Mermin, J. Math. Phys. 8, 1061 (1967), https://doi.org/10.1063/1.1705316 .
- Fröhlich et al. (1976) J. Fröhlich, B. Simon, and T. Spencer, Comm. Math. Phys. 50, 79 (1976).
- Fröhlich et al. (1976) J. Fröhlich, B. Simon, and T. Spencer, Phys. Rev. Lett. 36, 804 (1976).
- Cassi (1992) D. Cassi, Phys. Rev. Lett. 68, 3631 (1992).
- Burioni et al. (1999a) R. Burioni, D. Cassi, and A. Vezzani, Phys. Rev. E 60, 1500 (1999a).
- Burioni and Cassi (1996) R. Burioni and D. Cassi, Phys. Rev. Lett. 76, 1091 (1996).
- Burioni et al. (1998a) R. Burioni, D. Cassi, and C. Destri, J. Magn. Magn. Mater. 177-181, 153 (1998a).
- Cassi and Fabbian (1999) D. Cassi and L. Fabbian, J. Phys. A: Math. Gen. 32, L93 (1999).
- Edwards (1965) S. F. Edwards, Proc. Phys. Soc. 85, 613 (1965).
- Sokal (1996a) A. D. Sokal, Nucl. Phys. B 47, 172 (1996a).
- Barat and Chakrabarti (1995) K. Barat and B. K. Chakrabarti, Physics Reports 258, 377 (1995).
- Clisby (2010a) N. Clisby, Phys. Rev. Lett. 104, 055702 (2010a).
- Slade (2019) G. Slade, Proc. R. Soc. Lond. A 475, 20180549 (2019).
- de Gennes (1972) P. de Gennes, Phys. Lett. A 38, 339 (1972).
- Emery (1975) V. J. Emery, Phys. Rev. B 11, 239 (1975).
- Houghton and Schafer (1979) A. Houghton and L. Schafer, J. Phys. A: Math. Gen. 12, 1309 (1979).
- Flory and Leutner (1948) P. J. Flory and F. S. Leutner, J. Polym. Sci. 3, 880 (1948).
- Bhattacharjee et al. (2013) S. M. Bhattacharjee, A. Giacometti, and A. Maritan, J. Phys. : Cond. Matt. 25, 503101 (2013).
- Nienhuis (1982) B. Nienhuis, Phys. Rev. Lett. 49, 1062 (1982).
- Millán et al. (2021) A. P. Millán, G. Gori, F. Battiston, T. Enss, and N. Defenu, Phys. Rev. Research 3, 023015 (2021).
- Cassi (1996) D. Cassi, Phys. Rev. Lett. 76, 2941 (1996).
- Burioni et al. (1999b) R. Burioni, D. Cassi, and A. Vezzani, J. Phys. A: Math. Gen. 32, 5539 (1999b).
- Berganza and Leuzzi (2013) M. I. Berganza and L. Leuzzi, Phys. Rev. B 88, 144104 (2013).
- Cescatti et al. (2019) F. Cescatti, M. Ibáñez Berganza, A. Vezzani, and R. Burioni, Phys. Rev. B 100, 054203 (2019).
- Biskup (2004) M. Biskup, Annals of Probability 32, 2938 (2004).
- Defenu et al. (2020) N. Defenu, A. Codello, S. Ruffo, and A. Trombettoni, J. Phys. A: Math. Theor. 53, 143001 (2020).
- Roerdink (1985) J. Roerdink, Physica A 132, 253 (1985).
- Madras and Sokal (1988) N. Madras and A. D. Sokal, J. Stat. Phys. 50, 109 (1988).
- Clisby (2010b) N. Clisby, Phys. Rev. Lett. 104, 055702 (2010b).
- Sokal (1996b) A. D. Sokal, Nucl. Phys. B 47, 172 (1996b).
- Berretti and Sokal (1985) A. Berretti and A. D. Sokal, Journal of Statistical Physics 40, 483 (1985).
- van Mieghem (2010) P. van Mieghem, Graph Spectra for Complex Networks (Cambridge University Press, 2010).
- Lorenz and Ziff (1998) C. D. Lorenz and R. M. Ziff, Phys. Rev. E 57, 230 (1998).
- Nakanishi and Stanley (1980) H. Nakanishi and H. E. Stanley, Phys. Rev. B 22, 2466 (1980).
- Adler et al. (1990) J. Adler, Y. Meir, A. Aharony, and A. B. Harris, Phys. Rev. B 41, 9183 (1990).
- Angelini et al. (2014) M. C. Angelini, G. Parisi, and F. Ricci-Tersenghi, Phys. Rev. E 89, 062120 (2014).
- Defenu et al. (2015) N. Defenu, A. Trombettoni, and A. Codello, Phys. Rev. E 92, 052113 (2015).
- Horita et al. (2017) T. Horita, H. Suwa, and S. Todo, Phys. Rev. E 95, 012143 (2017).
- de Carvalho et al. (1983) C. de Carvalho, S. Caracciolo, and J. Fröhlich, Nucl. Phys. B 215, 209 (1983).
- Luijten and Blöte (1996) E. Luijten and H. W. J. Blöte, Phys. Rev. Lett. 76, 1557 (1996).
- Flores-Sola, Emilio J. et al. (2015) Flores-Sola, Emilio J., Berche, Bertrand, Kenna, Ralph, and Weigel, Martin, Eur. Phys. J. B 88, 28 (2015).
- Flores-Sola et al. (2016) E. Flores-Sola, B. Berche, R. Kenna, and M. Weigel, Phys. Rev. Lett. 116, 115701 (2016).
- Grassberger (1985) P. Grassberger, Journal of Physics A: Mathematical and General 18, L463 (1985).
- Katzgraber et al. (2009) H. G. Katzgraber, D. Larson, and A. P. Young, Phys. Rev. Lett. 102, 177205 (2009).
- Larson et al. (2010) D. Larson, H. G. Katzgraber, M. A. Moore, and A. P. Young, Physical Review B 81, 064415 (2010).
- Leuzzi et al. (2008) L. Leuzzi, G. Parisi, F. Ricci-Tersenghi, and J. J. Ruiz-Lorenzo, Phys. Rev. Lett. 101, 107203 (2008).
- Leuzzi and Parisi (2013) L. Leuzzi and G. Parisi, Phys. Rev. B 88, 224204 (2013).
- Sharma and Young (2011) A. Sharma and A. P. Young, Phys. Rev. B 84, 014428 (2011).
- Burioni et al. (1998b) R. Burioni, D. Cassi, A. Pirati, and S. Regina, J. Phys. A: Math. Gen. 31, 5013 (1998b).
- Merkl and Wagner (1994) F. Merkl and H. Wagner, J. Stat. Phys. 75, 153 (1994).
- Burioni and Cassi (1993) R. Burioni and D. Cassi, Mod. Phys. Lett. B 07, 1947 (1993).
- Wu and Yang (1995) S. Wu and Z. R. Yang, Journal of Physics A: Mathematical and General 28, 6161 (1995).
- Burioni and Cassi (1995) R. Burioni and D. Cassi, Phys. Rev. E 51, 3782 (1995).
- Gefen et al. (1981) Y. Gefen, A. Aharony, B. B. Mandelbrot, and S. Kirkpatrick, Phys. Rev. Lett. 47, 1771 (1981).
- Cardy (1994) J. Cardy, Nucl. Phys. B 419, 411 (1994).
- Bennett-Wood et al. (1998) D. Bennett-Wood, J. Cardy, I. Enting, A. Guttmann, and A. Owczarek, Nucl. Phys. B 528, 533 (1998).
- Caracciolo et al. (1999) S. Caracciolo, M. S. Causo, P. Grassberger, and A. Pelissetto, J. Phys. A: Math. Gen. 32, 2931 (1999).
- Gori et al. (2017) G. Gori, M. Michelangeli, N. Defenu, and A. Trombettoni, Phys. Rev. E 96, 012108 (2017).
- Halberstam and Hutchcroft (2022) N. Halberstam and T. Hutchcroft, Proc. R. Soc. Lon. A 478, 20210857 (2022).
- Barredo et al. (2018) D. Barredo, V. Lienhard, S. de Léséleuc, T. Lahaye, and A. Browaeys, Nature 561, 79 (2018).
- Helmrich et al. (2020) S. Helmrich, A. Arias, G. Lochead, T. M. Wintermantel, M. Buchhold, S. Diehl, and S. Whitlock, Nature 577, 481 (2020).
- Wegner (1972) F. J. Wegner, Phys. Rev. B 5, 4529 (1972).
- Havlin and Ben-Avraham (1983) S. Havlin and D. Ben-Avraham, Phys. Rev. A 27, 2759 (1983).
- Nickel (1991) B. G. Nickel, Macromolecules 24, 1358 (1991).