Fine-structure transitions of the carbon isoelectronic sequence C, N+ and O2+ induced by collisions with atomic hydrogen
Abstract
Fine-structure transitions can be involved in various processes including photon absorption, charge transfer and inelastic collision between ions, electrons and neutral atoms. We present fine-structure excitation and relaxation cross sections for the collisions of the first few members of the carbon isoelectronic sequence (C, N+ and O2+) with atomic hydrogen calculated using quantum-mechanical methods. For C, the scattering theory and computational approach is verified by comparison with previous calculations. The rate coefficients for the collisional processes are obtained. For N+ and O2+, the transitions correspond to the lines [O iii] 52 µm, [O iii] 88 µm, [N ii] 122 µm, and [N ii] 205 µm, observed in the far-infrared in the local Universe and more recently in high-redshift galaxies using radio interferometry. The influence of different potentials on the cross sections and rate coefficients are demonstrated.
keywords:
ISM – molecular processes – scattering processes1 Introduction
In many astrophysical environments, fine-structure levels of atoms and ions are populated by collisions with electrons, hydrogen atoms, and hydrogen molecules, as well as by photons. Excitation of an atom by such collisions might be followed by spontaneous emission leading to a loss of kinetic energy or “cooling.” The competition between relaxation of the fine-structure levels by collisions and spontaneous emission affects the diagnostic potential of the observed lines. Cross sections and rate coefficients for collisional relaxation can be calculated and used in sophisticated modeling codes to interpret astronomical observations.
In the far-infrared, the lines [O i] 63 µm, [O i] 146 µm, and [C ii] 158 µm are commonly observed and utilized as probes of physical conditions; accordingly the collisions of O and C+ with electrons, hydrogen atoms, and hydrogen molecules are well-studied. Recently, the rest-frame far-infrared lines [O iii] 52 µm, [O iii] 88 µm, [N ii] 122 µm, and [N ii] 205 µm, became of interest111For completeness, we note that [N iii] 57 µm is of interest, but we do not treat it in this paper. in observations of high-redshift galaxies () using ALMA, see, for example, Inoue et al. (2014), Sugahara et al. (2021), and Ramos Padilla et al. (2022). While the O2+ and N+ lines above generally trace Hii regions and thus are expected to be most affected by electron collisions—for which collision strengths are available, see Tayal (2011); Tayal & Zatsarinny (2017)—complete interpretations of these nascent high- observations are still in their infancy and as far as we know, no data on the collisional cross sections and rate coefficients for fine-structure excitation or de-excitation of N+ or O2+ in collisions with H are available should they be needed for modeling or simulation. In the present paper, we treat the collisions
| (1) |
where A can be C, N+ and O2+ and can be , , or . For ground state carbon atoms, quantum-mechanical calculations of cross sections for process (1) were previously reported by Launay & Roueff (1977) and Abrahamsson et al. (2007). Although the atomic structure of the ions is in some ways similar to neutral carbon we find that in collisions with hydrogen atoms the resulting cross sections and rate coefficients have quantitative differences.
2 Theoretical Models
We use a close-coupling scattering formulation (Mies, 1973; Launay & Roueff, 1977) with the wave function expanded in the space-fixed basis as
| (2) |
where the two colliding systems are labeled and , is the reduced radial wave function, is the internuclear distance, is the total electric angular momentum, and is the total angular momentum. With the total wave function (Eq. 2), the Schrödinger equation that describes the internal motions of the C, N+ or O2+ ion and H system can be reduced to a set of coupled differential equations, expressed in atomic units (a.u.) as
| (3) |
with the wave number defined by , where is the reduced mass of systems and , is the total collision energy, and is the fine-structure state splitting energy of the C, N+, or O2+ atom. We adopt the values of from NIST (Kramida et al., 2022): For the C atom
| (4) |
for the N+ ion,
| (5) |
and for the O2+ ion,
| (6) |
is the coupling matrix given by the summation of the and matrices in the basis . The matrix is diagonal and the nonzero elements are the fine-structure splittings that are given above in (4), (5), or (6). For the elements of the potential energy matrix, we adopt the expression described in Launay & Roueff (1977); Flower et al. (2000); Krems et al. (2006). Then the cross sections for fine-structure transitions are calculated by
| (7) |
| (8) |
where are the partial cross sections and the matrix is defined by , where is the open channel reaction matrix defined in Johnson (1973). The maximum value for the partial waves is set as 1000 and for the maximum collision energy used (9.05 eV), the partial cross section converged for CH at about 300, for NH+ at about 500, and for OH2+ at about 990.
3 Interatomic Potentials
For the CH system, the four electronic states involved in the fine-structure transitions of C(3P) in collisions with H(2S) are the b, B, a, and X states. The present calculations, using the MRCI-DKH (Douglas-Kroll-Hess) method with the aug-cc-pV5Z-dk basis within Molpro 2010.1 (Werner et al., 2010), are shown in Fig. 1.
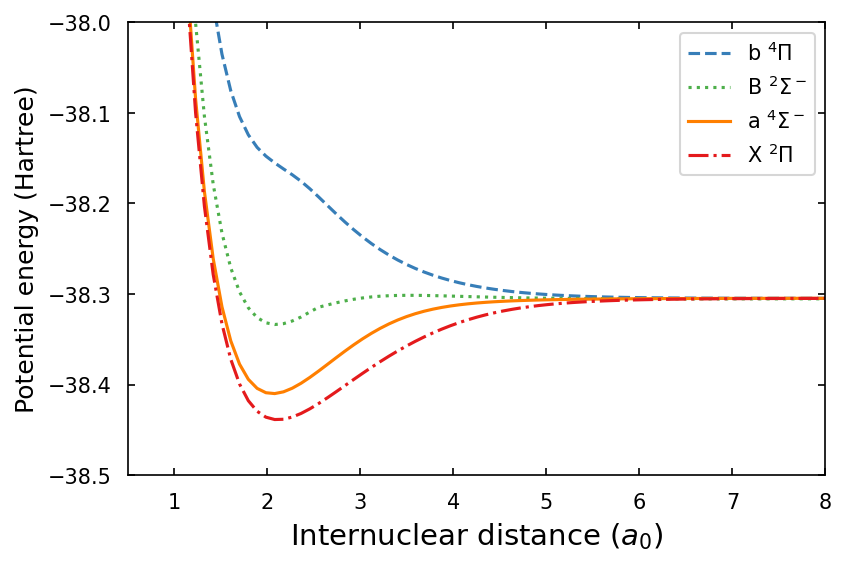
The calculated potential energies were smoothly joined to the long-range potential function at , where we used the value a.u. (Yau & Dalgarno, 1976).
For the NH+ system, the four electronic states involved in the fine-structure transitions of N+(3P) in collision with H(2S) are the 2, 1, 1, and X states. The present calculations, using the MRCI-DKH (Douglas-Kroll-Hess) method with the aug-cc-pV5Z-dk basis within Molpro 2010.1 (Werner et al., 2010), are shown in Fig. 2,
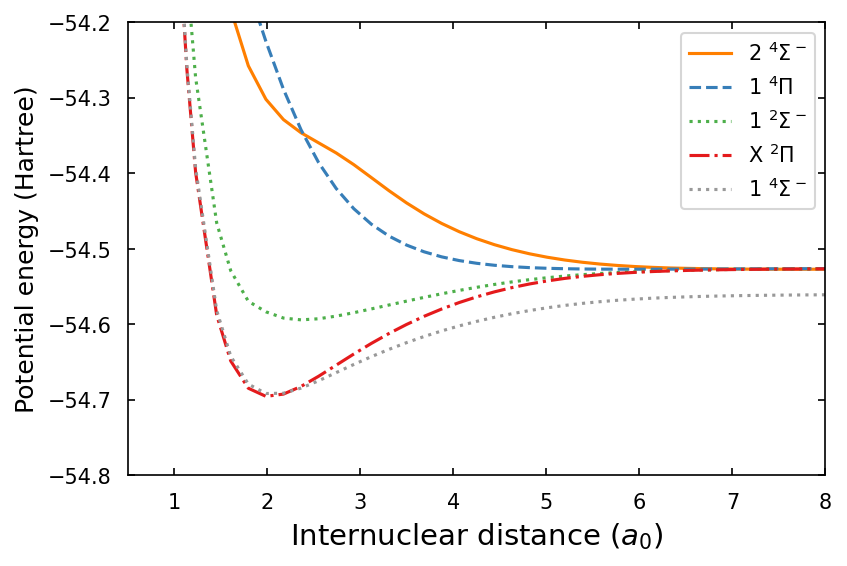
along with the 1 state correlating to N(4S) + H+(1S). The potentials were joined at to the long-range charge-induced dipole interaction between N+(3P) and H(2S), where a.u. is the polarizability of the hydrogen atom.
For the OH2+ system, the four electronic states that are involved in the fine-structure transitions of O2+(3P) in collision with H(2S) are the 3, 2, 2, and 3 states. We adopted the recent MRCI+Q calculations using the aug-cc-pV5Z basis that were presented by De Melo et al. (2021) and which we show in Fig. 3.
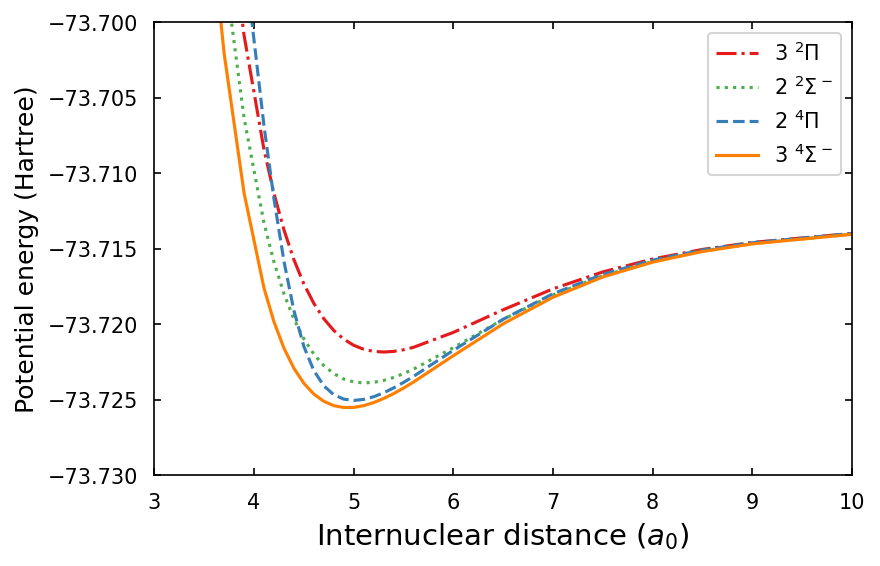
The long-range charge-induced dipole interaction potential between O2+(3P) ion and the H(2S) atom was smoothly connected to the potentials at .
4 Scattering calculations
Using the theoretical quantum description of a collision between two open-shell atoms in arbitrary angular momentum states derived by Krems et al. (2006), the scattering calculations were performed using a Python code that we wrote based partially on the Molcol Fortran 77 code (Flower et al., 2019) utilizing Johnson’s multichannel logarithmic derivative algorithm (Johnson, 1973). In order to prove the reliability of the present approach, the Python code was tested by calculating cross sections for the C+-H, the Si+-H, and the O-H systems (Yan & Babb, 2022b); in all these cases, the corresponding rate coefficients were found to be in very good agreement with those of preceding calculations from the literature when we used the potential energy data of the original sources. In the following, we will also show that our calculations of the cross sections and rate coefficients for the C-H system are in good accord with those of others.
Having established the reliability of our theory and code, the cross sections were computed for collisional energies up to about 8.6 eV. The scattering equations were integrated from to . The corresponding excitation and relaxation rate coefficients were computed for temperatures up to 10,000 K by averaging over a Maxwellian energy distribution,
| (9) |
where is the temperature, is Boltzmann’s constant, is the cross section, and is the kinetic energy.
5 Results
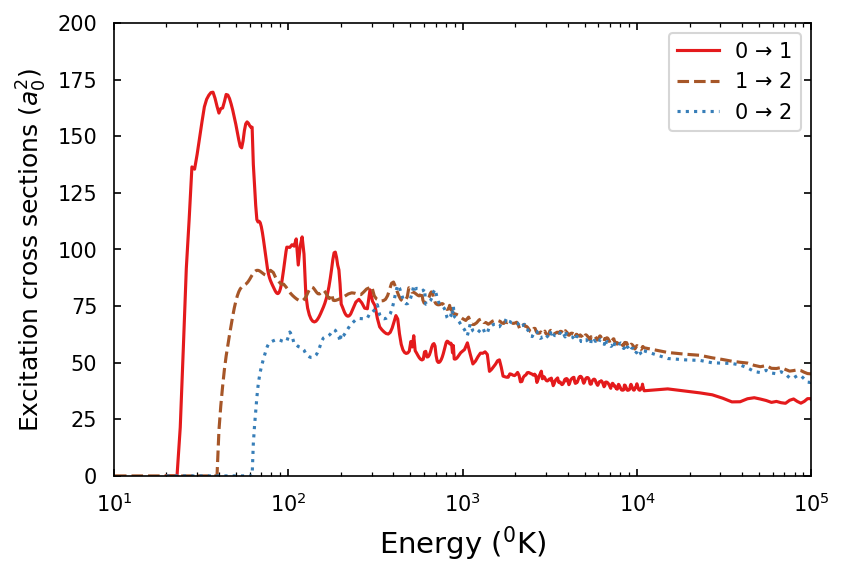
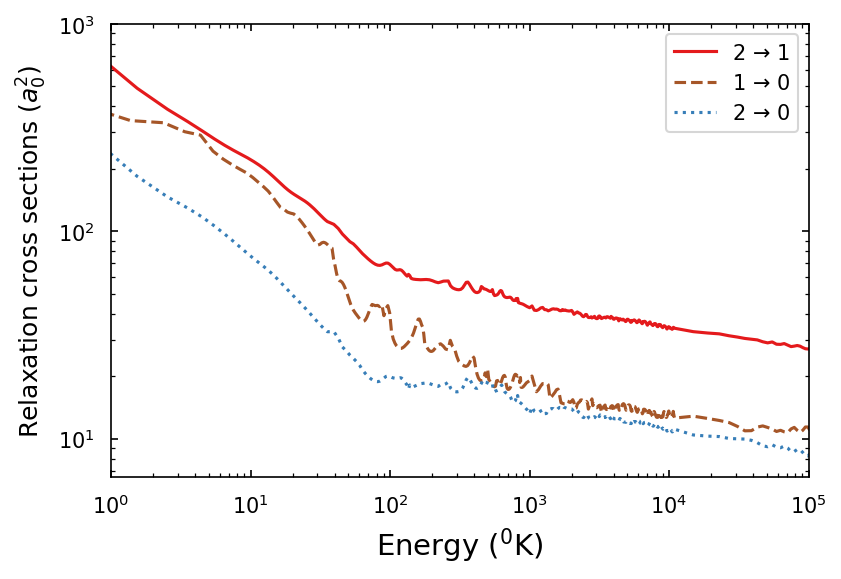
With the CH potentials as described above, the calculated excitation and relaxation cross sections 222Note that the cross sections correspond strictly to the process (1) and we calculate these to energies K to have a suitable integrand for the rate coefficient of Eq. (9). In a gas of temperature K or higher cross sections corresponding to other channels such as and might be opened. are shown in Fig. 4.
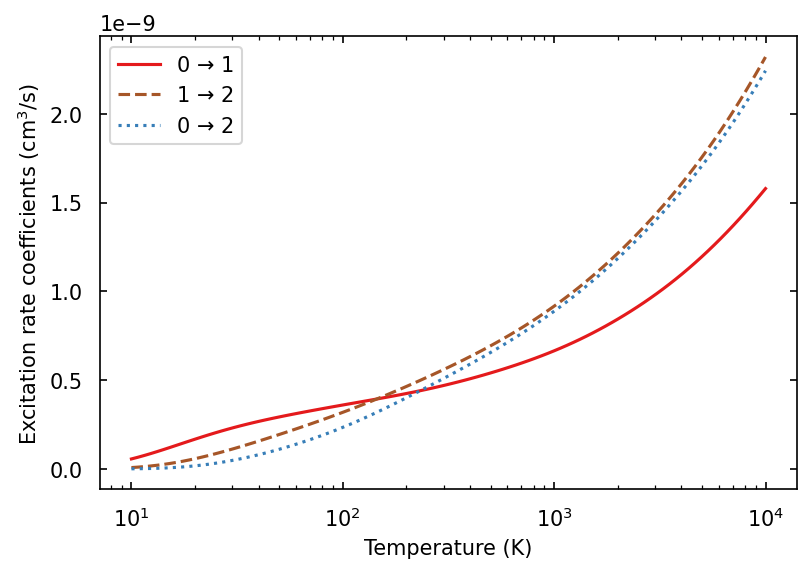
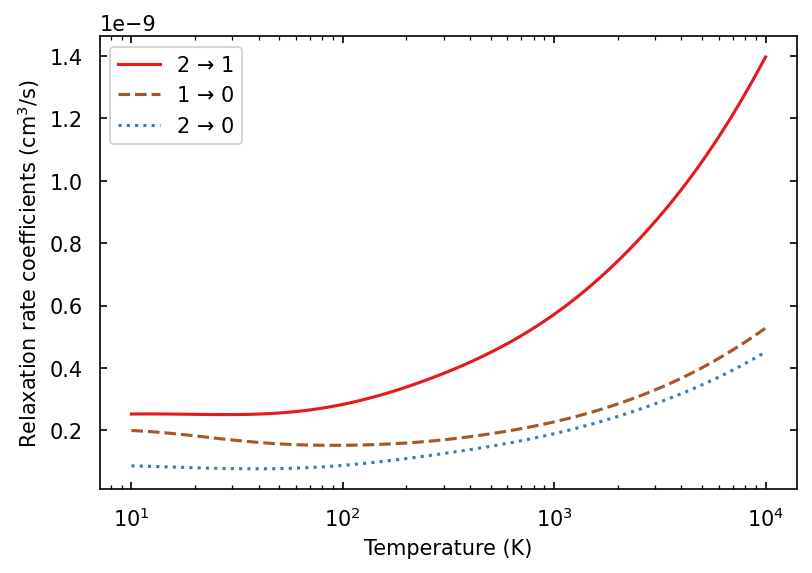
The corresponding rate coefficients as functions of temperature are given in Fig. 5
and Table 1.
| (K) | |||
|---|---|---|---|
| 100 | 0.360 | 0.234 | 0.319 |
| 200 | 0.425 | 0.401 | 0.465 |
| 500 | 0.540 | 0.656 | 0.693 |
| 700 | 0.596 | 0.762 | 0.794 |
| 1000 | 0.665 | 0.888 | 0.917 |
| 2000 | 0.844 | 1.185 | 1.215 |
| 5000 | 1.195 | 1.707 | 1.755 |
| 7000 | 1.368 | 1.948 | 2.010 |
| 10000 | 1.579 | 2.242 | 2.320 |
| (K) | |||
| 10 | 0.199 | 0.086 | 0.252 |
| 20 | 0.182 | 0.080 | 0.251 |
| 50 | 0.157 | 0.077 | 0.256 |
| 70 | 0.153 | 0.081 | 0.265 |
| 100 | 0.152 | 0.088 | 0.283 |
| 200 | 0.159 | 0.110 | 0.339 |
| 500 | 0.189 | 0.149 | 0.450 |
| 700 | 0.205 | 0.167 | 0.504 |
| 1000 | 0.227 | 0.189 | 0.572 |
| 2000 | 0.284 | 0.245 | 0.743 |
| 5000 | 0.400 | 0.346 | 1.061 |
| 7000 | 0.458 | 0.393 | 1.213 |
| 10000 | 0.527 | 0.451 | 1.397 |
From Fig. 5, we see that at low temperatures (or relatively small kinetic energies), the excitation rate coefficient of the transition is larger than those of the and transitions. The energy differences of the transition are the smallest leading to this being the strongest transition. With increasing temperature (kinetic energy), we find that the rate coefficients for the transition drop to being the smallest, such behavior is explained by the “forbidden” selection rules demonstrated by Monteiro & Flower (1987). This “forbidden” selection rule may explain the lower relaxation rate coefficients of and transitions compared to that of the transition. In order to further prove the reliability of the present approach, we also made comparisons of the present calculations with those of Launay & Roueff (1977) and of Abrahamsson et al. (2007), as shown in Fig. 6.
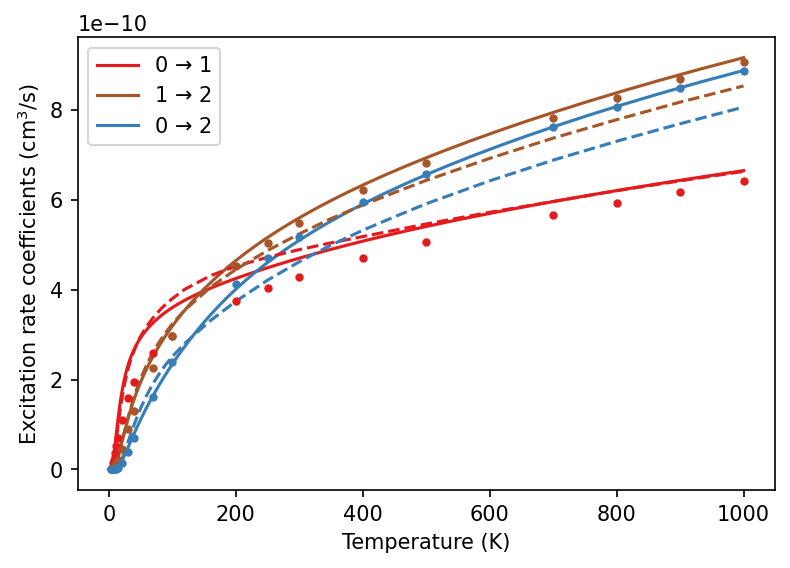
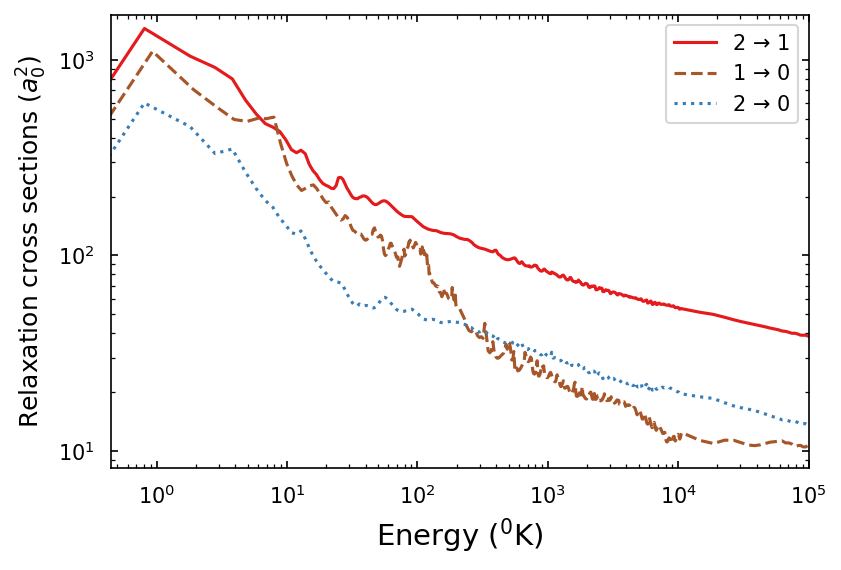
It can be seen that the present calculations are in good agreement with the other works, especially for the transitions. The discrepancies for the rate coefficients of the and transitions could be caused by the different potentials we used. Comparing Figs. 4 and 5, it is apparent that the relaxation cross sections decrease as a function of energy, while the relaxation rate coefficients increase as a function of temperature, a consequence of the energy dependence in the integrand of Eq. (9). For example, the log-log plot of Fig. 4 shows that the relaxation cross sections decrease slowly for energy and thus the relaxation rate coefficients shown in Fig. 5 increase for .
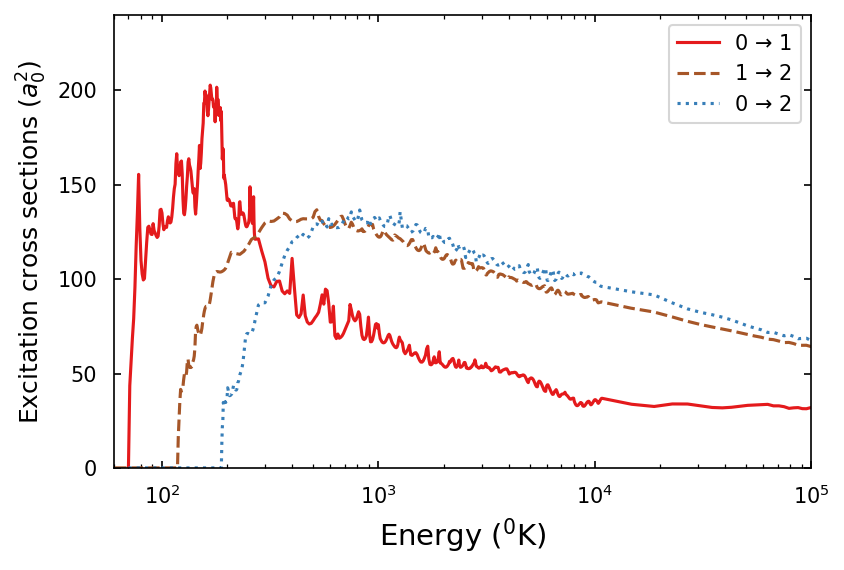
With the NH+ potentials as described above, the calculated excitation and relaxation cross sections are shown in Fig. 7.
The corresponding rate coefficients for the fine structure transitions of N+ in collision with H as a function of temperature are given in Fig. 8
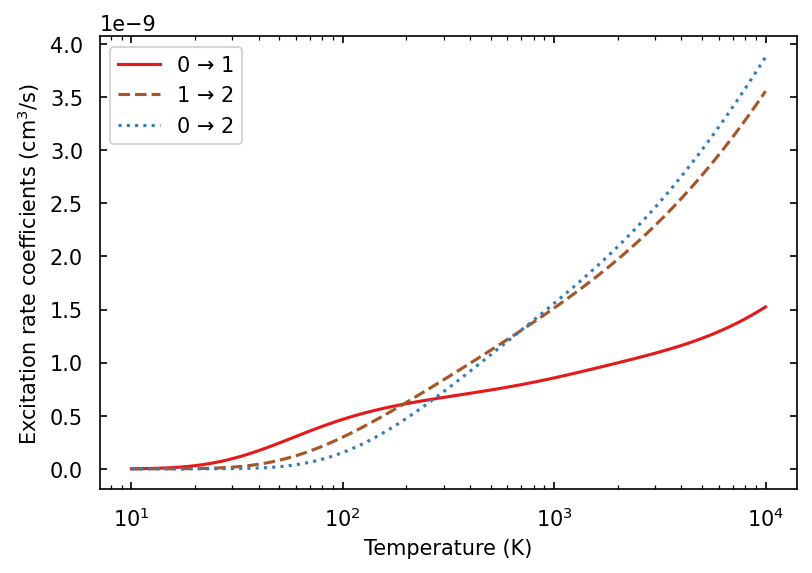
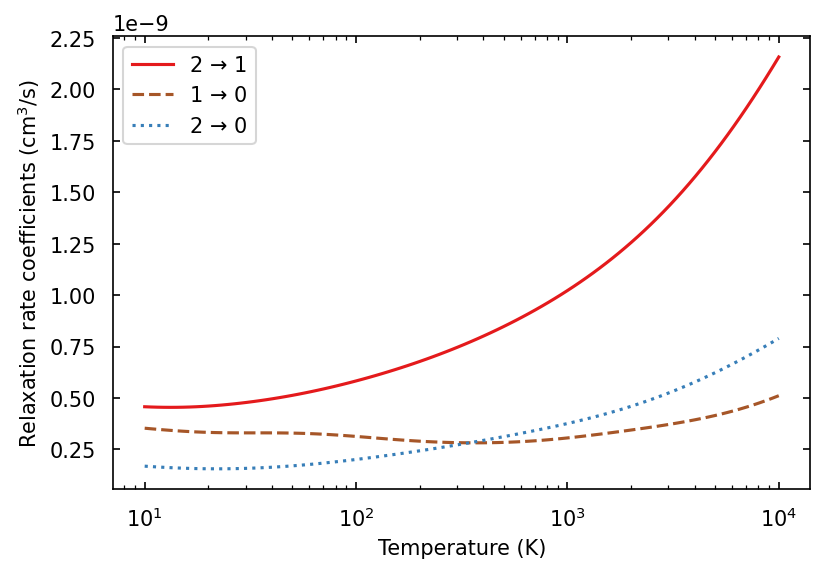
and Table 2.
| (K) | |||
|---|---|---|---|
| 100 | 0.466 | 0.153 | 0.298 |
| 200 | 0.613 | 0.475 | 0.626 |
| 500 | 0.742 | 1.072 | 1.116 |
| 700 | 0.793 | 1.306 | 1.305 |
| 1000 | 0.856 | 1.558 | 1.514 |
| 2000 | 0.998 | 2.093 | 1.973 |
| 5000 | 1.228 | 3.002 | 2.764 |
| 7000 | 1.353 | 3.408 | 3.126 |
| 10000 | 1.524 | 3.878 | 3.556 |
| (K) | |||
| 10 | 0.353 | 0.169 | 0.458 |
| 20 | 0.333 | 0.156 | 0.461 |
| 50 | 0.330 | 0.171 | 0.513 |
| 70 | 0.324 | 0.184 | 0.544 |
| 100 | 0.314 | 0.201 | 0.583 |
| 200 | 0.290 | 0.244 | 0.678 |
| 500 | 0.285 | 0.313 | 0.848 |
| 700 | 0.292 | 0.342 | 0.927 |
| 1000 | 0.306 | 0.376 | 1.022 |
| 2000 | 0.345 | 0.460 | 1.256 |
| 5000 | 0.415 | 0.624 | 1.698 |
| 7000 | 0.455 | 0.700 | 1.907 |
| 10000 | 0.511 | 0.790 | 2.158 |
Compared to the CH system, the cross sections and rate coefficients of the and transitions for the NH+ system are larger because of the stronger long-range attractions and deeper potential wells as shown in Fig. 2. Furthermore, we find that for NH+ the transition rate coefficient is the largest compared to CH where the transition is the largest. This phenomenon might be caused by the different shapes of the potentials for the two systems: The 1 state of the CH system has a much deeper well than the 2 state of the NH+ system. Similarly to the CH system, the excitation rate coefficients of the transition are also the smallest among the three transitions because of the “forbidden” selection rule. can be removed by the exothermic charge transfer process (Butler & Dalgarno, 1979)
| (10) |
The rate coefficients were calculated by Lin et al. (2005) and they decrease from a value of about at and appear to be considerably slower than the relaxation process which is no less than even at .
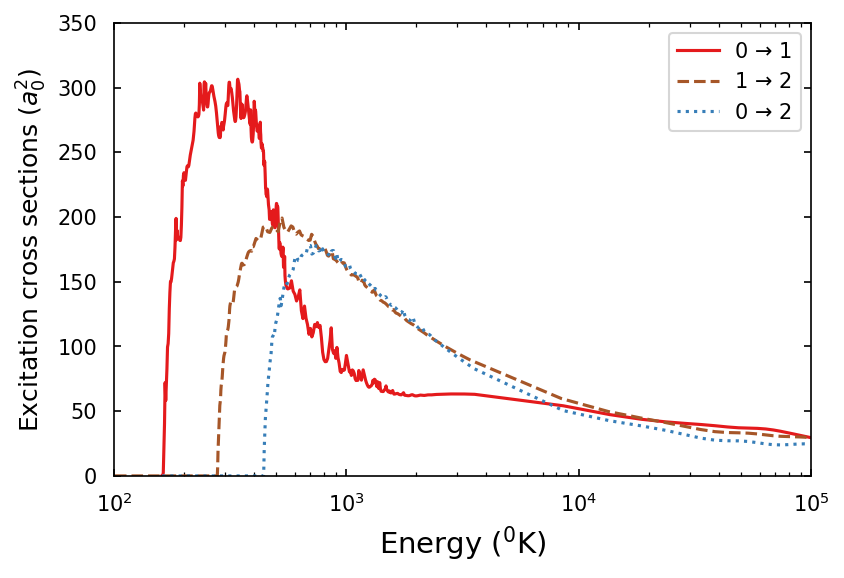
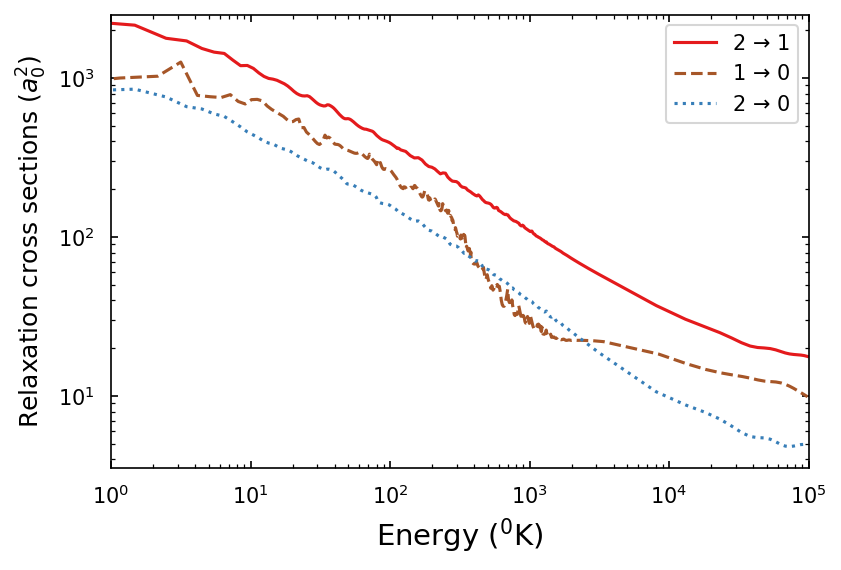
With the OH2+ potentials as described above, the calculated cross sections for fine structure transition of O2+ in collision with H are shown in Fig. 9.
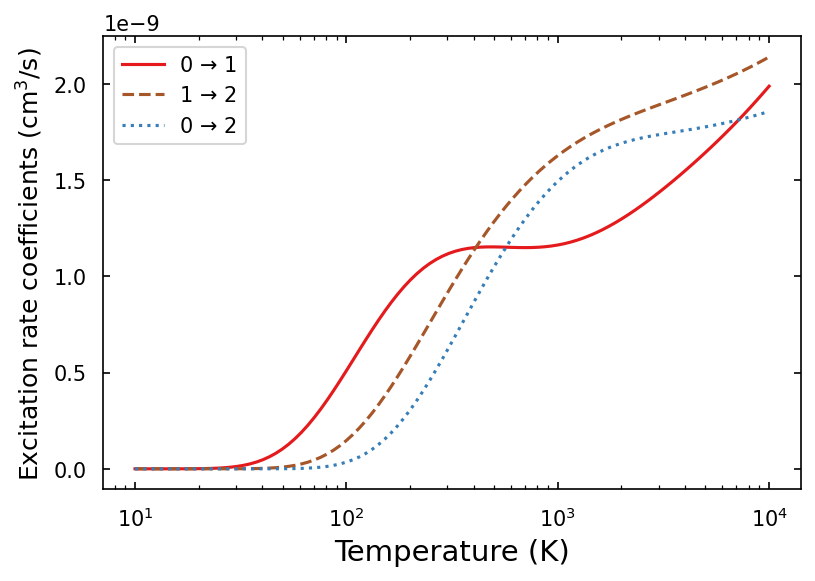
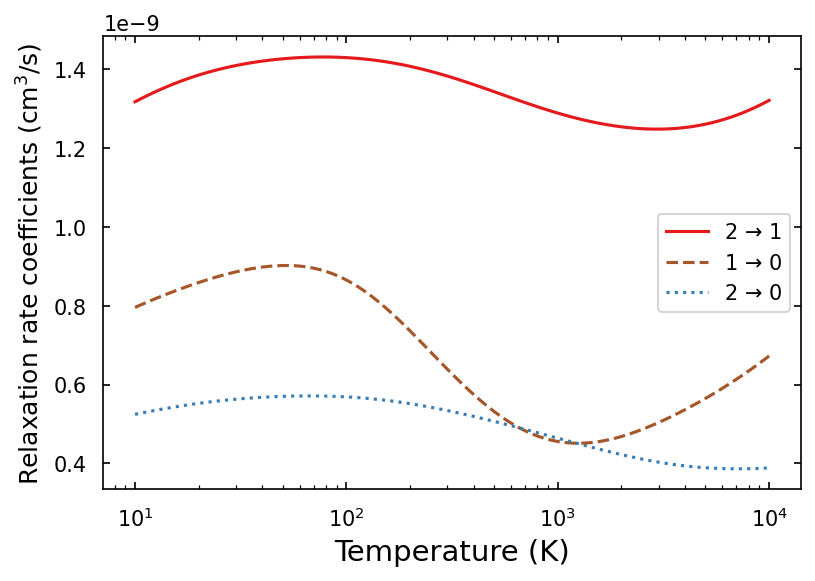
The corresponding rate coefficients are given in Fig. 10
and Table 3.
| (K) | |||
|---|---|---|---|
| 100 | 0.510 | 0.348 | 0.147 |
| 200 | 0.979 | 0.305 | 0.583 |
| 500 | 1.152 | 1.050 | 1.284 |
| 700 | 1.149 | 1.296 | 1.474 |
| 1000 | 1.162 | 1.493 | 1.626 |
| 2000 | 1.296 | 1.690 | 1.814 |
| 5000 | 1.643 | 1.776 | 1.982 |
| 7000 | 1.800 | 1.809 | 2.051 |
| 10000 | 1.987 | 1.856 | 2.138 |
| (K) | |||
| 10 | 0.796 | 0.525 | 1.318 |
| 20 | 0.859 | 0.552 | 1.386 |
| 50 | 0.902 | 0.570 | 1.427 |
| 70 | 0.896 | 0.571 | 1.431 |
| 100 | 0.866 | 0.569 | 1.430 |
| 200 | 0.737 | 0.552 | 1.408 |
| 500 | 0.532 | 0.507 | 1.344 |
| 700 | 0.483 | 0.486 | 1.316 |
| 1000 | 0.456 | 0.464 | 1.288 |
| 2000 | 0.469 | 0.421 | 1.249 |
| 5000 | 0.566 | 0.387 | 1.255 |
| 7000 | 0.614 | 0.384 | 1.279 |
| 10000 | 0.673 | 0.387 | 1.318 |
From Figs. 9 and 10, we see that at the lowest temperatures both the cross sections and rate coefficients of the OH2+ system are larger than those of the CH and NH+ systems. This is caused by the stronger long-range interaction of the OH2+ system compared to the other two systems. The four wells of the OH2+ potentials, see Fig. 3, lead to the mild increase of the transition for temperatures larger than 4000 K. can be removed by the charge transfer process (Butler et al., 1979)
| (11) |
The rate coefficient is about over the temperature range (Honvault et al., 1995), which is comparable to our calculated fine-structure relaxation rate coefficients shown in Table 3. This might be an important consideration for modeling applications.
The critical density , an important parameter to indicate whether collisions affect the presence of fine structure lines, is defined as
| (12) |
where is the transition probability (Mendoza, 1983) and is the relaxation rate coefficient for collisions with species , which maybe be hydrogen (H) or electrons (e). Our calculated critical densities for N+ and O2+, respectively, and H are shown in Figs. 11
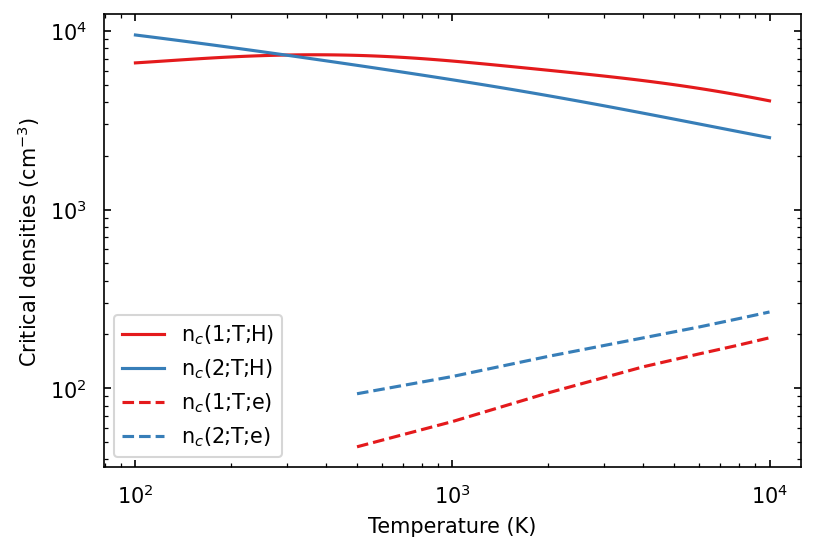
and 12.
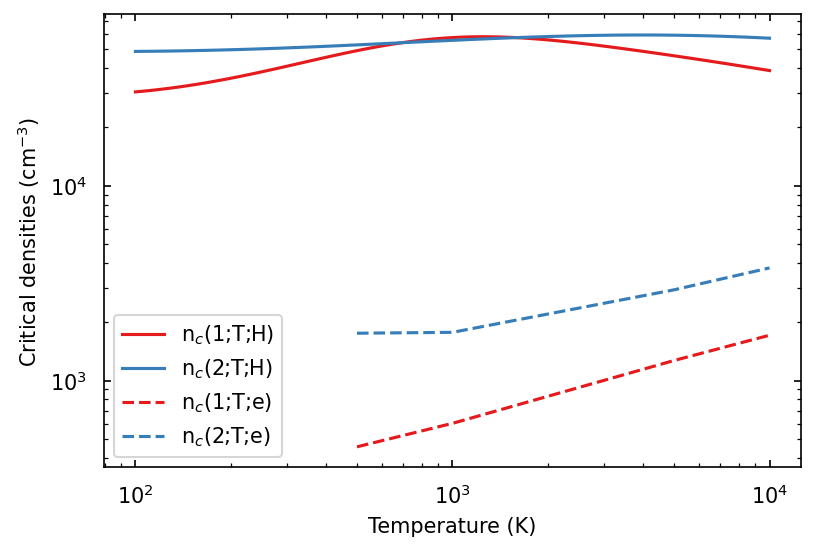
We also plot the critical densities for electrons (e), which were determined using the effective collision strengths from Tayal (2011) for N+ and from Tayal & Zatsarinny (2017) for O2+. The graphical data in Figs. 11 and 12 might be useful for considerations of the relative importance of hydrogen and electron densities at specific temperatures. For example, we can see that the critical densities induced by electrons are 10 to 102 times smaller than those induced by hydrogen atoms due to the strong electron-ion interactions.
6 Conclusion
We introduced a methodology that yields consistent sets of rate coefficients for a number of cases. Based partially on the Molcol Fortran code (Flower et al., 2019), we developed a new Python code utilizing Johnson’s multichannel logarithmic derivative algorithm (Johnson, 1973). We presented for the first time a comparison of the excitation and relaxation cross sections and rate coefficients for fine-structure transitions in collision of C, N+, or O2+ and atomic hydrogen. The calculations are based on accurate CH (present work), NH+ (present work), and OH2+ (De Melo et al., 2021) potentials. The present research may be useful in applications of far-infrared lines to astrophysical diagnostics.
Data Availability
Acknowledgements
This work was supported by NASA APRA grant 80NSSC19K0698.
References
- Abrahamsson et al. (2007) Abrahamsson E., Krems R. V., Dalgarno A., 2007, ApJ, 654, 1171
- Butler & Dalgarno (1979) Butler S. E., Dalgarno A., 1979, ApJ, 234, 765
- Butler et al. (1979) Butler S. E., Bender C. F., Dalgarno A., 1979, ApJ, 230, L59
- De Melo et al. (2021) De Melo G. F., Franzreb K., Ornellas F. R., 2021, PCCP, 23, 13672
- Flower et al. (2000) Flower D., Bourhis G., Launay J.-M., 2000, Comput. Phys. Commun., 131, 187
- Flower et al. (2019) Flower D., Bourhis G., Launay J.-M., 2019, Molcol: A program for solving atomic and molecular collision problems, doi:10.17632/NRHFXT7G69.1, https://data.mendeley.com/datasets/nrhfxt7g69/1
- Honvault et al. (1995) Honvault P., Gargaud M., Bacchus-Montabonel M. C., McCarroll R., 1995, A&A, 302, 931
- Inoue et al. (2014) Inoue A. K., Shimizu I., Tamura Y., Matsuo H., Okamoto T., Yoshida N., 2014, ApJ, 780, L18
- Johnson (1973) Johnson B., 1973, J. Comp. Phys., 13, 445
- Kramida et al. (2022) Kramida A., Yu. Ralchenko Reader J., and NIST ASD Team 2022, NIST Atomic Spectra Database (ver. 5.10), [Online]. Available: https://physics.nist.gov/asd [2022, October 25]. National Institute of Standards and Technology, Gaithersburg, MD.
- Krems et al. (2006) Krems R. V., Jamieson M. J., Dalgarno A., 2006, ApJ, 647, 1531
- Launay & Roueff (1977) Launay J. M., Roueff E., 1977, A&A, 56, 289
- Lin et al. (2005) Lin C. Y., Stancil P. C., Gu J. P., Buenker R. J., Kimura M., 2005, Phys. Rev. A, 71, 062708
- Mendoza (1983) Mendoza C., 1983, IAU Symp., 103, 143
- Mies (1973) Mies F. H., 1973, Phys. Rev. A, 7, 942
- Monteiro & Flower (1987) Monteiro T. S., Flower D. R., 1987, MNRAS, 228, 101
- Ramos Padilla et al. (2022) Ramos Padilla A. F., Wang L., van der Tak F. F. S., Trager S., 2022 (arXiv:2205.11955)
- Schöier et al. (2005) Schöier F. L., van der Tak F. F. S., van Dishoeck E. F., Black J. H., 2005, A&A, 432, 369
- Sugahara et al. (2021) Sugahara Y., et al., 2021, ApJ, 923, 5
- Tayal (2011) Tayal S. S., 2011, ApJS, 195, 12
- Tayal & Zatsarinny (2017) Tayal S. S., Zatsarinny O., 2017, ApJ, 850, 147
- Werner et al. (2010) Werner H.-J., Knowles P. J., Knizia G., Manby F. R., Schütz M., et al., 2010, Molpro, version 2010.1, a package of ab initio programs
- Yan & Babb (2022a) Yan P.-G., Babb J. F., 2022a, Figshare, doi:10.6084/m9.figshare.21256365
- Yan & Babb (2022b) Yan P.-G., Babb J. F., 2022b, RNAAS, 6, 145
- Yau & Dalgarno (1976) Yau A. W., Dalgarno A., 1976, ApJ, 206, 652