The Mixing Thermodynamics and Local Structure of High-entropy Alloys from Randomly Sampled Ordered Configurations
Abstract
A general method is presented for modeling high entropy alloys as ensembles of randomly sampled, ordered configurations on a given lattice. Statistical mechanics is applied post hoc to derive the ensemble properties as a function of composition and temperature, including the free energy of mixing and local structure. Random sampling is employed to address the high computational costs needed to model alloys with a large number of components. Doing so also provides rigorous convergence criteria, including the quantification of noise due to random sampling, and an estimation of the number of additional samples required to lower this noise to the needed/desired levels. This method is well-suited for a variety of cases: i) high entropy alloys, where standard lattice models are costly; ii) “medium” entropy alloys, where both the entropy and enthalpy play significant roles; and iii) alloys with residual short-range order. Binary to 5-component alloys of the group-IV chalcogenides are used as case examples, for which the predicted miscibility shows excellent agreement with experiment.
I Introduction
From a materials design perspective, alloying provides a continuous composition space over which multiple conflicting properties can be simultaneously optimized. This flexibility has allowed for semiconducting alloys to have a wide variety of applications, including use in LEDs, solar cells, batteries, and thermoelectric generators [1, 2, 3, 4]. Increasingly, this desire for multi-property optimization encourages the exploration of high-entropy alloys [5]. The complexity of these chemical spaces necessitates computational guidance with respect to alloy stability, local and long-range structure, and material properties. For alloys with fewer components, ab-initio methods such as Special Quasi-random Structures, Cluster Expansion, and the Independent Cell Approximation are effective in guiding experimental efforts [6, 7, 8, 9]. Each of these approaches faces significant challenges when moving to higher dimensions; this work presents how the Independent Cell Approximation can be modified to efficiently explore high-dimensional alloys.
The Special Quasi-random Structure (SQS) approach uses a single supercell whose atomic arrangement is optimized to emulate a fully disordered (random) alloy structure within the constraints of periodic boundary conditions [6]. Alloying on both sub-lattices of an ionic system can result in short-range order due to the diversity of constituent atom sizes and interactions; as such the complete disorder approximation of SQS overestimates the enthalpy of mixing [1, 10]. Further, no information on entropy is provided–the analytic approach associated with SQS overestimates entropy by assuming a fully random alloy [5], disregarding any possibility for correlated disorder or short-range order [11, 12].
Despite these stability challenges, the use of a single supercell allows for the full suite of plane-wave based DFT methods to predict material properties. However, the extremely large supercells required for complex alloys quickly become computationally costly since DFT scales with the number of atoms as .
Unlike SQS, Cluster Expansion (CE) does not assume complete disorder; instead, a model Hamiltonian is fit with a series of total-energy calculations on a number of small supercells of varying configurations and compositions. An accurate model Hamiltonian is a powerful tool–with it, the calculation of arbitrarily large supercells of varying configurations becomes almost effortless. Coupled with Monte Carlo, a model Hamiltonian can be used to predict the order-disorder behavior across the modeled alloy composition space, all as a function of synthesis-temperature [13, 14, 15]. This is particularly useful for studying systems with short-range order. Still, the number of interaction parameters required to fit a cluster expansion grows with the number of alloyed elements, necessitating more calculations. The large number of calculations makes the method costly–and even prohibitive–for high entropy spaces. Furthermore, the model Hamiltonian does not provide predictions on the overall structure of the alloy. In the field of semiconducting alloys, the extended strain fields and distortions arising from alloying are important for the ways in which they affect transport properties and band dispersions [16, 17, 18, 19].

Within the independent cell approximation (ICA), the material is modeled as an ensemble of ordered configurational states, as illustrated in Fig. 1 [9, 8, 20]. Specifically, calculations are first run on multiple supercells of varying configurations at or near a single composition. The probability of each configurational state is then calculated using statistical mechanics. Finally, the material properties are calculated by taking the weighted average over the configurations. In contrast to CE, no model Hamiltonian is fit; the ensemble properties are derived directly from the cells within the ensemble. By avoiding the rigid lattice assumed by CE, the resulting ensemble averages can describe local structural distortions arising from disorder (e.g., deviations in bond lengths, bond angles, and local volumes). The ICA has been successfully used in a variety of applications: alloying [20, 21, 22, 8, 23], composition disorder [9], spin disorder [24], metastable polymorphs [25, 26, 27], and glasses [28, 29].
In the context of alloys, there has been considerable diversity in how ICA is implemented. Key differences have involved supercell size, sampling of the configurational space, and the treatment of configurational entropy. An early example of ICA by Jiang et al. sought to replicate large SQS of inverse spinels with relatively few smaller supercells; the contributions of these supercells were weighed such that the correlation function of the ensemble resembled a fully random alloy [8]. Using just two 28-atom supercells was sufficient to determine an ensemble energy that agreed with both a 168-atom SQS and a cluster expansion (with a cross validation error of 3.4 meV/formula unit) . By focusing on matching a large SQS cell, this embodiment of ICA is not able to interrogate the temperature dependence of local structure and properties.
In addition to reproducing SQS results, ICA also has the capability of measuring configurational entropy. Leder et al. fit various ICA configurations to a cluster expansion in order to estimate the solubility as a function of temperature [21]; however, cluster expansion in high entropy spaces is computationally expensive. Sarker et al. developed an approximation for the configurational entropy that directly uses ICA results termed the “entropy forming ability” (EFA). This metric is based on the spread of the supercell energies. In this work, the metric is applied to 56 high entropy carbides (V0.2W0.2X0.2Y0.2Z0.2C); experimental formation of homogeneous alloys was found to correlate with EFA magnitude, regardless of the enthalpy of mixing. As these carbides all have the same configurational entropy in the high-temperature limit, this work highlights the importance of considering the configurational entropy at finite temperatures.
This paper addresses opportunities for improving the ICA, with a focus on () quantitatively determining configurational entropy, and thus, the free energy convex hull; () accurately modeling local structural distortions; and () exploring high-dimensional chemical spaces. In all cases, this is made computationally tractable by randomly sampling a portion of the configurational space, thus allowing for the use of larger, more disordered supercells within a first-principles framework.
First, PbSe0.5Te0.5 and PbS0.5Te0.5 are used as a way of illustrating the methodology. These compositions are chosen because they have sufficiently few configurations. Therefore, ensemble statistics can be derived from completely sampling all possible configurations for a given supercell size. Convergence tests are then run to determine the necessary supercell size and number of configurations needed to capture the configurational thermodynamics and local structure of these IV-VI alloys. With complete sampling as a benchmark, random sampling is then conducted on the same systems with far less computational cost and little added uncertainty. The uncertainty due to random sampling is then derived by using the Central Limit Theorem [30, 31] in order to quantify the robustness of the result. With a rational approach to random sampling in hand, this case example is extended to the pseudo-ternary, PbSxSeyTe1-x-y. The temperature-dependent phase diagram is calculated and matches well with experiment. Finally, the computational tractability of this method in high-entropy spaces is illustrated through the exploration of the quintary, (Pb1-xGex)(TeySezS1-y-z).

II Methods
An overview of the presented method is shown in Fig. 2. First, the initial conditions are established. Alloy configurations are then randomly sampled from the set of total of configurations. Total-energy calculations are run on the configurations, plus the additional calculations that are needed to compute the properties of interest. Then, the temperature-dependent probabilities of these configurations are determined using statistical mechanics. The ensemble properties are derived from the probabilities of the configurations and their properties. For the property of interest, the uncertainty in the prediction is estimated using the Central Limit Theorem. If the uncertainty is above the specified convergence criteria, the Central Limit Theorem is used to determine the number of additional configurations that are needed. Finally, these calculations are conducted, and the ensemble property is reevaluated.
II.1 Configuration Sampling
As referenced in the first panel of Fig. 2, the desired composition, structure-type, supercell size, and number of initial configurations are specified. The convergence property and criteria need to be specified as well, but we will discuss this in II.3. For a given supercell size, a number of symmetry-inequivalent supercells are constructed. This is done by using the algorithm developed by Hart and Forcade [32], which produces Hermite Normal Form transformation matrices that correspond to symmetry-inequivalent supercells. A complete list of possible decorations is then built for each supercell. Here, a configuration is defined as the pairing of a supercell and a decoration. The size of the complete set of configurations is simply the product of the number of supercells and decorations. A randomly chosen configuration is one that is sampled from this set.
All transformation matrices used provide symmetry inequivalent supercells, but once decorations are applied, some configurations will be symmetrically equivalent. Both translational and rotationally symmetric configurations are included in the ensemble. They are interpreted to be degenerate, and thus should be counted within the ensemble, as is done elsewhere [20]. Finally, the chosen configurations are subjected to full structural relaxations, which was done using VASP [33]. The generation of configurations was executed in Python using the Pylada software [34]. The numerical approaches used this work are described in detail in Section II.4.
II.2 Probability Distribution and Ensemble Properties
The first step is to calculate the partition function, :
| (1) |
where is the configuration index, is the total number of configurations sampled, is the total energy per formula unit of a given configuration, is Boltzman’s constant and is the absolute temperature. The ensemble probability of the th configuration, is
| (2) |
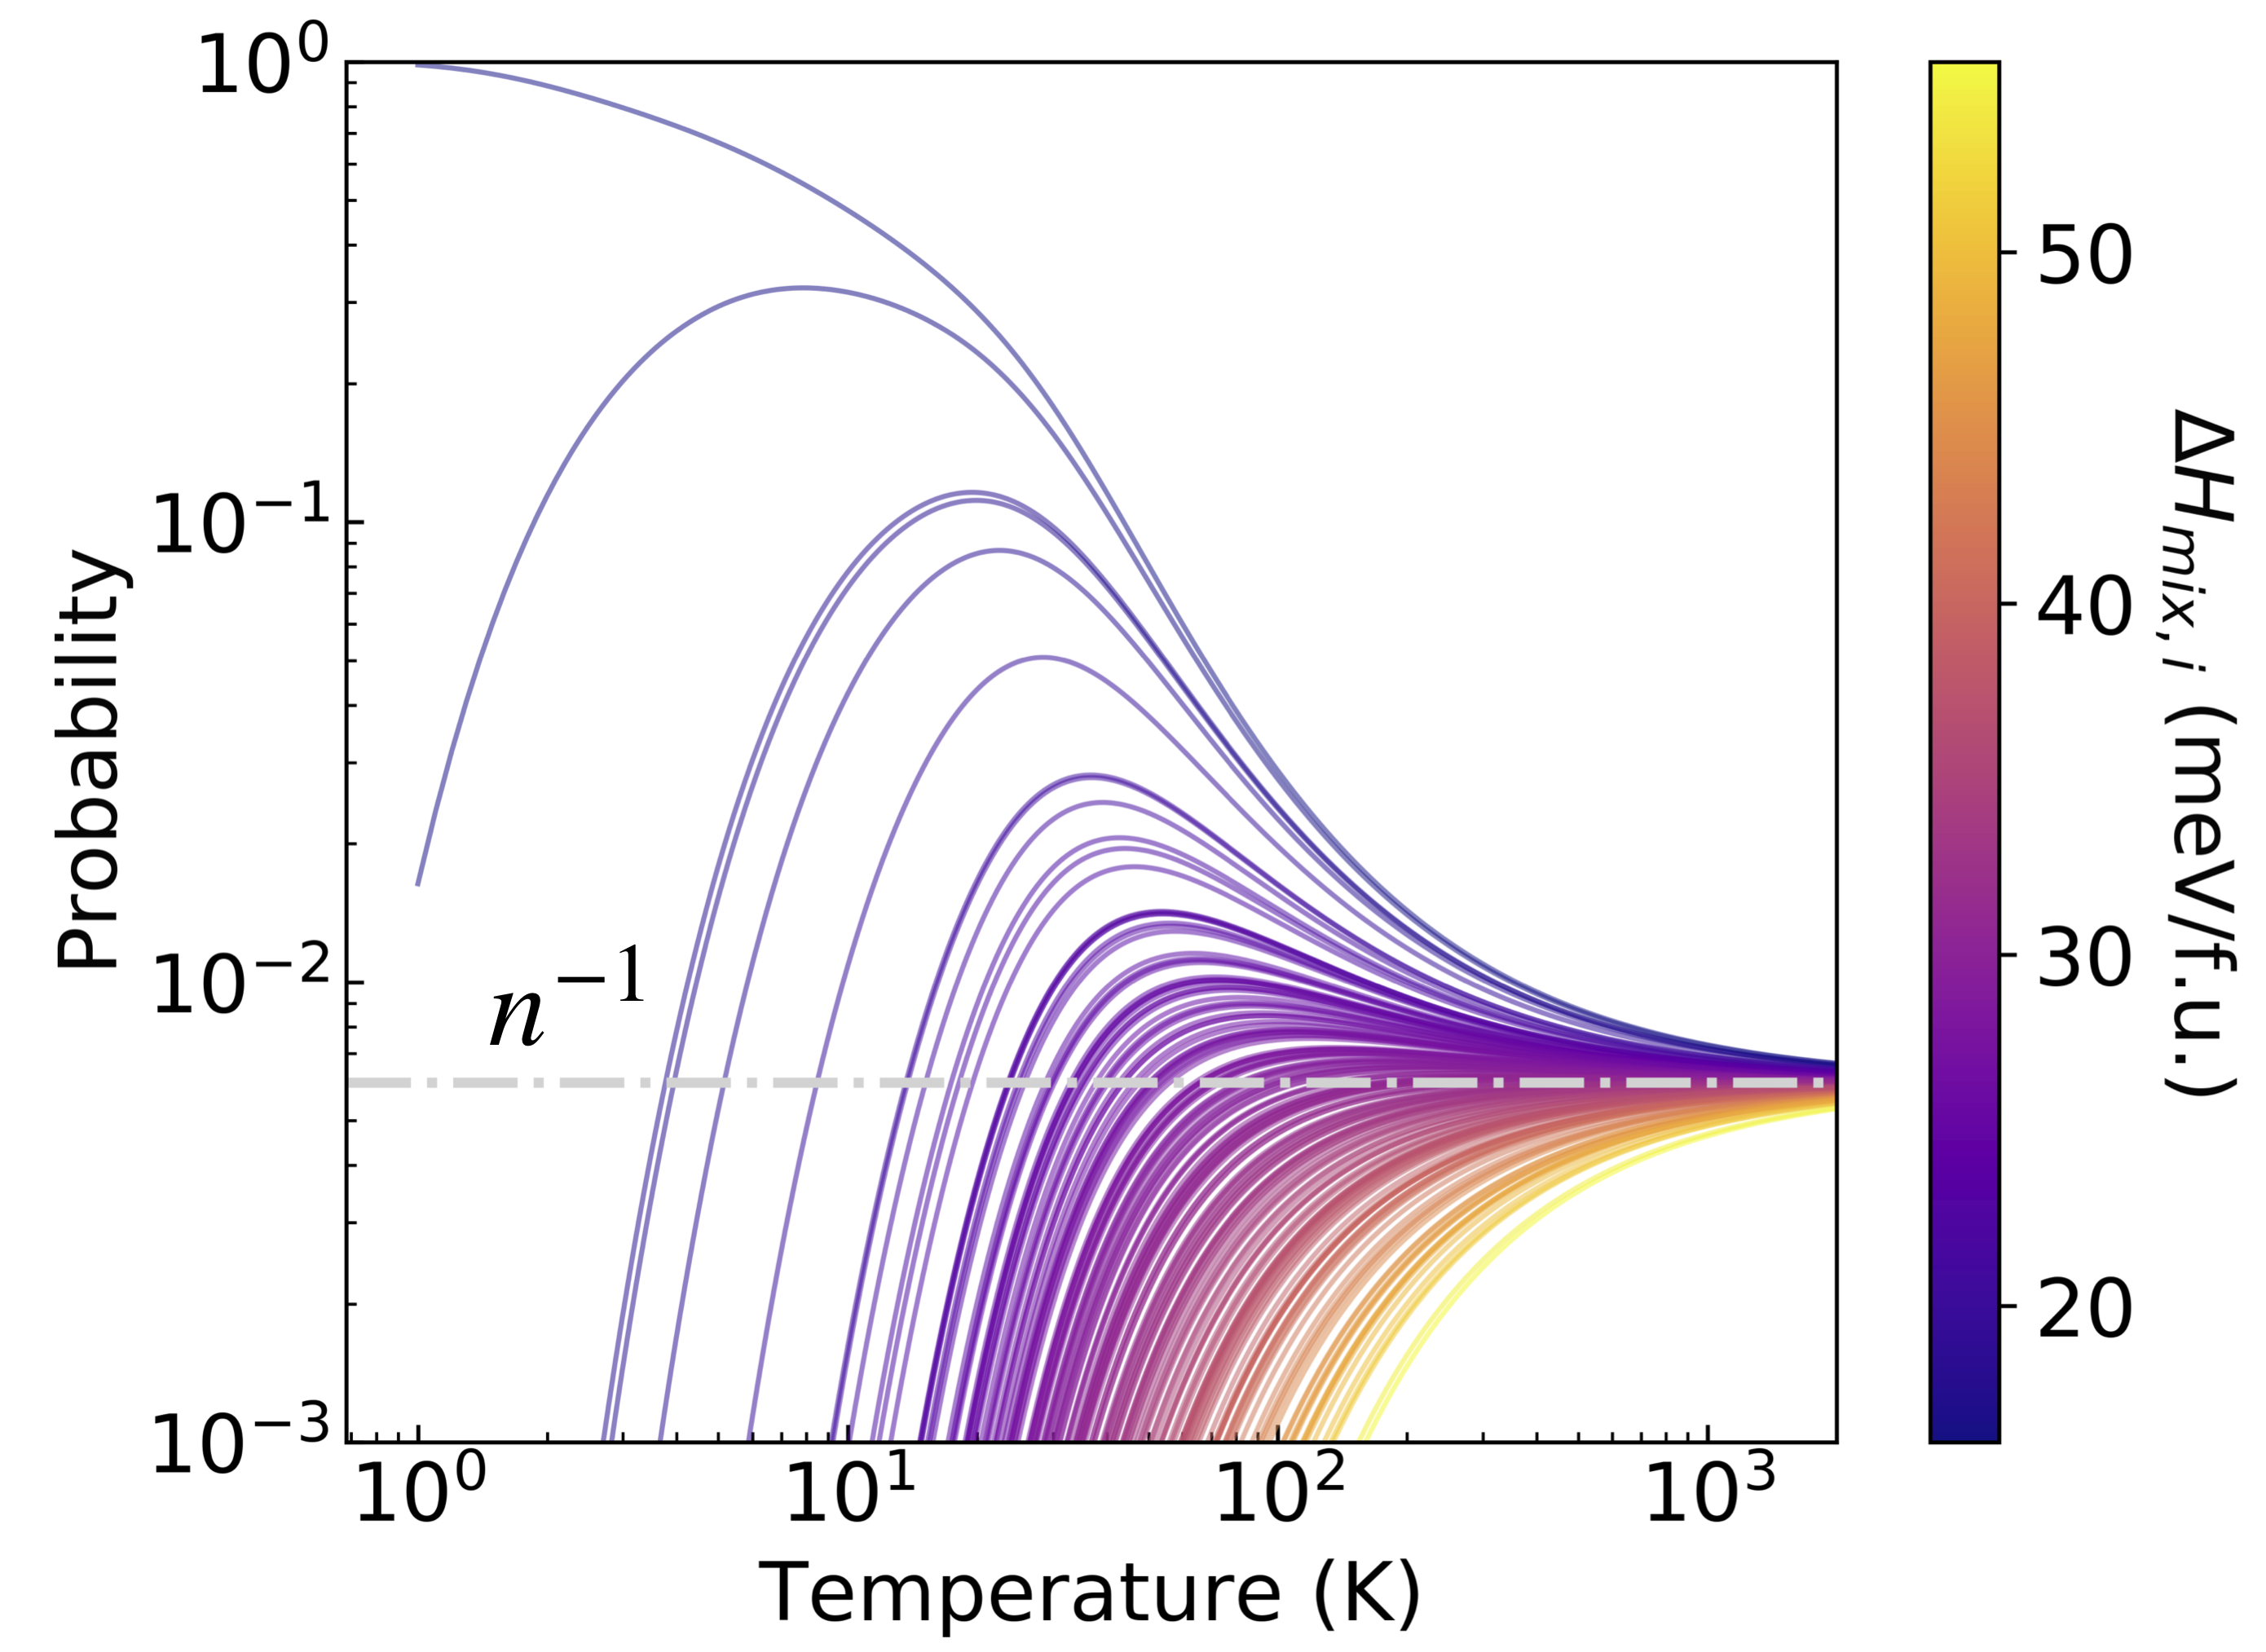
Illustrated in Fig. 3 are the ensemble probabilities of 50 configurations of PbSe0.5Te0.5. The probability of the ground state configuration approaches unity as temperature decreases, while in the high-temperature limit, the probability of each configuration asymptotes to . Generally, the ensemble average of a property, , is given by taking the weighted average over configurations,
| (3) |
Depending on the property, ensemble averaging may require more nuanced averaging–for example, the ensemble radial distribution function in [28].
Importantly, when the entropy or free energy of mixing are mentioned, they refer to the configurational free energy and entropy. Vibrational degrees of freedom are not considered here. As Esters et al. show, vibrational entropy should be considered when the parent compounds have different nearest neighbor environments from the resulting alloy [35]. This is not the case in our work, since we consider rocksalt alloys and parent compounds that are either rocksalt, or distorted versions of rocksalt. The exclusion of the vibrational degrees of freedom may affect the accuracy of the mixing temperatures.
The configurational free energy of mixing, , can be calculated from the partition function in a standard way:
| (4) |
This is value will need to be adjusted once the correction is applied. In this work, we will be referring to pure constituents that make up the alloy as parent compounds, but the framework presented here would also apply if only elements were being alloyed. Here, counts over parent compounds of the alloy, is the fraction of the alloy made up by that parent, and is the total energy of the parent. Finally, is the number of parents that comprise the alloy. The enthalpy of mixing, , for configuration , is defined in the following equation:
| (5) |
Here, is the pressure and and are the volumes per formula unit. All results presented here correspond to the low pressure () case for which internal energy and enthalpy are equal, as are the Helmholts and Gibbs free energies. The formalism can easily be extended to elevated pressures by computing the equations of state, E(V), for both the randomly sampled configuration and their parent compounds.
for the ensemble is then defined by ensemble averaging over all . Next, the entropy of mixing, , can be calculated from the ensemble averaged enthalpy of mixing and the free energy of mixing:
| (6) |
, , and to a lesser extent, , are dependent on the number of configurations sampled. Random sampling approximates well the distribution of energies, and hence, its ensemble average. Thus, will remain relatively constant after convergence with respect to the number of configurations has been achieved. However, , and consequently , will change because the partition function increases monotonically with the number of configurations.
To remove the dependency of on the number of randomly sampled configurations, a scaling factor is applied to so that it always asymptotes to the configurational entropy in the high-temperature limit, which is analytically known. This value, which we will call , can be calculated using the standard formula for the configurational entropy of fully random alloys:
| (7) |
where is a parent compound of the alloy and is its alloy fraction. A scaling factor, , is defined as:
| (8) |
In this work, K is sufficiently high such that the entropy has asymptoted. This temperature was chosen based on the inspection of the systems present in this paper, but it may need to be reconsidered for other systems. The scaling factor is then applied to the entire curve. From there, the free energy of mixing can then be recalculated using this scaled final entropy of mixing.
II.3 The Central Limit Theorem and Supercell Size
When faced with an overwhelmingly large configurational space, random sampling is one approach to render the number of calculations tractable. Random sampling can be viewed as an acceptable approximation under the following condition. For a property of interest, , the ensemble average derived from randomly sampled configurations, , is in agreement with the ensemble average of the total distribution of configurations, (i.e. ). In practice, however, will not be available. Therefore, an alternative method for verifying random sampling is required.
The Central Limit Theorem (CLT) offers one such path [30, 31]. It states that if the above random sampling procedure were repeated infinitely many times, the resulting distribution of values would have three main characteristics. It would be i) approximately a Gaussian distribution that is ii) centered around the true mean, , and iii) the distribution would have a standard deviation of . Critically, is the uncertainty in our prediction due to random sampling. Evaluating will be crucial for justifying the random sampling implemented in this work.
In a simpler form, the CLT applies for sampling from the true distribution. In our case, we are sampling configurations randomly from a uniform distribution, and thus, the simpler form of the CLT applies for when all configuration probabilities are equal. This happens in the high-temperature limit. The uncertainty in the ensemble averages are thus for the high-temperature limit.
The CLT allows us to do this; in the limit as , the CLT states:
| (9) |
For finite , eq. (9) is an approximation. However, the left side of eq. (9) asymptotes to the right side for fairly small . Often, an of 30 is deemed sufficient such that eq. (9) holds [36, 37]. As will be shown in Fig. 4, our numerical simulations for the systems in this work are in general agreement; we illustrate that using an results in distributions that are approximately Gaussian with standard deviations that agree with eq. (9).
We will now be moving on to the second approximation within the CLT. Given a particular ensemble of randomly chosen configurations where property has been calculated for each configuration, the resulting distribution of values has a standard deviation of . When is sufficiently large, is approximately equal to , as will be shown in the Results. One can then make the following approximation:
| (10) |
In this way, the uncertainty of can be estimated from one sufficiently large ensemble of configurations.
In practice, a modestly large ensemble of initial size is built and the above approximation is made. If the uncertainty in is larger than desired, one can rearrange eq. (9) using the desired and to estimate the additional calculations needed to achieve the desired uncertainty. After the additional calculations are completed, one can reassess the uncertainty using eq. (9). Overall, the described approach efficiently establishes within the desired uncertainty, while keeping the number of calculations to a minimum.
In applying the CLT to the independent cell approximation, we will need to determine an appropriate that is sufficiently large to estimate while remaining computationally efficient. In practice, one needs to perform a proper convergence test to find a suitable . In our work, we determine the appropriate in a different way by using an exhaustive enumeration of all configurations, which is done to illustrate the methodology and compare our findings with exact results.
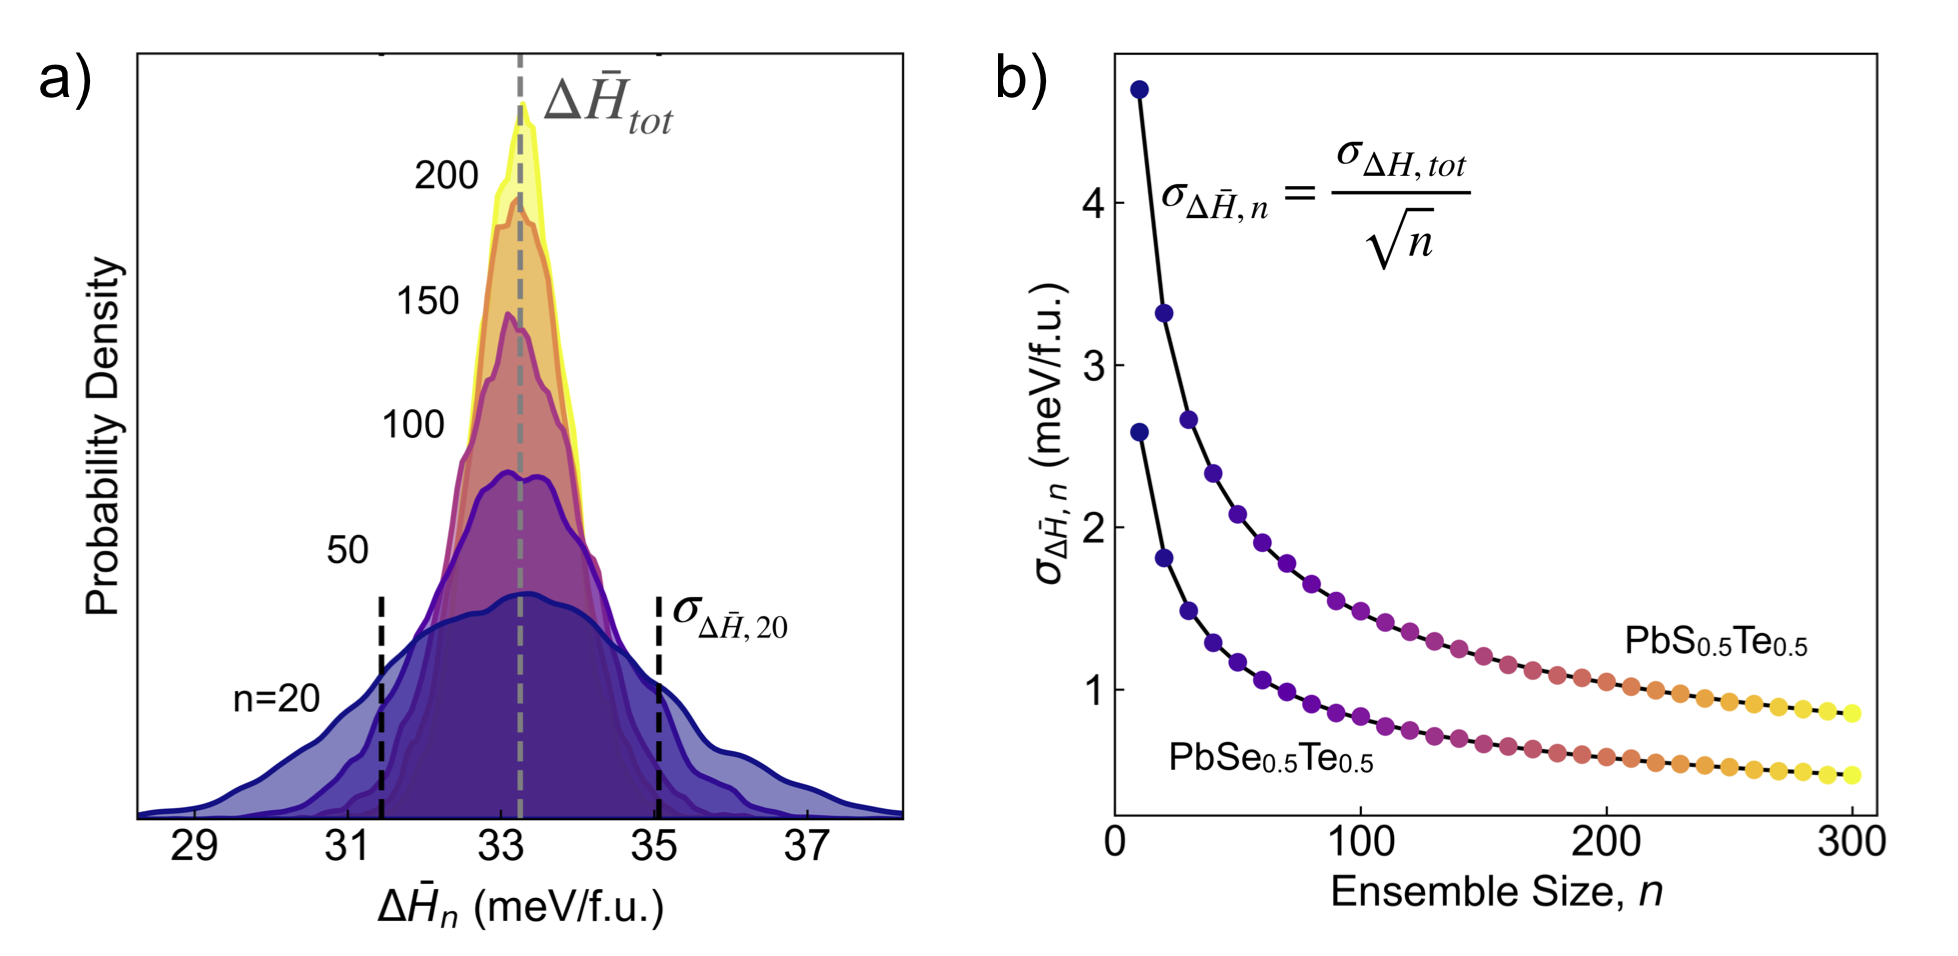
A significant portion of the Results will be centered around the thermodynamics of mixing. We therefore chose to illustrate CLT with . Here we use the high-temperature limit of (), such that is the simple average of across all sampled configurations. We use the of all 37,000 24-atom configurations of PbSe0.5Te0.5 to make our total distribution. From the total distribution, 10,000 different ensembles of configurations are randomly generated and the corresponding 10,000 values are calculated. Furthermore, as shown in eq. (9), the standard deviation in the distribution of the 10,000 , , changes as a function of . To illustrate this effect, we performed the above procedure, building 10,000 ensembles for various , ranging from 20 to 300. Although we use the high-temperature limit for simplicity of illustration, the CLT can be applied for any temperature; the standard deviation must reflect that not all configurations have equal probabilities. As spoken about in the Discussion, doing so requires further caution around sampling.
Fig. 4a shows the associated distributions of values for various . All of the distributions form an approximate Gaussian, as expected from the CLT. If the number of ensembles were infinite instead of 10,000, the distributions would truly be Gaussians. As increases from 20 samples per ensemble to 300, it is apparent that decreases. In other words, if one were to randomly sample 20 configurations of PbSe0.5Te0.5, there is a large range of probable values that could occur, while sampling 200 configurations would significantly narrow this range.
Fig. 4b further illustrates how the size of reduces uncertainty in the calculation of . The standard deviation of each Gaussian, , in panel a is plotted, as well as for many other that were not shown in panel a. For comparison, the same procedure was repeated for PbS0.5Te0.5, which has a larger . The two lines plotted in Fig. 4b are generated from eq. (9).
Composition affects uncertainty as well. The uncertainty in is smaller for PbSe0.5Te0.5 than PbS0.5Te0.5, reflecting the wider distribution of configurations in the latter. For a given uncertainty criteria, PbS0.5Te0.5 requires more samples. However, for in the studied systems, the uncertainty is kept below 3 meV/f.u. across the entire composition space using just 50-55 configurations. We employ the CLT throughout the work. In Fig. 6, we will return to the CLT and illustrate that is a reasonable approximation to make within the context of our method.
Supercell Size. Using a sufficiently large supercell size is crucial for calculating the ensemble properties of an alloy. The ensemble statistics can widely vary depending on the supercell size chosen, as will be shown in Fig. 7. The following procedure was adopted for determining the appropriate supercell size. First, evaluate the properties of interest using an SQS for the specified structure-type and composition. It is important to make sure the SQS properly sized as well. Second, for the same composition and structure-type, run a series of randomly sampled configurations. Using the CLT, iteratively add samples until the high-temperature ensemble average result is sufficiently converged. This high-temperature ensemble average should match up well with SQS. If it does not, then repeat the same procedure with configurations of a larger supercell size until the high-temperature ensemble average and the SQS values are within the needed uncertainty.
II.4 Computational Details
Structural relaxations and total energy calculations are conducted within VASP [33], using the PBE functional [38] within the projector-augmented wave method [39]. All structural degrees of freedom were allowed to be optimized within the structural relaxation (ie. volume, cellshape, atom positions). A planewave cutoff of 340 eV and a gamma-centered k-point mesh are used such that the energy is converged to within 3 meV/atom.
We use the AFLOW-POCC method [20] for conducting complete sampling for PbSe0.5Te0.5 and PbS0.5Te0.5. The SQS structure was generated using Monte Carlo SQS (mcsqs) within the ATAT framework [40]. Clusters were randomized up to the sixth nearest neighbors for pairwise interactions, and first nearest neighbors for three-wise interactions. The bulk modulus was calculated by fitting the Birch–Murnaghan equation of state. For a given structure, this involved generating multiple volumes near the minimum volume of the structure and calculating the energy of those volumetrically scaled structrues. The equation of state was then fit from those total energy calculations.[41, 42]. The ensemble bulk modulus was calculated by taking the Reuss average over all configurations. The reuss average was used since it assumes that all configurations are under equivalent stress [43]. For PbSe0.5Te0.5, the bulk modulus was calculated for all configurations with supercell sizes up to 20 atoms. For 24-atom supercells, the bulk modulus was calculated for 200 randomly sampled configurations instead of all 1107 non-degenerate configurations in order to keep the test computationally affordable.
Determining the coordination number of an atom inherently requires making a somewhat arbitrary decision about what atoms are considered to be nearest neighbors. Our method is the following: for a given atom, we find the closest neighboring atom, set that as our base bond length, and only include other atoms into the first shell of coordination if their distance from the central atom is within 20 of the base bond length. We find that a tolerance of 20 helps to capture distorted bonding environments while excluding the second coordination shell.
III Results
We will be working through multiple case examples to validate this method and illustrate its various applications. To start, we will study a single composition, PbSe0.5Te0.5, before moving on to the complete PbSe1-xTex pseudo-binary where we will derive the free energy of mixing across the composition space, all as a function of temperature. Subsequently, the Pb-chalcogenide pseudo-ternary (PbS1-x-ySexTey) will be explored to show broader trends and the use of the free energy convex hull as it compares to experiment. Finally, a high-entropy system, (Pb1-xGex)(TeySezS1-y-z), will be studied.
III.1 PbSe0.5Te0.5
For the single composition PbSe0.5Te0.5, we will be focusing primarily on the thermodynamics of mixing. To show that the results are sufficiently converged with respect to random sampling, the Central Limit Theorem (CLT) will be used. We take this opportunity to illustrate the main assumptions of the CLT within the context of this method. Next, the supercell size necessary to capture acruately the thermodynamics of mixing needs to be determined; we thus calculate the high-temperature ensemble averages for varying supercell sizes and compare them to the SQS value. Finally, we briefly illustrate the dependence of ensemble supercell size on the bulk modulus. This is done to illustrate the importance of moving to larger supercells when considering ensemble properties beyond thermodynamics.
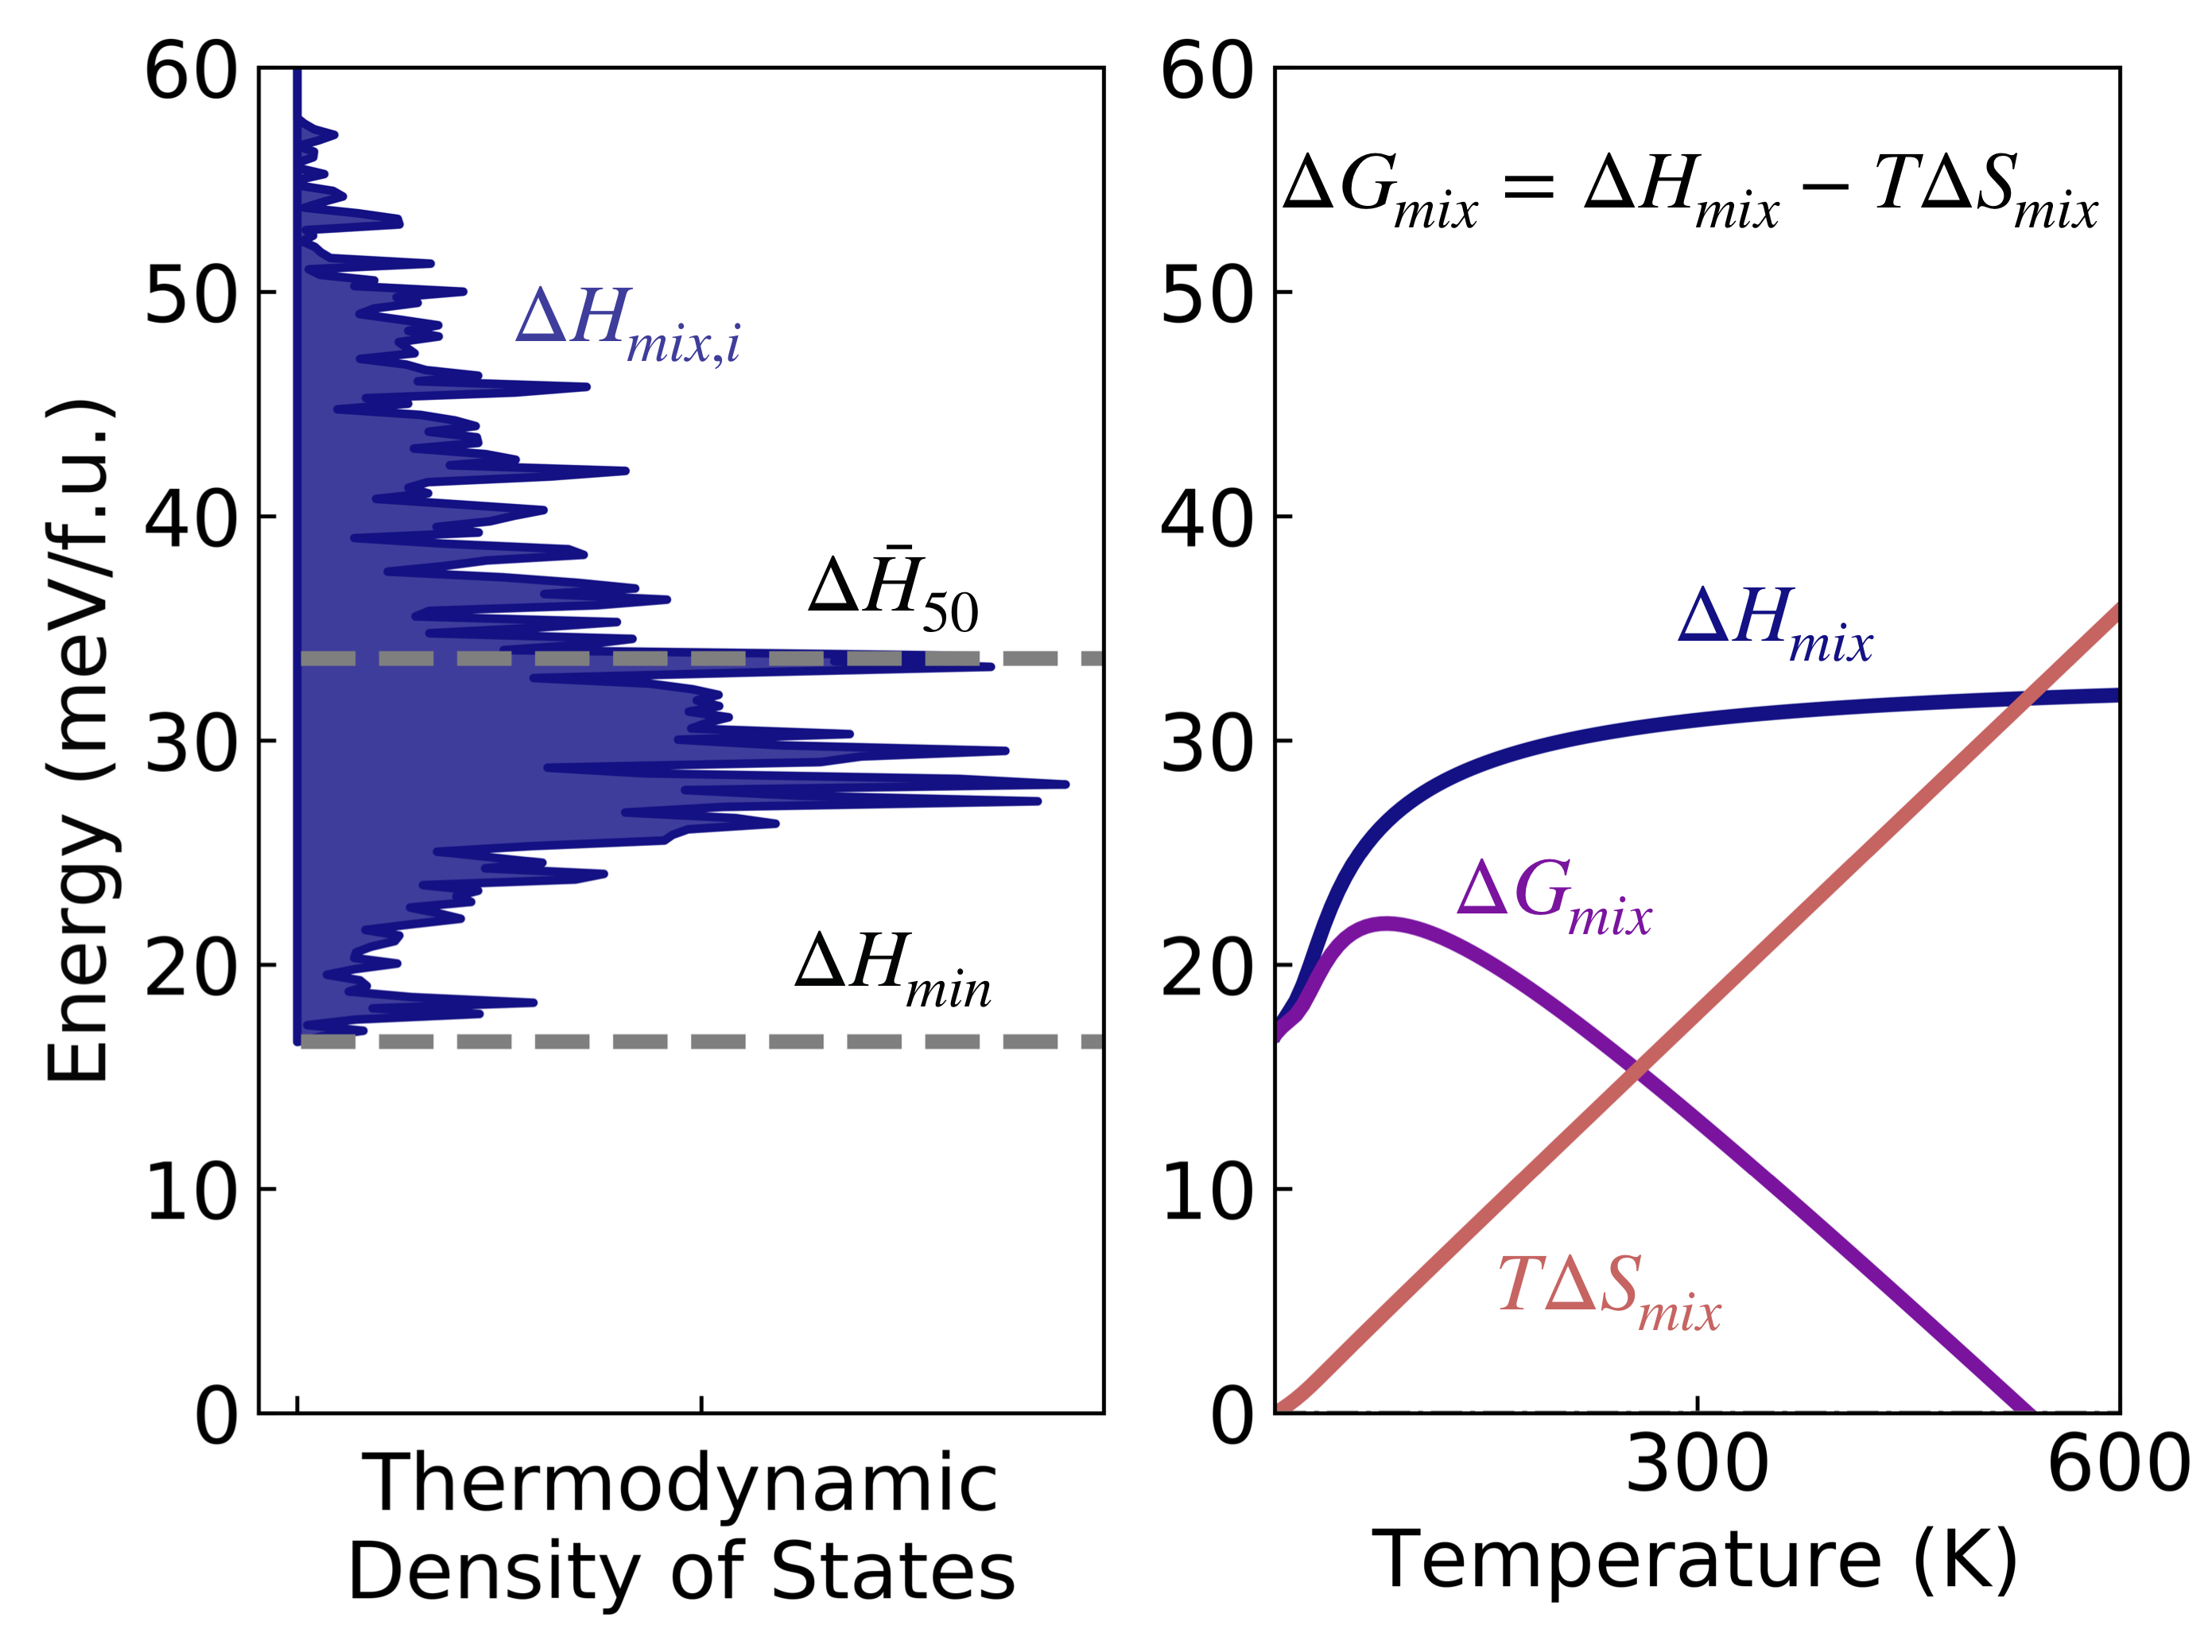
Thermodynamics of Mixing. The thermodynamics of mixing for PbSe0.5Te0.5 was calculated according to the equations in section II.2. In Fig. 5, the Thermodynamic Density of States (TDOS) in the left panel shows the distribution of states resulting from 50 randomly sampled configurations. The resulting ensemble , , and are shown in the right panel. At 0 K, is equal to the ground state configuration at that composition. As the synthesis temperature increases, rises, approaching the average of the TDOS. The is convex at low temperatures, and in this particular system, it asymptotes to its high-temperature limit above 50 K, resulting in an ostensibly linear curve. The becomes negative at 550 K, and thus will not decompose into its parent compounds after that temperature. However, a negative does not necessarily imply that the composition will be stable. Later sections will show the importance of using the free energy convex hull in determining stability.
Determining Sufficient for CLT. As stated in the Methods, a convergence test must be conducted in order to show that the number of randomly sampled configurations in the initial ensemble, , is sufficiently large to satisfy eq. (10). Here, we run a more advanced convergence test by assembling statistics on values on 10,000 unique ensembles of PbSe0.5Te0.5 and PbS0.5Te0.5.
Fig. 6 assesses how changes with increasing ensemble size and compares this result to , derived from all configurations within the complete distribution. As increases, quickly asymptotes to . The error bars represent one standard deviation from . Further, the error bars shrink, corresponding to a decrease in the uncertainty of for a given ensemble. For of 50 configurations and above, the uncertainty in the estimates of are fairly small. As the uncertainty decays, we can increasingly justify the assumption of Eq. (10).
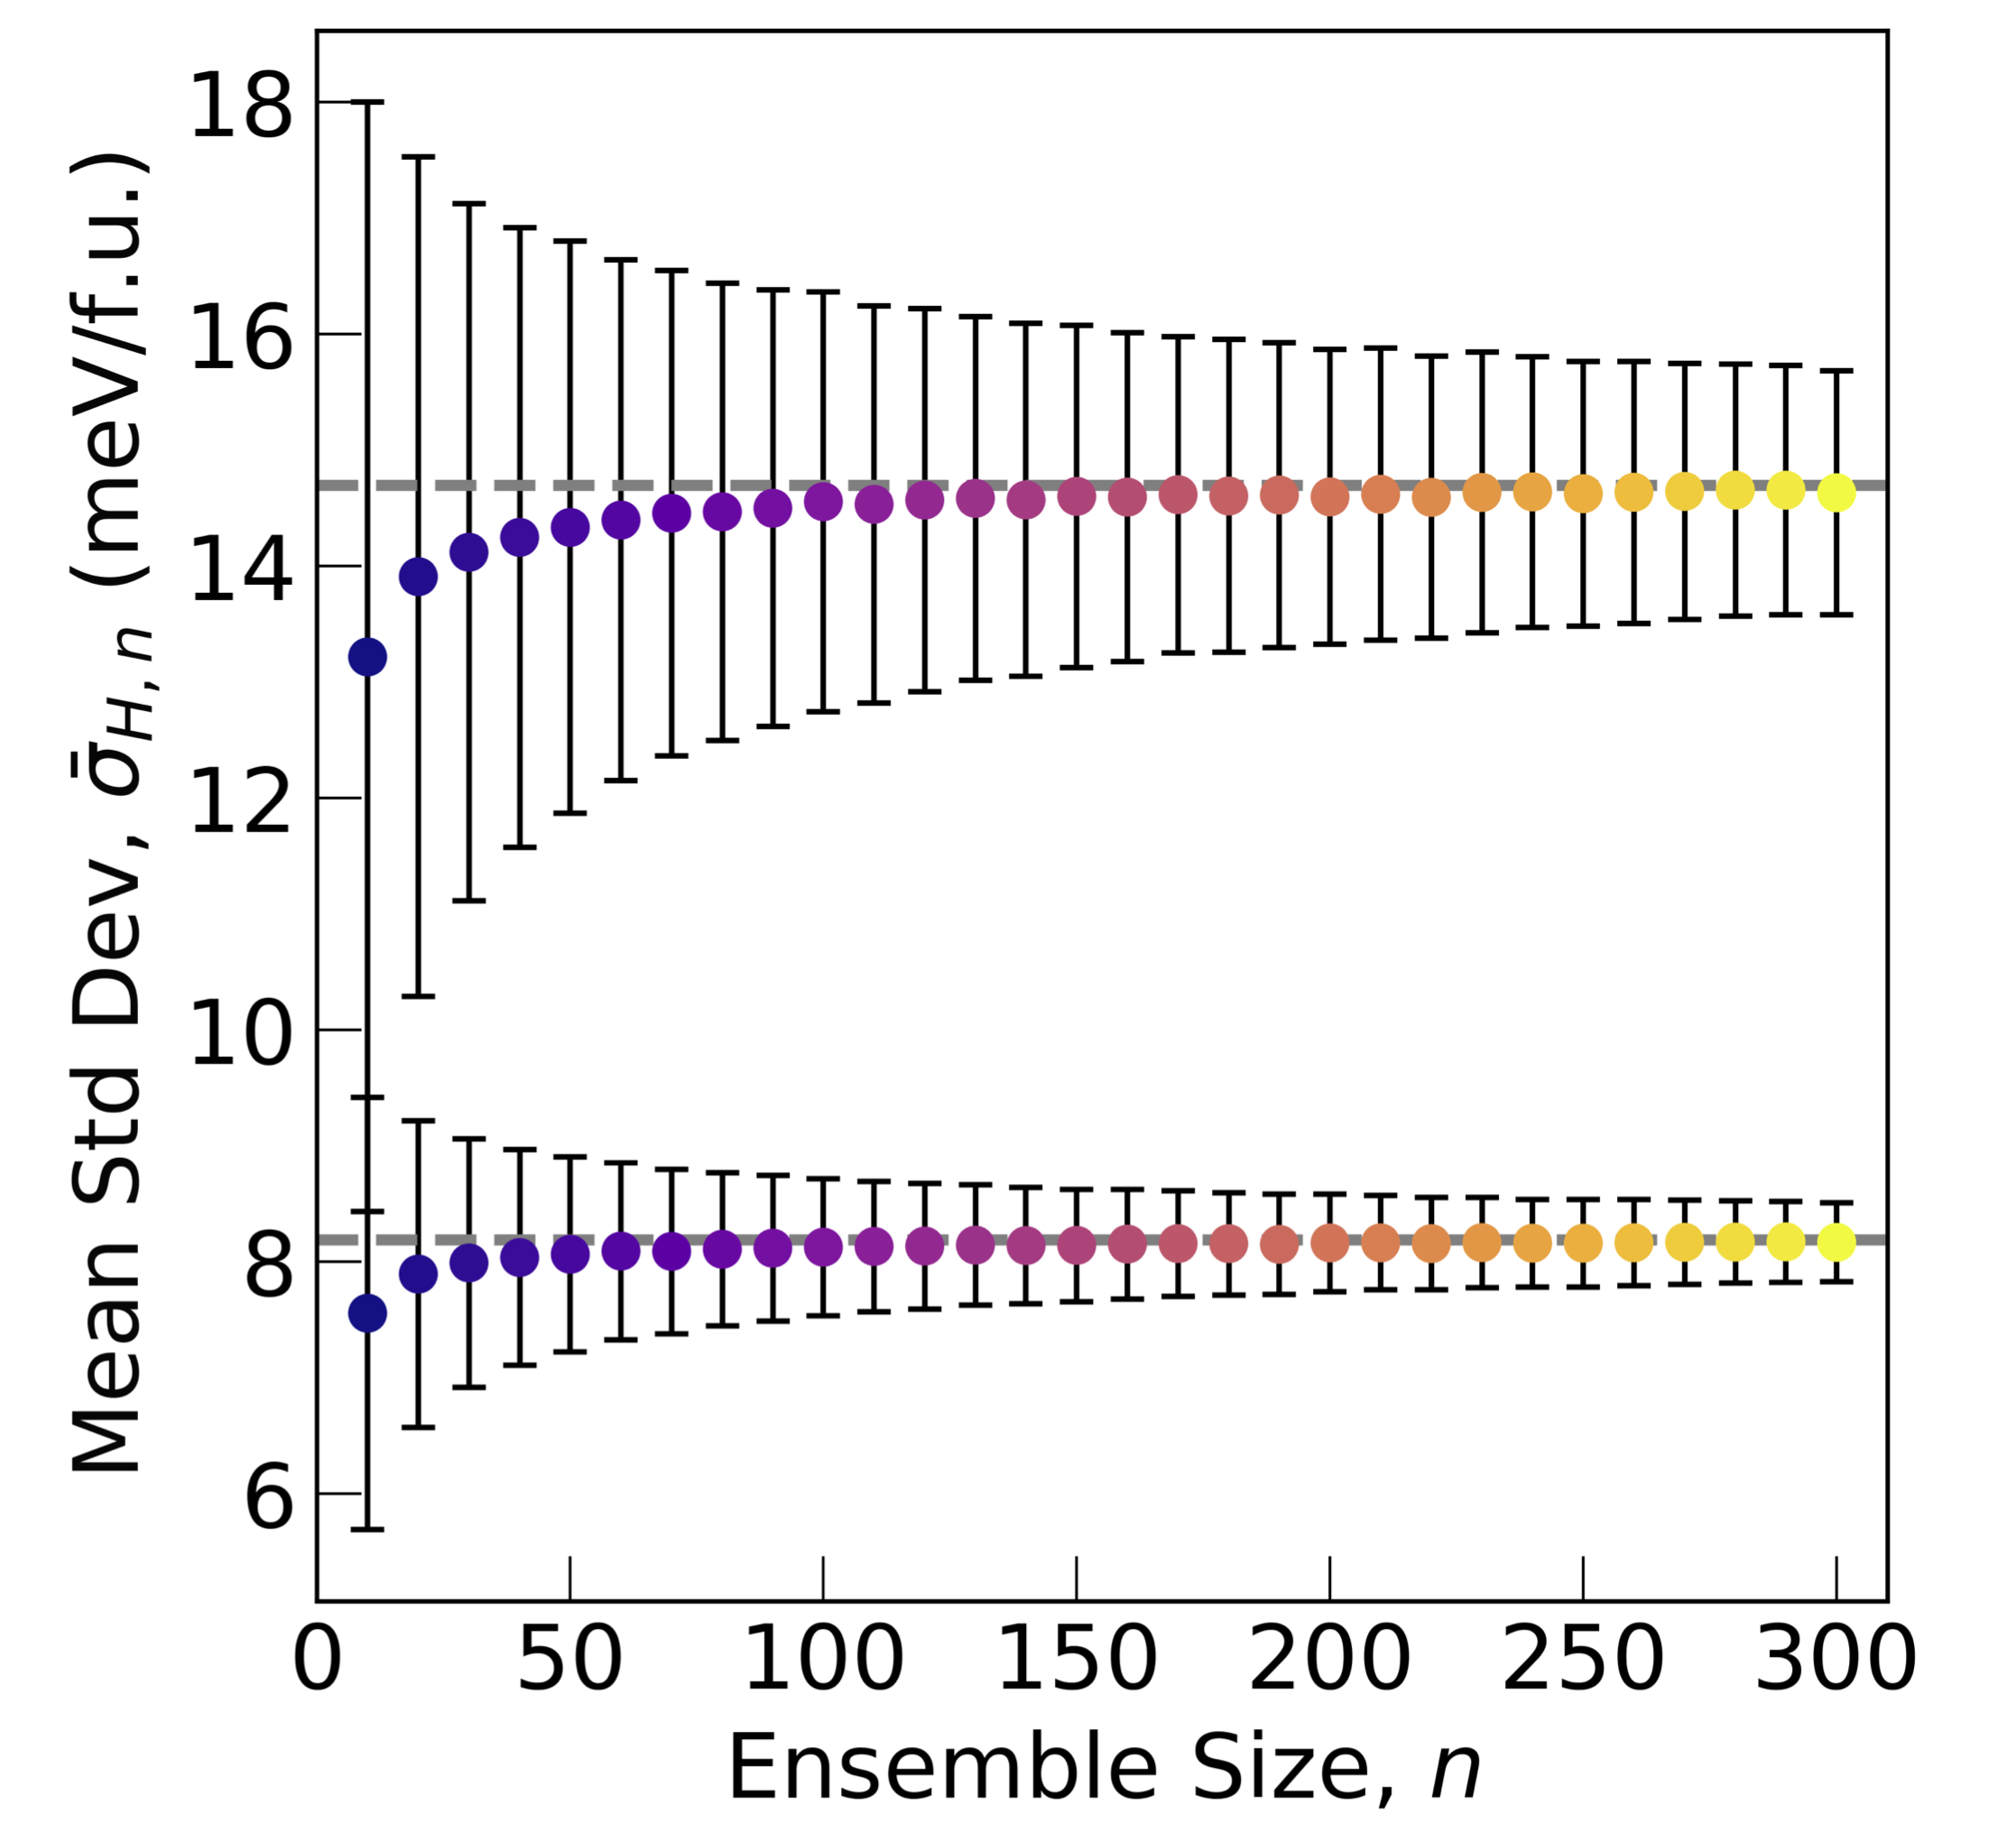
To actually assess the uncertainty contribution from making the approximation in Eq. (10), the error bars in Fig. 6 can be divided by . For instance, consider an ensemble of PbS0.5Te0.5. On average, the value is meV/f.u. Calculating the uncertainty in using Eq. (9) and Eq. (10) results in meV/f.u. In this particular instance, we are focused on determining the uncertainty in , not its actual value. Having an uncertainty in of 0.3 due to Eq. (10) is insignificant and well within the typical noise of thermodynamic calculations using DFT. We thus conclude that, for our system and property of interest, an initial ensemble size of 50 is sufficiently large such that . In the remainder of the results, we will adopt an of 50 as a starting point for estimating . As detailed in the methods, additional configurations can then be added to the ensemble until is within the desired uncertainty.
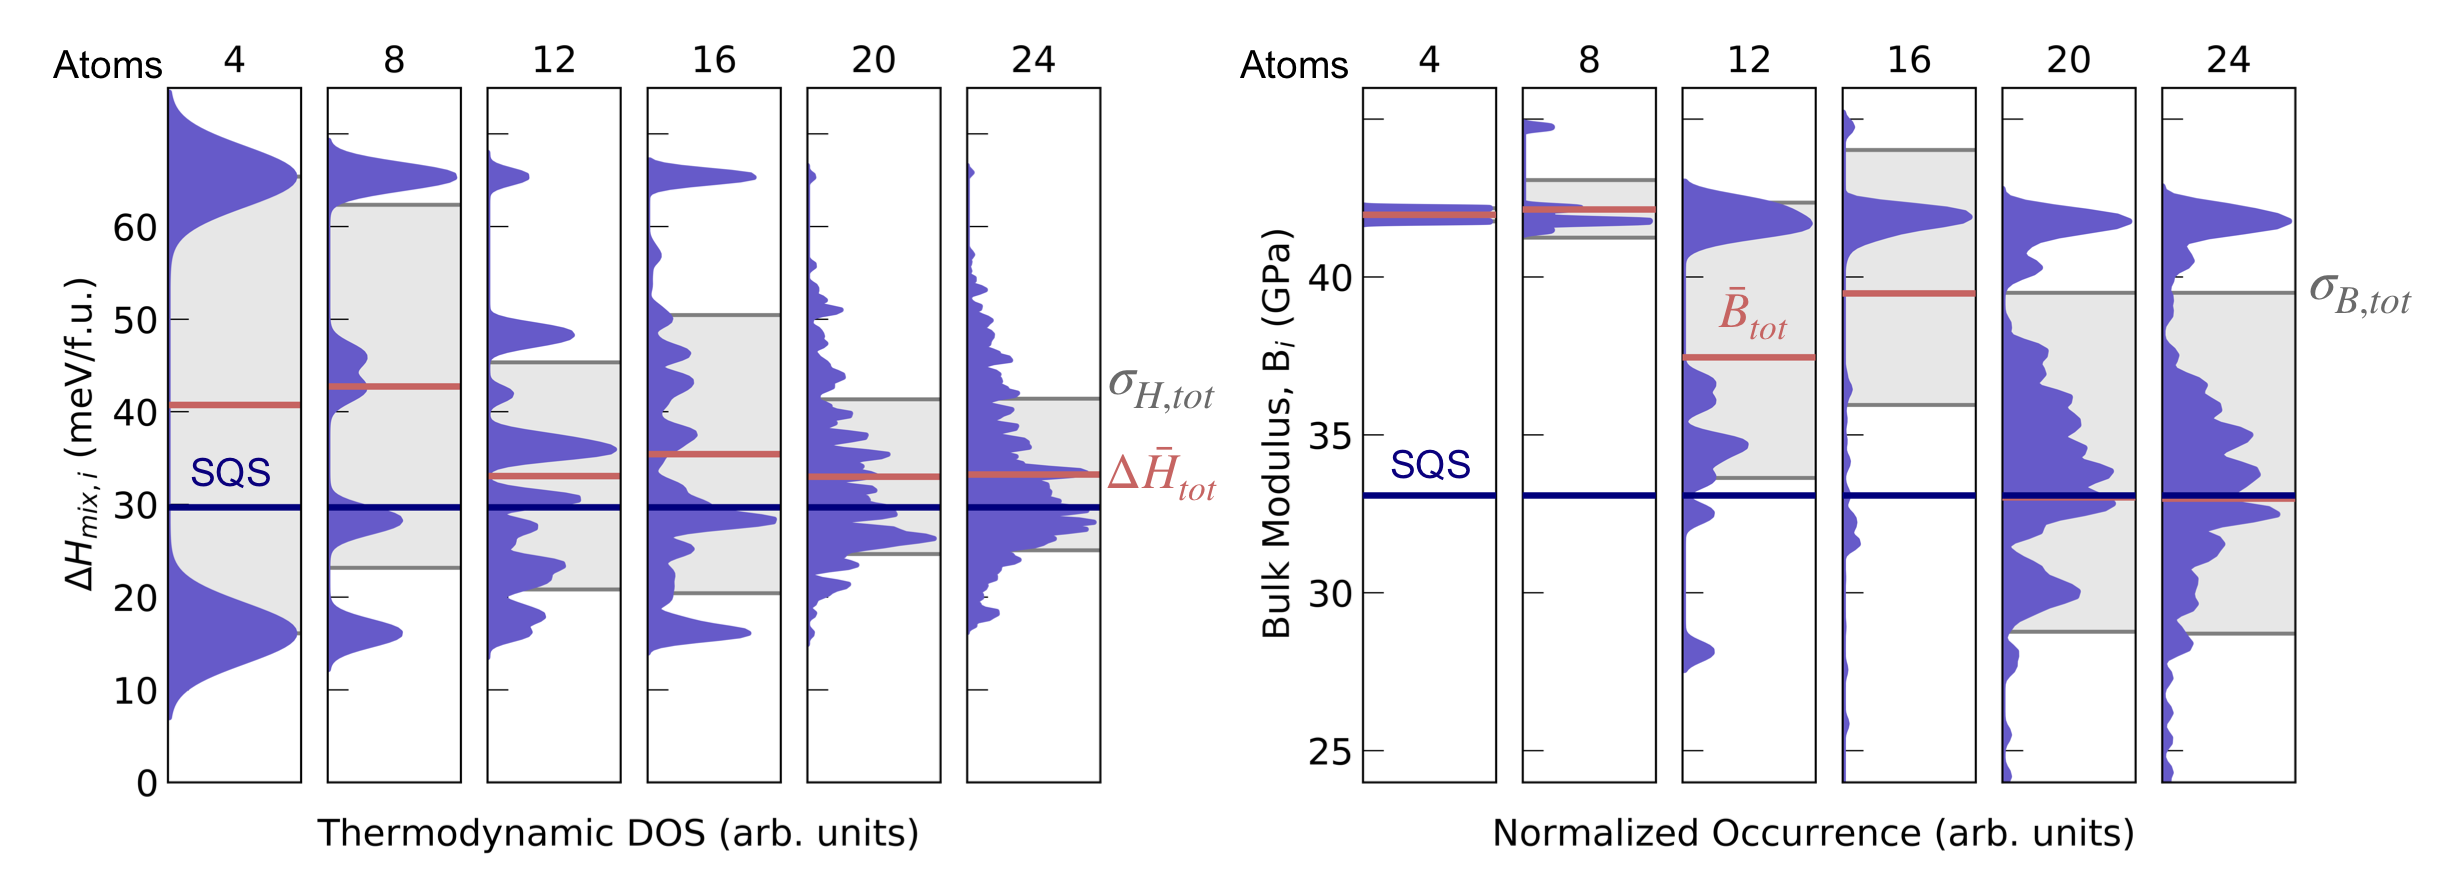
Supercell Size Convergence. To disentangle the effects of random sampling from supercell size dependence, we ran our convergence tests by sampling all possible configurations from 4 to 24-atom supercells. The results were also compared to a large (128-atom) SQS of the same composition. Since the SQS represents the ensemble in the high-temperature limit, the SQS energy should be equivalent to the mean energy of the thermodynamic density of states, .
In Fig. 7, begins to converge with the SQS-128 result by 12 atoms per cell, with the difference decreasing to below 6 meV/f.u. However, the distribution of energies does not converge until 20-24 atoms; here complete sampling involves 200 and 1107 unique configurations, respectively. This convergence can be seen in the thermodynamic density of states and their respective standard deviations. Only minor differences are found between the 20 and 24 atom cells; the differences between the mean energy and the SQS-128 are 3.3 and 3.5 meV/f.u., and the standard deviations are 8.1 and 8.3 meV/f.u., respectively. Convergence with respect to supercell size and the SQS indicates that 20-atom supercells are sufficiently large to incorporate the effects of configurational disorder for this system. These results can be viewed in terms of the CLT. If one were to build an ensemble of 50 randomly sampled configurations and calculated , one would have a 68 % of being within 1.17 meV/f.u. of , (grey shaded region in Fig. 7), and a 95 % chance of being within 2.34 meV/f.u.
Since energy is not our only property of interest, we converged the supercell size with respect to the bulk modulus. We chose bulk modulus as a test case since it is a medium-cost property that is dependent on atomic structure. In Figure 7b, the 12-atom supercells are not large enough to properly represent the softening in PbTe0.5Se0.5 that comes from distortion. However, by 20 and 24 atoms, we see excellent correspondence between the ensemble average and SQS, as well as the distributions between 20 and 24 atoms. Considering the distribution for 24-atom cells, we see significant variation in and thus obtain a of 5.4 GPa. From the CLT, to achieve an uncertainty of less than 1 GPa in , we would require an ensemble with .
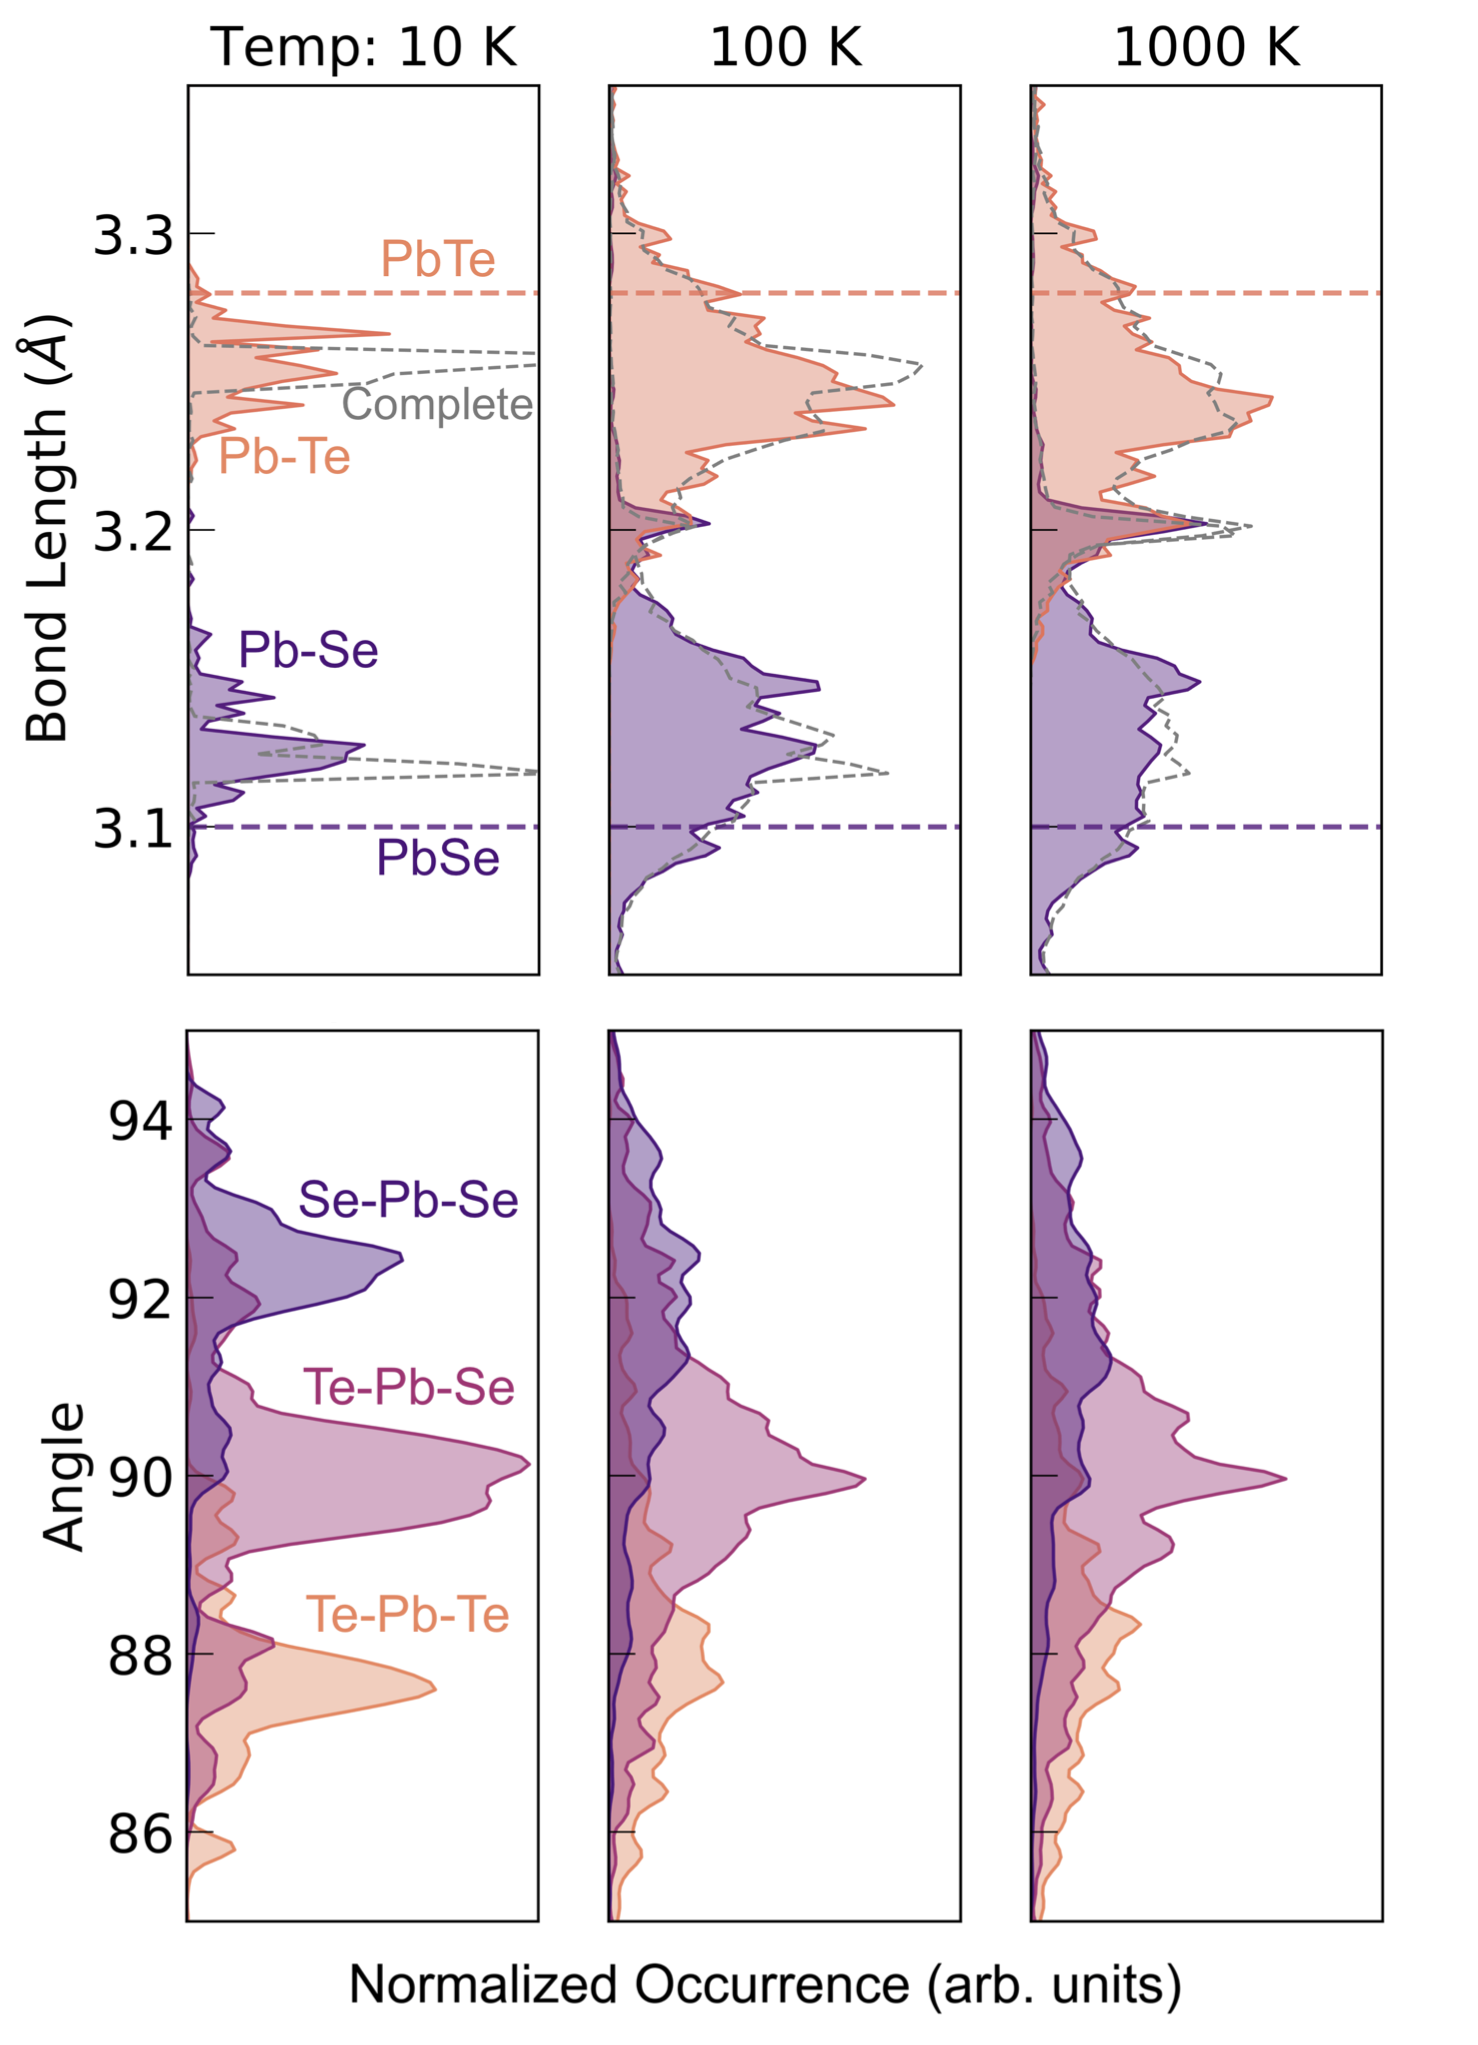
Local Structure. By ensemble averaging the structure of relaxed cells, we can explicitly calculate the effects of configurational disorder on short-range structural disorder. From 50 randomly relaxed cells, there are 3,600 bonds and 7,200 bond angles, originating from a variety of unique local atomic arrangements. The magnitude of data allows for an in-depth statistical analysis of the structure. Furthermore, unlike SQS, the ensemble structure can be calculated as a function of temperature.
At 10 K, as shown in Fig. 8, the distributions of bond lengths and bond angles have well-defined peaks. In fact, the x-axis for the bond lengths had to be stretched to four times that of 100 K and 1,000 K, just to fully include the peaks. The narrowness of the peaks can be, in part, attributed to the configurational probability distribution. At such a low temperature, the four lowest energy configurations make up 95 percent of the ensemble (as can be seen in Fig. 3). The degree of structural disorder is thus limited by the narrow range of structures present in the ensemble.
Within the ensemble, Pb-Se bonds are closer to the pure PbSe bond length (shown as a horizontal dashed line), but they are slightly larger due to the presence of Te. The reverse is true for Pb-Te bonds—they are shorter than that of pure PbTe. If the Virtual Crystal Approximation were invoked, and PbSe0.5Te0.5 were assumed to be perfectly rocksalt, then its single, universal bond length would be 3.19 A, derived from taking the average for that of PbSe and PbTe. There is, however, a significant gap between the two bond length distributions, and ostensibly no amplitude at 3.19 A. The ensemble structure is thus locally distorting from the rocksalt structure, so that the constituent bond lengths may more closely resemble the pure parent compounds. The same has been observed experimentally in ZnSe1-xTex [44] and theoretically for PbSe1-xTex [45]. The bond angle distributions at 10 K are also relatively narrow. Angles that are made up of exclusively Se anions are obtuse to accommodate the larger Te atoms. For angles with Te as the only anion, the angles are acute, and mixed anion angles are centered around 90 degrees, which corresponds to the ideal rocksalt structure.
As the temperature increases from 10 K to 100 K, the probability of higher energy configurations increases as well, resulting in a smearing of the bond length distribution. Interestingly, while the distribution of bond length smears, the average Pb-Te and Pb-Se bond lengths remain constant (within 0.011 and 0.019 Å, respectively). Due to the smearing, there is now amplitude where there was a gap, and there is a slight peak at 3.2 Å that is shared by both distributions, corresponding to the bond length that would be derived from the Virtual Crystal Approximation. The bond angles also significantly smear, but the average still remains at 90 degrees, pointing to a local distortions and the structure being globally rocksalt. For bond lengths at 1000 K, the peak at 3.2 Å grows, and since there is both Pb-Se and Pb-Te amplitude, it is roughly twice the size of the surrounding peaks. Thus, higher energy structures that adopt a more VCA local structure (i.e. have bond lengths of 3.19 Å) are being incorporated into the ensemble. The bond angle distributions continue to smear moving from 100 K to 1,000 K.
The same bond length analysis was repeated for the complete set of all 37,000 configurations, and the resulting distributions are shown as grey dashed lines in Figure 8. At 10 K, it can be seen that complete sampling has narrower, larger peaks than random sampling. This is to be expected. Random sampling, which samples from a uniform distribution of configurations, will have difficulty approximating a highly nonuniform distribution where the configurational probabilities vary widely, like one that is seen at 10 K. Still, the derived probabilities of the various configurations is sufficiently good to show the gap in bond lengths at 10 K. The average bond lengths at 10 K for Pb-Te and Pb-Se are 3.256A and 3.124 for complete sampling and 3.255A, 3.128A for random, showing overall good correspondence as well. Finally, at 100 K and 1,000 K, where the probability distribution for configurations is more uniform, random sampling, does an excellent job of replicating the bond length distribution.
III.2 PbSe1-xTex Pseudo-binary
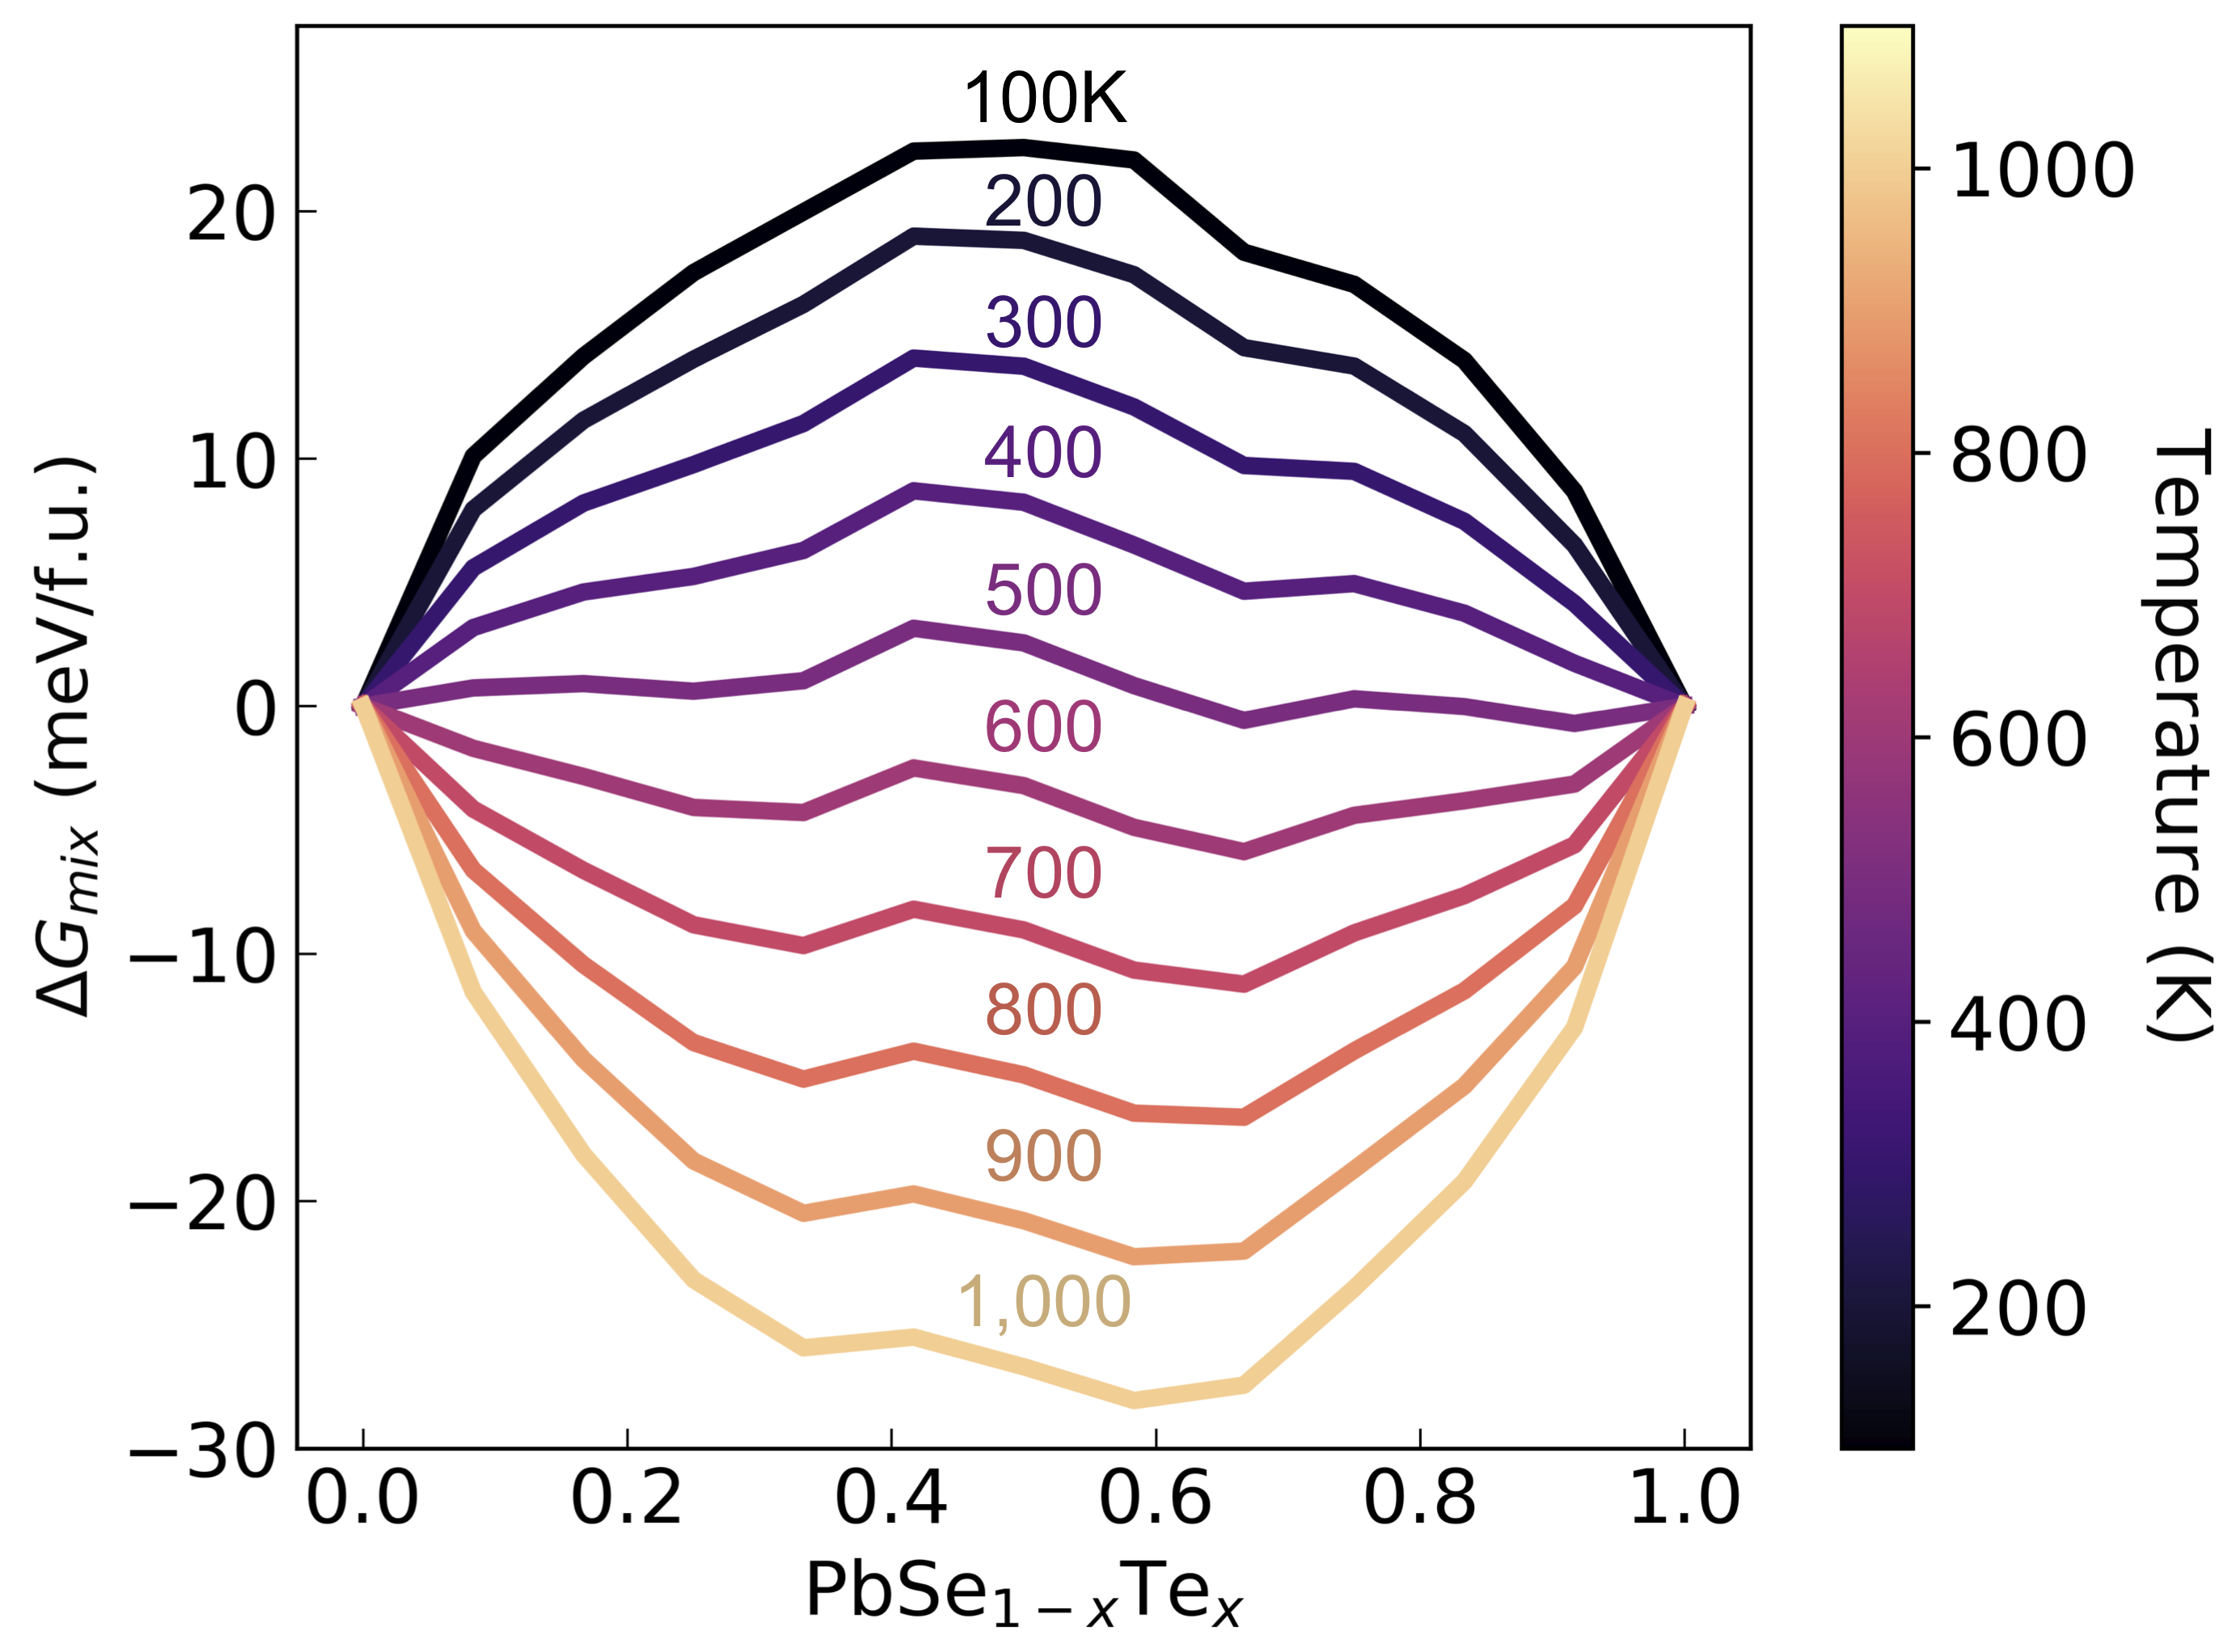
The free energy calculations from Fig. 5 were extended across the PbSe1-xTex system. Fig. 9 plots the for all thirteen compositions as a function of temperature. The of every alloy decreases with temperature, but this change is greater for compositions towards the center since they have larger configurational entropies. Thus, the curve goes from being concave to convex as the temperature increases. At typical growth temperatures of about 770-990 K, PbSe1-xTex is fully miscible experimentally [46, 47, 48]. The work by Liu et al. show the temperature at which full miscibility occurs is between 573 and 773 K. Our results align with these experimental results, showing that PbSe1-xTex is fully miscible at 600 K, below the typical experimental growth temperatures and within the range that Liu et al report. At elevated temperatures, we find that there are some compositions where the curve is locally concave, but this deviation from convexity is 1-2 meV/f.u., which is within the uncertainty of random sampling. More specifically, a composition is classified as being on the hull if its is within of the free energy convex hull.
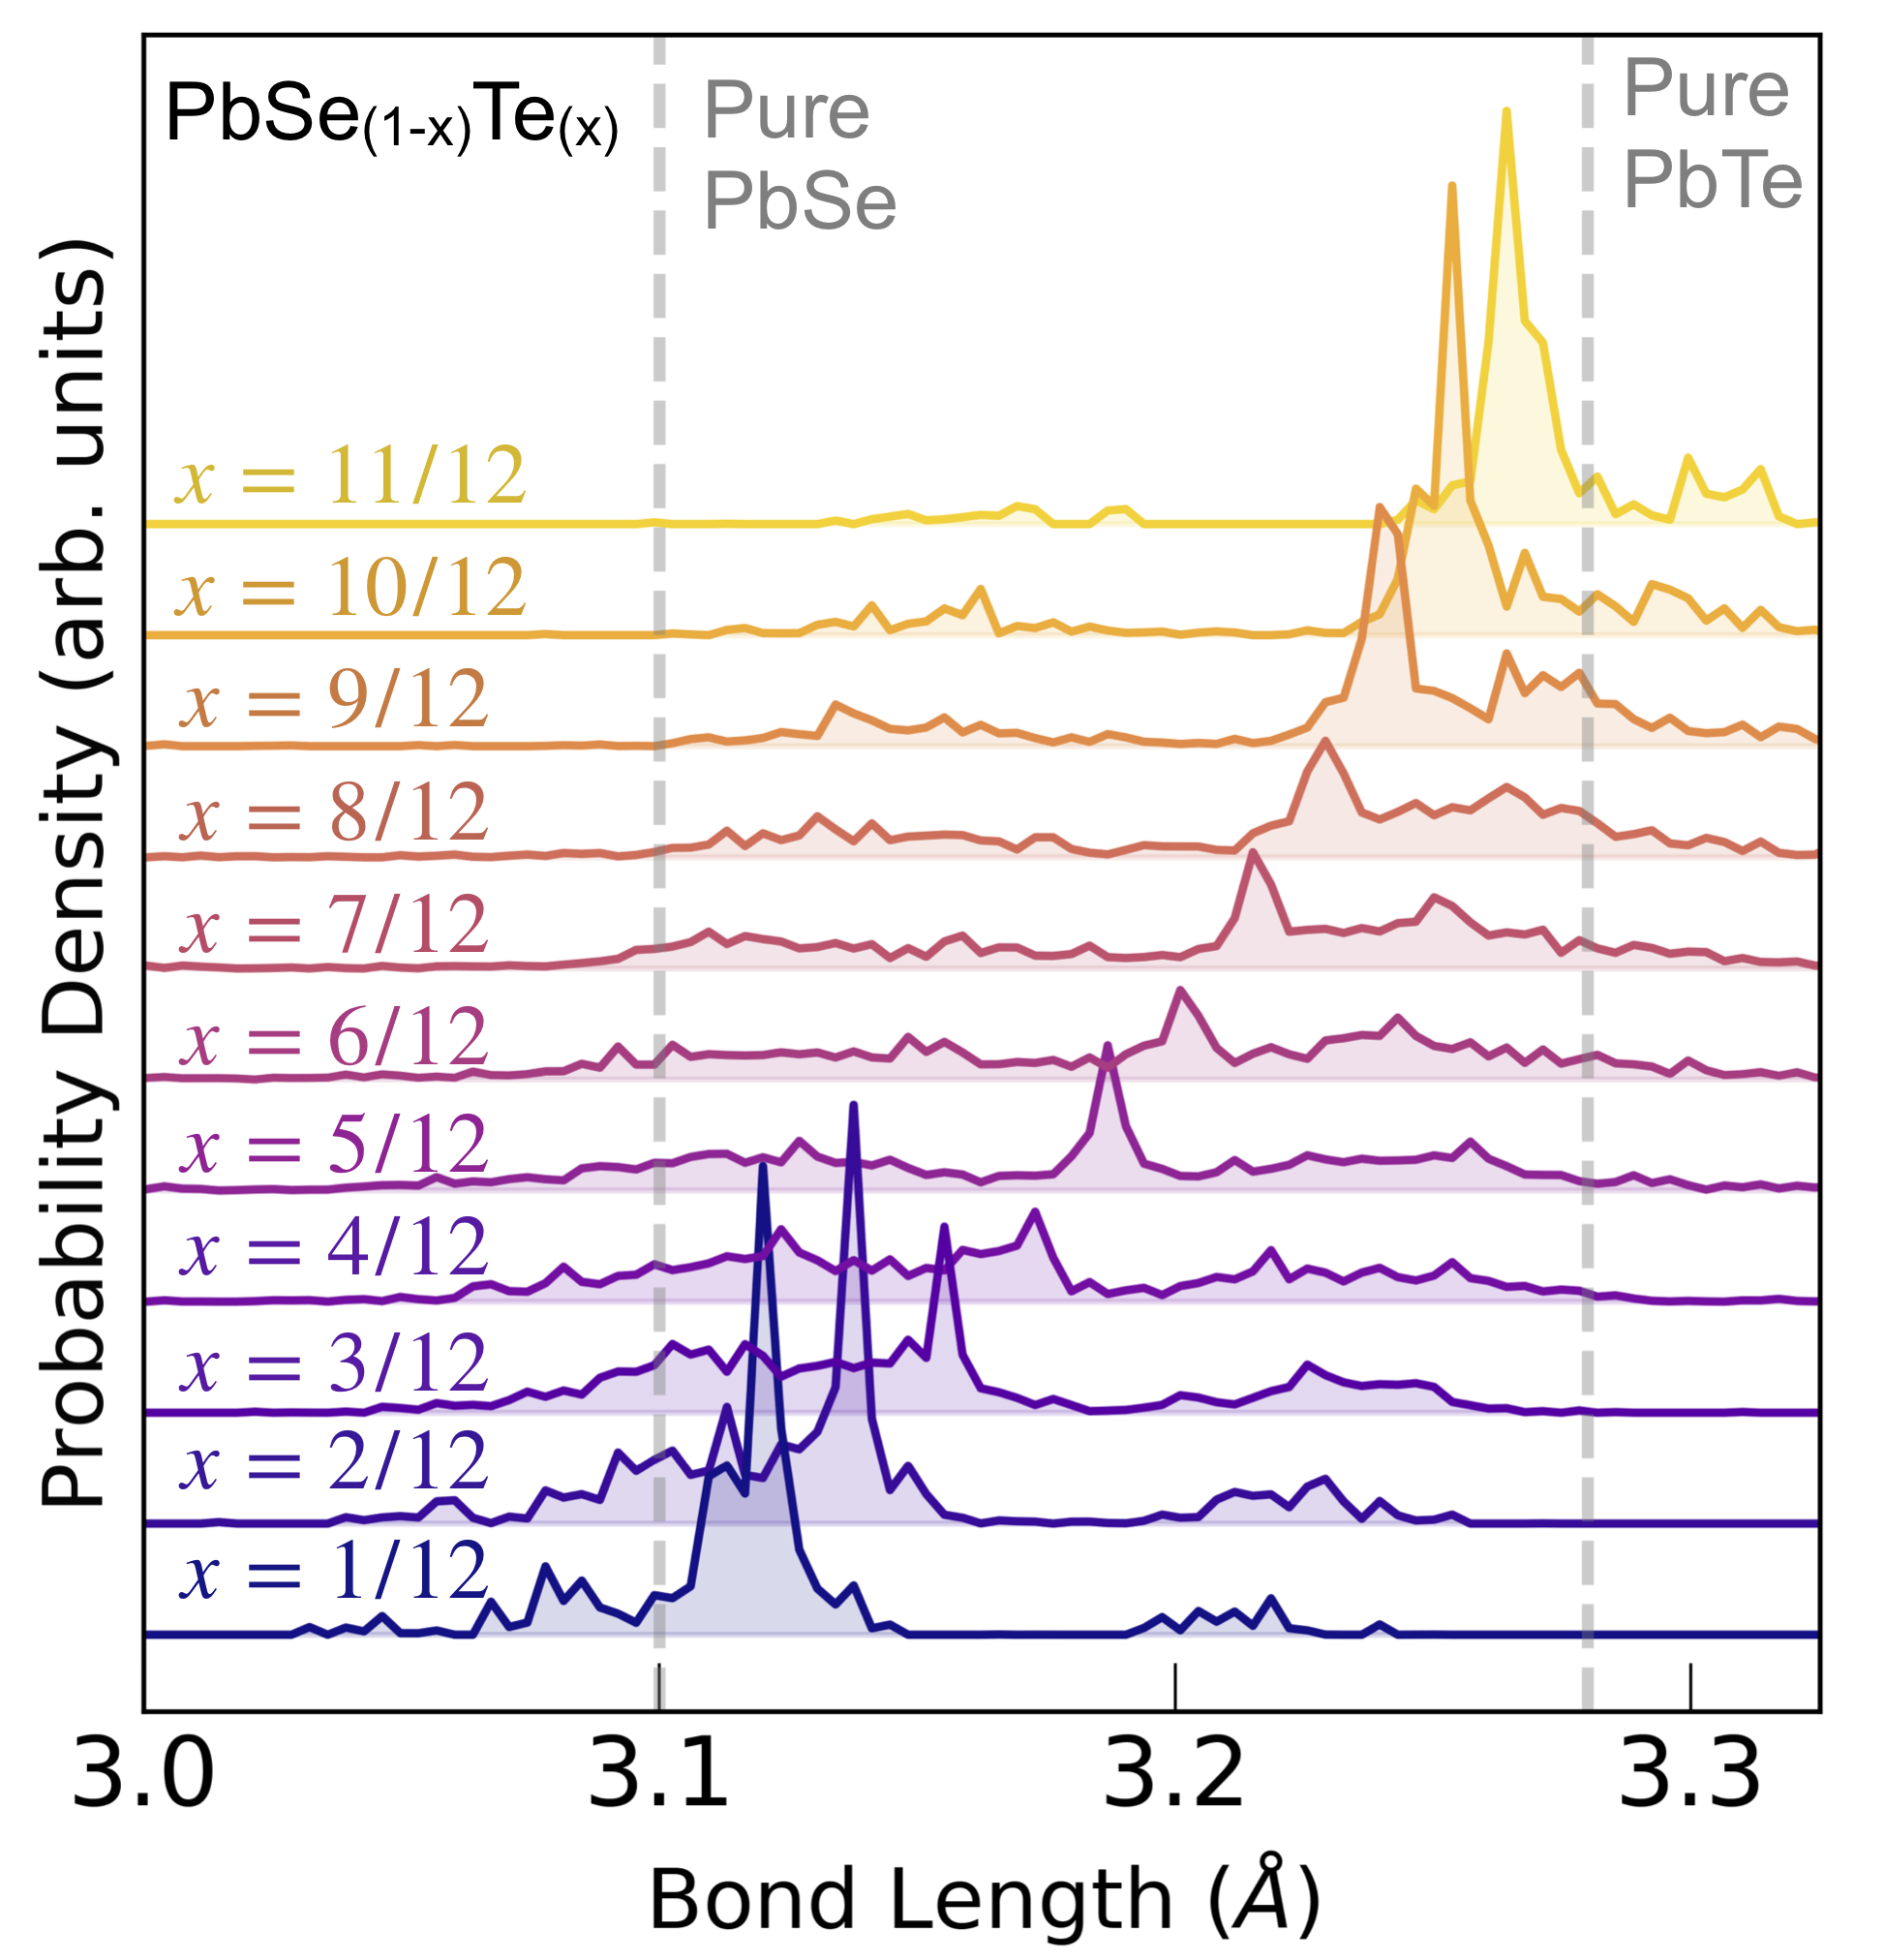
We also studied the local structure across compositions. In Fig. 10, the distribution of bond lengths is shown across the PbSe1-xTex pseudo-binary. All configurations are weighed equally in these distributions, corresponding to a high-temperature ensemble average. For PbSe11/12Te1/12 the bond lengths are tightly clustered around that of PbSe, but the bonds are slightly larger due to the incorporation of the larger Te atom. The amplitude at 3.2 Å originates from Pb-Te bonds, as can be seen in the supplementary. The reverse trend is true for PbSe1/12Te11/12, where the slight amplitude at 3.15 Å comes from the Pb-Se bonds. For the compositions towards the middle of the pseudo-binary, the bond distribution has an evidently larger spread. In part, this can be explained by simply having more diversity in the anions. If all Pb-Se and Pb-Te bonds were at a fixed length, then moving to the middle compositions would still increase the spread of the distribution. However, the spread also increases in the Pb-Se and Pb-Te bonds, as can be seen in supplementary Fig. S1. The position of the largest peak in the distribution shifts linearly as a function of composition. The position of these peaks corresponds to the Vegard’s derived bond length. The use of Vegard’s law can still show the max peak of the distribution, but more in-depth structural techniques like this method are necessary for ascertaining the extent of structural distortions.
III.3 PbSxSeyTe1-x-y pseudo-ternary and the Free energy convex hull
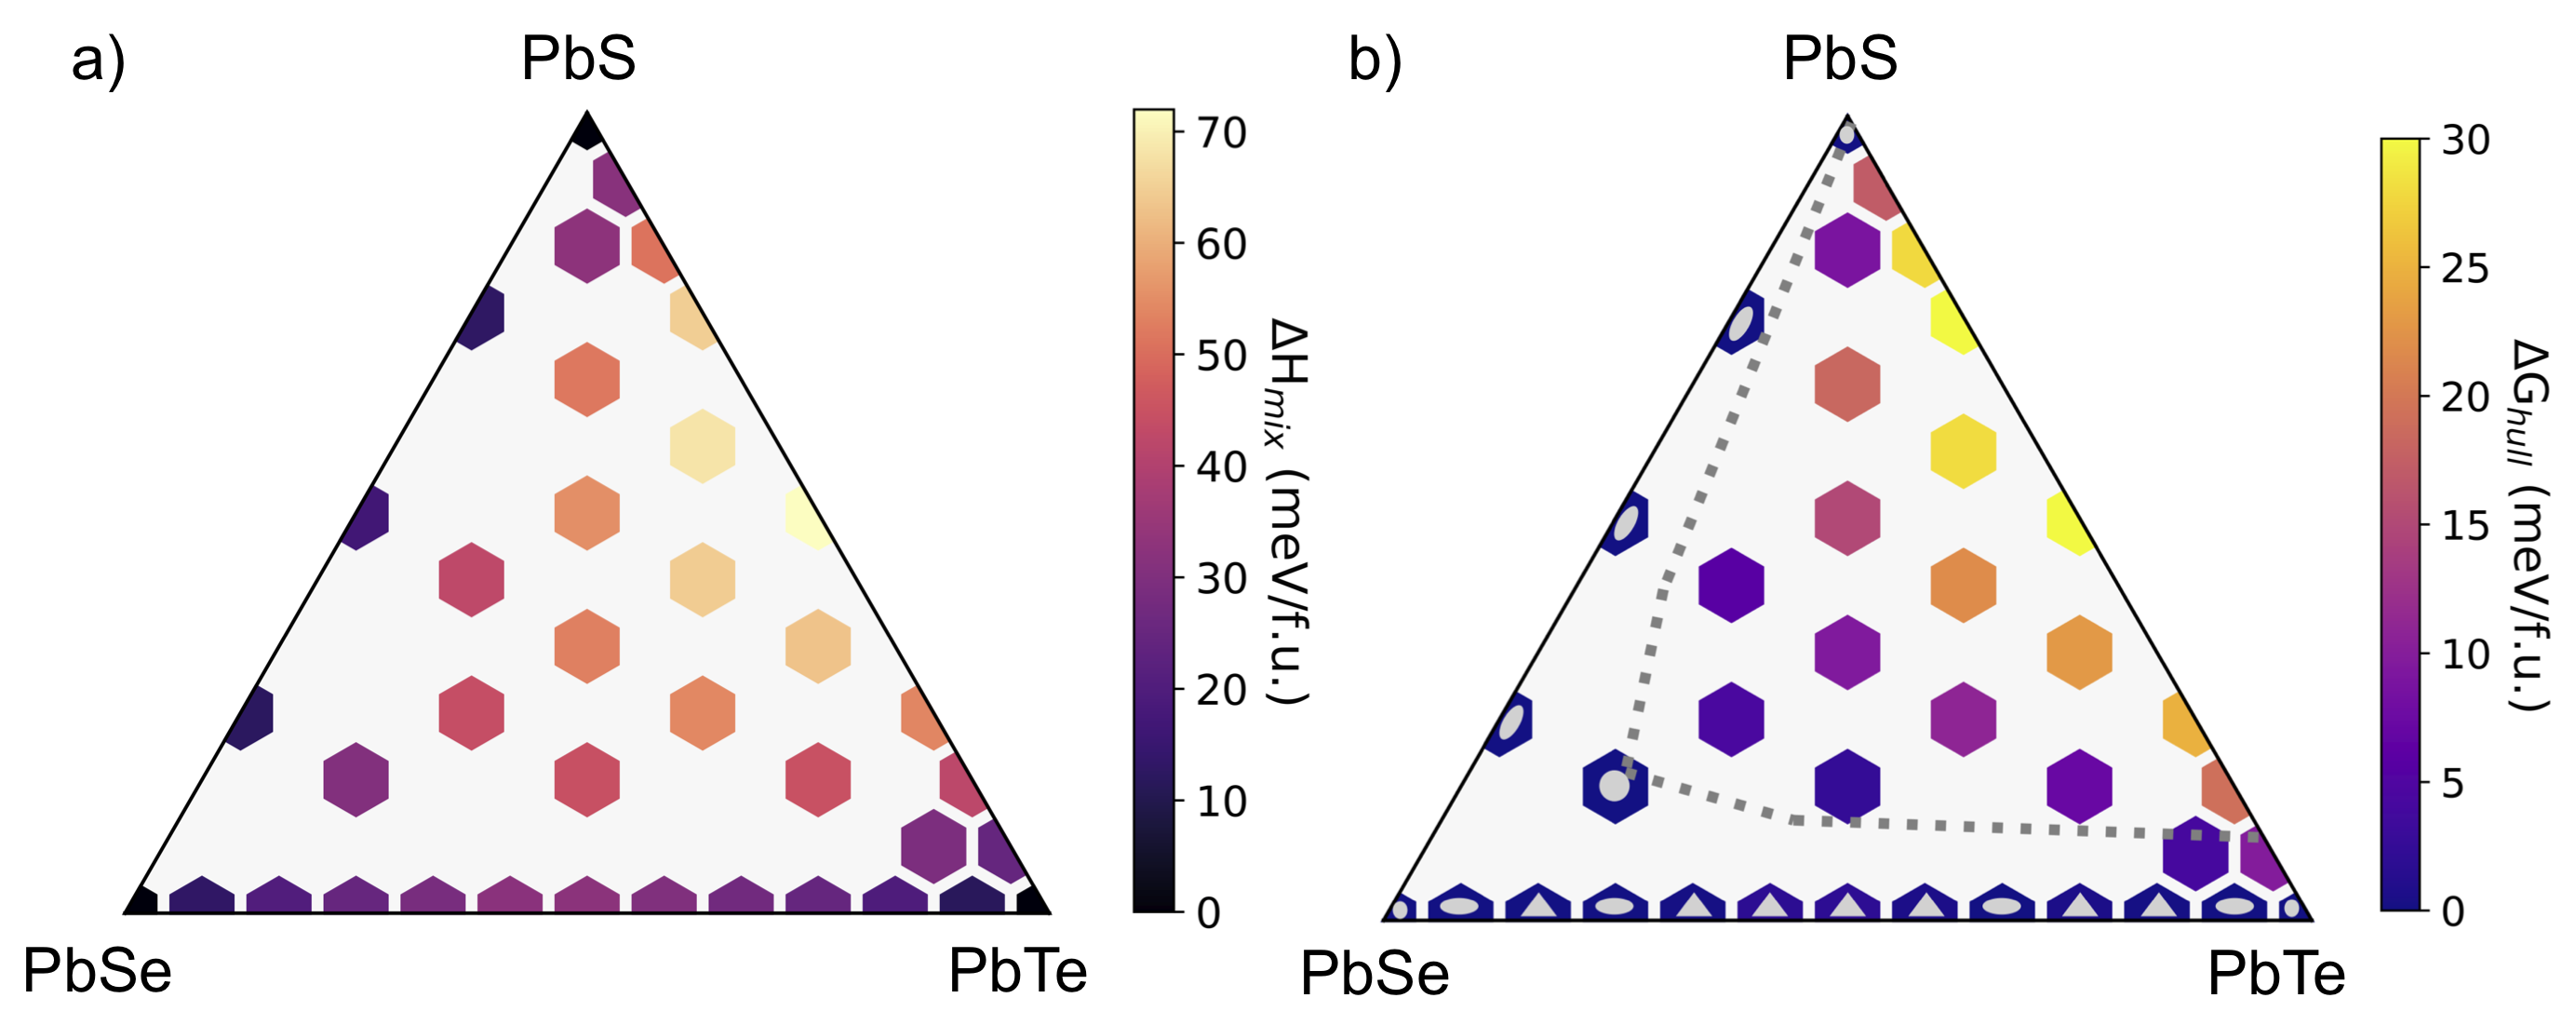
Extending this methodology from psuedobinaries to pseudo-ternaries, we consider the PbSxSeyTe1-x-y system. The enthalpy of mixing () at 600 K across this chemical space is shown in Fig. 11. Within the composition space, PbS0.5Te0.5 has the highest . This can be explained by the two parent compounds having the largest volume mismatch ( Å3/f.u.), which has been shown to be a significant factor in determining miscibility [49, 50]. The across PbTe-PbSe is lower due to the smaller size mismatch (11 Å3/f.u.), and PbSe-PbS has the lowest , corresponding to its lowest size mismatch (6 Å3/f.u.). Adding Se to the PbS-PbTe binary reduces the ; one could rationalize this as the Se diluting the unfavorable Te-S interactions. The converse is also true: adding S to the PbSe-PbTe compositions raises its energy by increasing the concentration of S-Te interactions.
To determine which compositions of PbSxSeyTe1-x-y are stable against decomposition, was calculated for a temperature of 600 K, and a free energy convex hull was subsequently built from those values. The energy difference between the alloy and the free energy convex hull at each point, , is shown in Fig. 11b. If a composition is on the hull, that is, the composition is stable against phase separation, then . Hexagons with grey dots in them are mathematically on the hull (ie. ), while hexagons with triangles are on the hull within their uncertainty (ie. ). Some error is inherent in this approach as the hull is built from discrete points rather than a continuously defined function. We find that there is a wide two-phase region along the PbS-PbTe pseudo-binary. This region narrows as PbSe is added, both by decreasing the enthalpy and increasing the entropy. These predictions are consistent with prior experimental literature; the dashed line Fig. 11b reproduces the phase boundary at 773K temperature from reference [47]. The offset of 100-200 K between experiment and our approach is to be expected. This is likely due to the presented approach ignoring vibrational degrees of freedom.
III.4 (Pb1-xGex)(TeySezS1-y-z) High-entropy Space
We extend the Pb-chalcogenide pseudo-ternary to the high-dimensional (Pb1-xGex)(TeySezS1-y-z) system. Here we choose Ge for its small radius relative to Pb, which is expected to result in significant regions of immiscibility. For reference, the ionic radius of Ge is only 39 smaller than that of Pb when both have a sixfold coordination and a +2 oxidation state [51]. Ge was additionally chosen as an intriguing expansion of the composition space due to the structural diversity found in the end members (i.e. GeS, GeSe, GeTe). In their ground states, GeS and GeSe are and GeTe is [52, 53, 54]. Finally, Ge-based chalcogen alloys have shown intriguing thermoelectric behavior [55, 56, 57].
In the study of the (Pb1-xGex)(TeySezS1-y-z) system, an of 50 configurations with 24-atom supercells was used for all 78 compositions. The standard deviation in the for a given composition, , remained fairly consistent throughout the composition space. The CLT was employed to calculate the uncertainties in the using these values; only Pb0.5Ge0.5S and GeTe0.25S0.75 had an uncertainty higher than 3 meV/f.u. Both compositions required only five more configurations to get below the desired uncertainty.
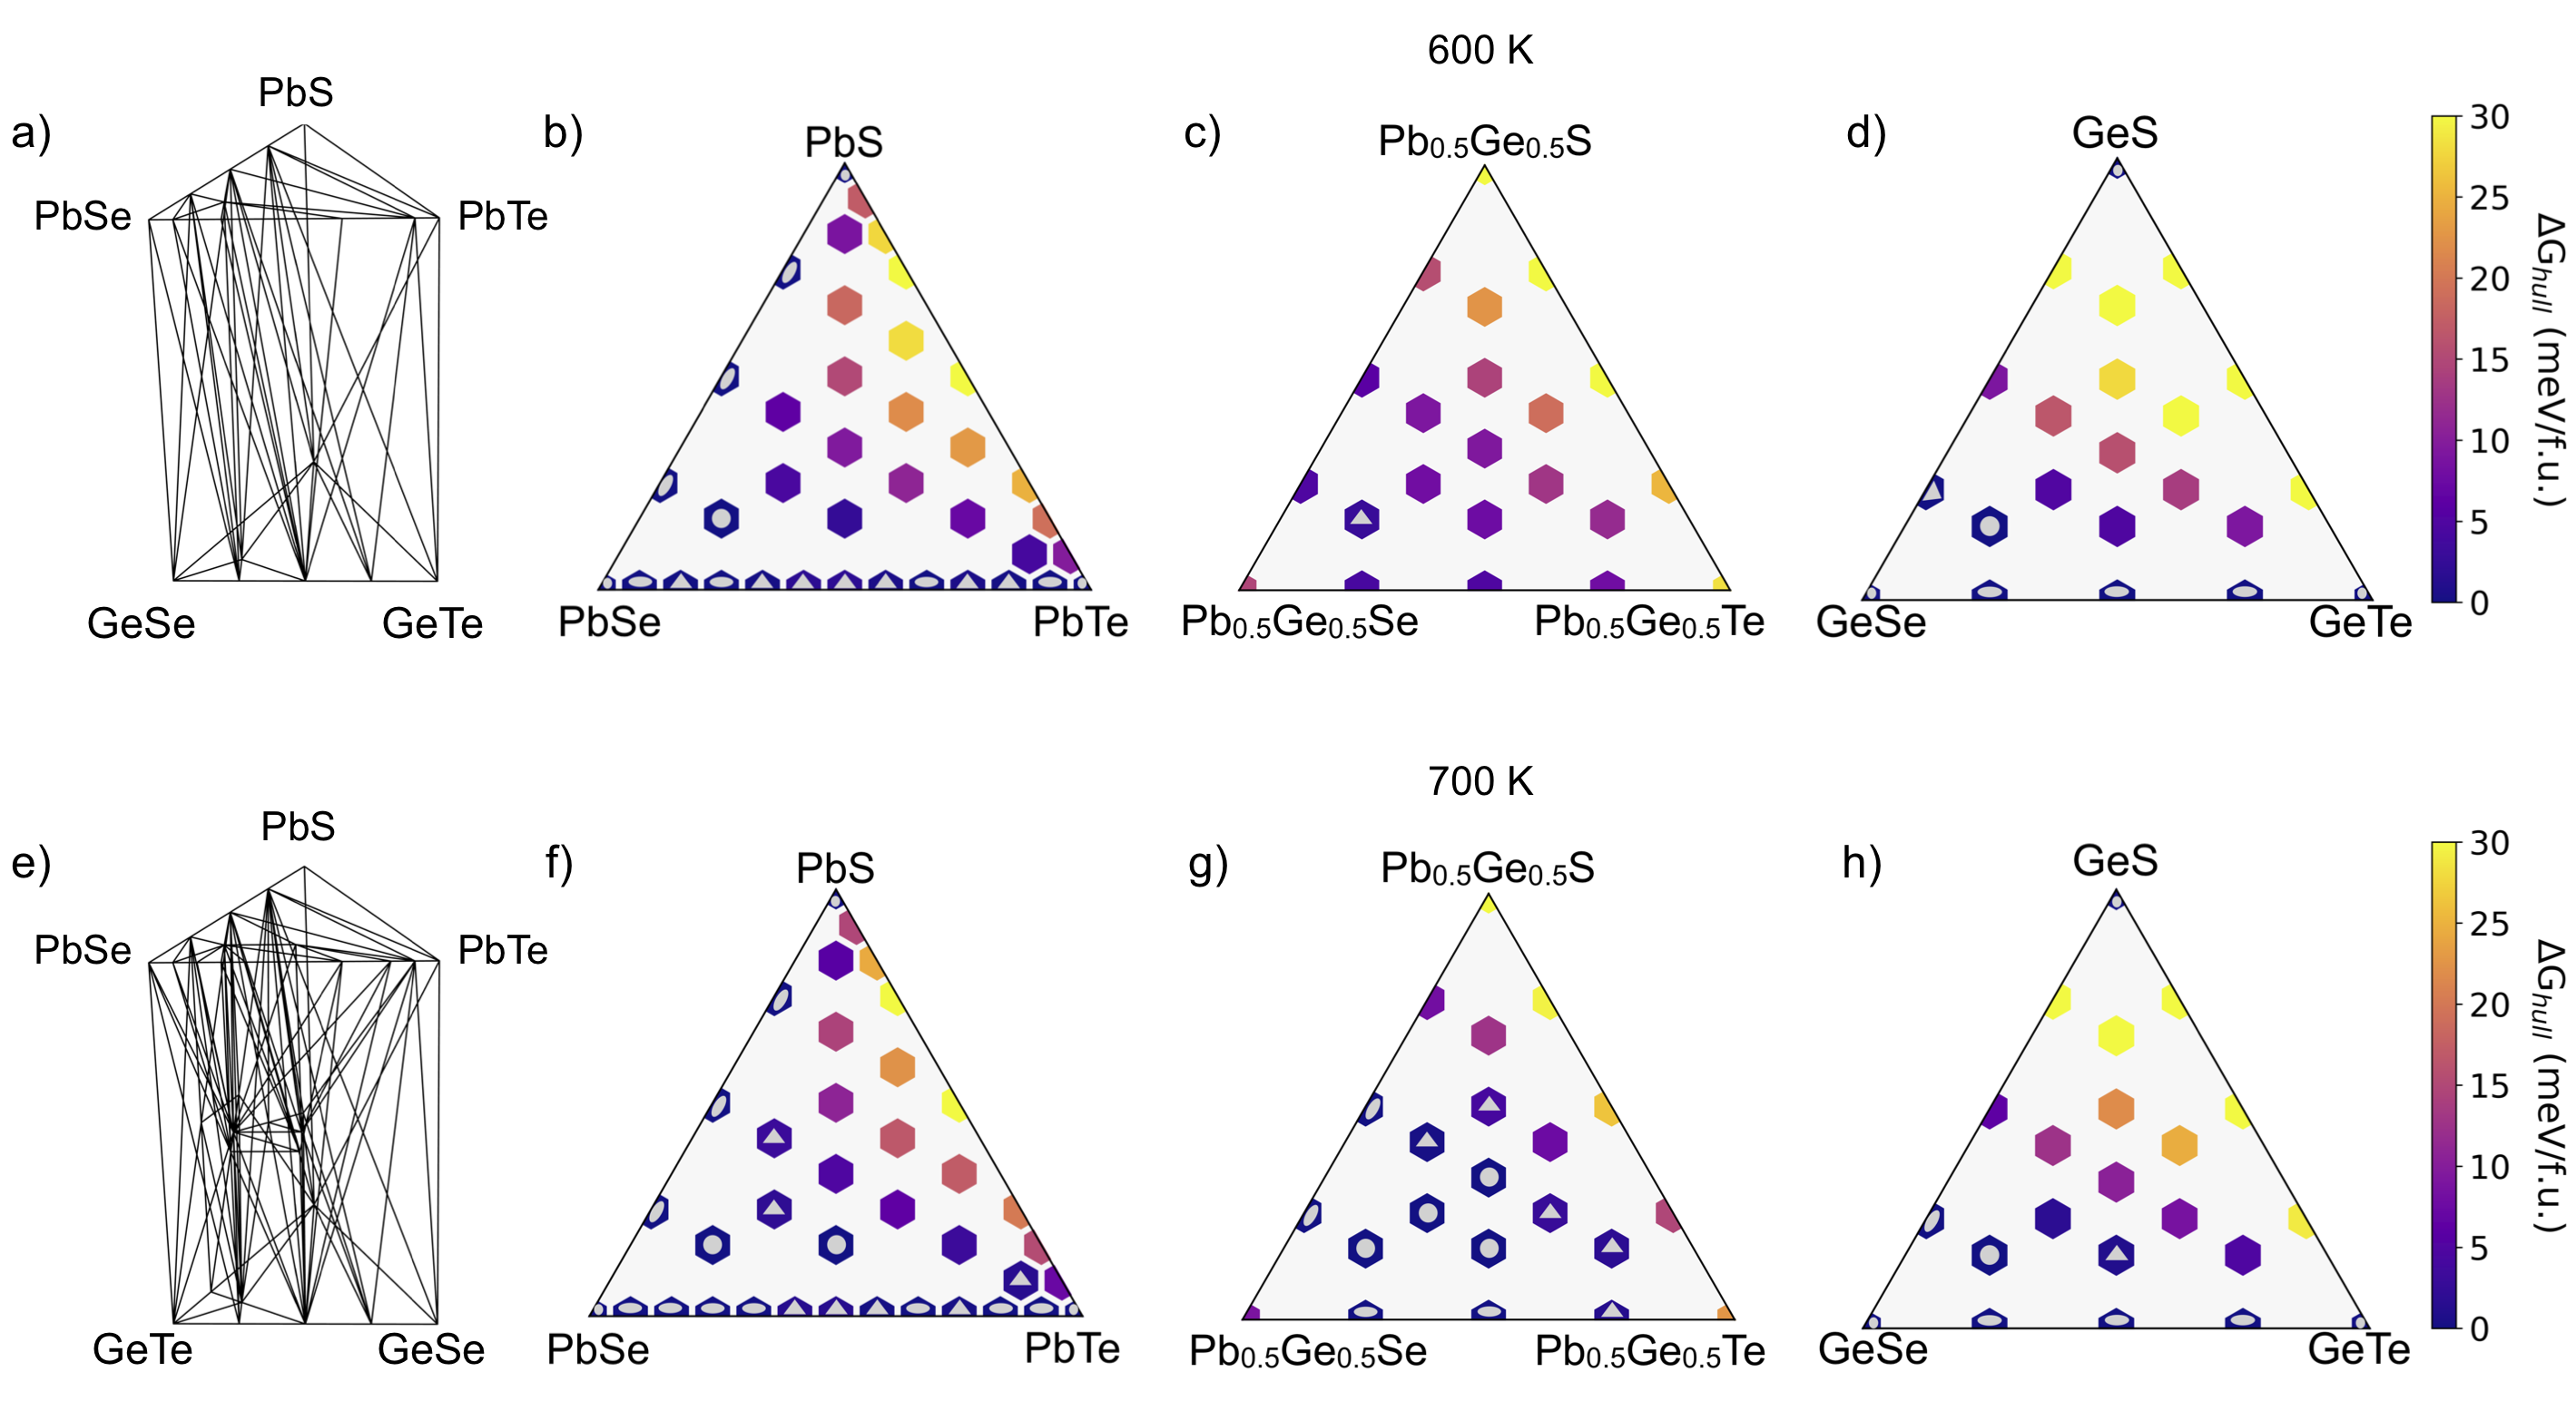
The (Pb1-xGex)(TeySezS1-y-z) composition space yields a pseudo-hexnary alloy represented by a trigonal prism, bounded by two pseudo-ternaries and three pseudo-quaternaries (Fig. 12a). Concerning the pseudo-ternary faces, the PbSxSeyTe1-x-y face has been discussed in section III.3. Fig. 12 shows different slices through this composition space at two different temperatures.
As previously discussed, at K the pseudo-ternary in Fig. 12b appears to be the most soluble judging by the number of compositions that are on the convex hull. The free energy of the opposite face, GeSxSeyTe1-x-y, is shown in Fig. 12 at 600 K. Once again, the GeS-GeTe alloys are more energetically costly than the GeS-GeSe and GeSe-GeTe alloys. Experimental phase stability measurements indicate extremely limited solubility for GeS-GeTe [58]. There is also limited solubility for GeS-GeSe [59], despite GeS and GeSe having the same crystal structure. Experimental studies of GeSe-GeTe indicate a complete solid solution at temperatures above 930 K and narrow ranges of immiscibility at low temperature to account for changes in space group [60]. The symmetry-driven regions of immiscibility are fairly narrow, and therefore are not found using the coarse compositional sampling presented here. There is fairly little solubility reported for adding GeSe and GeS to GeTe, with phase separation occurring at the dilute concentration of GeS0.05Se0.05Te0.9 [56].
The middle slice of the prism (Figure 12c) is entirely above the hull at 600 K. Despite these compositions having the highest entropy in the prism, they are not on the free energy convex hull due to their high and the presence of competing alloy compositions with low . Highlighting this competition, 9 out of the 22 compositions in the middle slice have negative free energies, and thus would not decompose into their parent compounds, but due to competing alloy compositions, they are not on the hull. For instance, Pb0.5GeS0.33Se0.33Te0.34 decomposes into GeSe0.25Te0.75, GeSe0.5Te0.5, PbSe0.5S0.5, and PbSe0.25S0.75. The results would have been qualitatively different if a metric like the temperature of mixing had been used since it only determines the temperature at which is zero, thus assuming that the parent compounds are the only competing compositions. We find that the presence of competing alloy compositions to be large, especially in high-entropy spaces, underlying the need for a free energy convex hull to determine solubility. The predicted tendency to decompose to GeX- and PbX-rich pseudo-ternaries is consistent with known Pb1-xGexS, Pb1-xGexSe, and Pb1-xGexTe pseudo-binaries [61, 62, 63]. At high temperatures, Pb1-xGexTe is known from experiments to become miscible for a narrow temperature range before melting (843-965 K) [63].
The interior of the prism shown in Figure 12a is completely filled with Alkemade tetrahedra. These four-phase regions arise from determining the convex hull of this three dimensional composition space. It is important to note that because our calculations are limited to single points in composition space, a single phase region can only be represented as a series of adjacent, small, multi-phase regions. This discrete sampling likewise precludes a complete determination of the phase diagram at the current sampling density. However, even this limited sampling provides predictions concerning phase stability. Specifically, the (Pb0.5Ge0.5)(TeySezS1-y-z) compositions that are above the hull indicate a concave region in the interior of the prism. The edges of this concave region are not, however, well defined as there is likely some mixed cation solubility in the single phase regions at the top and bottom of the prism. Limited sampling does not provide a lower bound on the energy of the hull, but it does provide an upper bound; if a composition is found to be above the hull, no amount of increased sampling will push it onto the hull. Furthermore, if a composition is found to be on the hull, increased sampling may result in the discovery of a new low energy composition that pushes previously found compositions off the hull.
Even with the low sampling density considered herein, some preliminary insights into the free energy surface and associated multi-phase regions can be inferred from Figure 12a. The presence of many Alkemade tetrahedra connecting to a single point, as seen along the GeTe-GeSe edge, suggests the presence of a nearby favorable extrema (i.e., large positive Hessian) in the free energy surface. These results are consistent with the experimental results for the pseudo-binaries discussed above. To our knowledge the interior of the prism has not been experimentally studied.
Considering the 700 K behavior of Pb1-xGexTeySezS1-y-z, we predict significant stabilization of the interior (x = 0.5), as seen in Figure 12(e)). As expected, the lower entropy Ge and Pb pseudo-ternaries show minimal increased stabilization from the 100 K increase in temperature. The resulting grid is still coarsely sampled (i.e., =0, 0.5, 1) and is likely subject to qualitative changes in the resulting phase diagram with increased density. Nevertheless, the presented method allows for the efficient evaluation of the free energy for many compositions.
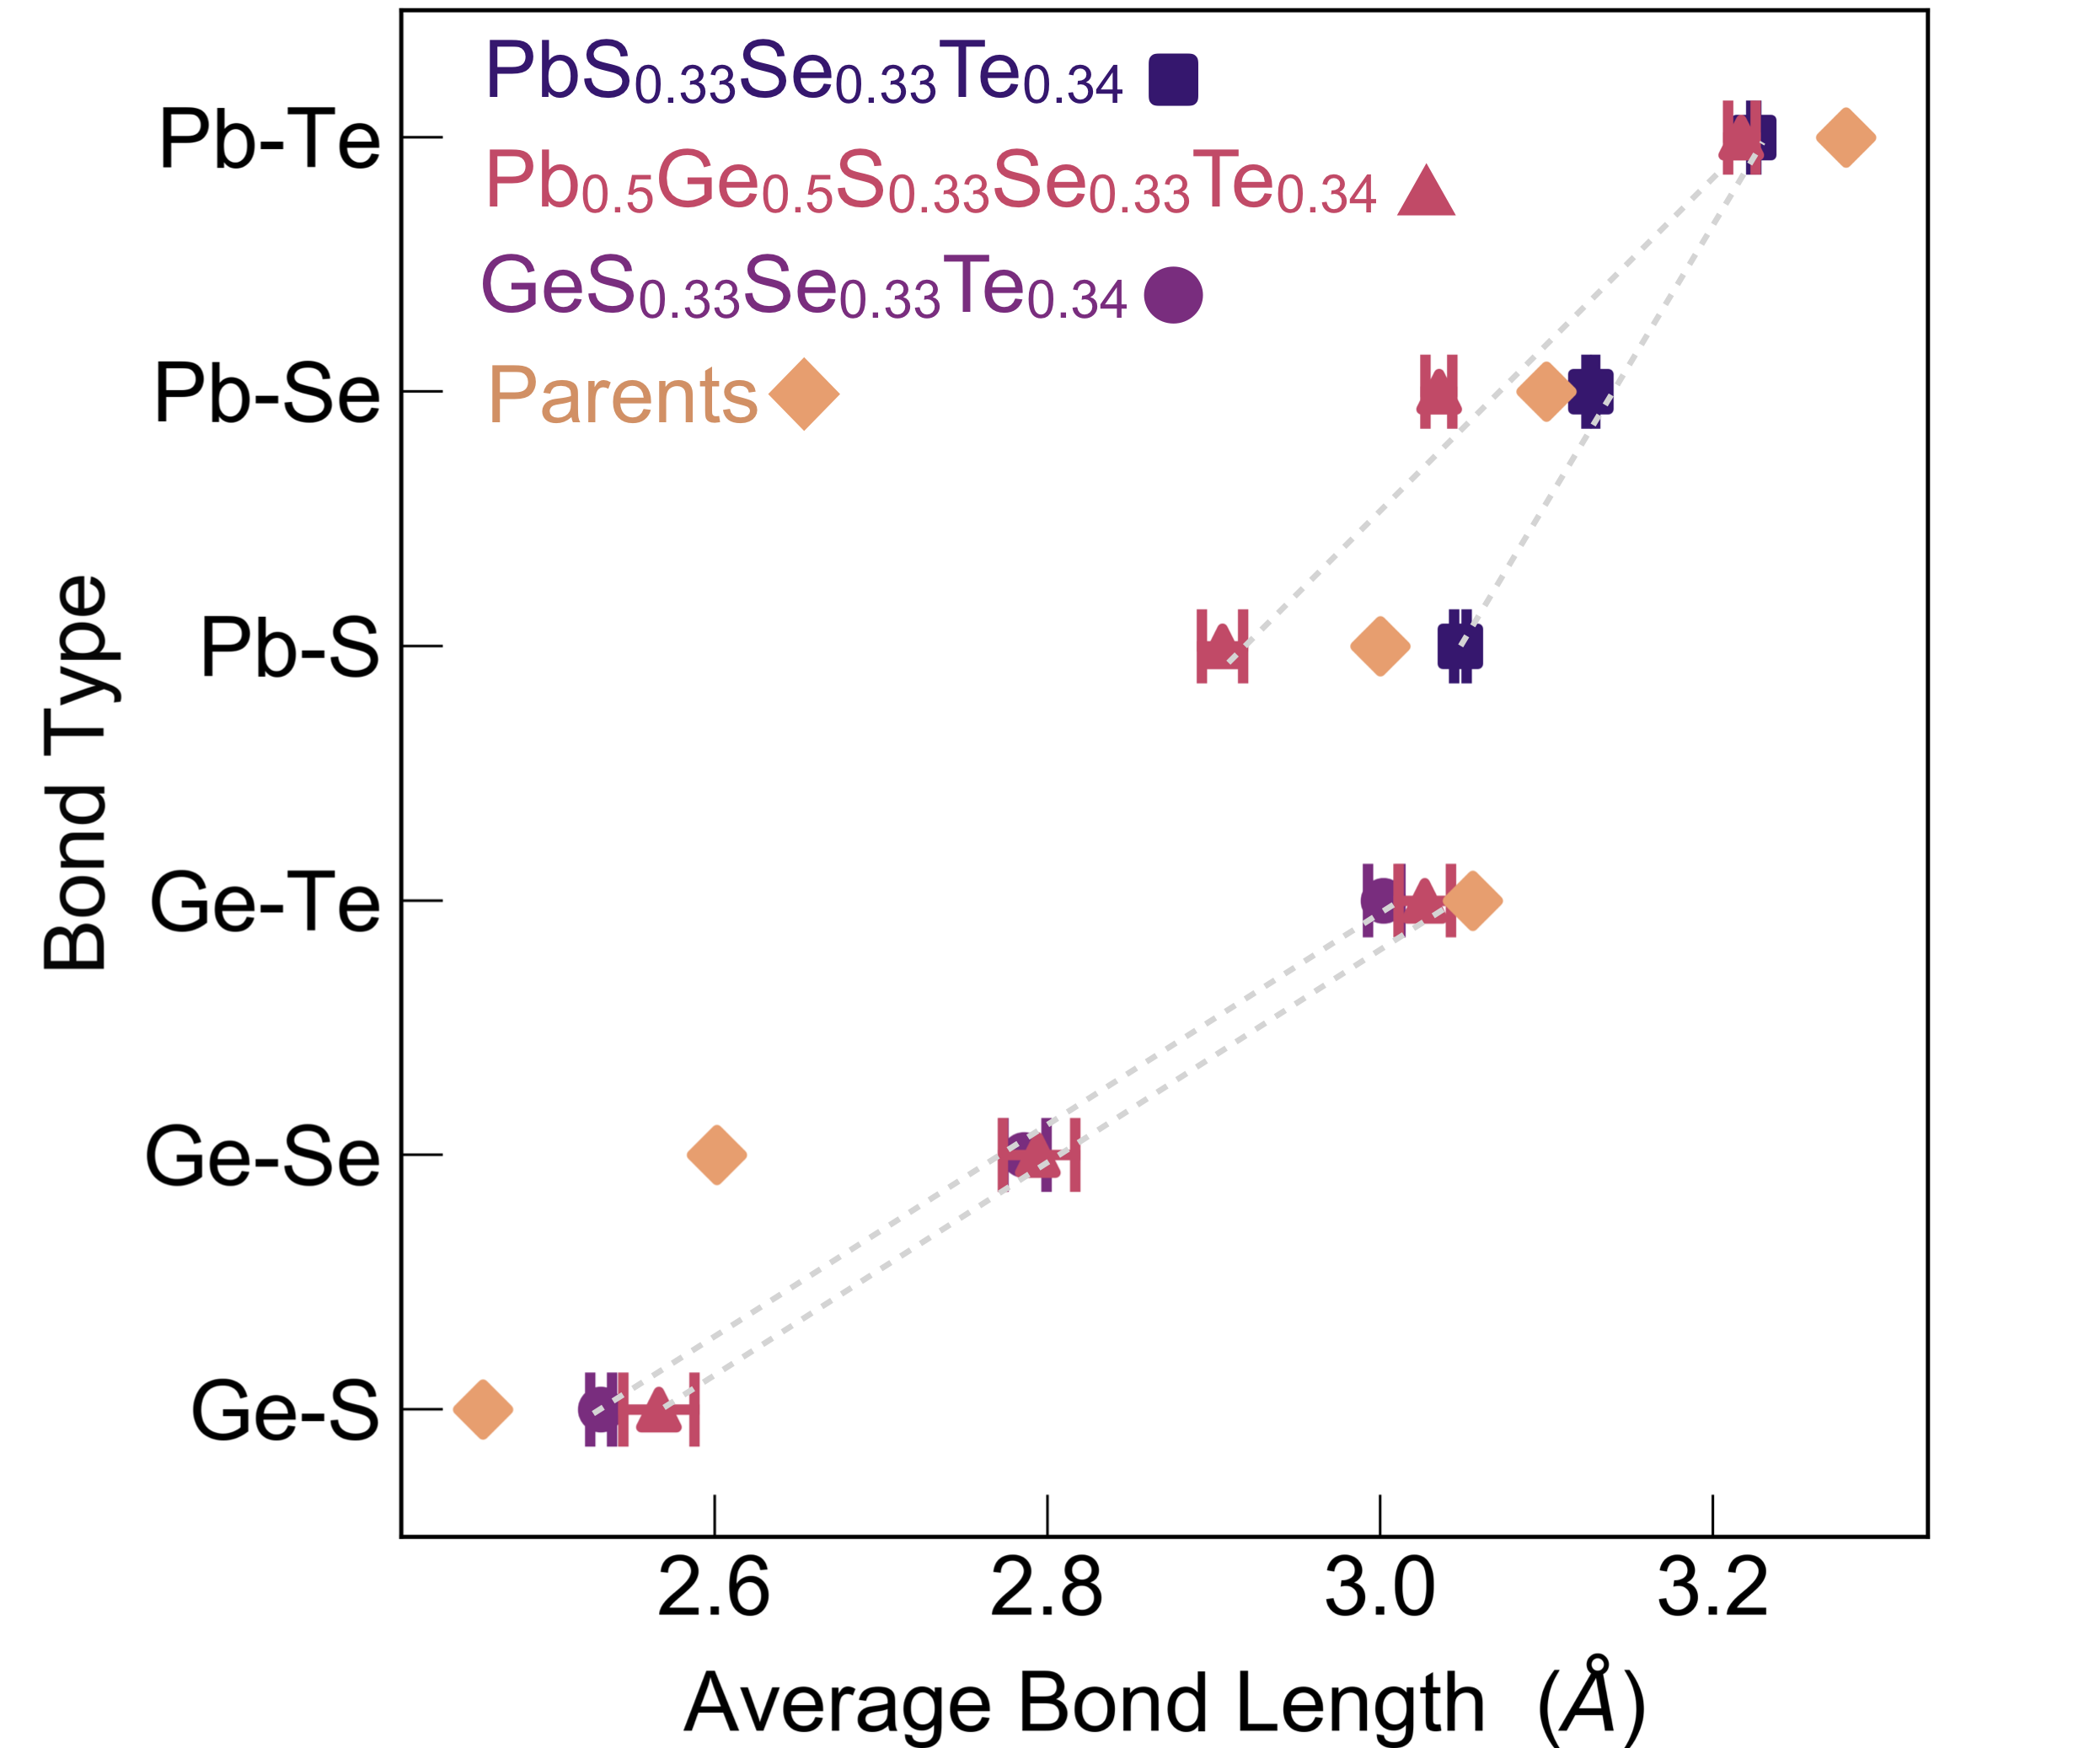
To investigate the local structure in the high-entropy alloy, Pb0.5Ge0.5S0.33Se0.33Te0.34, we consider bond lengths trends (Fig. 13) with those of the pseudo-ternaries GeS0.33Se0.33Te0.34 and PbS0.33Se0.33Te0.34 and the parent compounds. Beginning with PbS0.33Se0.33Te0.34, the Pb-X bond lengths are close to their parent bond lengths. However, the mixture of anions yields an average lattice constant that drives local strains. This strain is visible as the average Pb-Te bond distance shrinks and Pb-S bonds grow such that they are closer to the overall average bond length (3.1 Å). As this average bond length is close to that of PbSe,the Pb-Se bonds do not significantly distort. We also calculated the average coordination number of the composition to be 5.9, indicating the presence of structural deviations from the undistorted rocksalt with a coordination of 6.
A qualitatively similar trends exist with GeS0.33Se0.33Te0.34; the Ge-Te bonds slightly shrink and the other two bond types have to grow. However, the average coordination number is 4.4, indicating a significant distortion from rocksalt. This behavior can be rationalized by examining the parent structure across the Ge-chalcogenides. To start, we review structure and polymorphism in the respective parent structures. Given our algorithm for determining the first coordination shell, GeTe in the space group is found to be six-fold coordinated, and thus the plotted point is the average of its three short bonds (2.85 Å) and three long bonds (3.26 Å). We note that the trend in bond length for the Ge-X compounds is very consistent with the Pb-X compounds if only the short Ge-Te bond is considered in Fig. 13. This strong distortion can be viewed through the lens of thermodynamics; namely, the structure is 34 meV/f.u. higher in energy than the rocksalt polymorph. GeSe and GeS () show up as being three-fold coordinated and their rocksalt polymorphs are 20 and 108 meV/f.u. Given the above information about the three parents, it is reasonable that even though the Ge atoms start out octahedrally coordinated in GeS0.33Se0.33Te0.34, they relax locally such that their coordination number is significantly reduced.
With this understanding of the Pb- and Ge-based pseudo-ternary alloys, the behavior of Pb0.5GeS0.33Se0.33Te0.34 can be rationalized. The average coordination number is 4.3 within this alloy and is these broken bonds are evenly distributed between Ge and Pb; this is quite low given the nearly perfect octahedral coordination found in PbS0.33Se0.33Te0.34. The average bond length in this compound is 3.0 Å; this leads to a shrinking of the Pb-S and Pb-Se bond lengths. In contrast, the distribution of Pb-Te bond lengths are relatively unaffected by the addition of Ge at high concentrations. Considering the Ge-X bonds within Pb0.5Ge0.5S0.33Se0.33Te0.34, the addition of Pb is largely inconsequential. The average coordination number is 4.2 and and the bond lengths are consistent with the GeS0.33Se0.33Te0.34 pseudoternary.
It is intriguing that despite the large structural distortions away from the Pb-chalcogenide parents, Pb0.5Ge0.5S0.33Se0.33Te0.34 is on the free energy convex hull at 700 K. The result is a testament to the magnitude of stabilization that is possible from entropy, and the interesting structures that entropy stabilization enable.
IV Discussion
Having demonstrated the utility of this method in a variety of alloy spaces, here we review the strengths, identify persistent challenges, and highlight opportunities for expanding upon the current work. Broadly, we try to position this method in between two extremes for simulating alloys–using a single large supercell like SQS, and completely sampling small supercells, as has been done with other implentations of the independent cell approximation [20, 22]. Working within the independent cell approximation allows for the evaluation of ensemble properties as a function of synthesis temperature. By employing random sampling, we are able to evaluate larger, more disordered supercells in a computationally efficient manner. Using these supercells allows for an in-depth evaluation of the local structure, all as a function of synthesis temperature. Lastly, random sampling provides the basis for effectively navigating the computational trade-offs between precision and computational cost; from the Central Limit Theorem, we derive the relationship between precision and the number of additional samples. Doing so allows for a judicious use of computational resources in exploring composition space. Furthermore, having the ability to trade off between cost and uncertainty can be leveraged in optimal experimental design [64] and Bayesian optimization methods [65].
Nevertheless, effective use of this method requires care. It is important to be aware of polymorphism in alloys and rare configurational ground states that might not be found using limited random sampling. Furthermore, any thermodynamic methodology will suffer from the fact that there could be competing stoichiometries that push compositions off the hull.
Polymorphism. In the efforts herein, the polymorphic competition for the parent binaries is between three phases (rocksalt, –a rhomboheral perturbation, and the more significant distortion). Within DFT relaxations, we have found continuous transitions between these structure-types and the ergodic hypothesis is thus generally satisfied. However, caution must be taken in initializing heterostructural alloys where the parents have different ground state structures without continuous transitions between them (e.g., zincblende and rocksalt). Here, relaxations in DFT may only capture the local ground state structure-type and miss the global ground state. Testing the sensitivity to starting lattice choice is, in these cases, critical. Further, post hoc grouping of the resulting structures based on space group and local coordination is needed to avoid incorrectly assuming ergodicity between all sampled structure-types [26, 25]. Another method for comparing free energies of various structure-types is to start with amorphous structures rather than known crystalline prototypes, and conduct structural relaxations, as we have done in various other works [26, 25]. This approach provides insight into the basins of attraction for these polymorphs and makes no assumptions about structure-type.
Sampling Limitations. In importance sampling, the target probability distribution is not directly accessible; in our case, this would be the probability of any specific configuration occurring. Instead, we randomly sample from a uniform distribution of configurations; in the event that the true probability distribution is close to random, then our method will converge with relatively less samples than a highly non-uniform distribution [66]. In the high-temperature limit, the true probability distribution is uniform, and at the temperatures of interest for our systems, the probability distribution is nearly uniform. As such, random sampling is an effective method to assemble an ensemble. For systems equilibrated at low temperature, or have strong ordering tendencies, a larger number of samples will be required to accurately represent the distribution. Importantly, there are two sources of error. The first is due to incompletely sampling from a distribution of configurations, and the second is due to sampling from an erroneous distribution. The Central Limit Theorem allows for the evaluation of the first source of error, but not the second. Thus, the Central Limit Theorem may offer misleading guidance with respect to convergence in this situation.
The challenge of highly non-uniform distributions can be addressed in a multitude of ways. First, complete sampling using small supercells can be used to partially mitigate this risk. Second, Monte Carlo (MC) can be used to sample from an approximate distribution that more closely resembles the true distribution [67, 13, 14, 15]. MC inherently requires discarding a portion of the overall calculations, and thus requires a model Hamiltonian to make the computational cost accessible. This second point underlines how the independent supercell approach is not antithetical to model Hamiltonian-based techniques; indeed, pairing these approaches would allow for efficient sampling from highly non-uniform distributions.
V Conclusion
Evaluating the stability and structure across high dimensional alloy space is fundamental to future high throughput searches for high performing alloys. In this work, we implemented the independent supercell approximation, allowing for the calculation of the thermodynamics and structure of disordered alloys. Applying this method to the (Pb,Ge)(S,Se,Te) composition space and sub-spaces therein, we predicted phase diagrams consistent with prior experimental literature, and make novel predictions concerning the local structure. Consideration of the convex hull reveals that some high entropy compositions (e.g. Pb0.5Ge0.5S0.33Se0.33Te0.34, Pb0.5Ge0.5S0.16Se0.67Te0.17) are stable at high temperatures despite their highly distorted structure and large . The presented method can also be extended to ensemble properties, as initially demonstrated by the consideration of the PbSe0.5Te0.5 bulk modulus.
VI Acknowledgements
This material is based upon work supported by the National Science Foundation under Grant No. 1729594. V.S. acknowledges support of the National Science Foundation under Grant No. 1945010. E.T. acknowledges the support of the National Science Foundation under Grant No. 1940199 and 2118201. R.G. also recognizes the support of the National Science Foundation under Grant No. 1940224. The use of the Colorado School of Mines’s computing resources is gratefully acknowledged.
References
- Schnepf et al. [2020] R. R. Schnepf, J. J. Cordell, M. B. Tellekamp, C. L. Melamed, A. L. Greenaway, A. Mis, G. L. Brennecka, S. Christensen, G. J. Tucker, E. S. Toberer, S. Lany, and A. C. Tamboli, Utilizing site disorder in the development of new energy-relevant semiconductors, ACS Energy Letters 5, 2027 (2020).
- King et al. [2007] R. King, a. Law, K. Edmondson, C. Fetzer, G. Kinsey, H. Yoon, R. Sherif, and N. Karam, 40% efficient metamorphic gainp/ gainas/ ge multijunction solar cells, Applied physics letters 90, 183516 (2007).
- Geisz et al. [2020] J. F. Geisz, R. M. France, K. L. Schulte, M. A. Steiner, A. G. Norman, H. L. Guthrey, M. R. Young, T. Song, and T. Moriarty, Six-junction iii–v solar cells with 47.1% conversion efficiency under 143 suns concentration, Nature energy 5, 326 (2020).
- Witting et al. [2019] I. T. Witting, T. C. Chasapis, F. Ricci, M. Peters, N. A. Heinz, G. Hautier, and G. J. Snyder, The thermoelectric properties of bismuth telluride, Adv. Electron. Mater. 5, 1800904 (2019).
- Oses et al. [2020] C. Oses, C. Toher, and S. Curtarolo, High-entropy ceramics, Nature Reviews Materials 5, 295 (2020).
- Zunger et al. [1990] A. Zunger, S.-H. Wei, L. Ferreira, and J. E. Bernard, Special quasirandom structures, Physical review letters 65, 353 (1990).
- Ferreira et al. [1989] L. Ferreira, S.-H. Wei, and A. Zunger, First-principles calculation of alloy phase diagrams: The renormalized-interaction approach, Physical Review B 40, 3197 (1989).
- Jiang and Uberuaga [2016] C. Jiang and B. P. Uberuaga, Efficient ab initio modeling of random multicomponent alloys, Physical review letters 116, 105501 (2016).
- Pomrehn et al. [2011] G. S. Pomrehn, E. S. Toberer, G. J. Snyder, and A. Van De Walle, Entropic stabilization and retrograde solubility in zn 4 sb 3, Physical Review B 83, 094106 (2011).
- Biswas and Lany [2009] K. Biswas and S. Lany, Energetics of quaternary iii-v alloys described by incorporation and clustering of impurities, Physical Review B 80, 115206 (2009).
- Keen and Goodwin [2015] D. A. Keen and A. L. Goodwin, The crystallography of correlated disorder, Nature 521, 303 (2015).
- Simonov and Goodwin [2020] A. Simonov and A. L. Goodwin, Designing disorder into crystalline materials, Nature Reviews Chemistry 4, 657 (2020).
- Cordell et al. [2021] J. J. Cordell, J. Pan, A. C. Tamboli, G. J. Tucker, and S. Lany, Probing configurational disorder in zngen 2 using cluster-based monte carlo, Physical Review Materials 5, 024604 (2021).
- Wolverton et al. [1998] C. Wolverton, V. Ozoliņš, and A. Zunger, First-principles theory of short-range order in size-mismatched metal alloys: Cu-au, cu-ag, and ni-au, Physical Review B 57, 4332 (1998).
- van de Walle and Ceder [2002] A. van de Walle and G. Ceder, Automating first-principles phase diagram calculations, Journal of Phase Equilibria 23, 348 (2002).
- Zunger and Jaffe [1983] A. Zunger and J. Jaffe, Structural origin of optical bowing in semiconductor alloys, Physical Review Letters 51, 662 (1983).
- Ortiz et al. [2015] B. R. Ortiz, H. Peng, A. Lopez, P. A. Parilla, S. Lany, and E. S. Toberer, Effect of extended strain fields on point defect phonon scattering in thermoelectric materials, Physical Chemistry Chemical Physics 17, 19410 (2015).
- Gurunathan et al. [2020] R. Gurunathan, R. Hanus, and G. J. Snyder, Alloy scattering of phonons, Materials Horizons 7, 1452 (2020).
- Gurunathan et al. [2022] R. Gurunathan, S. Sarker, C. K. Borg, J. Saal, L. Ward, A. Mehta, and G. J. Snyder, Mapping thermoelectric transport in a multicomponent alloy space, arXiv preprint arXiv:2205.01520 (2022).
- Yang et al. [2016] K. Yang, C. Oses, and S. Curtarolo, Modeling off-stoichiometry materials with a high-throughput ab-initio approach, Chemistry of Materials 28, 6484 (2016).
- Lederer et al. [2018] Y. Lederer, C. Toher, K. S. Vecchio, and S. Curtarolo, The search for high entropy alloys: a high-throughput ab-initio approach, Acta Materialia 159, 364 (2018).
- Sarker et al. [2018] P. Sarker, T. Harrington, C. Toher, C. Oses, M. Samiee, J.-P. Maria, D. W. Brenner, K. S. Vecchio, and S. Curtarolo, High-entropy high-hardness metal carbides discovered by entropy descriptors, Nature communications 9, 1 (2018).
- Woods-Robinson et al. [2022] R. Woods-Robinson, V. Stevanović, S. Lany, K. N. Heinselman, M. K. Horton, K. A. Persson, and A. Zakutayev, Role of disorder in the synthesis of metastable zinc zirconium nitrides, Physical Review Materials 6, 043804 (2022).
- Gorai et al. [2016] P. Gorai, E. S. Toberer, and V. Stevanović, Thermoelectricity in transition metal compounds: the role of spin disorder, Physical Chemistry Chemical Physics 18, 31777 (2016).
- Stevanović [2016] V. Stevanović, Sampling polymorphs of ionic solids using random superlattices, Physical Review Letters 116, 075503 (2016).
- Jones and Stevanović [2017] E. B. Jones and V. Stevanović, Polymorphism in elemental silicon: Probabilistic interpretation of the realizability of metastable structures, Physical Review B 96, 184101 (2017).
- Therrien et al. [2021] F. Therrien, E. B. Jones, and V. Stevanović, Metastable materials discovery in the age of large-scale computation, Applied Physics Reviews 8, 031310 (2021).
- Jones and Stevanović [2020] E. B. Jones and V. Stevanović, The glassy solid as a statistical ensemble of crystalline microstates, npj Computational Materials 6, 1 (2020).
- Perim et al. [2016] E. Perim, D. Lee, Y. Liu, C. Toher, P. Gong, Y. Li, W. N. Simmons, O. Levy, J. J. Vlassak, J. Schroers, and S. Curtarolo, Spectral descriptors for bulk metallic glasses based on the thermodynamics of competing crystalline phases, Nature communications 7, 1 (2016).
- Kwak and Kim [2017] S. G. Kwak and J. H. Kim, Central limit theorem: the cornerstone of modern statistics, Korean journal of anesthesiology 70, 144 (2017).
- Fischer [2011] H. Fischer, A history of the central limit theorem: from classical to modern probability theory (Springer, 2011).
- Hart and Forcade [2008] G. L. Hart and R. W. Forcade, Algorithm for generating derivative structures, Physical Review B 77, 224115 (2008).
- Kresse and Furthmüller [1996] G. Kresse and J. Furthmüller, Comput. Mater. Sci. 6, 15 (1996).
- d’Avezac et al. [2010] M. d’Avezac, P. Graf, T. Paudal, H. Peng, L. Zhang, S. Stephen, and V. Stevanovic, Pylada: a comprehensive python framework for preparing, running, monitoring, analyzing, and archiving high throughput first principles calculations, GitHub repository (2010).
- Esters et al. [2021] M. Esters, C. Oses, D. Hicks, M. J. Mehl, M. Jahnátek, M. D. Hossain, J.-P. Maria, D. W. Brenner, C. Toher, and S. Curtarolo, Settling the matter of the role of vibrations in the stability of high-entropy carbides, Nature communications 12, 1 (2021).
- Islam [2018] M. R. Islam, Sample size and its role in central limit theorem (clt), Computational and Applied Mathematics Journal 4, 1 (2018).
- Mendez [1991] H. Mendez, Understanding the central limit theorem (University of California, Santa Barbara, 1991).
- Perdew et al. [1996] J. P. Perdew, K. Burke, and M. Ernzerhof, Generalized gradient approximation made simple, Phys. Rev. Lett. 77, 3865 (1996).
- Blöchl [1994] P. E. Blöchl, Projector augmented-wave method, Phys. Rev. B 50, 17953 (1994).
- Van de Walle et al. [2013] A. Van de Walle, P. Tiwary, M. De Jong, D. Olmsted, M. Asta, A. Dick, D. Shin, Y. Wang, L.-Q. Chen, and Z.-K. Liu, Efficient stochastic generation of special quasirandom structures, Calphad 42, 13 (2013).
- Birch [1947] F. Birch, Finite elastic strain of cubic crystals, Physical review 71, 809 (1947).
- Murnaghan [1944] F. D. Murnaghan, The compressibility of media under extreme pressures, Proceedings of the National Academy of Sciences 30, 244 (1944).
- Reuß [1929] A. Reuß, Berechnung der fließgrenze von mischkristallen auf grund der plastizitätsbedingung für einkristalle., ZAMM-Journal of Applied Mathematics and Mechanics/Zeitschrift für Angewandte Mathematik und Mechanik 9, 49 (1929).
- Peterson et al. [2001] P. F. Peterson, T. Proffen, I.-K. Jeong, S. J. Billinge, K.-S. Choi, M. G. Kanatzidis, and P. G. Radaelli, Local atomic strain in znse 1- x te x from high real-space resolution neutron pair distribution function measurements, Physical Review B 63, 165211 (2001).
- Doak and Wolverton [2012] J. W. Doak and C. Wolverton, Coherent and incoherent phase stabilities of thermoelectric rocksalt iv-vi semiconductor alloys, Physical Review B 86, 144202 (2012).
- Ortiz et al. [2019] B. R. Ortiz, J. M. Adamczyk, K. Gordiz, T. Braden, and E. S. Toberer, Towards the high-throughput synthesis of bulk materials: thermoelectric pbte–pbse–snte–snse alloys, Molecular Systems Design & Engineering 4, 407 (2019).
- Liu and Chang [1994] H. Liu and L. Chang, Phase relations in the system pbs-pbse-pbte, Mineralogical Magazine 58, 567 (1994).
- Zhang et al. [2012] Q. Zhang, F. Cao, W. Liu, K. Lukas, B. Yu, S. Chen, C. Opeil, D. Broido, G. Chen, and Z. Ren, Heavy doping and band engineering by potassium to improve the thermoelectric figure of merit in p-type pbte, pbse, and pbte1–y se y, Journal of the American chemical society 134, 10031 (2012).
- Hume-Rothery and Powell [1935] W. Hume-Rothery and H. M. Powell, On the theory of super-lattice structures in alloys, Zeitschrift für Kristallographie-Crystalline Materials 91, 23 (1935).
- Usanmaz et al. [2016] D. Usanmaz, P. Nath, J. J. Plata, G. L. Hart, I. Takeuchi, M. B. Nardelli, M. Fornari, and S. Curtarolo, First principles thermodynamical modeling of the binodal and spinodal curves in lead chalcogenides, Physical Chemistry Chemical Physics 18, 5005 (2016).
- Shannon [1976] R. D. Shannon, Revised effective ionic radii and systematic studies of interatomic distances in halides and chalcogenides, Acta crystallographica section A: crystal physics, diffraction, theoretical and general crystallography 32, 751 (1976).
- Bissert and Hesse [1978] G. Bissert and K.-F. Hesse, Verfeinerung der struktur von germanium (ii)-sulfid, ges, Acta Crystallographica Section B: Structural Crystallography and Crystal Chemistry 34, 1322 (1978).
- Murgatroyd et al. [2020] P. A. Murgatroyd, M. J. Smiles, C. N. Savory, T. P. Shalvey, J. E. Swallow, N. Fleck, C. M. Robertson, F. Jackel, J. Alaria, J. D. Major, D. O. Scanlon, and T. D. Veal, Gese: optical spectroscopy and theoretical study of a van der waals solar absorber, Chemistry of Materials 32, 3245 (2020).
- Samanta et al. [2019] M. Samanta, T. Ghosh, R. Arora, U. V. Waghmare, and K. Biswas, Realization of both n-and p-type gete thermoelectrics: electronic structure modulation by agbise2 alloying, Journal of the American Chemical Society 141, 19505 (2019).
- Perumal et al. [2016] S. Perumal, S. Roychowdhury, and K. Biswas, High performance thermoelectric materials and devices based on gete, Journal of Materials Chemistry C 4, 7520 (2016).
- Samanta and Biswas [2017] M. Samanta and K. Biswas, Low thermal conductivity and high thermoelectric performance in (gete) 1–2 x (gese) x (ges) x: competition between solid solution and phase separation, Journal of the American Chemical Society 139, 9382 (2017).
- Adamczyk et al. [2022] J. M. Adamczyk, F. A. Bipasha, G. A. Rome, K. Ciesielski, E. Ertekin, and E. S. Toberer, Symmetry breaking in ge 1- x mn x te and the impact on thermoelectric transport, Journal of Materials Chemistry A 10, 16468 (2022).
- Villars et al. [2006] P. Villars, H. Okamoto, and K. Cenzual, Asm alloy phase diagrams database, ASM International, Materials Park, OH, USA (2006).
- Koren et al. [1983] N. Koren, V. Kindyak, and E. Matyas, Phase diagram of the system ges-gese, physica status solidi (a) 80, K105 (1983).
- Wiedemeier and Siemers [1984] H. Wiedemeier and P. A. Siemers, The temperature—composition phase diagram of the gese—gete system, in Modern High Temperature Science (Springer, 1984) pp. 395–408.
- Magunov et al. [1992] R. Magunov, Y. V. Belyuga, and I. Magunov, The pbs-ges system, Russian journal of inorganic chemistry 37, 1345 (1992).
- Shelimova et al. [1966] L. Shelimova, N. Abrikosov, V. Zhdanova, and V. Sizov, Investigation of the pbse-gese and gese-gete systems, Izv Akad Nauk SSSR Neorgan Materialy 2, 2103 (1966).
- Yashina and Leute [2000] L. Yashina and V. Leute, The phase diagrams of the quasibinary systems (pb, ge) te and (ge, sn) te, Journal of alloys and compounds 313, 85 (2000).
- Settles [2009] B. Settles, Active learning literature survey, (2009).
- Garnett [2022] R. Garnett, Bayesian optimization (2022).
- Tokdar and Kass [2010] S. T. Tokdar and R. E. Kass, Importance sampling: a review, Wiley Interdisciplinary Reviews: Computational Statistics 2, 54 (2010).
- Wallace et al. [2019] S. K. Wallace, J. M. Frost, and A. Walsh, Atomistic insights into the order–disorder transition in cu 2 znsns 4 solar cells from monte carlo simulations, Journal of Materials Chemistry A 7, 312 (2019).