A study of oxygen-rich post-AGB stars in the Milky Way to understand the production of silicates from evolved stars
Abstract
Context. The study of post asymptotic giant branch (post-AGB) stars is a valuable tool to study still poorly known aspects of the evolution of the stars through the asymptotic giant branch (AGB). This is due to the accurate determination of their surface chemical composition and to the peculiar shape of the spectral energy distribution (SED): the emission from the central star can be easily disentangled from the contribution from the dusty shell, which can then be characterized.
Aims. The goal of the present study is to reconstruct the dust formation process and more generally the late phases of the evolution of oxygen-rich stars across the AGB phase. This is performed by studying oxygen-rich, post-AGB stars, which are analyzed in terms of their luminosity, effective temperature and infrared excess.
Methods. We study sources classified as single, oxygen-rich, post-AGB stars in the Galaxy, which exhibit a double-peaked (shell-type) SED. We use results from stellar evolution modelling combined with dust formation and radiative transfer modelling to reconstruct the late AGB phases and the initial contraction to the post-AGB phase. We also determine the mass-loss and dust formation rates for stars of different mass and chemical composition.
Results. The analysis of the IR excess of the post-AGB, oxygen-rich stars examined in this study outlines an interesting complexity, in terms of the correlation between the dust in the surroundings of the stars, the evolutionary status and the progenitor’s mass. The sources descending from massive AGBs (3 M⊙ depending on metallicity) are generally characterized by higher infrared excess than the lower mass counterparts, owing to the more intense dust formation taking place during the final AGB phases. From the determination of the location of the dusty regions we deduce that the expanding velocities of the outflow change significantly from star to star. The possibility that radiation pressure is unable to accelerate the wind in the faintest objects is also commented.
Key Words.:
stars: AGB and post-AGB – stars: abundances – stars: evolution – stars: winds and outflows1 Introduction
The stars evolving through the asymptotic giant branch (AGB) are generally regarded as one of the most important contributors of reprocessed gas of the interstellar medium. The knowledge of the AGB gas yields is crucial to reconstruct the chemical evolution of the Milky Way (Romano et al., 2010; Kobayashi et al., 2020) and the chemical patterns observed in star forming galaxies in the Local Group (Vincenzo et al., 2016). Furthermore, the winds of AGB stars are a favourable site for the production of dust, which is the reason why the dust from AGB stars accounts for a significant fraction of the overall dust budget in present day mature galaxies (Zhukovska et al., 2008; Sloan et al., 2009). The dust manufactured by AGB stars is a fundamental ingredient to study the dust content of the Milky Way (Ginolfi et al., 2018) and to model the evolution of the dust content in local and high-redshift galaxies (Nanni et al., 2020).
AGB stars are extremely complex objects, where regions which can be safely described under ideal gas conditions, such as the convective envelope, coexist with the core, composed of carbon and oxygen (or oxygen and neon for M M⊙, García-Berro, Ritossa, & Iben (1997)), where the densities are so large that the pressure is entirely provided by degenerate electrons (Busso et al., 1999; Herwig, 2005; Karakas & Lattanzio, 2014). Despite the significant steps forwards achieved in the last decades by different research teams (Cristallo et al., 2015; Karakas & Lugaro, 2016; Karakas et al., 2018, 2022; Cinquegrana & Karakas, 2022; Ventura et al., 2018, 2020, 2021), the description of the AGB phase is still severely affected by the poor knowledge of physical mechanisms, mainly convection and mass loss, which play a relevant role on the evolution of AGB stars (Ventura & D’Antona, 2005a, b).
A notable contribution towards a deeper understanding of the evolution of AGB stars is provided by the study of post-AGB stars. Indeed the surface chemical composition of post-AGB stars is a key indicator of the relative importance of the two mechanisms able to alter the surface chemistry of the stars evolving through the AGB phase, namely hot bottom burning (HBB, Blöcker & Schönberner 1991) and third dredge-up (TDU, Iben 1974). Furthermore, owing to the warmer photospheres (A-K spectral types) of post-AGB stars, their spectra are dominated by atomic transitions and provide the unique possibility for deriving accurate photospheric chemical abundances of a wide range of elements (e.g., CNO, alpha and Fe-peak elements, and s-process elements, see Kamath (2020); Kamath & Van Winckel (2022c) and references therein). On the other hand, obtaining surface abundances for a wide range of elements using AGB star spectra is challenging since they have complex and dynamical atmospheres and their spectra are severly affected by molecular bands (García-Hernández et al., 2009).
Typical examples of studies where observations of post-AGB are used to understand AGB nucleosynthesis are De Smedt et al. (2012) and Kamath et al. (2017). More recently, Kamath et al. (2022a) capitalised on the reliable distance estimates derived from Gaia EDR3/DR3 to study 31 single Galactic post-AGB stars (13 oxygen-rich with no s–process enrichment and 19 carbon-rich and s–process objects) with well-studied surface abundances and derived their luminosites - a parameter that is critical to identify the initial mass of the stars. A thorough derivation of the progenitors and of the evolutionary history of these stars was presented in Kamath et al. (2022b).
A further advantage of the study of post-AGB stars is that the spectral energy distribution (SED) exhibits a typical double-peak shape referred to as ’shell-type’ SED (van Winckel, 2003), which allows to disentangle the emission from the central object and the infrared excess due to the presence of dust in the surrounding of the star. This is extremely important to test the dust formation modelling in the winds of evolved stars, which was recently implemented into the description of the AGB phase by various research teams (Ventura et al., 2012, 2014; Nanni et al., 2013, 2014), then applied to interpret infrared (IR) observations and characterize AGB stars of the Magellanic Clouds (MC) (Dell’Agli et al., 2014a, b, 2015a, 2015b; Nanni et al., 2016, 2019b) and of Local Group galaxies (Dell’Agli et al., 2016, 2018, 2019, 2021).
The first application of this analysis has been published by Tosi et al. (2022) (hereafter Paper I), using the study of single post-AGB stars to draw information regarding the previous AGB phase. This work was focused on 13 likely single sources in the MC, classified as shell-type by Kamath et al. (2014, 2015), who provided the effective temperatures, the metallicities, and a detailed reconstruction of the SED. The comparison with results from AGB evolution and dust formation modelling allowed to characterize the individual sources presented in Kamath et al. (2014, 2015) in terms of mass and formation epoch of the progenitors, and to draw interesting conclusions on the mass loss rates experienced by stars during the final AGB phases and on the dynamics of the outflow.
In the present work we apply the methodology proposed in Paper I to study the 13 oxygen-rich objects in the sample by Kamath et al. (2022a). This will allow a more exhaustive investigation of the evolutionary properties of the stars that do not become carbon stars with respect to Paper I. Indeed, the 5 Large Magellanic Clouds (LMC) oxygen-rich stars without any s-process enrichment investigated in Paper I were substantially homogeneous in terms of luminosity and optical depth. The interpretation given in Paper I was that they are the progeny of low-mass stars that experienced no or only a few TDU episodes, which prevented any significant s-process enrichment and the possibility to reach the carbon-star stage. On the other hand, the Galactic non s-process enriched sources presented in Kamath et al. (2022a) exhibit a diversity ranging from those with large IR excesses to those without significant circumstellar dust. Moreover, compared to the LMC sample presented in Paper I, the luminosity range of the target stars in this study are much more extended (see Kamath et al. (2022a)).
The Paper is structured as follows: the methodology followed to characterize the individual sources examined is explained in Section 2; the classification of the stars in the sample and of the dust in their surroundings is given in Section 3, while Section 4 is dedicated to the discussion of the dynamical properties of the outflow and on the differences found with respect to carbon stars; finally, the conclusions are given in Section 5.
2 The methodology to characterize the individual sources
We selected the 13 oxygen-rich post-AGB stars presented by Kamath et al. (2022a). We applied the same approach used in Paper I to discuss and characterize the post-AGB stars in the MC. This methodology can be summarized and divided into 3 steps:
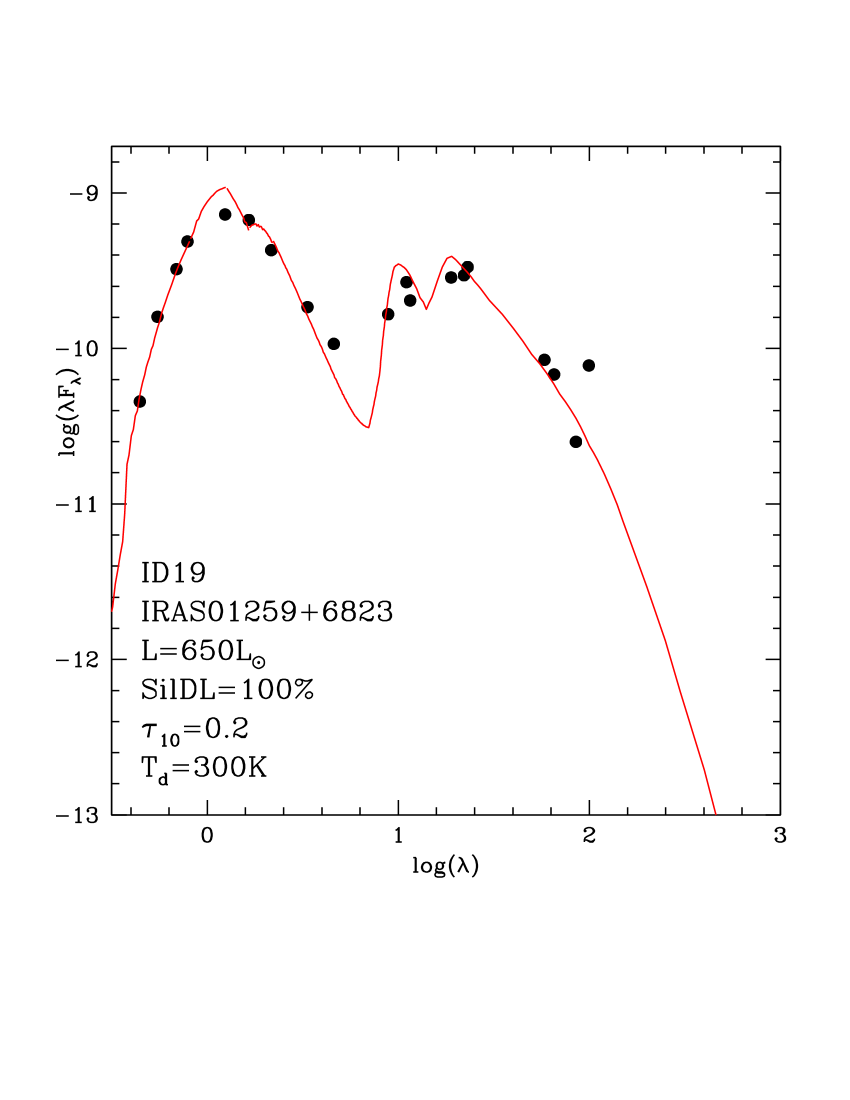
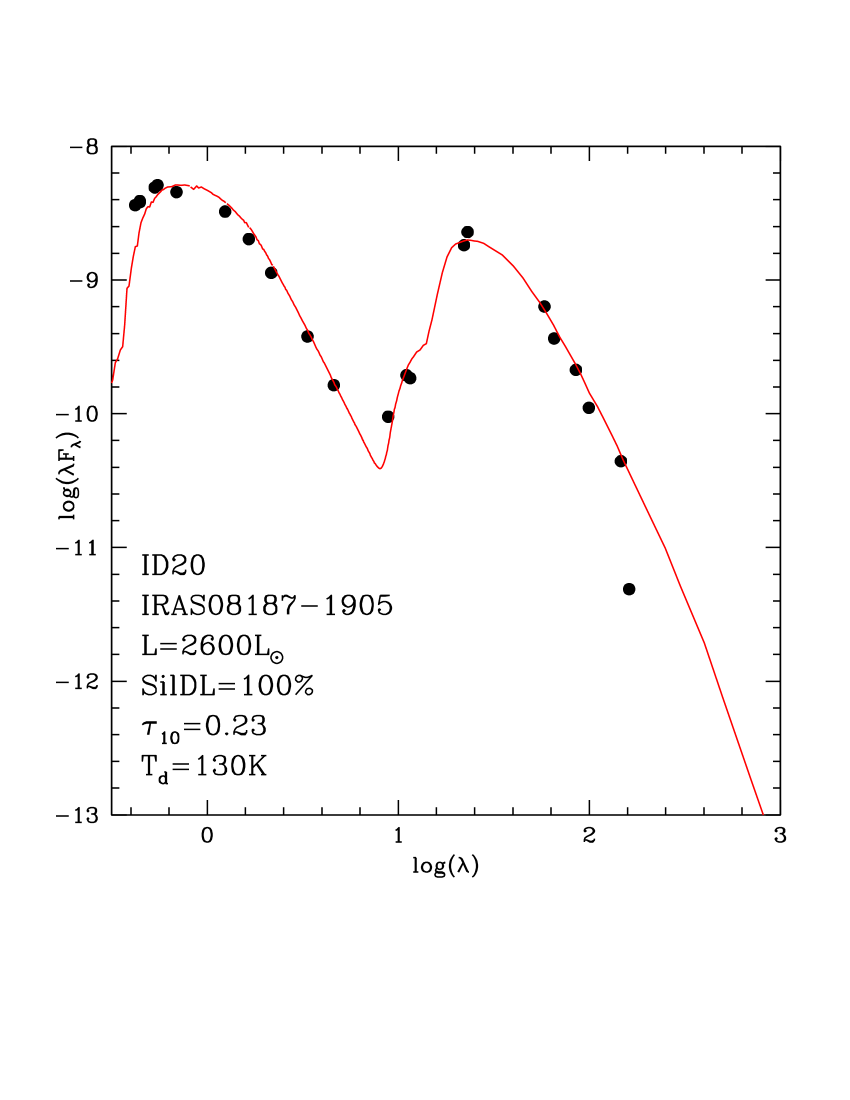
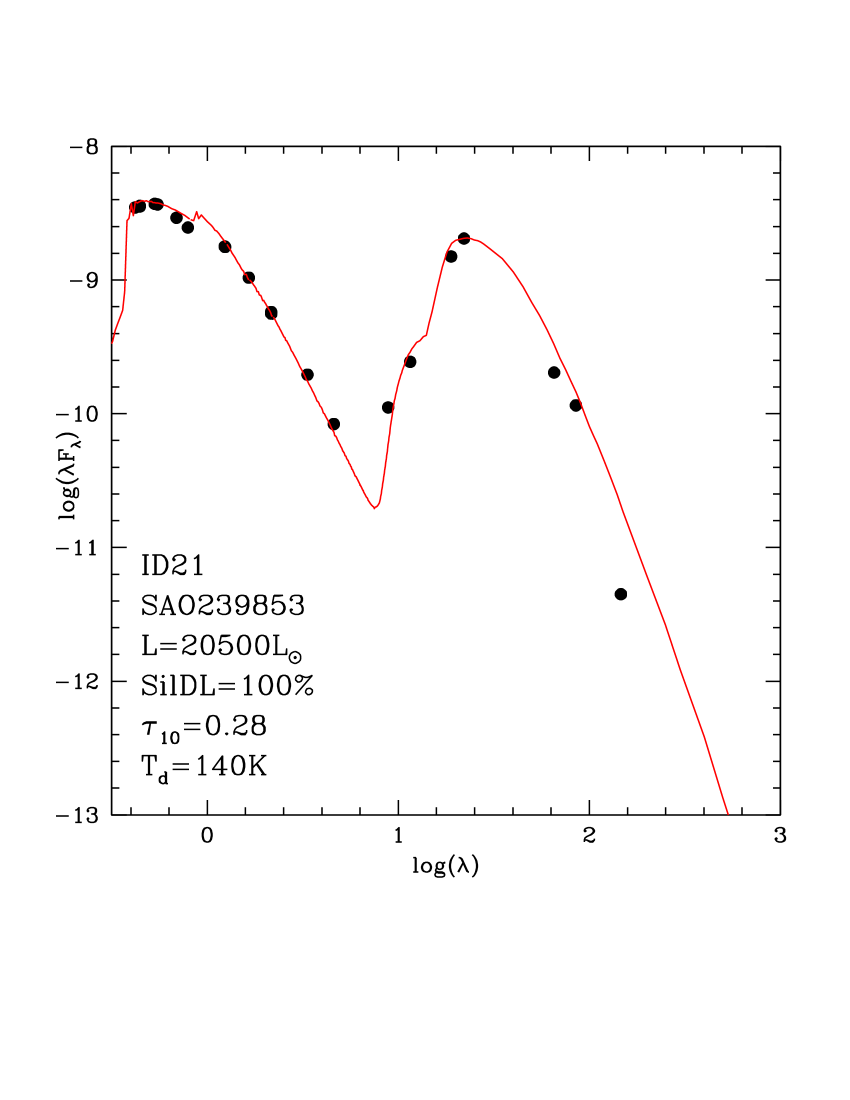
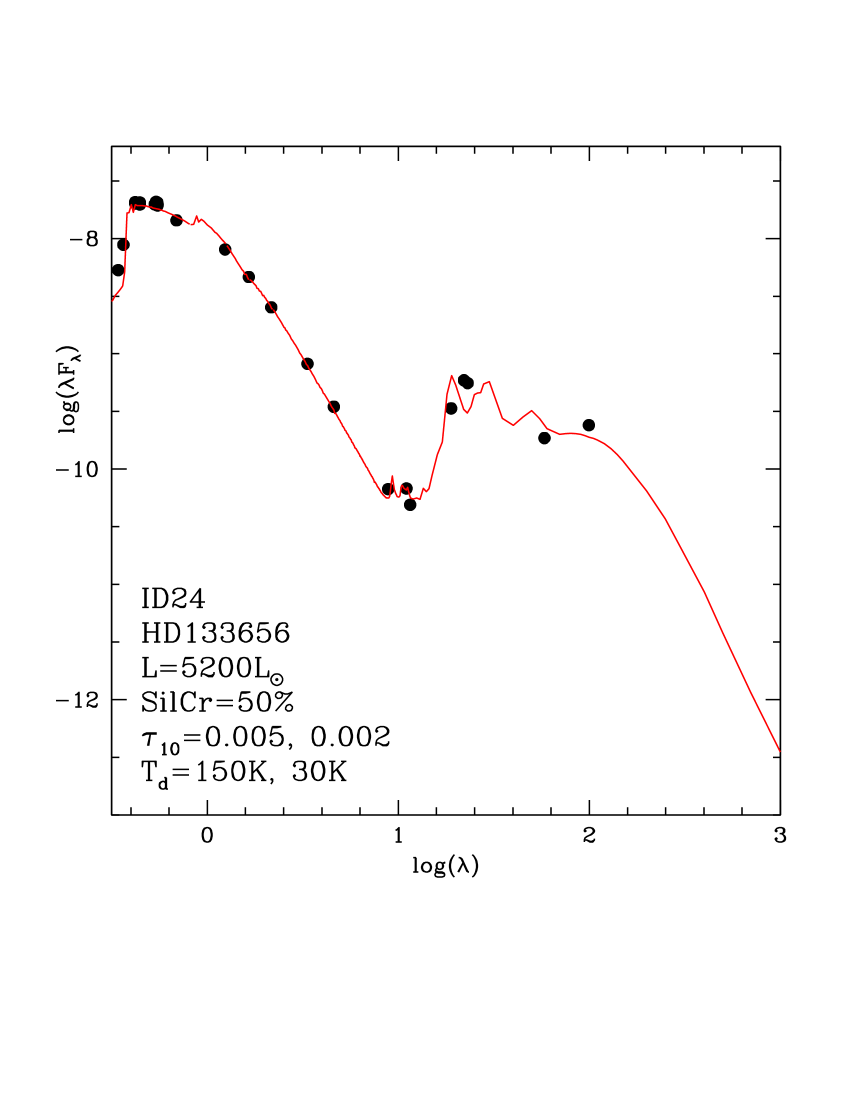
a) The SED of each source is constructed on the basis of the photometric data collected by Kamath et al. (2022a) and considering the Infrared Space Observatory (ISO) spectrum (Sloan et al., 2003), when available. SED fitting is achieved by means of the radiative transfer code DUSTY (Nenkova et al., 1999), starting from the effective temperatures given in Kamath et al. (2022a). DUSTY is used in the spherical modality, with the gas density declining with distance as . The determination of the main physical parameters is eased by the peculiar morphology of the SED of these objects. Indeed, this procedure leads to the determination of the optical depth at m, (mainly related to the height of the peak of the SED in the mid-IR) and of , the dust temperature connected to the depth of the minimum of the SED separating the dust IR excess to the emission from the central object. Note that is tightly correlated to the distance of the inner border of the dusty zone, , from the centre of the star. Typical uncertainties associated to these estimates are in and K for . The distribution of the IR data provides indication on the presence of a pure amorphous silicate dust composition (optical constants from Draine & Lee (1984), DL hereafter) or whether a percentage of crystalline silicates (optical constants from Jaeger et al. (1994)) is present.
b) To identify the progenitor’s mass we use the evolutionary tracks of stars of different mass and metallicities calculated by means of the ATON code for stellar evolution (Ventura et al., 1998), thoroughly discussed in Kamath et al. (2022b). To this aim we compare the position of the tracks on the HR diagram with the effective temperatures and the luminosities of the individual sources. We use the metallicity and the effective temperatures given in Kamath et al. (2022a). Regarding the luminosities, we note that unlike Paper I, focussing on MC sources, here it is required to adopt a distance for each object, within the range given by Bailer-Jones et al. (2021), which reflects into an uncertainty on the luminosity, as found by Kamath et al. (2022a) (see Tab. 1 in the latter paper). The choice of the distance (still within the limits mentioned above) is done by looking for consistency between the whole observational framework of the individual stars (surface chemical abundances and dust mineralogy) and the results from stellar evolution and dust formation modelling. We note that the accuracy with which the distance is known sets a natural discrimination between the stars labeled as Q1 (RUWE111The RUWE is the Renormalized Unit Weight Error, which is defined as the magnitude and colour-renormalized square root of the reduced chi-squared statistic to the Gaia astrometric fit (Lindegren et al., 2021). A value of RUWE ¡ 1.4 is often employed to select stars with accurate parallaxes and proper motions, while larger values could be a sign of binarity and, in general, of a poor astrometric fit (e.g. Belokurov et al., 2020; Penoyre et al., 2020). 1.4) in Kamath et al. (2022a), on which we will base most of our interpretation, and those flagged as Q2 (RUWE 1.4), whose distances are much more uncertain, which reflects into a poor determination of the luminosities.
c) To connect the properties of the dust responsible for the IR excess nowadays observed with the dust production process during the previous AGB and early post-AGB phases, we modelled dust formation at the tip of the AGB phase (by which we mean the stage when the contraction to the post-AGB phase begins), and during some evolutionary stages distributed along the post-AGB phase. This step is intended to look for consistency between the results from stellar evolution plus dust formation modelling and the observations, and to understand when the dust currently observed was released (see Section 5 in Paper I for more details). Dust formation was modelled according to Ventura et al. (2012, 2014), following the schematization proposed by the Heidelberg group (Ferrarotti & Gail, 2006). The input to describe dust formation, namely mass, effective temperature, mass loss rate and surface chemical composition of the star, were taken from the results of stellar evolution modelling. Because we are studying oxygen-rich stars only, the dust species considered are silicates (both in amorphous and crystalline form) and alumina dust (Ferrarotti & Gail, 2006).
3 The dust properties of oxygen-rich Galactic post-AGB stars
| Source | ID | FeH | [K] | [K] | flag | ||||
| IRAS 01259+6823 | 19 | 5510 | 650 | 220 – 646 | 0.2 | 300 | Q1 | ||
| IRAS 08187–1905 | 20 | 5772 | 2600 | 2099 – 3286 | 0.23 | 130 | Q2 | ||
| SAO 239853 | 21 | 7452 | 20500 | 13080 – 48520 | 0.28 | 140 | Q2 | ||
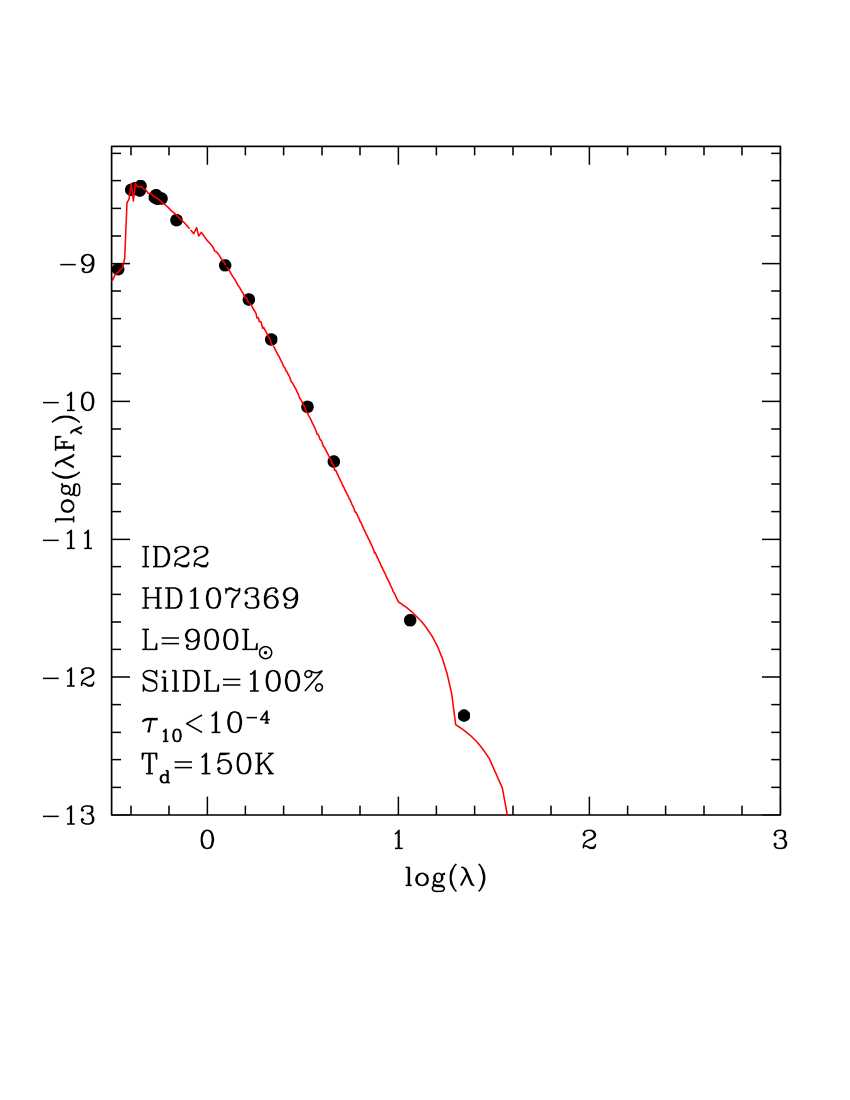
| HD 107369 | 22 | 7533 | 900 | 814 – 1010 | 150 | – | Q1 | ||
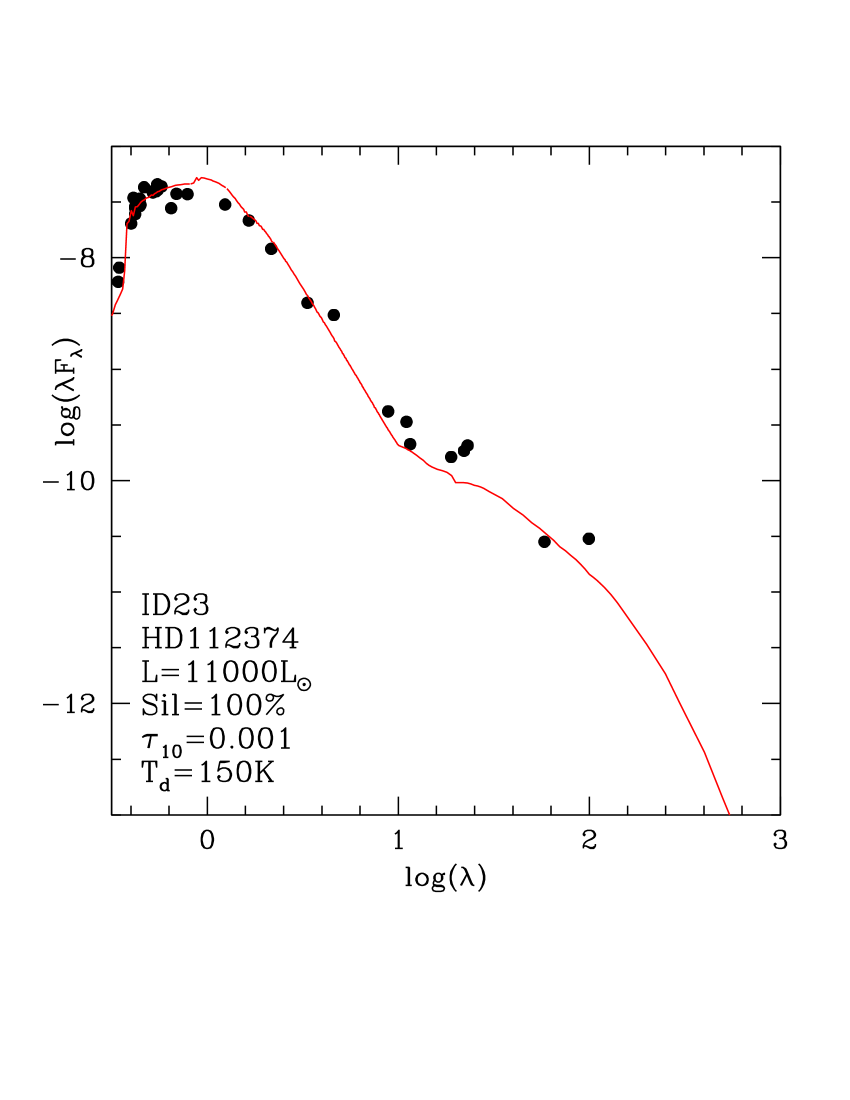
| HD 112374 | 23 | 6393 | 11000 | 9961 – 11882 | 150 | Q1 | |||
| HD 133656 | 24 | 8238 | 5200 | 4861 – 5690 | 0.005 | 150 | Q1 | ||
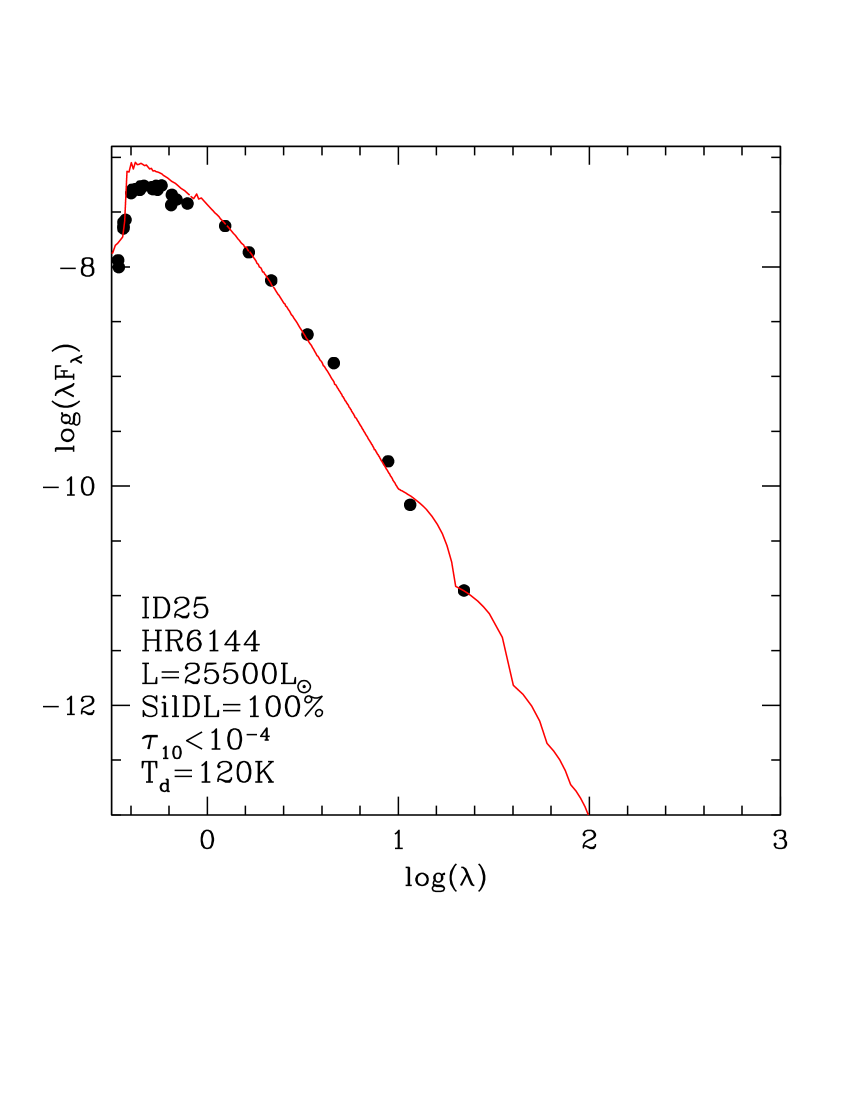
| HR 6144 | 25 | 6728 | 25500 | 22212 – 30419 | 120 | – | Q1 | ||
| HD 161796 | 26 | 6139 | 8000 | 5209 – 6322 | 0.3 | 130 | Q1 | ||
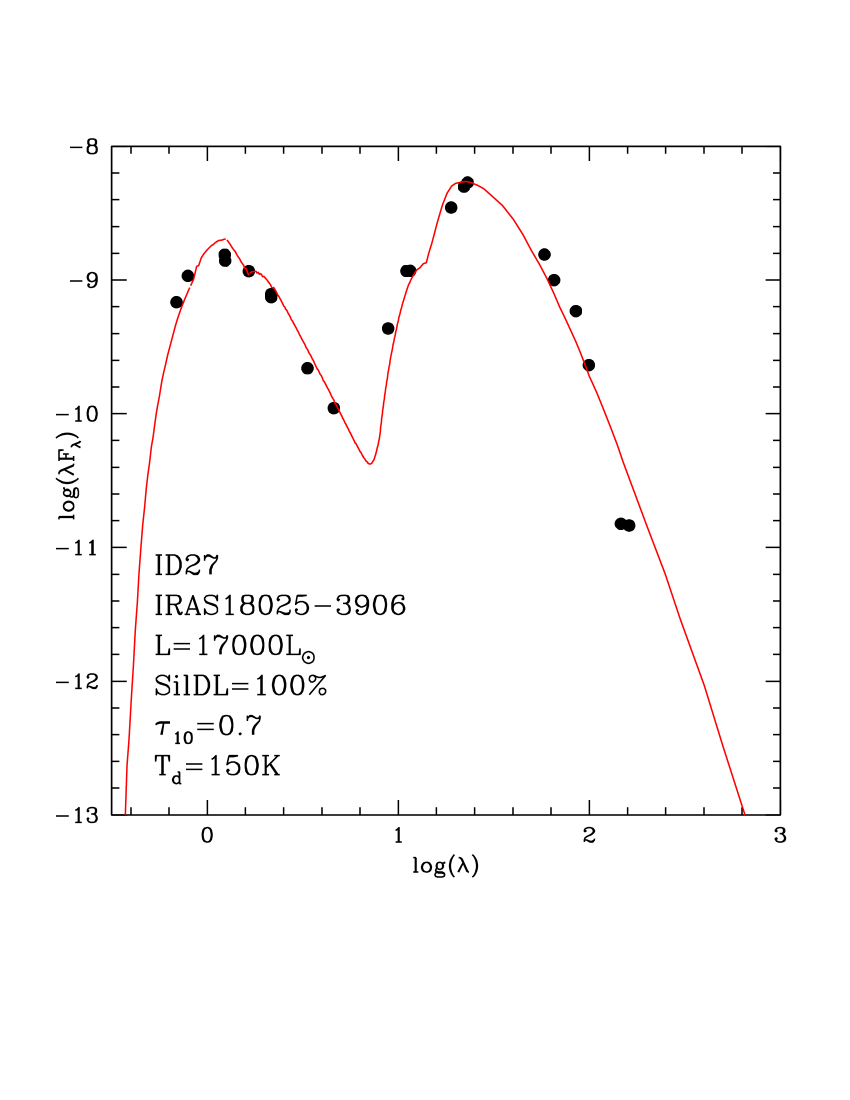
| IRAS 18025–3906 | 27 | 6154 | 17000 | 975 – 12963 | 0.7 | 150 | Q2 | ||
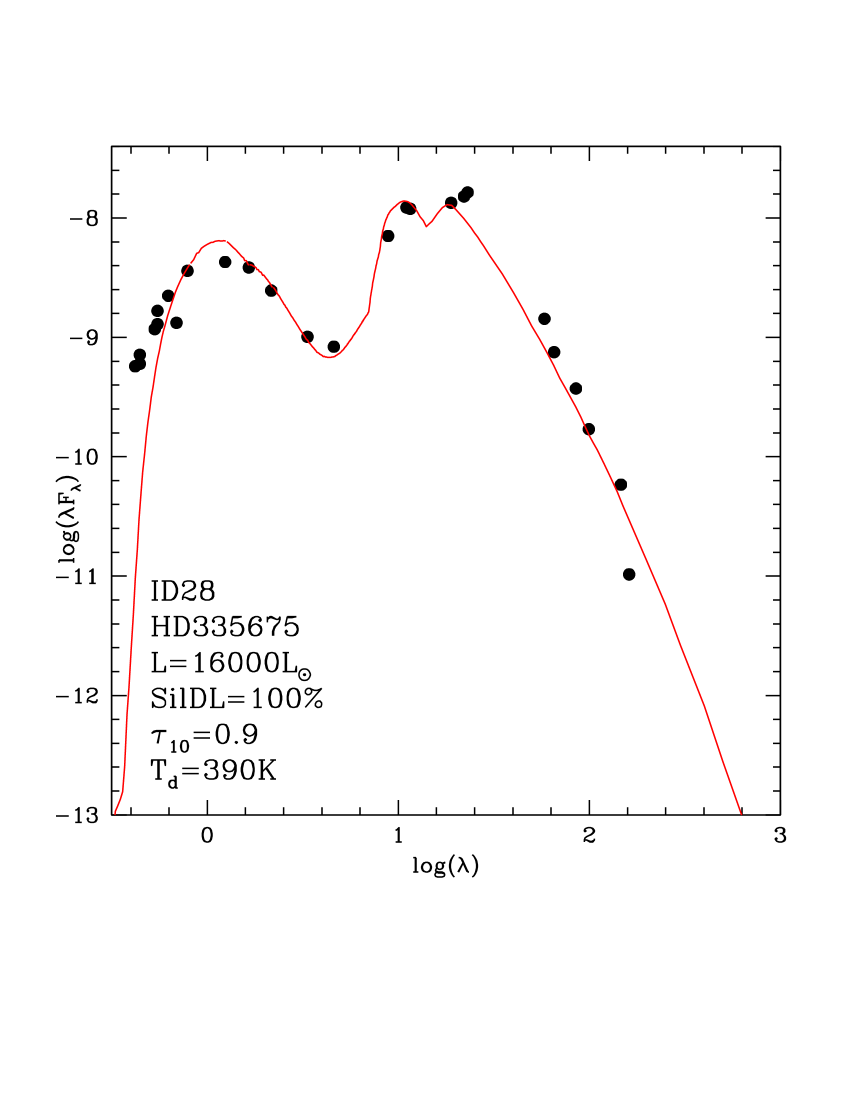
| HD 335675 | 28 | 6082 | 16000 | 7303 – 28359 | 0.9 | 390 | Q2 | ||
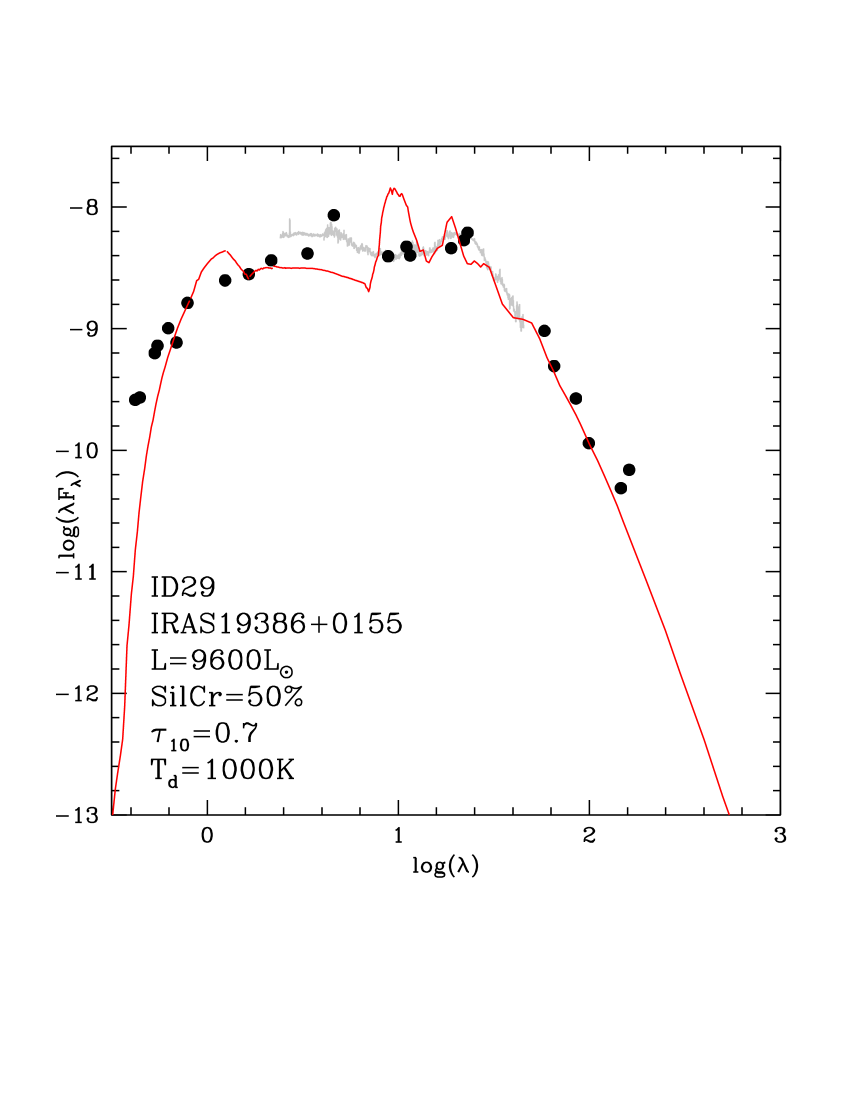
| IRAS 19386+0155 | 29 | 6303 | 9600 | 4345 – 22765 | 0.7 | 1000 | Q2 | ||
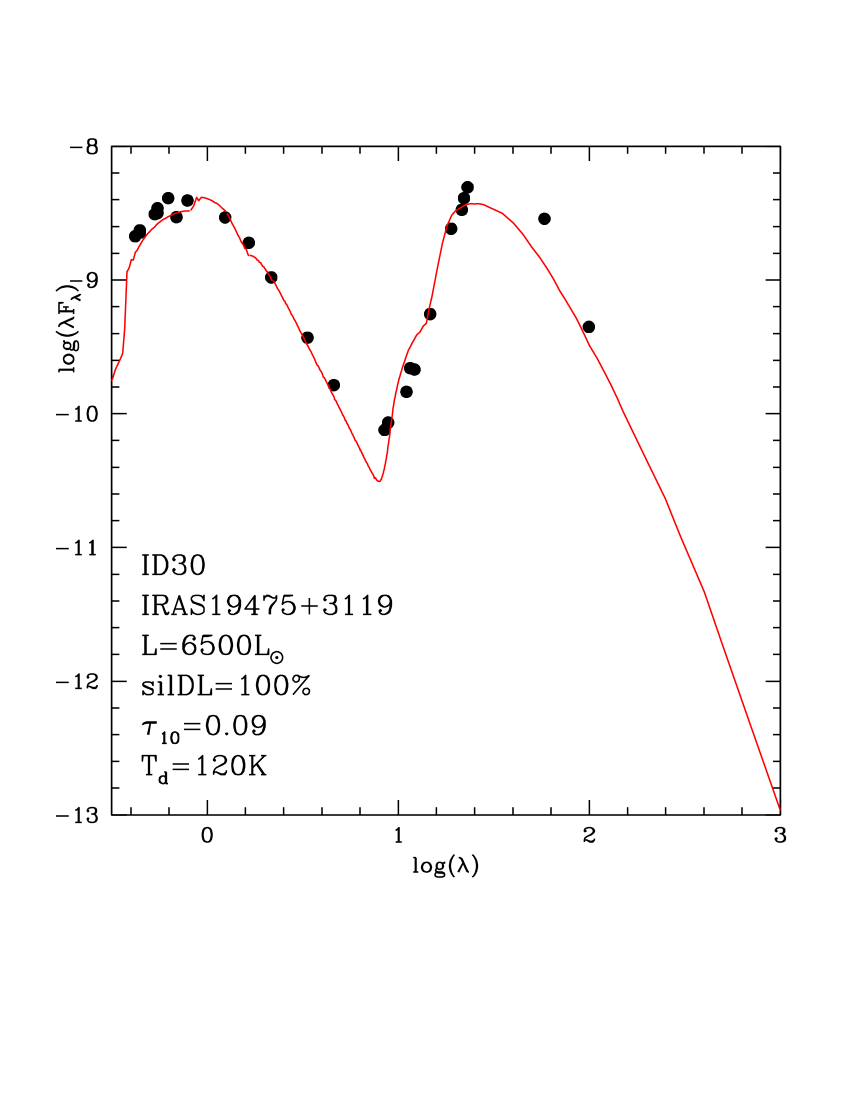
| IRAS 19475+3119 | 30 | 8216 | 6500 | 5955 – 7545 | 0.09 | 120 | Q1 | ||
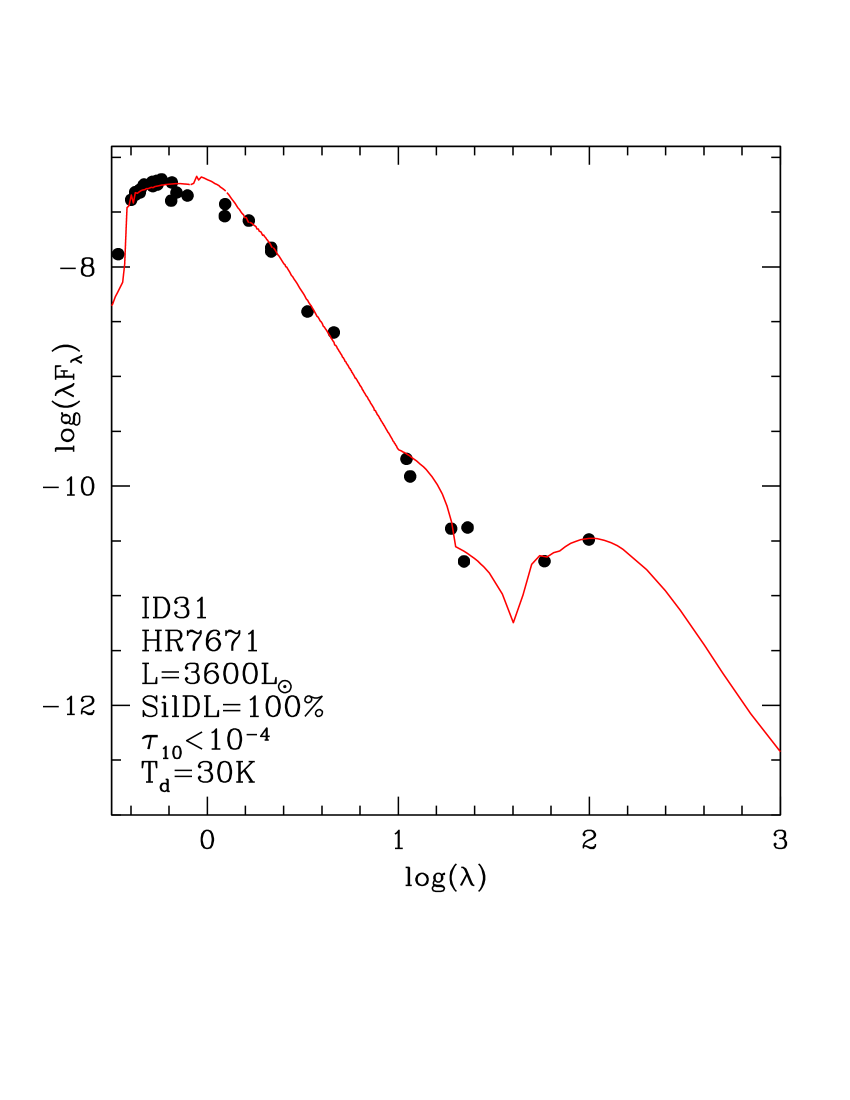
| HR 7671 | 31 | 6985 | 3600 | 3449 – 3734 | 30 | – | Q1 | ||
| J052740.75–702842.0 | LMC | -0.50 | 8283 | 5200 | – | 0.024 | 470 | – | |
| J045119.94–670604.8 | LMC | -0.40 | 8280 | 5000 | – | 0.006 | 270 | – | |
| J052241.52–675750.2 | LMC | -0.50 | 8284 | 5000 | – | 0.017 | 400 | – | |
| J050221.17–691317.2 | LMC | -0.60 | 5250 | 4500 | – | 0.022 | 180 | – | |
| J051906.86–694153.9 | LMC | -1.30 | 5613 | 3800 | – | 0.015 | 180 | – |
The fit of the SED of the different sources considered here is shown in Fig. 1 and Fig. 2. A summary of the results obtained is reported in Table LABEL:tabpost, which also gives the metallicity, the effective temperatures and the luminosity range of each source, derived by Kamath et al. (2022a). The IDs in col. 2 are the same as in Kamath et al. (2022a) and Kamath et al. (2022b). The distribution of the star in the HR diagram is shown in Fig. 3, where also the evolutionary tracks of some model stars used later in this section to characterize the sample sources are also indicated.
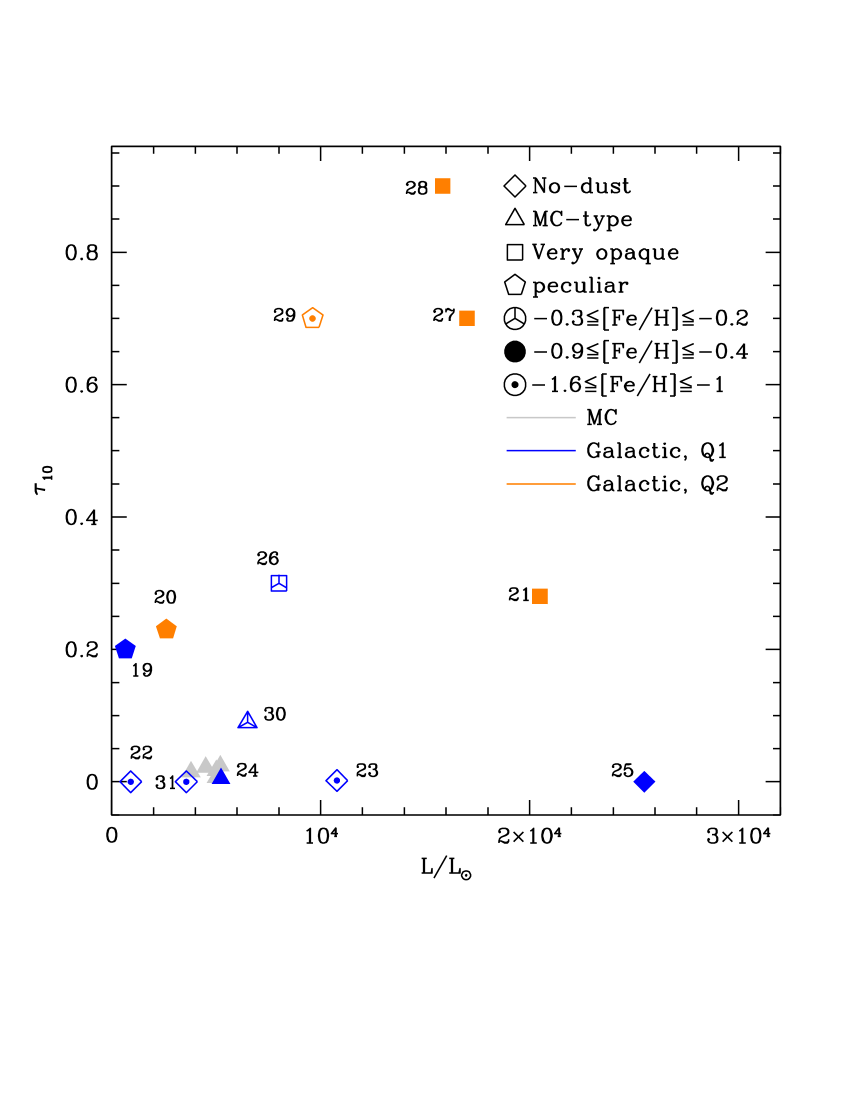
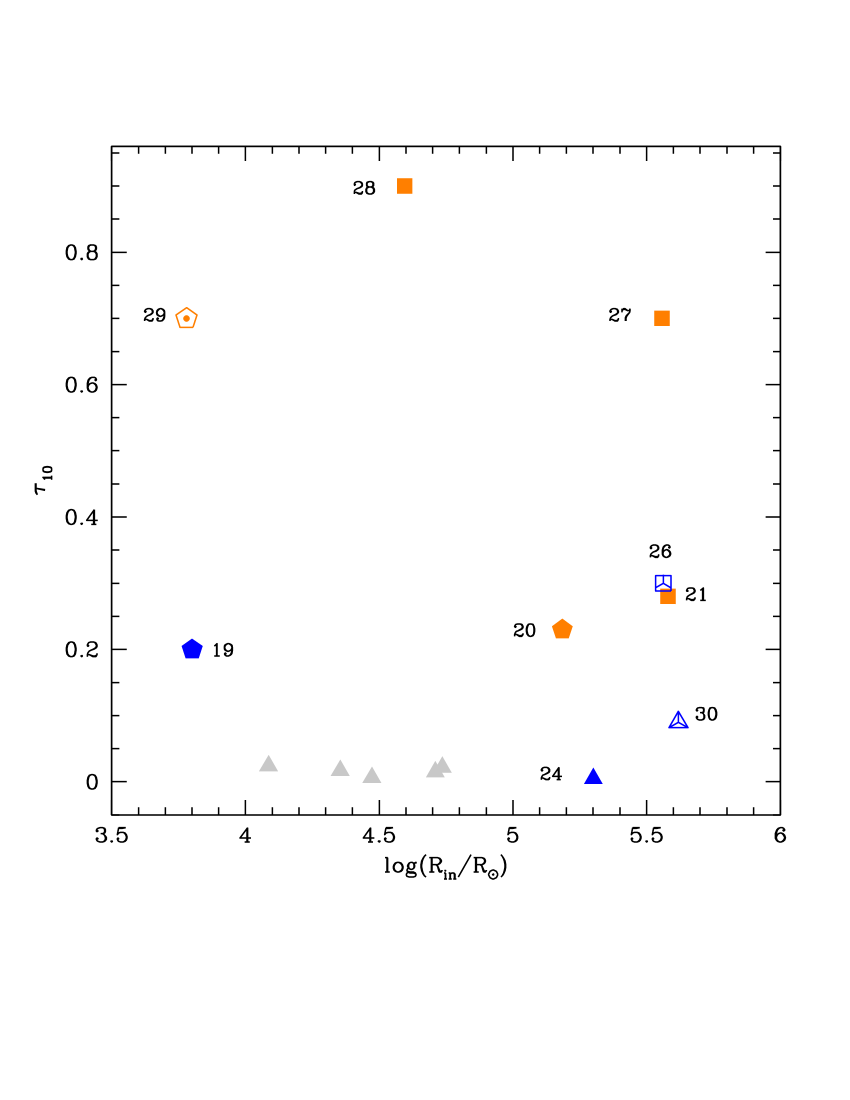
Similarly to Paper I, to discuss the results obtained we analyze the trend of as a function of the luminosity and of , shown, respectively, in the left and right panels of Fig. 4. In the following part of this Section we will consider groups of stars sharing similar dust properties or progenitor’s mass, and discuss them separately.

3.1 The oxygen-richcarbon star interface
The stars ID 24 and ID 30 were interpreted by Kamath et al. (2022b) as low-mass stars that lose the envelope after only a few TDU events, and did not turn into carbon stars (see Fig. 2 in Kamath et al. (2022b)). Consistently with this interpretation, in the left panel of Fig. 4 the two sources populate the same region as the 4 LMC oxygen-rich stars discussed in Paper I and for this reason we will refer to them as ”MC-type” stars. In Paper I they were also identified as low-mass stars that did not reach the C-star stage
In this group ID 30 is the source with the highest (, while on the average), which is the effect of the higher luminosity and the higher mass-loss rate experienced at the end of the AGB phase. The luminosity range of ID 30 given in Kamath et al. (2022a), namely , is consistent with the interpretation given in Kamath et al. (2022b) only if values close to the lower limit are considered (see Fig. 3 in Kamath et al. (2022b)).
To test whether a satisfactory agreement between the physical and dust parameters derived from the observations and from SED fitting with the results from stellar evolution + dust formation modelling can be reached, we investigated ID 30 in detail. Because the metallicity of this star is higher than the other low-luminosity sources for which we propose a similar origin, all sharing a sub-solar chemical composition, we considered solar metallicity models, specifically calculated for the present investigation.
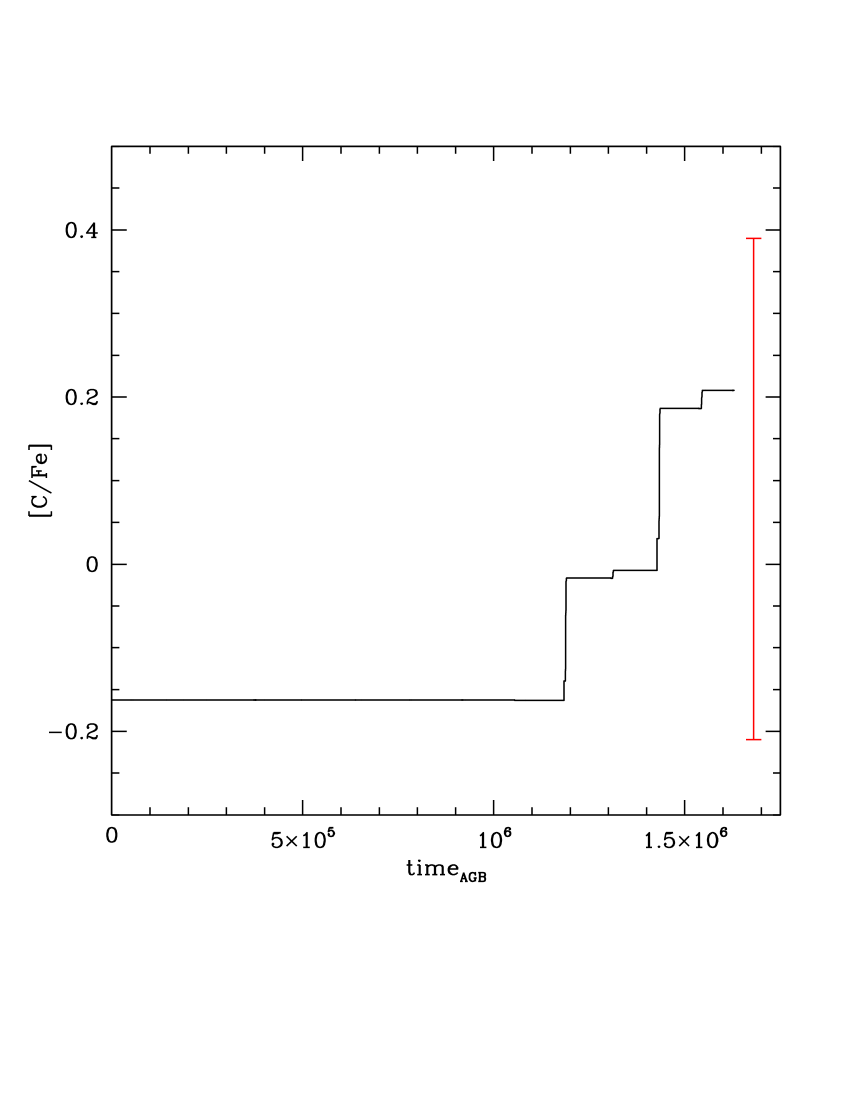
The left panel of Fig. 5 shows the evolutionary track of a model star of solar metallicity. Note that in agreement with Kamath et al. (2022b) the value of the mass refers to the beginning of the core helium burning phase, from which the evolutionary run is started. The post-AGB luminosity of this model-star is , which is within the luminosity range given by Kamath et al. (2022a). Overall, this star experiences 10 thermal pulses (TPs) and only 2 TDU events. As shown in the right panel of Fig. 5, the surface carbon increases up to CFe, consistently with the results given in Kamath et al. (2022a), far below the threshold required to convert the star into a carbon star.
If we assume that the star lost during the RGB, we derive a progenitor initial mass of , which corresponds to an age for ID 30 of Gyr. The uncertainty associated to the derivation of the post-RGB mass of ID 30 given above is small. Indeed if we consider masses we find post-AGB luminosities smaller than the lower limit for ID 30 given in Kamath et al. (2022a); on the contrary, if we assume a higher mass we find that the star experiences a higher number of TDU events than those shown in the right panel of Fig. 5, and eventually becomes a carbon star, with significant s-process enrichment.
Fig. 5 shows that the model star reaches a maximum size slightly in excess of before starting the contraction to the post-AGB phase. The mass loss rate during the phase when the radius is largest, to which we refer to as tip of AGB (TAGB), is yr. This is times higher than the mass-loss rates of the low-luminosity oxygen-rich stars studied in Paper I, which is due to the higher luminosity and the larger metallicity.
Our dust formation modelling applied to the TAGB parameters found for ID 30 (, /yr, effective temperature 3000K) leads to a nowadays optical depth of , significantly higher than the value derived from SED fitting. The possibility that the dust was released at the tip of the AGB can be also disregarded on the basis of dynamical arguments: indeed the time required for the star to evolved from the TAGB to the current phase is found to be yr, which, combined with the distance of the dusty region of ID 30 reported in table LABEL:tabpost, would imply velocities below 1 kms, inconsistent with results from the observations and from dynamical modelling of radiation-driven stellar winds. On the other hand, if we assume that the dust responsible for the IR excess observed now was released when the effective temperature of the star reaches K, we find that , in agreement with the results shown in Fig. 1, reported in Table LABEL:tabpost. Considering that the time between the phase when the effective temperature was 3500 K and the present epoch is found to be slightly below 1 Kyr, by assuming an expansion velocity of 10 kms, we find that the dusty layer should currently be at a distance away from the central star, consistent with the analysis from SED fitting (see right panel of Fig. 4).
When compared to the 5 low-luminosity, oxygen-rich stars investigated in Paper I (grey triangles in Fig. 4), it is clear that the dust has travelled further in the case of ID 30, reaching distances times higher. We propose that this is related to the different optical depths, which witnesses a significant larger dust formation in the case of ID 30. In the stars discussed in Paper I the amount of dust manufactured was so small that the effects of the radiation pressure are reduced, thus the velocities with which the outflow moved away from the star were of the order of a few kms. In the case of ID 30 dust was produced in higher quantities, which favoured a stronger action from radiation pressure, which in turn reflects into higher velocities of the outflow. Considering that ID 30 has higher luminosity and metallicity with respect to the LMC counterparts, this interpretation is consistent with the study by Goldman et al. (2017), who found that the expansion velocity of the outflow of oxygen-rich stars in the LMC and in the Galaxy are positively correlated with the metallicity and luminosity.
The source ID 24 is characterized by lower luminosity and metallicity than ID 30. The post-AGB luminosity of the star is reproduced by a star of metallicity . By accounting for the fact that were lost during the RGB phase, we deduce that this star formed 5-6 Gyr ago. The contraction time from the tip of the AGB to the current effective temperature K is yr, whereas the time from the stage when K to nowadays is 2500 Kyr. This time scale is consistent with the distance of the dusty region derived from SED fitting, if we assume that the dusty layer travelled with a velocity Kms.
3.2 Post-AGB stars that experienced HBB
Kamath et al. (2022b) identified the sources ID21 and ID 27 as the progeny of massive AGB stars that experienced HBB. This conclusion is based on the surface chemical composition, which shows up signs of nitrogen enrichment, whereas the [C/Fe] is slightly super solar. The analysis of these sources offers the possibility to investigate dust production by massive AGBs, something which was not possible in the study of Paper I. This approach proves useful also to constrain the mass loss suffered during the late AGB phases by the stars which experience HBB. Unfortunately they are both flagged as Q2, thus their distance is highly uncertain, so their luminosity. As far as ID 21 is concerned, the post-HBB interpretation is consistent with the luminosity range given in Kamath et al. (2022a); for what concerns ID 27, the luminosity range given by Kamath et al. (2022a) is , while the luminosities of post-HBB stars are expected to be above ; however, given the Q2 flag, we believe that the luminosity of this source is underestimated.
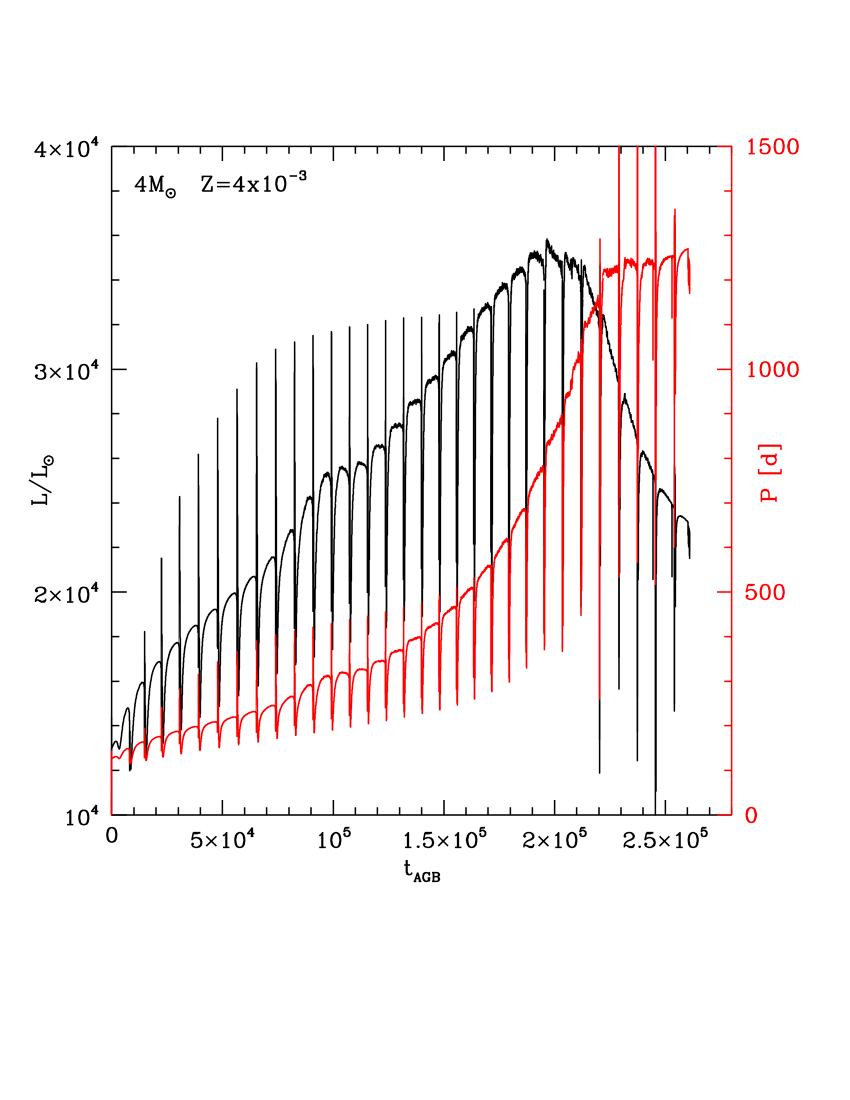
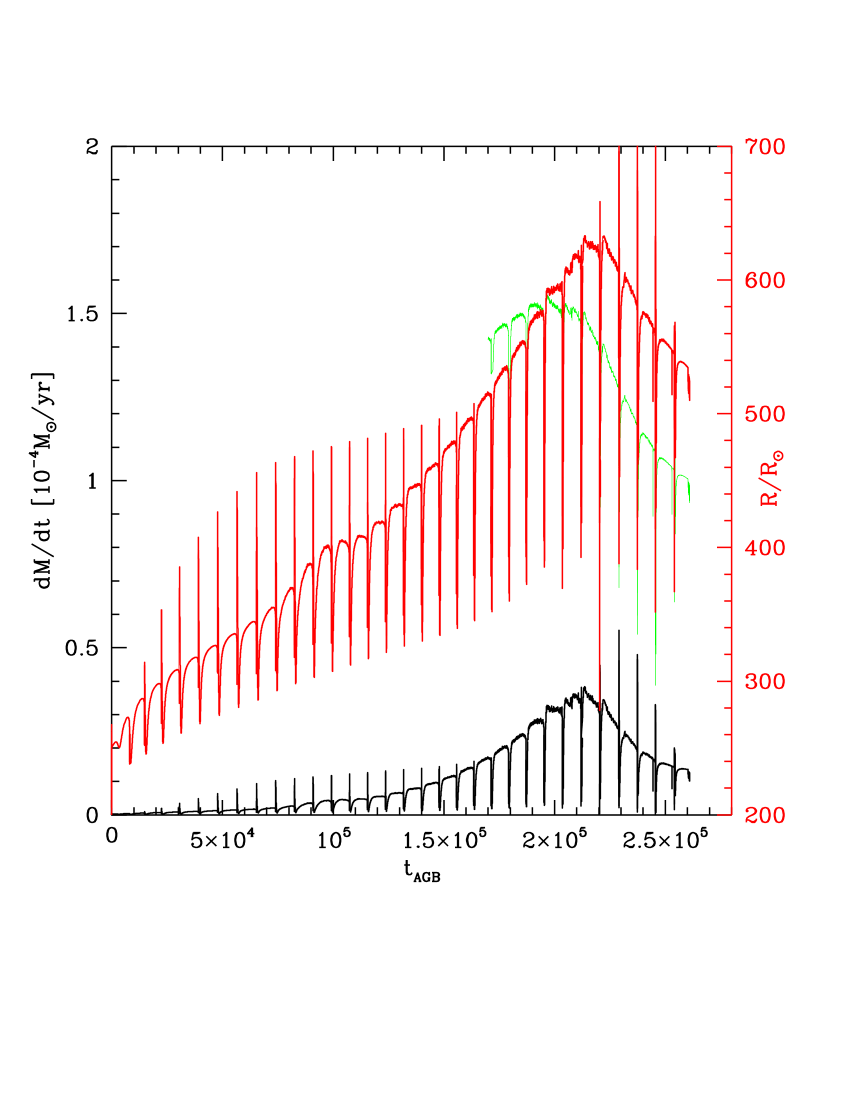
The stars experiencing HBB descend from progenitors, which evolve on core masses above (Ventura et al., 2013). As an example, we show in Fig. 6 the evolution of a model star. These stars are characterized by a typical time variation of the luminosity (see left panel of Fig. 6), which increases during the first part of the AGB evolution, as the core mass increases, then diminishes during the final AGB phases, when HBB is gradually turned off, owing to the consumption of the convective envelope (Ventura et al., 2013; Karakas & Lattanzio, 2014).
The mass loss rate of this class of stars is rather uncertain: use of different prescriptions leads to results that differ significantly in the values of the mass loss rate experienced and in the way it changes along the AGB evolution.
Overall, massive AGBs are efficient dust manufactures. The dust formed is mostly under the form of silicates, with traces of alumina dust and solid iron (Ventura et al., 2012, 2014; Dell’Agli et al., 2014a). This holds in the case of solar or sub-solar chemical compositions only, because the scarcity of silicon and aluminium prevents significant dust formation during the evolution of metal-poor stars.
When the Blöcker (1995) treatment of mass loss is adopted, given the tight relationship between and luminosity in the Blöcker (1995) formula, we find that the largest mass loss rates take place in conjunction with the largest luminosity (compare the time variation of the luminosity and of the mass loss rate in the left and right panel of Fig. 6, respectively); this will also be the phase when the dust production rate is highest, because the rate of mass loss affects directly the density of the wind (Ferrarotti & Gail, 2006), thus the number of gaseous molecules available to condense into dust.
To model ID 27 we considered a model star of metallicity , consistently with the metallicity given by Kamath et al. (2022a). As shown in the left panel of Fig. 6, this star reaches a peak luminosity , which decreases down to during the final phases, preceding the contraction to the post-AGB evolution. Before the start of the contraction phase the model star is characterized by an effective temperature K, radius , period d and mass .
In the right panel of Fig. 6 we can see that the largest mass loss rate found when the Blöcker & Schöenberner (1991) treatment is used is yr, whereas during the final AGB phases it decreases to yr. Dust formation modelling based on this mass loss rate, combined with the values of luminosity, effective temperature and mass given above, and with the surface chemistry of the star222The dust formed in the envelope of oxygen-rich stars is determined by the surface iron, silicon and aluminium mass fractions; because the abundance of these elements does not change during the AGB phase, the initial chemical composition of the star is relevant for the amount of dust formed, leads to a TAGB optical depth . Using Equation 4 of Paper I, which connects the nowadays optical depth with the characterizing the star when the dust was lastly released, we find that the current optical depth should be , far lower than the value of derived for ID 27, reported in Table LABEL:tabpost.
This result confirms recent findings by Marini et al. (to be submitted to AA), that use of the mass loss law by Blöcker (1995) during the final AGB phase hardly allows to interpret the SED of dust enshrouded AGB stars in the Galaxy, likely descending from massive AGBs undergoing HBB, now evolving through the late AGB stages. On the other hand, Marini et al. found that use of the Vassiliadis & Wood (1993) treatment allows a much more satisfactory interpretation of the observations of these kind of sources. The application of the Vassiliadis & Wood (1993) recipe, when the values of luminosity, effective temperature and period given above are considered, leads to TAGB optical depths , which corresponds to nowadays optical depths consistent with the value found for ID 27 (see Table LABEL:tabpost).
When using these enhanced mass-loss rates during the very final AGB phases, we find that the time interval between the tip of the AGB and the current epoch is yr. If we consider a later phase, when the effective temperature is 3500 K, the time interval is yr. If we assume a velocity Kms we find that the distance travelled from dust corresponds to the value derived from SED fitting.
We note that this conclusion is independent of the way mass loss is described during the whole AGB evolution. The treatment of mass loss is definitively relevant for the duration of the whole AGB phase, and affects the number of TP experienced by the star; however, the conditions during the very final AGB stages, after HBB is turned off, are practically independent of the previous AGB evolution, being mainly connected with the value of residual core mass when the final contraction begins.
The optical depths derived from these sources are consistent with the above discussion. For ID 27 we find , whereas for ID 21 we derive from SED fitting. The difference between the two stars is mostly related to the lower metallicity of ID 21 than ID 27, thus to the lower quantities of silicon atoms available.
3.3 Dust-free stars
The sources ID 22 and 25 investigated by Kamath et al. (2022a) show no infrared excess (see Fig. 2), which indicates that there is no dust in their surroundings, thus no dust production occurred during the final part of the AGB phase. Indeed they populate the lower region of the plane shown in the left panel of Fig. 4, where we also find ID 23 and ID 31 whose SED exhibit small IR excess, corresponding optical depth . These sources are not reported on the right panel of the figure, as it is not possible to locate the dusty layer.
For what concerns the sources ID 22, 23 and 31, the lack of dust is due to the low metallicity (see Table LABEL:tabpost), which prevents the formation of significant quantities of silicates and of alumina dust. This conclusion is general, it is independent of the progenitor’s mass and on the current luminosity, and stems from the fact that the formation of dust in the winds of oxygen-rich stars, unlike their carbon-rich counterparts, is extremely sensitive to the metallicity of the star (see van Loon 2000 for an observational point of view, while the theoretical predictions are discussed in Ferrarotti & Gail 2006 and Ventura et al. 2014).
This explanation cannot be applied to ID 25, because the metallicity is FeH. The luminosity is consistent with progenitor, as discussed in Kamath et al. (2022b) (note that this star is flagged as Q1, thus the luminosity can be considered as fairly reliable). Stars of similar masses and metallicity experience HBB during the AGB evolution, and are expected to produce significant quantities of silicates in their circumstellar envelope ( during the entire AGB phase, see e.g. Ventura et al. 2014), which should be detected nowadays. The signature of proton-capture nucleosynthesis is confirmed by the large N enhancement, with NFe slightly below unity, and the large sodium detected, NaFe (Luck et al., 1990).
One of the results obtained in Paper I is that bright stars are characterized by optical depths generally higher than their lower luminosity counterparts surrounded by the same kind of dust, because the evolutionary times, particularly the transition from the AGB to the post-AGB phase, are shorter, thus the dust released is closer to the central object. All these factors render the post-AGB nature of ID 25 extremely unlikely. It is more likely the original classification by Luck et al. (1990), also considered by Van Winckel (1997), that this star is a supergiant, and that the surface N and Na increased as a consequence of meridional currents active during the main sequence phase, triggered by the rotation of the star (Limongi & Chieffi, 2018).
3.4 Low-luminosity, AGB-manque stars?
The stars ID 19 and ID 20 are currently evolving at luminosities below the threshold required to start the TP phase (Kamath et al., 2022a). Kamath et al. (2022b) suggested that these objects descend from low-mass progenitors, which are evolving through the post-HB phase, and have started the contraction to the blue, after evolving to the red. In this framework, it is during the latter phase that the dust nowadays observed was released, as no meaningful dust formation is expected for effective temperatures above 4000 K.
While on the evolutionary point of view this interpretation is consistent with results from stellar evolution modelling, the infrared excess exhibited by ID 19 and ID 20, which corresponds to (see Fig. 4), is significantly higher than expected. Indeed the mass-loss rates obtained from stellar evolution modelling are slightly above yr, which corresponds to optical depth below 0.05. The application of equation 4 of Paper I allows to determine the current optical depth, , which is inconsistent with the values derived from SED fitting.
ID 19 is a Q1 star, with a derived luminosity far below the threshold required to reach the TP phase. This suggests that it completed core helium burning, then evolved as a giant, before the envelope, of a few , was lost, and the evolutionary track moved to the blue side of the HR diagram. The contraction process must have been rather quick, owing to the little mass of the envelope, until the present day effective temperature is reached. This is consistent with the results shown in the right panel of Fig.2, where we notice that ID 19 is the star with the nearest dusty layer, below solar radii.
ID 20 was flagged as Q2 by Kamath et al. (2022a), which leaves some room for invoking a higher luminosity for this source. We believe possible that the luminosity is underestimated, and that the true value is something around . If thus hypothesis proves correct, the star must have entered the AGB when the envelope mass was below , and then it was lost rapidly, likely already during the first thermal pulse. This is on the wake of the scenario first proposed by Renzini (1989), which relies on the relatively long duration of the peak luminosity experienced by very low-mass stars.
An alternative explanation is based on the fact that the nitrogen abundance of ID 20 given in Kamath et al. (2022a) is consistent with the results from HBB nucleosynthesis, when the upper values are considered. In this case ID 20 would descend from a massive AGB progenitor, which experienced HBB. Only a better determination of the parallax will allow a better understanding of this object.
3.5 A few outliers
The sample of oxygen-rich stars with no s-process enrichment by Kamath et al. (2022a) includes three sources for which a full understanding of the evolutionary and dusty properties can be barely reached.
ID 26 is a peculiar object, as it is significantly enriched in nitrogen, despite the low luminosity. We note that this source is flagged as Q1 by Kamath et al. (2022a), thus the luminosity range given is reliable. Kamath et al. (2022b) suggested that ID 26 experienced deep mixing during the RGB phase, which might explain the nitrogen and sodium enrichment measured.
On the other hand this source is characterized by a large IR excess, and the derived optical depth is , among the highest found in the present analysis. The occurrence of extra-mixing is not expected to affect the dust production during the final phases, which is relevant to determine the dust surrounding the star during the post-AGB. The dusty properties of this source suggest that the star descends from progenitors which experienced HBB. However, this result must be taken with some caution, given the claimed asymmetry in the dust distribution (Min et al., 2013), which might clash with the plain interpretation obtained here, based on the adoption of the DUSTY code in the isotropic modality.
In summary, while the surface chemistry and the dust properties of ID 26 are consistent with progenitors of mass above , which experienced HBB and form significant amount of dust until the end of the AGB phase, the luminosity is compatible with a low-mass progenitor.
The optical depth and the distance of the dusty layer from the star of ID 28 suggest that this source descends from an intermediate mass progenitor. This interpretation could work if the upper limit for the metallicity reported in Tab. 1 is considered. We insert this source among the outliers because the only derivation of the surface nitrogen by Şahin et al. (2011) appears to be inconsistent with the fact that ID 28 should have experienced HBB, which would lift the surface N by 1 dex.
ID 29 is one of the objects characterized by large optical depth, . Unfortunately the luminosity of this source, flagged as Q2, is highly uncertain, with (Kamath et al., 2022a). Fruthermore the surface abundances of nitrogen and oxygen are not available. This prevents any identification of the progenitor and the interpretation of the IR excess. A further criticality related to this source is the possible presence of a disk, which would render the methodology used in the present analysis unapplicabile. Pereira et al. (2004), based on the morphology of the SED, suggested that the star is surrounded by a dust disk. This conclusion is consistent with the results obtained by Goldman et al. (2017). Indeed, ID 29 appears to be the only source whose SED does not show the double-peak structure (see Fig. 1), typical of spherically symmetric sources. This is the reason for the poor agreement between the fit and the data, in particular in the region of the spectrum below , regardless the choice on the percentage of crystalline silicate considered.
4 Discussion
The infrared excess characterizing post-AGB stars is related to the presence of dust in the surroundings of the stars, which was released during earlier epochs. On general grounds, the optical depth of the dusty region is determined by the rate of dust formation and by the current distance of the dusty region from the surface of the star; this distance is determined by the evolutionary time scale of the AGB - to post-AGB phase transition, and by the velocity with which the outflow moved away from the star after the dust was lastly released.
The situation for oxygen-rich stars emerging from this study is complex, as can be understood by looking at Fig. 4, where it is clear that in this case luminosity, unlike the carbon stars investigated in Paper I, is not the only factor affecting the dust properties of post-AGB stars. Metal-poor oxygen-rich stars form little or no dust, independently of luminosity. If we restrict the attention on the sources with solar or sub-solar chemical composition, a rough correlation between luminosity and optical depth can be seen in the left panel of Fig. 4: the stars distribute on this plane along a diagonal band, covering the luminosity range and the optical depths . ID 19 is off this trend, which might be connected to the fact that this star did not evolve through the AGB phase.
The optical depth of stars descending from massive AGBs that experienced HBB is generally higher than the low-mass counterparts of similar metallicity, owing to the larger rates of dust production experienced during the whole AGB lifetime, and particularly during the final AGB phases. However, inspection of the right panel of Fig. 4 shows that the relationship between the distance of the dusty layer from the surface of the star and the luminosity is less obvious than we found in Paper I for carbon stars in the MC.
We believe that the main reason for this is the intrinsic difference between the extinction properties of carbon dust and silicates, the mean opacities of carbonaceous dust being one order of magnitude higher than silicates, under the thermodynamic conditions when dust is expected to form (see Fig. 10 in Ferrarotti & Gail 2002). The scattering and absorption coefficients of carbon dust are extremely large, thus the formation of carbon dust, even in moderate quantities, favours a significant acceleration of the outflow: in these conditions, the current location of the dusty region is mainly determined by the time scale of the transition from the AGB to the post-AGB phase, thus by the luminosity of the star.
In the case of the formation of silicates, it is not obvious that radiation pressure is able to overcome the gravitational pull of the central star, and to accelerate the wind: this reflects into a higher heterogeneity in the outflow velocities of oxygen-rich stars with respect to carbon stars. As far as bright O-rich stars which experienced HBB are considered, the luminosities, around or above , are sufficiently large that the radiation pressure is strong enough to drive the wind. This is not as much obvious in the low-luminosity () domain of M-type stars. Indeed in the low-luminosity region of the plane shown in the right panel of Fig. 4, populated by the progeny of low-mass stars that failed to reach the C-star stage, we note that the distance of the dusty region from the star is in fact correlated with the luminosity: the largest distance is found for ID 30, the brightest among these objects. A possible explanation for this behaviour is that by the combined analysis of the 5 oxygen-rich stars discussed in Paper I and of ID 24 and ID 30 we are exploring the transition from winds scarcely affected by radiation pressure, to radiation driven winds. This trend reflects into a positive correlation between velocity and luminosity, which is the reason for the larger distances of the dusty regions in brighter stars.
We note in the right panel of Fig. 4 that the distance of the dusty regions of ID 30 is similar to those of the brighter, higher mass counterparts ID 21 and ID 27. We believe that even in this case the explanation can be found in the different expansion velocities of the outflows, which, in turn, are connected to the large differences between the dust production rates by low-mass and massive AGBs. In the case of the carbon stars investigated in Paper I, the difference in the mass loss rates during the final AGB phases between the brighter stars and the low-luminosity C-stars was a factor . In this case we find that almost two orders of magnitude separate the mass loss rate experienced by ID 27 (yr) and ID 30 (yr). Since for mass conservation reasons the velocity of the outflow is tightly connected with the mass-loss rate, the outflow velocity is significantly larger than in low-mass counterparts, and this effect counterbalances the differences in the evolutionary time scales, on the determination of the location of the dusty region.
5 Conclusions
We study the properties of the dust surrounding oxygen-rich post-AGB stars, to reconstruct the dust formation process during the late phases of the AGB evolution, which prove the most relevant to understand the dust budget expected from low and intermediate mass stars. To this aim, we focus on oxygen-rich post-AGB sources observed in the Galaxy (Kamath et al., 2022a), whose distances (and hence luminosities) can be inferred from the Gaia data release, for which the SED can be reconstructed with sufficient accuracy by the combined availability of results from optical and infrared photometry.
To reconstruct the evolutionary and dust formation history of these stars, we follow an approach based on the derivation of the main dust and stellar parameters via SED fitting, and on the interpretation of the results on the basis of stellar evolution and dust formation modelling of the AGB and post-AGB phases. This allowed us to identify: a) sources descending from low-mass progenitors, which loose the external mantle before experiencing a number of TDU episodes sufficient to rise the surface s-process content and to reach the C-star stage; b) the progeny of massive AGB stars that experienced HBB, which is further witnessed by the nitrogen enhancement derived from high resolution spectroscopy analysis; c) stars with little or no IR excess, which we connect to the scarcity of dust in their surroundings; d) faint sources, likely evolving through the post-HB phase, which failed to reach the AGB phase, owing to small mass of the envelope at the end of the core helium burning.
If we restrict our attention only to the stars belonging to the groups (a) and (b) mentioned above, we find that those of higher luminosity are surrounded by a more optically thick dusty region, which is consistent with results from stellar evolution and dust formation modelling, according to which brighter stars of a given metallicity experience higher mass loss and dust production rates during the final AGB phases. Indeed in the case of massive AGBs such a comparison between the observational evidence and the results from modelling allow to draw information on the still largely unknown mass loss mechanism experienced by these stars when evolving through the AGB phase, indicating that the rate of mass loss keeps above yr until the beginning of the transition from the AGB to the post-AGB phase.
An exception to this general behaviour is provided by a subset of metal poor stars, which have little or no dust in their surroundings, owing to the scarcity of silicon and aluminium in the surface regions. A further exception to this rule is the bright source ID 25, with sub-solar chemical composition and no dust, which we suggest to be a red supergiant star.
The analysis of the distribution of the distances of the dusty regions from the central stars, derived from SED fitting, offers an interesting opportunity to derive information regarding the dynamics of the winds of oxygen-rich stars, during the transition from the AGB to the post-AGB phase.
In the low-mass domain the distance of the dusty region is correlated to the luminosity, since brighter stars experience higher rates of dust formation than the lower luminosity counterparts of similar metallicity, thus the outflow moves faster, owing to the higher radiation pressure acting on the dust grains in the circumstellar envelope. The analysis of the stars descending from massive AGB progenitors shows that the dusty regions are located at larger distances with respect to the ones found for the brightest low-mass stars: this is explained by the balance between the effects of the shorter transition time scales of higher luminosity stars and the larger dust production, which reflects into faster outflows.
Acknowledgements.
We thank the referee Dr. Jacco Th. Van Loon for his prompt, detailed and constructive revision of the manuscript. DK acknowledges the support of the Australian Research Council (ARC) Discovery Early Career Research Award (DECRA) grant (DE190100813). This research was supported in part by the Australian Research Council Centre of Excellence for All Sky Astrophysics in 3 Dimensions (ASTRO 3D), through project number CE170100013. HVW acknowledges support from the Research Council of the KU Leuven under grant number C14/17/082. EM acknowledges support from the INAF research project “LBT - Supporto Arizona Italia”.References
- Belokurov et al. (2020) Belokurov V., Penoyre Z., Oh S., Iorio G., Hodgkin S., Evans N. W., Everall A., et al., 2020, MNRAS, 496, 1922.
- Bailer-Jones et al. (2021) Bailer-Jones C. A. L., Rybizki J., Fouesneau M., Demleitner M., Andrae R., 2021, AJ, 161, 147.
- Blöcker (1995) Blöcker T., 1995, A&A, 297, 727
- Blöcker & Schöenberner (1991) Blöcker T., Schöenberner D. 1991, A&A, 244, L43
- Busso et al. (1999) Busso, M., Gallino, R., & Wasserburg, G. J. 1999, ARA&A, 37, 239.
- Cinquegrana & Karakas (2022) Cinquegrana, G. C. & Karakas, A. I. 2022, MNRAS, 510, 1557
- Cristallo et al. (2015) Cristallo S., Straniero O., Piersanti L., et al. 2015, ApJS, 219, 40
- Dell’Agli et al. (2014a) Dell’Agli F., García-Hernández D. A., Rossi C., et al. 2014a, MNRAS, 441, 1115
- Dell’Agli et al. (2014b) Dell’Agli F., Ventura P., Garcia Hernandez D. A., et al. 2014b, MNRAS, 442, L38
- Dell’Agli et al. (2015a) Dell’Agli F., Ventura P., Schneider R., et al. 2015a, MNRAS, 447, 2992
- Dell’Agli et al. (2015b) Dell’Agli F., García-Hernández D. A., Ventura P., et al. 2015b, MNRAS, 454, 4235
- Dell’Agli et al. (2016) Dell’Agli F., Di Criscienzo M., Boyer M. L., et al. 2016, MNRAS, 460, 4230
- Dell’Agli et al. (2018) Dell’Agli F., Di Criscienzo M., Ventura P., et al. 2018, MNRAS, 479, 5035
- Dell’Agli et al. (2019) Dell’Agli F., Di Criscienzo M., García-Hernández D. A., et al. 2019, MNRAS, 482, 4733
- Dell’Agli et al. (2021) Dell’Agli, F., Marini, E., D’Antona, F., et al. 2021, MNRAS, 502, L35
- De Smedt et al. (2012) De Smedt, K., Van Winckel, H., Karakas, A. I., et al. 2012, A&A, 541, A67
- Draine & Lee (1984) Draine, B. T., & Lee, H. M. 1984, ApJ, 285, 89
- Ferrarotti & Gail (2002) Ferrarotti, A. S. & Gail, H.-P. 2002, A&A, 382, 256
- Ferrarotti & Gail (2006) Ferrarotti A. S., Gail H.-P. 2006, A&A, 447, 553
- García-Berro, Ritossa, & Iben (1997) García-Berro E., Ritossa C., Iben I., 1997, ApJ, 485, 765
- García-Hernández et al. (2009) García-Hernández, D. A., Manchado, A., Lambert, D. L., et al. 2009, ApJ, 705, L31
- Ginolfi et al. (2018) Ginolfi, M., Graziani, L., Schneider, R., et al. 2018, MNRAS, 473, 4538
- Goldman et al. (2017) Goldman, S. R., van Loon, J. T., Zijlstra, A. A., et al. 2017, MNRAS, 465, 403. doi:10.1093/mnras/stw2708
- Grevesse & Sauval (1998) Grevesse N., Sauval A. J 1998, SSrv, 8 5, 161
- Hanner (1988) Hanner, M. 1988, Infrared Observations of Comets Halley and Wilson and Properties of the Grains
- Herwig (2005) Herwig, F. 2005, ARA&A, 43, 435
- Iben (1974) Iben, I. Jr. 1974, ARA&A, 12, 215
- Jaeger et al. (1994) Jaeger, C., Mutschke, H., Begemann, B., Dorschner, J., Henning, Th. 1994, A&A, 292, 641
- Kamath et al. (2014) Kamath, D., Wood, P. R., & Van Winckel, H. 2014, MNRAS, 439, 2211, K14
- Kamath et al. (2015) Kamath, D., Wood, P. R., & Van Winckel, H. 2015, MNRAS, 454, 1468, K15
- Kamath et al. (2017) Kamath, D., Van Winckel, H., Wood, P. R., et al. 2017, ApJ, 836, 15
- Kamath (2020) Kamath, D. 2020, Journal of Astrophysics and Astronomy, 41, 42
- Kamath et al. (2022a) Kamath, D., Van Winckel, H., Ventura, P., et al. 2022a, ApJ, 927, L13
- Kamath et al. (2022b) Kamath, D., Dell’Agli, F., Ventura, P., et al. 2022b, submitted to MNRAS
- Kamath & Van Winckel (2022c) Kamath, D. & Van Winckel, H. 2022c, Universe, 8, 233
- Karakas & Lattanzio (2014) Karakas A. I., Lattanzio J. C. 2014, PASA, 31, e030
- Karakas & Lugaro (2016) Karakas A. I., Lugaro M. 2016, ApJ, 825, 26
- Karakas et al. (2018) Karakas A. I., Lugaro M., Carlos M., et al. 2018, MNRAS, 477, 421
- Karakas et al. (2022) Karakas, A. I., Cinquegrana, G., & Joyce, M. 2022, MNRAS, 509, 4430
- Kobayashi et al. (2020) Kobayashi, C., Karakas, A. I., & Lugaro, M. 2020, ApJ, 900, 179
- Limongi & Chieffi (2018) Limongi, M. & Chieffi, A. 2018, ApJS, 237, 13
- Lindegren et al. (2021) Lindegren, L., Klioner, S. A., Hernández, J., et al. 2021, A&A, 649, A2.
- Luck et al. (1990) Luck, R. E., Bond, H. E., & Lambert, D. L. 1990, ApJ, 357, 188
- Min et al. (2013) Min, M., Jeffers, S. V., Canovas, H., et al. 2013, A&A, 554, A15
- Nanni et al. (2013) Nanni A., Bressan A., Marigo P., et al. 2013, MNRAS, 434, 2390
- Nanni et al. (2014) Nanni A., Bressan A., Marigo P., et al. 2014, MNRAS, 438, 2328
- Nanni et al. (2016) Nanni A., Marigo P., Groenewegen M. A. T., et al. 2016, MNRAS, 462, 1215
- Nanni et al. (2019b) Nanni A., Groenewegen M. A. T., Aringer B., et al. 2019, MNRAS, 487, 502
- Nanni et al. (2020) Nanni, A., Burgarella, D., Theulé, P., et al. 2020, A&A, 641, A168
- Nenkova et al. (1999) Nenkova, M., Ivezic, Z., & Elitzur, M. 1999, Thermal Emission Spectroscopy and Analysis of Dust, Disks, and Regoliths, 20
- Penoyre et al. (2020) Penoyre Z., Belokurov V., Wyn Evans N., Everall A., Koposov S. E., 2020, MNRAS, 495, 321.
- Pereira et al. (2004) Pereira, C. B., Lorenz-Martins, S., & Machado, M. 2004, A&A, 422, 637
- Renzini (1989) Renzini, A. 1989, Planetary Nebulae, 131, 391
- Romano et al. (2010) Romano D., Karakas A. I., Tosi M., et al. 2010, A&A, 522, A32
- Şahin et al. (2011) Şahin, T., Lambert, D. L., Klochkova, V. G., et al. 2011, MNRAS, 410, 612. doi:10.1111/j.1365-2966.2010.17467.x
- Sloan et al. (2003) Sloan G. C., Kraemer K. E., Price S. D., Shipman R. F., 2003, ApJS, 147, 379
- Sloan et al. (2009) Sloan, G. C., Matsuura, M., Zijlstra, A. A., et al. 2009, Science, 323, 353
- Tosi et al. (2022) Tosi, S., Dell’Agli, F., Kamath, D., et al. 2022, arXiv:2208.08314, Paper I
- van Loon (2000) van Loon, J. T. 2000, A&A, 354, 125
- Van Winckel (1997) Van Winckel, H. 1997, A&A, 319, 561
- van Winckel (2003) van Winckel, H. 2003, ARA&A, 41, 391
- Vassiliadis & Wood (1993) Vassiliadis E., Wood P. R. 1993, ApJ, 413, 641
- Ventura et al. (1998) Ventura, P., Zeppieri, A., Mazzitelli, I., D’Antona, F., 1998, A&A, 334, 953
- Ventura & D’Antona (2005a) Ventura P., D’Antona F. 2005a, A&A, 431, 279
- Ventura & D’Antona (2005b) Ventura, P., D’Antona, F. 2005b, A&A, 439, 1075
- Ventura et al. (2012) Ventura P., Di Criscienzo M., Schneider R., et al. 2012, MNRAS, 420, 1442
- Ventura et al. (2013) Ventura P., Di Criscienzo M., Carini R., D’Antona F., 2013, MNRAS, 431, 3642
- Ventura et al. (2014) Ventura P., Dell’Agli F., Schneider R., et al. 2014, MNRAS, 439, 977
- Ventura et al. (2015) Ventura P., Karakas A. I., Dell’Agli F., et al. 2015, MNRAS, 450, 3181
- Ventura et al. (2016) Ventura P., Karakas A. I., Dell’Agli F., et al. 2016, MNRAS, 457, 1456
- Ventura et al. (2018) Ventura P., Karakas A., Dell’Agli F., García-Hernández D. A.,Guzman-Ramirez L. 2018, MNRAS, 475, 2282
- Ventura et al. (2020) Ventura, P., Dell’Agli, F., Lugaro, M., et al. 2020, A&A, 641, A103
- Ventura et al. (2021) Ventura, P., Dell’Agli, F., Romano, D., et al. 2021, A&A, 655, A6
- Vincenzo et al. (2016) Vincenzo, F., Belfiore, F., Maiolino, R., et al. 2016, MNRAS, 458, 3466.
- Zhukovska et al. (2008) Zhukovska S., Gail H.-P., Trieloff M. 2008, A&A, 479, 453
- Zubko et al. (1996) Zubko, V. G., Mennella, V., Colangeli, L., et al. 1996, MNRAS, 282, 132