Micro-Architectural features as soft-error induced fault executions markers in embedded safety-critical systems: a preliminary study
Abstract
Radiation-induced soft errors are one of the most challenging issues in Safety Critical Real-Time Embedded System (SACRES) reliability, usually handled using different flavors of Double Modular Redundancy (DMR) techniques. This solution is becoming unaffordable due to the complexity of modern microprocessors in all domains. This paper addresses the promising field of using Artificial Intelligence (AI) based hardware detectors for soft errors. To create such cores and make them general enough to work with different software applications, microarchitectural attributes are a fascinating option as candidate fault detection features. Several processors already track these features through dedicated Performance Monitoring Unit (PMU). However, there is an open question to understand to what extent they are enough to detect faulty executions. Exploiting the capability of gem5 to simulate real computing systems, perform fault injection experiments and profile microarchitectural attributes (i.e., gem5 Stats), this paper presents the results of a comprehensive analysis regarding the potential attributes to detect soft error and the associated models that can be trained with these features.
Index Terms:
reliability, soft errors, machine learning, artificial neural networks, soft error analysisI Introduction
Radiation-induced soft errors, which started as a rather exotic failure mechanism causing anomalies in satellites, have become one of the most challenging issues in all electronic systems, particularly Safety Critical Real-Time Embedded System (SACRES) [1]. Many efforts have been spent in the last decades to measure [2], model [3], and mitigate [4] radiation effects, implementing cross-layer reliability countermeasures [5]. Predictability is a crucial SACRES requirement as it helps ensure the system’s safety and reliability and makes it easier to test and maintain. Predictability is implemented by static partitioning and hardware isolation of available computing resources (e.g., memory, CPU cores, etc.) among a set of predefined tasks, making it easier to monitor the behavior of each task in isolation. Resilience to soft errors is then supported through redundancy at different levels [6]. In particular, Double Modular Redundancy (DMR) implementing lock-step execution is a popular schema to achieve fault detection, and check-pointing is the solution to enable recovery from faults [7]. However, with the increasing complexity of microprocessor cores, DMR is becoming unaffordable, and designers are increasingly looking into smaller hardware/software error detectors [8, 9, 10, 11]. AI is a fascinating instrument in this domain, bringing to the new concept of artificial resilience, i.e., systems that can be trained to detect and possibly recover from faults [12].
AI has been employed for constructing hardware or software soft error detectors trained on software-specific input/output features [13, 14, 15, 16]. Overall, in these approaches, the data used to determine whether the output of a task is correct or incorrect (i.e., the feature vector) includes the task input and output. While effective, having an application-dependent feature vector makes it challenging to create generic detectors, especially when looking at hardware implementations that require standard methods to collect and deliver features to the detector. Microarchitectural features (i.e., executed instructions, cache misses, or incorrectly anticipated branching for the active program) are easier to collect thanks to the availability of increasingly complex Performance Monitoring Unit (PMU) tracking and measuring numerous performance-related events accessible through dedicated Hardware Performance Counter (HPC). Therefore an important question to investigate is: “are microarchitectural features able to explain faulty executions in the presence of soft errors?”. Dutto et al. showed that the answer to this question is ’yes’ in the case of permanent faults [17]. However, permanent faults lead to fault accumulation during software execution, amplifying anomalies and making detection easier. [18] confirms a positive answer to this question, even if a deep analysis of several features is not reported. Recently Nosrati et al. proposed an AI detector for soft errors in embedded processors [19]. While results are promising in terms of fault detection accuracy, the approach relies on monitoring internal signals of the microprocessor that would require an invasive hardware redesign.
This paper proposes a preliminary study to understand to what extent microarchitectural features traced through a PMU can be exploited to build an AI-powered hardware soft error detector. For this purpose, a set of fault injection experiments performed using FIMSIM [20], a fault injector framework based on gem5 [21] was used to create a dataset of features over several faulty and correct executions. This dataset was analyzed to give designers insights into the best options to build their soft error detection systems. Particular emphasis was devoted to understanding whether event timing could bring additional information to the model. This information is crucial to identify the best AI models to employ in this challenging task. The paper does not focus on the design of the detector but on assessing the feasibility of the idea. Therefore, the hardware implementation cost and related inference time are out of the scope of this study.
II Experimental set-up
Injecting faults directly into real hardware is complex [22, 11]; virtual simulators simplify the development of fault injection modules and the subsequent data collection task [23, 24, 25]. For this reason, simulation-based fault injection was used to collect data. Figure 1 summarizes the basic building blocks of the implemented experimental design.
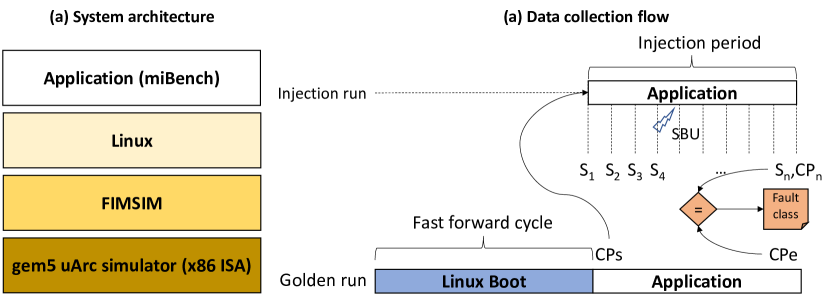
Since the goal is to analyze microarchitecture level features, the gem5 simulator was used to emulate the hardware substrate [21]. Experiments were performed by simulating the full-system stack, modeling the hardware through the AtomicSimpleCPU model available in gem5 configured to emulate the x86 Instruction Set Architecture (ISA). The software stack included a Linux kernel and a set of target tasks of different complexity. Six MiBench [26] applications were considered: qsort, dijkstra, susan, sha, bitcount and basicmath. The fault injection task was accomplished using FIMSIM, an add-on to gem5 that enables fault injections of permanent (stuck-at) faults, Single-Bit Upsets (SBU), and Multiple-Bit Upsets (MBU) in different microprocessor structures. This preliminary study focused on SBU in the Integer Register File (intRF). After the fast-forward cycle required to boot the operating system, faults were injected at random locations and time intervals during the execution of the application. gem5 enables monitoring of the internal microprocessor state using checkpoints (i.e., snapshots of the hardware architecture containing all the inner values at a particular clock tick) and stats (i.e., performance counters that profile the number of internal events, such as cache misses, jumps, accesses to memory, and so on). To speed up the experiments, every fault injection run started from a checkpoint collected at the end of the fast-forward cycle corresponding to the end of the Linux boot process (CPs). Several stats (S1, S2, …, Sn) were collected during the simulation to consider the time dimension when building the final dataset.
The fault effect was classified by comparing the last checkpoint of the fault injection run (CPn) with the golden execution (CPe). Possible outcomes following a fault injection can be explained in five categories: (i) Crash: the program completely stops working and exits; (ii) Silent Data Corruption (SDC): the program terminates, but its outcome is wrong; (iii) Benign: even if there was a fault, the program’s outcome is correct (iv) Hangs: the program is stuck within a loop; (v) Reboots: the operating system reboots. Crashes and hangs are straightforward to detect by inspecting the program counter [27], so they are not considered in this study. Reboots cannot instead be traced with the available simulation setup. Hence, this study focuses on detectors able to discriminate SDC and Benign executions.
The HPC in the gem5 stats collected during fault injection experiments were used to create the dataset analyzed in the next section. A total amount of about 600 features were monitored during every fault injection run. Data were preprocessed and normalized before carrying out the analysis. First, some values in the collected dataset were non-numerical (NaN). Features with more than 5% NaN values and attributes with zero variance across experiments were removed. At this point, simulations containing even a single NaN value were removed from the dataset. Finally, missing values were set to zero, and the dataset was normalized. SDC and Benign classes are not balanced in a fault injection experiment. To enable a fair analysis, the dataset was balanced using downsampling on the Benign (major) class. Table I summarizes the characteristics of the final dataset after preprocessing.
| Benchmark | #Simulations | #Features | #(Giga) Ticks | % Benign | % SDC | % crash/hang |
|---|---|---|---|---|---|---|
| qsort | 25,000 | 366 | 86.5 | 72 .1 | 25.6 | 2.3 |
| dijkstra | 29,180 | 378 | 64.2 | 79 .2 | 20.2 | 0.6 |
| susan | 21,440 | 363 | 35.1 | 67.9 | 26.5 | 5.6 |
| sha | 13,809 | 359 | 18.5 | 72.6 | 27.2 | 0.2 |
| bitcount | 25,000 | 360 | 9.8 | 81 .2 | 15.6 | 3.2 |
| basicmath | 25,000 | 358 | 6.5 | 92.7 | 6.4 | 0.9 |
Since part of the exploration aims to understand if the temporal dimension adds any information to the collected data, increasing the fault detection accuracy, the execution of the different benchmarks was profiled over time by collecting gem5 stats with different granularities, i.e., every 10, 20, 50, and 100 simulation ticks, where the total ticks within a benchmark are given in Table I. The table also reports, for each benchmark, the features included in the model investigation, the number of ticks for executing it (expressed in Giga), and the percentage of Benign, SDC and crash and hangs classifications among the faulty runs.
III Results
This section reports a comprehensive analysis of the collected dataset to try to answer the question proposed at the beginning of this paper, i.e., if microarchitectural features are sufficient to build machine learning models able to detect soft errors in microprocessor-based systems.
III-A Data analysis
The first goal of the analysis is a preliminary inspection of the quality of the selected features. For this purpose, we used Principal Component Analysis (PCA). Figure 2 provides a visual representation of the datasets for the six benchmarks plotting the first two principal components.
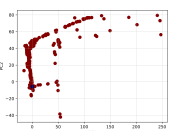
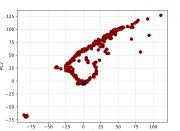
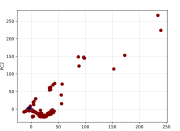
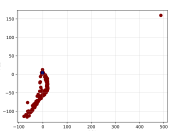
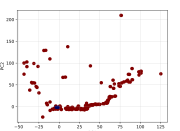
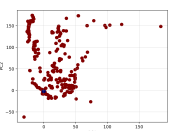
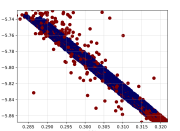
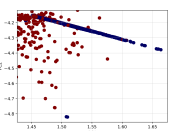
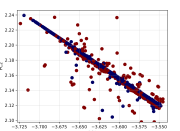
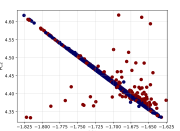
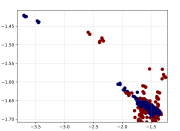
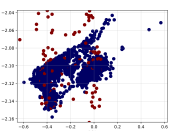
When analyzing the complete datasets (Figures 2(a), 2(b), 2(c), 2(d), 2(e), and 2(f)), benign executions (blue dots) cluster in a small portion of the plot, while faulty executions (red dots) instead scatter over the plot, this suggests that the corruption of a single bit generates a significant deviation in the microarchitecture’s internal features, resulting in cases that can be detectable from a reliability standpoint. However, Figures 2(g), 2(h), 2(i), 2(j), 2(k), and 2(l) highlight the presence in all datasets of a Hard-To-Detect Region (HTDR) of overlapping samples of the two classes. Since AI models are known to struggle with such data distributions, these regions must be carefully considered to avoid a significant loss in accuracy.
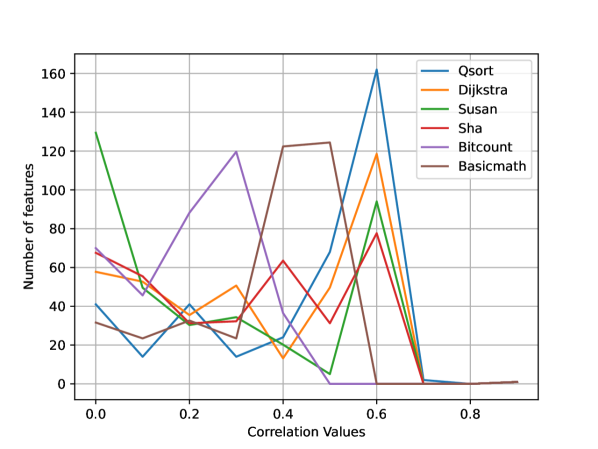
Up to now, the analysis considered all the features in the dataset, which are a considerable number, even after the data cleaning. Therefore, analyzing the correlation of each attribute with the final fault classification can guide through a feature selection phase. Pearson’s correlation coefficient was used to perform this analysis due to its minor sensitivity to false positives. Figure 3 shows the distribution of the correlation values for the six benchmarks. The analysis highlights different results depending on the benchmark. In the case of qsort, dijkstra, susan, and sha, most features correlate more than 0.5 with faulty executions. This means that many microarchitectural features can be used to detect a faulty run. Results for basicmath are weaker but still acceptable, while bitcount reports a low correlation. This aspect will be better investigated in the next section.
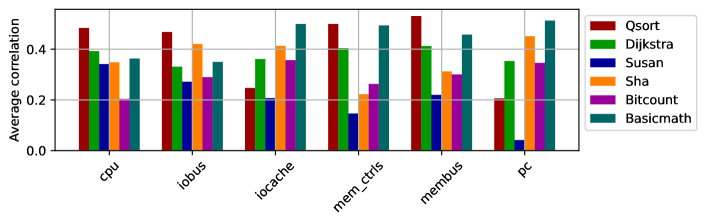
Moving to the microarchitectural level, following the gem5 hierarchical organization of features into six main sub-classes, Figure 4 shows the correlation of each group with faulty executions. Each of the six main sub-classes of attributes shows differences depending on the benchmarks (Figure 4(a)). However, when the correlation is significant, few features emerge as indicators of faulty execution, such as the ones related to memory accesses (mem_ctrls and membus), to the input/output bus and the CPU. This last class includes many internal features, so it is worth analyzing them in more detail.
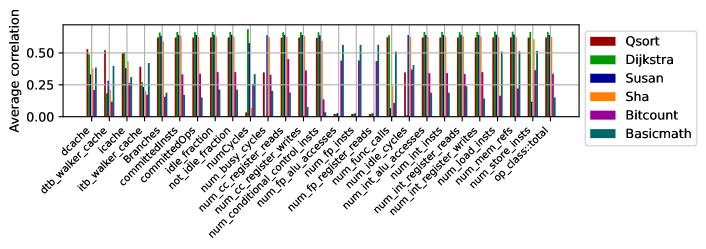
Figure 4(b) reports the CPU class features split into its main sub-classes, showing a higher variability in attribute correlation across different benchmarks. Looking at qsort, the benchmarks with higher correlation, the sub-classes mostly affected are accessed to both data and instruction caches, meaning that faults impact the instruction fetch order and the access to data. Follows the number of branches, an indication that the execution flow has been modified, and the committed instructions and operations, evidence of what has been seen with the cache accesses. Eventually, deviations are also evident in the number of function calls, the internal registers’ read and write operations, and the main memory accesses for load and store operations. This analysis suggests that when single bit-flips significantly impact the program execution flow, the microarchitectural features deviate from average, allowing detection. This important characteristic will be further discussed when considering using these datasets with dedicated machine-learning models.
Finally, the dataset was analyzed considering the temporal dimension by sampling all features at different simulation times. The observed behavior is consistent with the one observed in the previous cumulative case. Interestingly, fault executions can still be detected, and HTDR areas are present, suggesting that using microarchitectural features, it is feasible to start the detection early during the execution instead of waiting for the program to end.
To summarize, this preliminary analysis allowed us to draw some initial insights. A reasonably simple model is expected to provide good fault detection capabilities for the data that can be separated. At the same time, pure microarchitectural attributes might prove insufficient due to HTDR. Including the temporal dimension to the data is not improving the fault detection but confirms that the detection can happen during the execution and not only at the end.
III-B Machine learning models
Starting from the preliminary analysis proposed in subsection III-B, this section studies how different machine learning models can be trained to detect soft errors based on the considered attributes, highlighting strengths and weaknesses. For this analysis, the datasets were split as follows: 60% for the training set, 15% for the validation set, and 25% for the test set. By using correlations (see Figure 3), we were able to identify the following collection of 19 features consistently highly correlated in most benchmarks (the reader may refer to the gem5 documentation for a detailed description of each feature):
1.  system.cpu.dtb_walker_cache.tags.age_task_id_blocks_1024::2
2.  system.cpu.icache.tags.age_task_id_blocks_1024::2
3.  system.membus.pkt_count_system.apicbridge.master::total
4.  system.membus.trans_dist::MessageResp
5.  system.iobus.pkt_size_system.pc.south_bridge.io_apic.
int_master::total
6.  system.iobus.pkt_count_system.pc.south_bridge.io_apic.
int_master::system.apicbridge.slave
7.  system.membus.trans_dist::MessageReq
8.  system.membus.pkt_size_system.apicbridge.master::system.
cpu.interrupts.int_slave
9.  system.membus.pkt_count_system.apicbridge.master::system.
cpu.interrupts.int_slave
10. system.iobus.pkt_size_system.pc.south_bridge.io_apic.
int_master::system.apicbridge.slave
11. system.iobus.trans_dist::MessageResp
12. system.membus.pkt_size_system.apicbridge.master::total
13. system.iobus.pkt_count_system.pc.south_bridge.io_apic
.int_master::total
14. system.iobus.trans_dist::MessageReq
15. system.membus.pkt_size_system.cpu.dcache.mem_side::system
.cpu.interrupts.pio
16. system.membus.pkt_count_system.cpu.dcache.mem_side::system
.cpu.interrupts.pio
17. system.cpu.dcache.tags.total_refs
18. system.iocache.demand_miss_rate::total
19. system.iocache.ReadReq_miss_rate::total
They were used to demonstrate that a set of features can work with several benchmarks. All experiments used a 19-32-2 network architecture composed of three layers, including 19, 32, and 2 neurons. These numbers were tuned using trial and error.
The first model considered is the Fully Connected Feed Forward Neural Network (FC-FFNN), trained using the cumulative dataset.
| Benchmark | Accuracy | F1 score |
|---|---|---|
| qsort | 91.10 | 79.91 |
| dijkstra | 92.19 | 75.67 |
| susan | 88.79 | 71.92 |
| sha | 87.03 | 68.45 |
| bitcount | 90.75 | 56.81 |
| basicmath | 96.22 | 59.66 |
Table II reports high accuracy, confirming the hypothesis of soft error detection based on the collected features. Nevertheless, the accuracy alone may be misleading. The F1 score is lower than the accuracy. This is mainly due to the recall, which drops due to the HTDR. To confirm the quality of the model, Figure 5 investigates the performance of different models trained using an increasing number of features starting from the top correlated ones. In terms of accuracy, using just a small subset of features already enables the detection of 80% of the faults, and adding more features does not lead to significant improvements. However, these results consistently show controversial results with the F1 score. By performing a more detailed analysis, we could directly relate this with the complexity of the benchmark and, in particular, its control flow and how the HTDR populate the data. As a further confirmation, an attempt to train a model on a reduced dataset focused on the HTDR reported deficient performance. This analysis suggests that microarchitecture-level features can only partially detect soft errors, contradicting previous works such as da Rosa et al. [18]. This problem seems less severe in control-flow intensive benchmarks such as qsort, dijkstra, susan and sha while exploding in simple linear algorithms like basicmath and bitcount. This suggests that data-related features are probably required in addition to the microarchitecture attribute to cover the gap.


After analyzing the cumulative dataset, the analysis moves to new models considering the time dimension using data collected at different checkpoints.
The first one accounts for a flat dataset composed of features and trains the same FC-FFNN model used before. Table III reports no significant gain in performance metrics, thus confirming what was observed in subsection III-A, i.e., the temporal dimension is not improving the results but allows for earlier detection.
| Benchmark | Accuracy | F1 score |
|---|---|---|
| qsort | 92.60 | 83.07 |
| dijkstra | 91.67 | 59.00 |
| susan | 87.95 | 69.67 |
| sha | 87.14 | 68.24 |
| bitcount | 90.19 | 58.42 |
| basicmath | 96.38 | 62.29 |
A second model, based on Long-Short Term Memory (LSTM), including temporal information by design, was trained on the time-expanded dataset. Table IV reports the performance of the LSTM model, confirming no gain on the different metrics.
| Benchmark | Accuracy | F1 score |
|---|---|---|
| qsort | 91.62 | 81.09 |
| dijkstra | 90.25 | 68.98 |
| susan | 87.83 | 82.50 |
| sha | 86.85 | 69.08 |
| bitcount | 90.08 | 54.74 |
| basicmath | 95.61 | 53.64 |
| qsort | djkstra | susan | sha | basicmath | bitcount | |||||||
|---|---|---|---|---|---|---|---|---|---|---|---|---|
| Temporal step | Acc. | F1 score | Acc. | F1 score | Acc. | F1 score | Acc. | F1 score | Acc. | F1 score | Acc. | F1 score |
| 1 | 80.09 | 39.26 | 81.07 | 13.72 | 72.62 | 9.13 | 73.48 | - | 83.99 | - | 92.86 | - |
| 2 | 87.78 | 69.99 | 85.96 | 44.79 | 75.06 | 13.36 | 74.72 | 9.55 | 83.68 | - | 93.67 | - |
| 3 | 87.38 | 67.13 | 90.40 | 67.84 | 80.56 | 40.83 | 74.61 | 8.61 | 84.70 | 10.42 | 93.36 | - |
| 4 | 90.53 | 78.02 | 90.12 | 60.36 | 87.08 | 68.12 | 75.86 | 17.38 | 85.54 | 21.63 | 94.31 | 24.46 |
| 5 | 91.44 | 80.15 | 90.70 | 64.65 | 87.86 | 68.93 | 80.79 | 34.31 | 86.93 | 30.38 | 94.78 | 36.54 |
| 6 | 91.08 | 80,00 | 91.38 | 72.14 | 87.52 | 67.57 | 83.27 | 42.56 | 88.18 | 40.20 | 95.78 | 51.40 |
| 7 | 91.23 | 80.13 | 90.82 | 70.14 | 87.08 | 66.86 | 87.25 | 65.92 | 88.90 | 45.24 | 95.93 | 58.28 |
| 8 | 91.72 | 81.56 | 90.44 | 69.99 | 87.84 | 69.86 | 86.77 | 62.85 | 89.73 | 49.47 | 96.33 | 63.91 |
| 9 | 91.80 | 80.86 | 90.55 | 69.46 | 88.24 | 69.65 | 86.94 | 68.62 | 91.26 | 42.27 | 96.35 | 60.21 |
| 10 | 91.95 | 81.39 | 91.24 | 73.06 | 88.07 | 69.69 | 86.83 | 67.66 | 89.99 | 57.10 | 96.36 | 61.93 |
Since the Fault detection latency can be crucial in safety-critical applications, an FC-FFNN model was then trained on the cumulative dataset and tested on cumulative data available at different checkpoints to understand the early detection of faults. Table V shows the results obtained with ten checkpoints. The F1 score with no values (-) is due to insufficient data to evaluate precision and recall. Considering that the fault injection is uniformly distributed in time, results confirm that error detection could be achieved without waiting for the end of the program execution. This is important to minimize the error detection latency. As expected, the model’s performance drops during the early checkpoints and rises while data are collected.
IV Conclusions
This paper performed a data-driven investigation to answer the fundamental question of using AI-powered hardware soft error detectors: are micro-architectural features able to explain faulty executions? The results of the analysis were controversial. While in terms of accuracy, results suggest a positive answer, the presence of HTDRs suggests that pure microarchitectural attributes are insufficient, especially for simple tasks. Additional features are probably required if the corruption is limited to the data domain. In conclusion, the results in this paper are preliminary. It is clear that further investigation is needed, both considering additional benchmarks and investigating a new set of features.
References
- [1] T. Heijmen, Soft Errors from Space to Ground: Historical Overview, Empirical Evidence, and Future Trends, 09 2010, pp. 1–25.
- [2] M. Portolan et al., “Alternatives to fault injections for early safety/security evaluations,” in 2019 IEEE European Test Symposium (ETS), 2019, pp. 1–10.
- [3] S. Mittal and J. S. Vetter, “A survey of techniques for modeling and improving reliability of computing systems,” IEEE Transactions on Parallel and Distributed Systems, vol. 27, no. 4, pp. 1226–1238, 2016.
- [4] S. Sayil, “A survey of circuit-level soft error mitigation methodologies,” Analog Integrated Circuits and Signal Processing, vol. 99, no. 1, pp. 63–70, 2019.
- [5] A. Vallero et al., “Syra: Early system reliability analysis for cross-layer soft errors resilience in memory arrays of microprocessor systems,” IEEE Transactions on Computers, vol. 68, no. 5, pp. 765–783, 2019.
- [6] G. Kestor et al., “Comparative analysis of soft-error detection strategies: A case study with iterative methods,” in Proceedings of the 15th ACM International Conference on Computing Frontiers, ser. CF ’18. New York, NY, USA: Association for Computing Machinery, 2018, pp. 173–182.
- [7] E. W. Wächter et al., “Survey of lockstep based mitigation techniques for soft errors in embedded systems,” in 2019 11th Computer Science and Electronic Engineering (CEEC), 2019, pp. 124–127.
- [8] S. D. Carlo et al., “On-line instruction-checking in pipelined microprocessors,” in 2008 17th Asian Test Symposium, 2008, pp. 377–382.
- [9] A. Meixner et al., “Argus: Low-cost, comprehensive error detection in simple cores,” in 40th Annual IEEE/ACM International Symposium on Microarchitecture (MICRO 2007), 2007, pp. 210–222.
- [10] R. Vemu et al., “A low-cost concurrent error detection technique for processor control logic,” in 2008 Design, Automation and Test in Europe, 2008, pp. 897–902.
- [11] A. Bosio et al., “Toward the hardening of real-time operating systems,” in 2022 IEEE International Symposium on Defect and Fault Tolerance in VLSI and Nanotechnology Systems (DFT), 2022, pp. 1–6.
- [12] A. Carpegna et al., “Artificial resilience in neuromorphic systems,” in International Symposium on Highly-Efficient Accelerators and Reconfigurable Technologies, ser. HEART2022. New York, NY, USA: Association for Computing Machinery, 2022, pp. 112–114.
- [13] H. Khosrowjerdi et al., “Virtualized-fault injection testing: A machine learning approach,” in 2018 IEEE 11th International Conference on Software Testing, Verification and Validation (ICST), 2018, pp. 297–308.
- [14] A. Vishnu et al., “Fault modeling of extreme scale applications using machine learning,” in 2016 IEEE International Parallel and Distributed Processing Symposium (IPDPS), 2016, pp. 222–231.
- [15] V. Vassiliadis et al., “Artificial neural networks for online error detection,” arXiv preprint arXiv:2111.13908, 2021.
- [16] C. Wang et al., “Neural network based silent error detector,” in 2018 IEEE International Conference on Cluster Computing (CLUSTER). IEEE, 2018, pp. 168–178.
- [17] S. Dutto et al., “Exploring deep learning for in-field fault detection in microprocessors,” in 2021 Design, Automation & Test in Europe Conference & Exhibition (DATE). EDAA, 2021, pp. 1456–1459.
- [18] F. R. da Rosa et al., “Using machine learning techniques to evaluate multicore soft error reliability,” IEEE Transactions on Circuits and Systems I: Regular Papers, vol. 66, no. 6, pp. 2151–2164, 2019.
- [19] N. Nosrati et al., “Mlc: A machine learning based checker for soft error detection in embedded processors,” in Proceedings of the 2022 IEEE 28th International Symposium on On-Line Testing and Robust System Design (IOLTS), 2022, pp. 1–6.
- [20] G. Yalcin et al., “Fimsim: A fault injection infrastructure for microarchitectural simulators,” in 2011 IEEE 29th International Conference on Computer Design (ICCD). IEEE, 2011, pp. 431–432.
- [21] N. Binkert et al., “The gem5 simulator,” SIGARCH Comput. Archit. News, vol. 39, no. 2, pp. 1–7, Aug. 2011.
- [22] S. Di Carlo et al., “A fault injection methodology and infrastructure for fast single event upsets emulation on xilinx sram-based fpgas,” in 2014 IEEE International Symposium on Defect and Fault Tolerance in VLSI and Nanotechnology Systems (DFT), 2014, pp. 159–164.
- [23] G. Papadimitriou and D. Gizopoulos, “Demystifying the system vulnerability stack: Transient fault effects across the layers,” in Proceedings of the 48th Annual International Symposium on Computer Architecture, ser. ISCA ’21. IEEE Press, 2021, pp. 902–915.
- [24] A. Chatzidimitriou and D. Gizopoulos, “Anatomy of microarchitecture-level reliability assessment: Throughput and accuracy,” in 2016 IEEE International Symposium on Performance Analysis of Systems and Software, ISPASS 2016, Uppsala, Sweden, April 17-19, 2016. IEEE Computer Society, 2016, pp. 69–78.
- [25] A. Benso et al., “A functional verification based fault injection environment,” in 22nd IEEE International Symposium on Defect and Fault-Tolerance in VLSI Systems (DFT 2007), 2007, pp. 114–122.
- [26] M. R. Guthaus et al., “Mibench: A free, commercially representative embedded benchmark suite,” in Proceedings of the Workload Characterization, 2001. WWC-4. 2001 IEEE International Workshop, ser. WWC ’01. USA: IEEE Computer Society, 2001, pp. 3–14.
- [27] R. Ragel and S. Parameswaran, Microarchitectural Support for Security and Reliability - An Embedded Systems Perspective, 01 2008.