The production of ionizing photons in UV-faint galaxies
Abstract
Aims. The demographics of the production and escape of ionizing photons from UV-faint early galaxies is a key unknown in discovering the primary drivers of reionization. With the advent of JWST it is finally possible to observe the rest-frame optical nebular emission from individual sub- galaxies to measure the production rate of ionizing photons, .
Methods. Here we study a sample of 370 galaxies spanning (median ) with deep multi-band HST and JWST/NIRCam photometry covering the rest-UV to optical from the GLASS and UNCOVER JWST surveys. Our sample includes 102 galaxies with Lyman-alpha emission detected in MUSE spectroscopy. We use H fluxes inferred from NIRCam photometry to estimate the production rate of ionizing photons which do not escape these galaxies .
Results. We find median , with a broad intrinsic scatter 0.42 dex, implying a broad range of galaxy properties and ages in our UV-faint sample. Galaxies detected with Lyman-alpha have dex higher , which is explained by their higher H EW distribution, implying younger ages, higher sSFR and thus more O/B stars. We find significant trends of increasing with increasing H EW, decreasing UV luminosity, and decreasing UV slope, implying the production of ionizing photons is enhanced in young galaxies with assumed low metallicities. We find no significant evidence for sources with very high ionizing escape fraction () in our sample, based on their photometric properties, even amongst the Lyman-alpha selected galaxies.
Conclusions. This work demonstrates that considering the full distribution of across galaxy properties is important for assessing the primary drivers of reionization.
Key Words.:
Galaxies: emission lines – Galaxies: high-redshift – Galaxies: evolution1 Introduction
In recent years, we have obtained increasing evidence that the reionization of hydrogen happened fairly late, approximately one billion years after the Big Bang (), with a mid-point around (e.g., Fan et al., 2006; Stark et al., 2010; McGreer et al., 2015; Mason et al., 2018; Davies et al., 2018; Qin et al., 2021; Planck Collaboration et al., 2020; Bolan et al., 2022). However, there is evidence for significant star formation before this time (e.g., Oesch et al., 2018; Hashimoto et al., 2018; McLeod et al., 2021) thus it appears that reionization lags behind galaxy formation. The reason for this lag is unknown: we are still lacking a full physical understanding of the reionization process. In particular, we still do not know which types of galaxies drive the process, i.e. which physical mechanisms mediate the production and escape of ionizing photons from galaxies. In order to produce such a late and fairly rapid reionization, the ionizing population could have been dominated by low mass, UV-faint galaxies with a low () average escape fraction (e.g., Mason et al., 2019; Qin et al., 2021). Alternatively, rarer more massive galaxies with higher escape fractions could have been responsible (e.g., Sharma et al., 2017; Naidu et al., 2020). With only measurements of the timing of reionization, these scenarios are degenerate, thus physical priors on the ionizing properties of galaxies across cosmic time are necessary to pinpoint the sources of reionization.
The total ionizing output of galaxies can be simply parameterized (e.g., Madau et al., 1999; Robertson et al., 2010) as the product of the production rate of ionizing photons relative to non-ionizing UV photons, (determined by the stellar populations, e.g., Stanway et al., 2016), and the fraction of ionizing photons which escape the interstellar medium (ISM) into the intergalactic medium (IGM), (determined by the structure and ionization state of the ISM, likely shaped by star formation and feedback, e.g., Trebitsch et al., 2017; Ma et al., 2020). Both of these quantities are also expected to vary with time in an individual galaxy, for example due to the lifetime and properties of young stellar populations, and the effects of feedback and bursty star formation on the ISM.
While we can easily observe the non-ionizing UV photons from galaxies, the high optical depth of the IGM to ionizing photons makes direct measurements of the escaping ionizing spectrum statistically unlikely at (Inoue et al., 2014; Becker et al., 2021; Vanzella et al., 2018). Alternatively, fluxes of non-resonant recombination lines, emitted by gas which was ionized in HII regions around massive stars, can crucially measure the flux of ionizing photons which do not escape galaxies. In particular, H emission can be used to directly estimate (e.g., Leitherer & Heckman, 1995; Bouwens et al., 2016; Shivaei et al., 2018; Emami et al., 2020). As is inferred to be low () on average for Lyman-break galaxies at (Steidel et al., 2018; Begley et al., 2022; Pahl et al., 2022) measurements of H should trace the intrinsic production of ionizing photons reasonably well. can also be inferred from the strength of [OIII]+H emission, though due to the dependence of [OIII] emission on metallicity and ionization parameter, the correlation is not as tight as with H (e.g., Chevallard et al., 2018).
Previous work at , where direct H spectroscopy has been possible from the ground, has found a mean , with a scatter of dex, likely dominated by variations in stellar populations between galaxies (e.g., Shivaei et al., 2018; Tang et al., 2019). At higher redshifts where H redshifts into the infra-red, broad-band photometry with Spitzer has been used extensively to estimate H line fluxes (e.g., Schaerer & de Barros, 2009; Shim et al., 2011; Stark et al., 2013; Smit et al., 2015; Bouwens et al., 2016; Lam et al., 2019; Maseda et al., 2020; Stefanon et al., 2022).
However, due to the limited spatial resolution and sensitivity of Spitzer, previous works had been limited to studying in isolated, bright () galaxies where deblending IRAC photometry was possible (e.g,. Bouwens et al., 2016) and stacks for fainter galaxies (e.g., Lam et al., 2019; Maseda et al., 2020). With JWST it is finally possible to extend these studies to individual UV-faint galaxies (Endsley et al., 2022), and obtain rest-frame optical spectroscopy at (e.g., Sun et al., 2022; Williams et al., 2022).
Results from previous analyses have been intriguing but require further investigation. Using stacked IRAC photometry Lam et al. (2019) found no significant evidence for a strong correlation of with . However, Maseda et al. (2020) found a population of extremely UV-faint () galaxies selected as Ly emitters in deep MUSE observations, which have very elevated compared to higher luminosity galaxies and at fixed H EW, implying these efficient ionizing galaxies are particularly young and low metallicity. It is thus important to examine the distribution of at low UV luminosities, and to compare galaxies with and without Ly emission to better understand the demographics of the ionizing population.
Furthermore, using early JWST NIRCam data Endsley et al. (2022) discovered a population of UV-faint () galaxies at with high sSFR but low EW [OIII]+H inferred from photometry. The high sSFR would imply high due to the increased abundance of O and B stars. To explain the low [OIII]+H EW, Endsley et al. (2022) suggest either these galaxies have extremely low metallicities (reducing oxygen abundance), or alternatively, all nebular lines are reduced. A reduction in all nebular lines could be due to either them being produced in density-bounded HII regions with very high ionizing escape fraction (e.g. Zackrisson et al., 2013; Marques-Chaves et al., 2022), or recent cessation of star formation. At both [OIII]+H and H are visible in NIRCam photometry, enabling us to test these scenarios.
In this paper we make use of deep multi-band HST/ACS, WFC3 and JWST/NIRCam imaging with overlapping MUSE observations, enabling us to blindly detect a spectroscopic sample with precision rest-frame ultra-violet to optical photometry. We measure the distribution of over a broader luminosity range () than previously possible in individual galaxies, due to the excellent resolution and sensitivity of NIRCam at rest-optical wavelength compared to Spitzer/IRAC, and the power of gravitational lensing. We explore correlations of with empirical galaxy properties. We find significant trends of increasing with decreasing UV luminosity, UV slope and with increasing H EW, all implying the strongest ionizers are young sources with expected low metallicities. We also explore whether our sample shows evidence for very low metallicities or extremely high escape fraction.
The paper is structured as follows. In Section 2 we describe the photometric and spectroscopic data for our study. In Section 3 we describe how we infer the ionizing production rate and we describe our results of correlations between and other galaxy properties, and comparison to the literature in Section 4. We discuss our results and state our conclusions in Section 6.
We assume a flat cosmology with , all magnitudes are in the AB system.
2 Data
For this work we select fields with multi-band HST/ACS and JWST/NIRCam imaging and overlapping MUSE spectroscopy. We select sources detected with Ly emission ( in MUSE) and sources with high probability of being in the same redshift range based on photometric redshift, and use the HST + JWST photometry to extract optical emission line fluxes. Below we describe the datasets and the selection of our sample.
2.1 Imaging
We use JWST NIRCam imaging in parallel to and of the cluster Abell 2744 from the GLASS-JWST program ERS-1324 (PI Treu Treu et al., 2022) and UNCOVER111https://www.stsci.edu/jwst/science-execution/program-information.html?id=2561 program GO-2561 (co-PIs Labbé, Bezanson).
The GLASS-JWST NIRCam observations discussed in this paper were taken in parallel to NIRISS observations of the cluster Abell 2744 on June 28-29 2022. They are centered at RA deg and Dec deg, and consist of imaging in seven bands: F090W (total exposure time: 11520 seconds), F115W (11520 s.), F150W (6120 s.), F200W (5400 s.), F277W (5400 s.), F356W (6120 s.), and F444W (23400 s.). The UNCOVER NIRCam observations of the Abell 2744 cluster were taken on November 2-15 2022. They are centered at RA= deg and Dec deg and consist of imaging in seven bands: F115W (10823 s.), F150W (10823 s.), F200W (6700 s.), F277W (6700 s.), F356W (6700 s.), F410M (6700 s.) and F444W (8246 s.).
In our analysis, we also include new and archival HST imaging, from which ACS imaging is particularly important for constraining photometric redshifts. This includes new HST/ACS data in F606W (59530 s.), F775W (23550 s.), and F814W (123920 s) from HST-GO/DD program 17231222https://www.stsci.edu/cgi-bin/get-proposal-info?id=17231&observatory=HST (PI Treu), as well as archival data acquired under the Hubble Frontier Fields program (HST-GO/DD-13495, PI Lotz, Lotz et al., 2017), BUFFALO (HST-GO-15117, PI Steinhardt, Steinhardt et al., 2020) and programs HST-GO-11689 (PI Dupke), HST-GO-11386 (PI Rodney), HST-GO-13389 (PI Siana), HST-GO-15940 (PI Ribeiro) and HST-SNAP-16729 (PI Kelly). Not all HST bands cover every object in our sample, but we only keep objects in our sample that have a well-constrained photometric redshift, usually meaning that there is ACS coverage (see Section 2.4). We also include HST/WFC3 imaging for completeness, but these are generally not as constraining as the NIRCam fluxes.
The image reduction and calibration, and the methods used to detect sources and measure multi-band photometry in both fields closely follow that of Brammer et al., (in prep). Briefly, we pull calibrated images from the MAST archive333https://archive.stsci.edu and process them with the grizli pipeline (Brammer et al., 2022). The pipeline first aligns the exposures to external catalogs and to each other and corrects for any distortion within the image. Following this, we subtract a sky-level background, divide out flat-field structure using custom flat-field images, and correct for noise. We also correct for NIRCam image anomalies, which include persistence, any remaining cosmic rays, and ‘snowballs’ (see Rigby et al., 2022). Finally, we apply zeropoint corrections calculated by G. Brammer444https://github.com/gbrammer/grizli/pull/107 and drizzle all exposures to a common pixel grid.
For source detection, we use SEP (Barbary, 2018) to perform aperture photometry on the F444W detection image in each field.
2.2 VLT/MUSE spectroscopy
MUSE spectroscopy in the Abell 2744 cluster were obtained through ESO program 094.A-0115 (PI Richard) and are described by Mahler et al. (2018) and Richard et al. (2021). We use their publicly available catalog to select Ly emitting galaxies. The data comprise a 4 sq. arcmin mosaic centered on the cluster core. Four 1 sq. arcmin quadrants were observed for a total of 3.5, 4, 4 and 5 hours respectively, and the center of the cluster was observed for an additional 2 hours. The median line flux 1 uncertainty in the MUSE data is erg s-1 cm-2. This corresponds to an 5 EW limit of Å over for a galaxy with (the median for our sample, before accounting for magnification, as EW is invariant under magnification).
VLT/MUSE spectroscopy in the GLASS-JWST NIRCam fields were obtained through a new ESO DDT program 109.24EZ.001 (co-PIs Mason, Vanzella) on the nights of July 28 and August 20 2022. The data comprise 5 pointings (4 pointings – 4 sq. arcmin – overlapping with NIRCam imaging) each with 1 hour exposure time. The raw data are publicly available on the ESO archive555http://archive.eso.org/wdb/wdb/eso/sched_rep_arc/query?progid=109.24EZ.001. The reduction, calibration and source detection methods used for this work are identical to techniques described in previous works (Caminha et al., 2017, 2019). A full assessment of the depth is ongoing but based on the hour depth of the Mahler et al. (2018) observations described above, we estimate a 5 EW limit of Å in these shallower data.
In this work we use 102 spectroscopic confirmations at : 42 from the GLASS-JWST NIRCam fields and 60 from the Abell 2744 cluster field.
2.3 Gravitational lensing magnification
For the galaxies detected in the core of the Abell 2744 cluster we correct for gravitational lensing magnification using the model by Bergamini et al. (2022). The median magnification of the sample is with 90% of the galaxies having . We remove sources with a magnification with (12 sources) due to high uncertainties in the model near the critical curves. The galaxies in the parallel fields are away from the cluster core where the magnification is expected to be modest (), we do not account for magnification of those sources.
2.4 Sample selection
For this work, we focus on selecting a sample of galaxies at with high purity. We select 102 MUSE Ly -detected galaxies with overlapping HST/ACS and JWST/NIRCam data as described above. We also select a comparison sample of galaxies based on peak photometric redshift, within the same footprint as the MUSE observations, which we expect to have slightly lower H EW than the Ly selected sample.
We find the photometric redshift distribution of all sources detected as described in Section 2.1 using EAZY (Brammer et al., 2008), given all available photometric bands. To build a photometric sample with high purity, following Bouwens et al. (2016), we select sources with the peak of their photometric redshift between , and keep only sources which have 90% of the redshift probability density between of the peak of their distribution. The resulting high purity photometric sample consists of 268 galaxies.
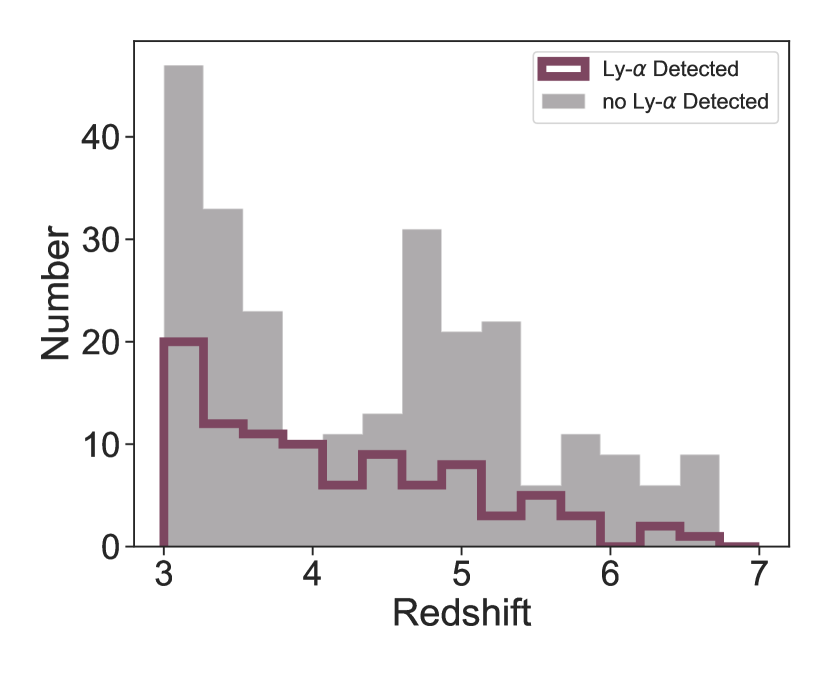
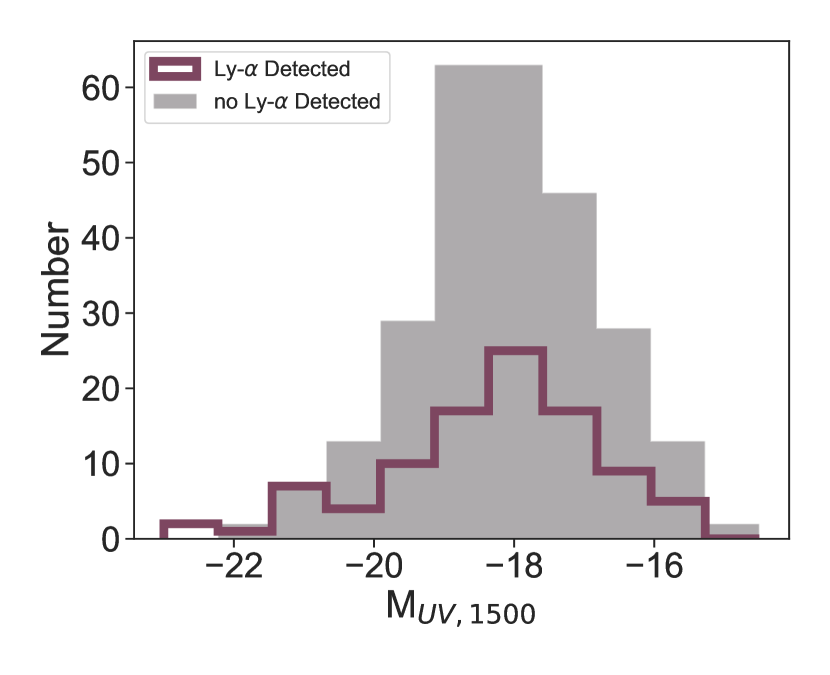
The redshift and UV magnitude distribution of our sample is shown in Figure 1. The median redshift of the full sample is 4.02, with the Ly -selected sample having median redshift 3.95. The median is -18.1, with a Kolmogorov-Smirnov (KS) test showing no significant difference between the Ly and photometrically selected samples.
3 Inferring the ionizing photon production rate
3.1 Inferring nebular emission line strengths from photometry
To estimate nebular emission line fluxes from broad-band photometry, we follow approaches in the literature and fit the spectral energy distribution (SED) to the full photometry, excluding bands we expect to contain strong nebular emission lines (e.g., Shim et al., 2011; Stark et al., 2013; Mármol-Queraltó et al., 2016; Bouwens et al., 2016). This provides us with a model for the continuum flux in those bands which we can subtract from the observed photometry to infer the line flux.
We use BAGPIPES to fit SEDs (Carnall et al., 2018). We adopt BC03 (Bruzual & Charlot, 2003) templates, and exclude any nebular emission contribution. We do not consider any broadbands where H or [OIII]+H are observed according to each galaxy’s redshift. For ease of comparison to the literature (e.g., Maseda et al., 2020; Lam et al., 2019), we assume a Chabrier (2003) Initial Mass Function and an Small Magellenic Cloud (SMC, Prevot et al., 1984) dust attenuation law, allowing to vary from mag. Because metallicity is not well known at the range of redshifts we explore, we allow metallicity to vary from . Because star formation histories are notoriously difficult to constrain at high-redshift (Strait et al., 2021), we assume an exponentially rising delayed star formation history, allowing to vary freely. For the spectroscopically confirmed Lyman emitters, we fix the redshift at the Ly redshift. For our photometric sample, we use the photometric redshift obtained from EAZY with uniform prior with . (see Section 2.4).
We then compare the SED model of the galaxy’s continuum to the broadbands where H or [OIII]+H fall. We multiply the non-nebular SED posteriors with the transmission of the aforementioned broadbands to obtain the contribution of the galaxy’s continuum to the observed flux. By subtracting this continuum flux contribution to the observed photometry, we then are able to recover the flux distributions of H and [OIII]+H emission lines for each galaxy. We compared our measurements with a sample of 6 galaxies with [OIII]+H EW measurements from the GLASS-ERS program using JWST/NIRISS (Boyett et al., 2022a), finding that our method recovers the EW of these sources within %. A full comparison of these photometric inference methods is left to future work.
There are some limitations to our method for obtaining line fluxes, such as contamination from the 4000-Å break in the broadband containing [OIII]+H, the chance that the line falls outside the effective width of any of our broadband filters, or H and [OIII]+H falling on the same band. We consider a contribution of 6.8% from [NII] to the calculated H flux, and 9.5% from [SII] according to Anders & Fritze-v. Alvensleben (2003). We remove galaxies with a poor (50) score on their SED fit, we choose these value by ignoring all galaxies on the high-end of the distribution.
The advantage of this approach, unlike estimating line fluxes directly from the SED fitting, is that it does not depend strongly on star formation history assumptions and allows us to make a mostly empirical measurement of the line fluxes. We obtain comparable results using the flux in the band red-ward of H as the continuum flux, assuming a flat optical continuum (see also e.g., Maseda et al., 2020). Estimating other physical parameters such as star-formation rate and stellar mass from the SED fitting did not give reliable results, since it was too dependent on the initial assumptions, and needed extremely young ages (¡10Myrs) and an instantaneous burst of star-formation to recreate the observed nebular emissions..
The following results will consist of: 83 and 64 Ly -emitting galaxies with H and [OIII]+H emission line measurements respectively, a photometric sample of 220 and 203 galaxies with H, and [OIII]+H emission line measurements respectively. We see both lines in 62 Ly galaxies and 177 photometrically selected galaxies. We see no apparent biases in our distribution after narrowing down the sample. Nebular emission flux errors are derived from the 68% confidence interval of the resulting distributions.
3.2 Measuring UV absolute magnitude and slope
To infer the UV absolute magnitude, (magnitude at 1500Å) and slope we fit a power law (e.g., Rogers et al., 2013) to the fluxes from the HST and JWST bands. We perform the fit using a Markov Chain Monte Carlo sampling using the python module emcee (Foreman-Mackey et al., 2013). We assume flat priors for and , with bounds and , sufficient to explore the common value ranges for galaxies (e.g., Bouwens et al., 2014).
To obtain the photometric bands that are observing the UV-restframe of our galaxies, we exclude any bands that fall bluewards from Lyman- that might be affected by the Lyman-Break. For the same reason, we exclude bands redwards from the 4000Å break in the restframe. After these requirements, we are left with between 3 and 4 bands for each source. In the case of galaxies with Lyman- detected in MUSE, we use the line’s redshift. For photometrically-selected galaxies, in each call of the likelihood, we randomly draw a redshift from a Normal distribution , and select the appropriate photometric bands. For lensed sources, we consider magnifications and apply them following the same random draw method as redshift. We use the corresponding magnification and error obtained from the Bergamini et al. (2022) lensing model.
3.3 Determination of
We define the production rate of ionizing photons, . This is given by the ratio between the luminosity of observed ionizing photons and the intrinsic luminosity of the ionizing UV photons (e.g., Leitherer & Heckman, 1995):
| (1) |
where is the unattenuated H luminosity in erg s-1 and is the intrinsic UV luminosity density at 1500Å. The models from where the conversion factor is derived, assume a young population of massive stars equivalent to a massive HII region. We assume this type of environment to be similar to what we would find in young galaxies.
Because H is produced by the excitation of hydrogen gas from ionizing radiation that does not escape the galaxy, and we cannot measure directly in our sample, we note that we are obtaining the production rate of ionizing photons which did not escape the galaxy, .
We first calculate directly from the SED obtained in Section 3.1, after accounting for dust attenuation (Prevot et al., 1984). To obtain the intrinsic value of the UV luminosity, we take into account the dust attenuation following Lam et al. (2019), where the intrinsic UV luminosity is defined as . is the fraction of escaping UV photons not absorbed by the dust. For this, we use the Small Magellanic Cloud dust law defined by Prevot et al. (1984):
| (2) |
Where is the UV slope obtained in Section 3.2. Galaxies with slopes bluer than -2.23 are assumed dust-free and we do not correct for dust.
3.4 Correlation Analysis
For the purpose of studying the correlations between galaxy properties we use the python package linmix666https://github.com/jmeyers314/linmix to do Bayesian linear regression including intrinsic scatter and accounting for two-dimensional errors (Kelly, 2007). We fit for , where is the intrinsic scatter which is assumed to be normally distributed with variance . We recover the best fit trend line from the posteriors, as well the 68% confidence interval on the parameters. We report the results in Table 1 and show the best-fit line on plots.
4 Results
In the following section we present our results. In Section 4.1 we study the trends between , H EW, , and slope, and in Section 4.2 we investigate whether our sample shows evidence for very high ionizing photon escape fraction and/or very low metallicity galaxies.
4.1 Behaviour of
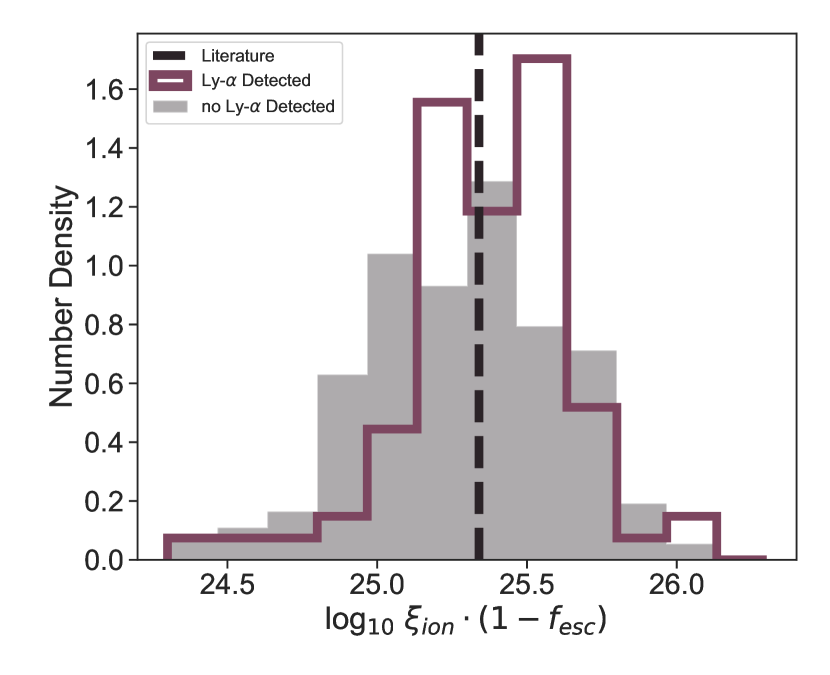
Figure 2 shows the distribution of for our Ly -selected and photometric samples. We find median values of 25.390.64 and 25.310.43 respectively; with 25.330.47 [Hz erg-1] for the complete data set. We find an intrinsic scatter of 0.42 dex, obtained by subtracting in quadrature the average uncertainty in ( dex) from the standard deviation of the observed distribution. The recovered intrinsic scatter is broader by dex than that found by Bouwens et al. (2016) and Shivaei et al. (2018) in galaxies. The broad distribution of is likely an outcome of the broad range of stellar populations in these galaxies, i.e. due to a range of star formation histories and thus ages, and stellar metallicity (see e.g., Shivaei et al., 2018).
We perform a two sample Kolmogorov–Smirnov (KS) test to test whether the Ly -selected and photometric samples are drawn from the same distribution. We recover p-value of 0.03, meaning it is likely that the underlying distributions are different, consistent with the results from (Saldana-Lopez et al., 2022), where a statistically significant difference is found between the distributions of LAEs and non-LAEs at . Given that galaxies with strong Ly emission also likely have high ionizing photon escape fractions (e.g., Verhamme et al., 2015; Dijkstra et al., 2016) it is likely that the intrinsic ionizing photon production efficiency of these galaxies is even higher than what we can infer based on H emission.
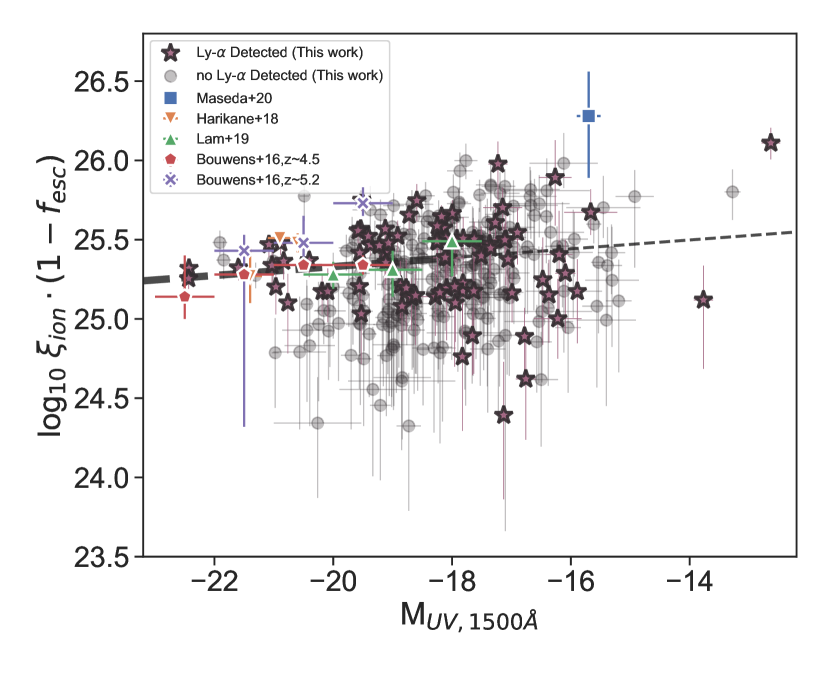
Figure 3 shows versus UV magnitude and demonstrates the revolutionary capabilities of MUSE and JWST/NIRCam: we are able to spectroscopically confirm extremely UV-faint galaxies via their high Ly EW and we are able to infer H, and therefore , from much fainter individual galaxies than was previously possible with Spitzer, where stacking was necessary at (e.g., Lam et al., 2019; Maseda et al., 2020). We reach dex lower than any previous studies at similar redshifts without the need of stacking methods. We can reach individual detections of very faint galaxies, . We also find results consistent with those at (Shivaei et al., 2018) and at for galaxies (Bouwens et al., 2016) and galaxies (Lam et al., 2019, where a stacking analysis was used), as shown in Figure 2. We note our observations demonstrate the large scatter in at fixed which was not possible to observe in previous analyses which used stacking of Spitzer photometry for UV-faint galaxies.
As described in Section 3.4 we perform a linear regression to assess correlations in our data. In contrast to Lam et al. (2019) we find significant evidence for a weak trend between and , where the highest tends to come from the faintest galaxies. Since our sample is not complete, we only study the correlation up to the peak of our distribution (=-18.14) in Figure 1. We find , but with large scatter (see Table 1).
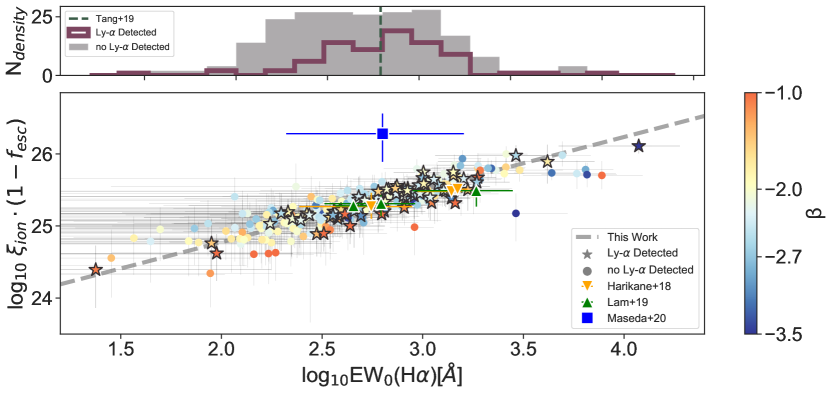
Figure 4 shows that follows a strong trend with H EW, as found in previous work (Harikane et al., 2018; Lam et al., 2019; Tang et al., 2019). Previous works were limited to only the highest H EW values, while we reach dex lower due to the sensitivity of NIRCam. This trend is consistent with a picture where is elevated in the youngest, most highly star-forming galaxies (e.g., Tang et al., 2019). We find . The measurement by Maseda et al. (2020), obtained from a stack of extremely UV-faint galaxies with high Ly EW, lies significantly above our sample and the rest of the literature, with higher at fixed H EW. As discussed by Maseda et al. (2020) this likely implies their sources have a much lower gas-phase metallicity than other samples.
We also find that Ly -selected galaxies have a higher H EW than the photometrically-selected sample, (median EW= Å compared to Å for the photometric sample). A two-sample Kolmogorov-Smirnov test establishes that the EW distributions of the two samples are different (p-value ). This is likely to be the primary driver of the increased distribution for the Ly -selected sample (Figure 2).
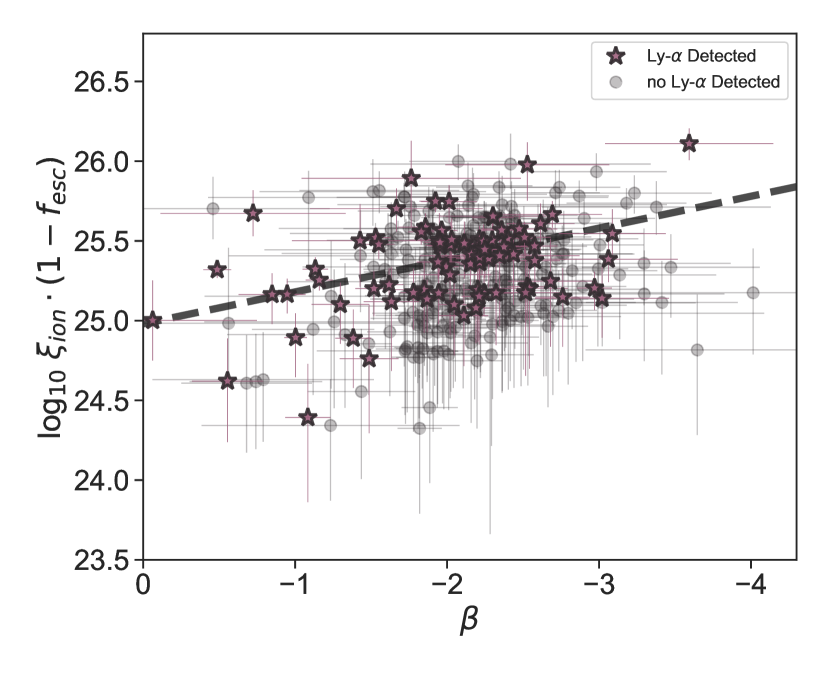
At fixed H EW we see a clear tendency for galaxies having very blue UV slopes to have elevated (Figure 4). This trend is also seen in the full sample - Figure 5, where we find high is weakly correlated to blue slope, but with large scatter. We find (see Table 1). Similar correlations have been seen at z6 (i.e. Ning et al., 2022). Using KS test we find no significant difference in the distributions for the Ly and photometric samples. Our sample has a median .
| Parameter | Slope, | Intercept, | Scatter variance, |
|---|---|---|---|
4.2 A search for high escape fraction and extremely low metallicity galaxies
As well as being a tracer for the ionizing photon production of galaxies, nebular emission lines are also sensitive to the escape fraction. Zackrisson et al. (2013) proposed that in galaxies with very high ionizing escape fraction, one would expect a reduction in nebular emission line strength (H EW Å) and extremely blue UV slopes () due to the lack of nebular continuum. Early JWST observations have discovered potentially very blue galaxies (Topping et al., 2022, though c.f. Cullen et al. 2022) and galaxies with weak nebular line emission yet high sSFR (via [OIII]+H, Endsley et al., 2022), potentially indicating a population with high ionizing escape fraction. However, the observation of low [OIII]+H line strengths could also be caused by very low gas-phase metallicity (decreasing the strength of [OIII] emission) or a recent turnoff in star formation (which would also decrease all nebular emission lines). Given the redshift range of our sample we can infer both H and [OIII]+H line strengths for 241 galaxies, allowing us to test these scenarios and to search for galaxies with high escape fraction. We obtained the [OIII]+H nebular line fluxes as described in Section 3.1).
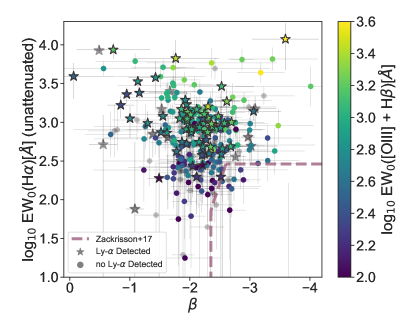
In Figure 6 we show UV slopes as a function of intrinsic H EW for our sample (where we correct for dust attenuation as described in Section 3.1. We compare our sample to the region proposed by Zackrisson et al. (2017) to have . While several sources fall into this region, and also have low [OIII]+H EW ( Å) the uncertainties are too large to make these robust candidates. We discuss this further in Section 5.2.
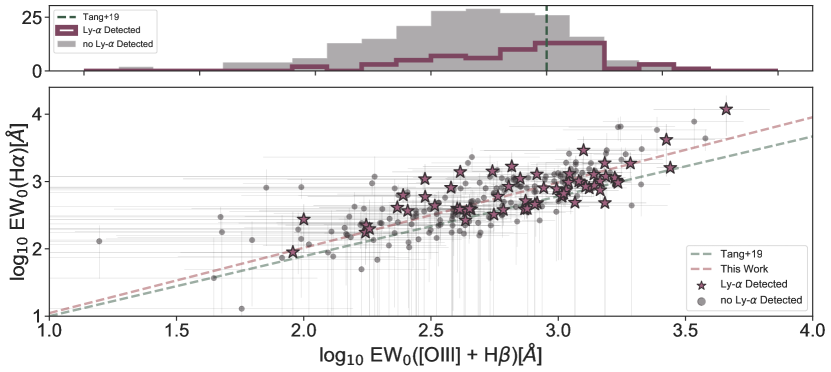
Figure 7 shows H EW as a function of [OIII]+H for our sample. We see the expected positive correlation between both nebular emission lines, as these lines are all generated by the effects of stellar ionizing radiation. We see a very large scatter (with a range dex) as expected due to variations in metallicity, temperature, and ionization parameter which will affect the strength of [OIII] individual galaxies (e.g., Maiolino et al., 2008; Steidel et al., 2014; Sanders et al., 2021). We find .
Galaxies with detected Ly tend to occupy the top right of the plot, with strong nebular emission lines, suggesting these are young star-forming galaxies with low metallicity and large ionization parameters, producing copious ionizing photons needed to power these emission lines (see e.g., Yang et al., 2017; Du et al., 2020; Tang et al., 2021, for more detailed studies). We find the Ly selected galaxies have stronger [OIII]+H EW compared to the photometric population, following the trend with H EW in Figure 4. Though, as discussed by Tang et al. (2021), not all galaxies with strong nebular emission are detected in Ly , indicating that Ly transmission is reduced due to a high column density of neutral gas in these systems and/or inclination effects. We compare our data to a sample by Tang et al. (2019), which was selected based on strong [OIII] emission. We find a similar correlation, but overall our ratio of H EW/[OIII]+H EW is higher by 0.1 dex. Given that the Tang et al. (2019) sample has significantly sub-solar gas-phase metallicity (Tang et al., 2021), the decrease we observe in [OIII] at fixed H EW would likely imply an overall lower metallicity due to a lower number of metal atoms in our sample.
5 Discussion
5.1 The profile of a strong ionizer
Thanks to the depth of JWST/NIRCam we have been able to assess trends of at across the broadest range of galaxy properties to-date. From these results, we corroborate previous work at lower redshift and high luminosities, but push the measurement of to a large sample of individual UV-faint galaxies for the first time.
We find that galaxies with strong ionizing photon emission tend to have high H EW, low UV luminosity, blue UV slope and Ly emission – all implying that these galaxies are young, with likely low dust content and metallicity, and have a high O/B star population, capable of producing hard ionizing photons (e.g., Tang et al., 2019; Boyett et al., 2022b). This picture of the integrated emission from galaxies is complemented by high spatial resolution observations of highly magnified arcs with JWST. These have revealed extremely young star clusters ( Myr) with [OIII]+H EW Å, which dominate the ionizing photon production in their galaxy (Vanzella et al., 2022a, b), indicating that there can be large variations in in individual galaxies, if they contain multiple stellar populations, but that the variation is primarily driven by the age of the stellar populations. We also find that overall, our Ly galaxy sample has higher than the photometrically selected one; the primary reason for this difference is that the former has higher H EW (Figure 4). The enhanced prevalence of Ly emission in strong H emitters is likely a combination of increased production of Ly photons due to the young stellar population implied by strong H, and potentially also an increase in the Ly escape fraction in the interstellar medium (Tang et al., 2021; Naidu et al., 2022). In these rapidly star forming galaxies, the hard ionizing radiation may be ionizing the ISM and/or feedback may disrupt the ISM gas leading to a reduced HI column density and dust cover. We note that the galaxies with the highest are not necessarily all Ly -emitters, likely due to variance in the geometry and column density of neutral gas and dust in these sources. (Ning et al., 2022) has shown this same correlation between and Ly for a broad range of luminosities and equivalent widths.
5.2 The ionizing photon escape fraction
In Section 4.2 we explored whether our sample shows signs of high ionizing photon escape fraction, , using the low H EW - blue UV slope region defined by Zackrisson et al. (2017) for . While several sources fell into this region, with both low H EW and [OIII]+H EW ( Å), the uncertainties on the line flux measurements are too large for these to be robust candidates. More precise emission line measurements with JWST spectroscopy will be vital for identifying such candidates and their relative abundance in the galaxy population.
The lack of high candidates amongst the Ly -selected galaxies is also surprising. As the same conditions (low neutral gas covering fraction) facilitate both Ly escape and Lyman continuum escape, a correlation between Ly and Lyman continuum escape fraction is expected (e.g., Verhamme et al., 2015; Dijkstra et al., 2016; Reddy et al., 2016).
As discussed by Topping et al. (2022), however, it is possible for galaxies with high but with very young ages to still have high nebular emission due to high ionizing photon production. It is likely that the criteria proposed by Zackrisson et al. (2017) can only find high systems within the bounds of the assumptions made for their model, such as galaxy SFH, ages, metallicities, dust, but also the stellar models used. Our results suggest the low luminosity galaxies with high sSFR but low [OIII]+H EW observed by Endsley et al. (2022) may be more likely due to variation in metallicity than high .
6 Conclusions
We have inferred the hydrogen ionizing photon production rate, modulo the escape fraction, in the largest sample of individual sub- galaxies to-date, spanning , with a median , thanks to deep JWST/NIRCam imaging, enabling us to track the demographics of the ionizing population. Our conclusions are as follows:
-
1.
The median of our sample is with an intrinsic scatter of 0.42 dex. The inferred distribution of our sample has values in a range of dex, implying a wide range of galaxy properties and ages.
-
2.
We find significant trends of increasing with increasing H EW, decreasing UV luminosity, and with decreasing UV slope, all suggesting galaxies which are most efficient at producing ionizing photons are young, highly star forming, which are normally expected to be low metallicity and dust-poor.
-
3.
We find galaxies selected with strong Ly emission to have higher than photometrically-selected galaxies, with median values of and respectively. We find the Ly -detected galaxies have an elevated H EW distribution, thus the increased is likely driven by the selection based on Ly selecting a younger population. As strong Ly emitters also likely have high ionizing photon escape fractions, this implies the intrinsic production rate of ionizing photons in these galaxies could be significantly higher than what we can infer from H luminosities.
-
4.
We examine our sample for signs of very high by comparing the inferred strengths of nebular emission lines ([OIII]+H and H) and the strength of the nebular continuum via the UV slope. We find no significant evidence for sources with high escape fraction galaxies with low nebular emission line strength and very blue UV slopes. The reduced strength of [OIII]+H EW in our sample compared to a sample at from Tang et al. (2019) implies our sample has likely lower gas-phase metallicity and/or ionization parameter.
We have demonstrated the power of JWST/NIRCam photometry to more precisely constrain the rest-frame optical emission of UV-faint high redshift galaxies than previously possible with Spitzer/IRAC. These observations allow us to constrain the production rate of ionizing photons from early galaxies, corroborating the picture obtained from previous stacking analyses that is elevated in young, highly star forming galaxies, but that there is a broad distribution of , likely driven by variation in galaxy properties and ages.
With JWST spectroscopy it is becoming possible to obtain direct measurements of optical emission lines in large samples (e.g., Sun et al., 2022; Williams et al., 2022; Matthee et al., 2022). Deriving a census of the ionizing photon production rate across the full galaxy population will be necessary to fully understand reionization. Here we have shown that is elevated in UV-faint galaxies with strong nebular emission lines, likely due to young ages. While a thorough analysis of the implications of our results for reionization are beyond the scope of this work, this becomes more prominent at high redshift (e.g., Boyett et al., 2022b; Endsley et al., 2022), implying that it would be possible to complete reionization with modest . Considering the full distributions of and across galaxy properties will be required to assess the primary drivers of reionization.
Acknowledgements.
We thank the co-PIs Ivo Labbé and Rachel Bezanson for the conception and public availability of the UNCOVER JWST Program (GO-2561), which made much of this work possible. We thank Mengtao Tang for sharing data the emission line catalog from Tang et al. (2019). This work is based on observations collected at the European Southern Observatory under ESO programmes 109.24EZ.001 and 094.A-0115. This work is based on NASA/ESA HST and JWST data which were obtained from the Mikulski Archive for Space Telescopes at the Space Telescope Science Institute, which is operated by the Association of Universities for Research in Astronomy, Inc., under NASA contract NAS 5-03127 for JWST. The HST observations are associated with programs GO/DD-17231, GO/DD-13495, GO-15117, GO-11689, GO-11386, GO-13389, GO-15940 and SNAP-16729. The JWST observations are associated with programs JWST-ERS-1324 and GO-2561. CM and GP acknowledge support by the VILLUM FONDEN under grant 37459. The Cosmic Dawn Center (DAWN) is funded by the Danish National Research Foundation under grant DNRF140. We acknowledge financial support from NASA through grant JWST-ERS-1324. We acknowledge support from the INAF Large Grant 2022 “Extragalactic Surveys with JWST” (PI Pentericci), and support through grants PRIN-MIUR 2017WSCC32, 2020SKSTHZ. This research is supported in part by the Australian Research Council Centre of Excellence for All Sky Astrophysics in 3 Dimensions (ASTRO 3D), through project number CE170100013.References
- Anders & Fritze-v. Alvensleben (2003) Anders, P. & Fritze-v. Alvensleben, U. 2003, A&A, 401, 1063
- Barbary (2018) Barbary, K. 2018, SEP: Source Extraction and Photometry, Astrophysics Source Code Library, record ascl:1811.004
- Becker et al. (2021) Becker, G. D., D’Aloisio, A., Christenson, H. M., et al. 2021, MNRAS, 508, 1853
- Begley et al. (2022) Begley, R., Cullen, F., McLure, R. J., et al. 2022, MNRAS, 513, 3510
- Bergamini et al. (2022) Bergamini, P., Acebron, A., Grillo, C., et al. 2022, arXiv e-prints, arXiv:2207.09416
- Bolan et al. (2022) Bolan, P., Lemaux, B. C., Mason, C., et al. 2022, MNRAS, 517, 3263
- Bouwens et al. (2014) Bouwens, R. J., Illingworth, G. D., Oesch, P. A., et al. 2014, ApJ, 793, 115
- Bouwens et al. (2016) Bouwens, R. J., Smit, R., Labbé, I., et al. 2016, ApJ, 831, 176
- Boyett et al. (2022a) Boyett, K., Mascia, S., Pentericci, L., et al. 2022a, arXiv e-prints, arXiv:2207.13459
- Boyett et al. (2022b) Boyett, K. N. K., Stark, D. P., Bunker, A. J., Tang, M., & Maseda, M. V. 2022b, MNRAS, 513, 4451
- Brammer et al. (2022) Brammer, G., Strait, V., Matharu, J., & Momcheva, I. 2022, grizli, Zenodo
- Brammer et al. (2008) Brammer, G. B., van Dokkum, P. G., & Coppi, P. 2008, ApJ, 686, 1503
- Bruzual & Charlot (2003) Bruzual, G. & Charlot, S. 2003, MNRAS, 344, 1000
- Caminha et al. (2017) Caminha, G. B., Grillo, C., Rosati, P., et al. 2017, A&A, 600, A90
- Caminha et al. (2019) Caminha, G. B., Rosati, P., Grillo, C., et al. 2019, A&A, 632, A36
- Carnall et al. (2018) Carnall, A. C., McLure, R. J., Dunlop, J. S., & Davé, R. 2018, MNRAS, 480, 4379
- Chabrier (2003) Chabrier, G. 2003, Publ. Astron. Soc. Pacific, 115, 763
- Chevallard et al. (2018) Chevallard, J., Charlot, S., Senchyna, P., et al. 2018, MNRAS, 479, 3264
- Cullen et al. (2022) Cullen, F., McLure, R. J., McLeod, D. J., et al. 2022, arXiv e-prints, arXiv:2208.04914
- Davies et al. (2018) Davies, F. B., Hennawi, J. F., Bañados, E., et al. 2018, ApJ, 864, 142
- Dijkstra et al. (2016) Dijkstra, M., Gronke, M., & Venkatesan, A. 2016, ApJ, 828, 71
- Du et al. (2020) Du, X., Shapley, A. E., Tang, M., et al. 2020, ApJ, 890, 65
- Emami et al. (2020) Emami, N., Siana, B., Alavi, A., et al. 2020, ApJ, 895, 116
- Endsley et al. (2022) Endsley, R., Stark, D. P., Whitler, L., et al. 2022, arXiv e-prints, arXiv:2208.14999
- Fan et al. (2006) Fan, X., Strauss, M. A., Becker, R. H., et al. 2006, Astron. J., 132, 117
- Foreman-Mackey et al. (2013) Foreman-Mackey, D., Hogg, D. W., Lang, D., & Goodman, J. 2013, Publ. Astron. Soc. Pacific, 125, 306
- Harikane et al. (2018) Harikane, Y., Ouchi, M., Shibuya, T., et al. 2018, The Astrophysical Journal, 859, 84
- Hashimoto et al. (2018) Hashimoto, T., Laporte, N., Mawatari, K., et al. 2018, Nature, 557, 392
- Inoue et al. (2014) Inoue, A. K., Shimizu, I., Iwata, I., & Tanaka, M. 2014, MNRAS, 442, 1805
- Kelly (2007) Kelly, B. C. 2007, ApJ, 665, 1489
- Lam et al. (2019) Lam, D., Bouwens, R. J., Labbé, I., et al. 2019, A&A, 627, A164
- Leitherer & Heckman (1995) Leitherer, C. & Heckman, T. M. 1995, ApJSupplement Series, 96, 9
- Lotz et al. (2017) Lotz, J. M., Koekemoer, A., Coe, D., et al. 2017, ApJ, 837, 97
- Ma et al. (2020) Ma, X., Quataert, E., Wetzel, A., et al. 2020, MNRAS, 498, 2001
- Madau et al. (1999) Madau, P., Haardt, F., & Rees, M. J. 1999, ApJ, 514, 648
- Mahler et al. (2018) Mahler, G., Richard, J., Clément, B., et al. 2018, MNRAS, 473, 663
- Maiolino et al. (2008) Maiolino, R., Nagao, T., Grazian, A., et al. 2008, A&A, 488, 463
- Mármol-Queraltó et al. (2016) Mármol-Queraltó, E., McLure, R. J., Cullen, F., et al. 2016, MNRAS, 460, 3587
- Marques-Chaves et al. (2022) Marques-Chaves, R., Schaerer, D., Á lvarez-Márquez, J., et al. 2022, Monthly Notices of the Royal Astronomical Society, 517, 2972
- Maseda et al. (2020) Maseda, M. V., Bacon, R., Lam, D., et al. 2020, MNRAS, 493, 5120
- Mason et al. (2019) Mason, C. A., Fontana, A., Treu, T., et al. 2019, MNRAS, 485, 3947
- Mason et al. (2018) Mason, C. A., Treu, T., Dijkstra, M., et al. 2018, ApJ, 856, 2
- Matthee et al. (2022) Matthee, J., Mackenzie, R., Simcoe, R. A., et al. 2022, arXiv e-prints, arXiv:2211.08255
- McGreer et al. (2015) McGreer, I. D., Mesinger, A., & D’Odorico, V. 2015, MNRAS, 447, 499
- McLeod et al. (2021) McLeod, D. J., McLure, R. J., Dunlop, J. S., et al. 2021, MNRAS, 503, 4413
- Naidu et al. (2022) Naidu, R. P., Matthee, J., Oesch, P. A., et al. 2022, MNRAS, 510, 4582
- Naidu et al. (2020) Naidu, R. P., Tacchella, S., Mason, C. A., et al. 2020, ApJ, 892, 109
- Ning et al. (2022) Ning, Y., Cai, Z., Jiang, L., et al. 2022, arXiv e-prints, arXiv:2211.13620
- Oesch et al. (2018) Oesch, P. A., Bouwens, R. J., Illingworth, G. D., Labbe, I., & Stefanon, M. 2018, ApJ, 855, 105
- Pahl et al. (2022) Pahl, A. J., Shapley, A., Steidel, C. C., et al. 2022, arXiv e-prints, arXiv:2210.16697
- Planck Collaboration et al. (2020) Planck Collaboration, Aghanim, N., Akrami, Y., et al. 2020, A&A, 641, A6
- Prevot et al. (1984) Prevot, M. L., Lequeux, J., Maurice, E., Prevot, L., & Rocca-Volmerange, B. 1984, A&A, 132, 389
- Qin et al. (2021) Qin, Y., Mesinger, A., Bosman, S. E. I., & Viel, M. 2021, MNRAS, 506, 2390
- Reddy et al. (2016) Reddy, N. A., Steidel, C. C., Pettini, M., Bogosavljević, M., & Shapley, A. E. 2016, ApJ, 828, 108
- Richard et al. (2021) Richard, J., Claeyssens, A., Lagattuta, D., et al. 2021, A&A, 646, A83
- Rigby et al. (2022) Rigby, J., Perrin, M., McElwain, M., et al. 2022, arXiv e-prints, arXiv:2207.05632
- Robertson et al. (2010) Robertson, B. E., Ellis, R. S., Dunlop, J. S., McLure, R. J., & Stark, D. P. 2010, Nature, 468, 49
- Rogers et al. (2013) Rogers, A. B., McLure, R. J., & Dunlop, J. S. 2013, Monthly Notices of the Royal Astronomical Society, 429, 2456
- Saldana-Lopez et al. (2022) Saldana-Lopez, A., Schaerer, D., Chisholm, J., et al. 2022, arXiv e-prints, arXiv:2211.01351
- Sanders et al. (2021) Sanders, R. L., Shapley, A. E., Jones, T., et al. 2021, ApJ, 914, 19
- Schaerer & de Barros (2009) Schaerer, D. & de Barros, S. 2009, A&A, 502, 423
- Sharma et al. (2017) Sharma, M., Theuns, T., Frenk, C., et al. 2017, MNRAS, 468, 2176
- Shim et al. (2011) Shim, H., Chary, R.-R., Dickinson, M., et al. 2011, ApJ, 738, 69
- Shivaei et al. (2018) Shivaei, I., Reddy, N. A., Siana, B., et al. 2018, ApJ, 855, 42
- Smit et al. (2015) Smit, R., Bouwens, R. J., Franx, M., et al. 2015, ApJ, 801, 122
- Stanway et al. (2016) Stanway, E. R., Eldridge, J. J., & Becker, G. D. 2016, MNRAS, 456, 485
- Stark et al. (2010) Stark, D. P., Ellis, R. S., Chiu, K., Ouchi, M., & Bunker, A. 2010, MNRAS, 408, 1628
- Stark et al. (2013) Stark, D. P., Schenker, M. A., Ellis, R., et al. 2013, ApJ, 763, 129
- Stefanon et al. (2022) Stefanon, M., Bouwens, R. J., Illingworth, G. D., et al. 2022, ApJ, 935, 94
- Steidel et al. (2018) Steidel, C. C., Bogosavljevic, M., Shapley, A. E., et al. 2018, ApJ, 869, 123
- Steidel et al. (2014) Steidel, C. C., Rudie, G. C., Strom, A. L., et al. 2014, ApJ, 795, 165
- Steinhardt et al. (2020) Steinhardt, C. L., Jauzac, M., Acebron, A., et al. 2020, ApJS, 247, 64
- Strait et al. (2021) Strait, V., Bradač, M., Coe, D., et al. 2021, ApJ, 910, 135
- Sun et al. (2022) Sun, F., Egami, E., Pirzkal, N., et al. 2022, arXiv e-prints, arXiv:2209.03374
- Tang et al. (2019) Tang, M., Stark, D. P., Chevallard, J., & Charlot, S. 2019, MNRAS, 489, 2572
- Tang et al. (2021) Tang, M., Stark, D. P., Chevallard, J., et al. 2021, MNRAS, 503, 4105
- Topping et al. (2022) Topping, M. W., Stark, D. P., Endsley, R., et al. 2022, arXiv e-prints, arXiv:2208.01610
- Trebitsch et al. (2017) Trebitsch, M., Blaizot, J., Rosdahl, J., Devriendt, J., & Slyz, A. 2017, MNRAS
- Treu et al. (2022) Treu, T., Roberts-Borsani, G., Bradac, M., et al. 2022, ApJ, 935, 110
- Vanzella et al. (2022a) Vanzella, E., Castellano, M., Bergamini, P., et al. 2022a, arXiv e-prints, arXiv:2208.00520
- Vanzella et al. (2022b) Vanzella, E., Claeyssens, A., Welch, B., et al. 2022b, arXiv e-prints, arXiv:2211.09839
- Vanzella et al. (2018) Vanzella, E., Nonino, M., Cupani, G., et al. 2018, MNRAS, 476, L15
- Verhamme et al. (2015) Verhamme, A., Orlitová, I., Schaerer, D., & Hayes, M. 2015, Astronomy & Astrophysics, 578, A7
- Williams et al. (2022) Williams, H., Kelly, P. L., Chen, W., et al. 2022, arXiv e-prints, arXiv:2210.15699
- Yang et al. (2017) Yang, H., Malhotra, S., Rhoads, J. E., & Wang, J. 2017, ApJ, 847, 38
- Zackrisson et al. (2017) Zackrisson, E., Binggeli, C., Finlator, K., et al. 2017, ApJ, 836, 78
- Zackrisson et al. (2013) Zackrisson, E., Inoue, A. K., & Jensen, H. 2013, ApJ, 777, 39