[name=Theorem,numberwithin=section]thm \declaretheorem[name=Lemma,numberwithin=section,numberlike=thm]lem \declaretheorem[name=Corollary,numberwithin=section,numberlike=thm]cor \declaretheorem[name=Proposition,numberwithin=section,numberlike=thm]prop \declaretheorem[name=Assumption,numberlike=thm]ass
Cosmology from Galaxy Redshift Surveys
with PointNet
Abstract
In recent years, deep learning approaches have achieved state-of-the-art results in the analysis of point cloud data. In cosmology, galaxy redshift surveys resemble such a permutation invariant collection of positions in space. These surveys have so far mostly been analysed with two-point statistics, such as power spectra and correlation functions. The usage of these summary statistics is best justified on large scales, where the density field is linear and Gaussian. However, in light of the increased precision expected from upcoming surveys, the analysis of – intrinsically non-Gaussian – small angular separations represents an appealing avenue to better constrain cosmological parameters. In this work, we aim to improve upon two-point statistics by employing a PointNet-like neural network to regress the values of the cosmological parameters directly from point cloud data. Our implementation of PointNets can analyse inputs of galaxies at a time, which improves upon earlier work for this application by roughly two orders of magnitude. Additionally, we demonstrate the ability to analyse galaxy redshift survey data on the lightcone, as opposed to previously static simulation boxes at a given fixed redshift.
1 Introduction
The standard model of cosmology contains a set of free parameters that relate to fundamental properties of the universe, such as the fraction of dark energy and dark matter, the dark energy equation of state, and the rate of cosmic expansion. The matter density distribution evolves under the laws of gravity and cosmic expansion from a smooth, Gaussian field in the early universe, to a complex network of halos, filaments, and voids in the late universe. The spatial distribution of galaxies traces the underlying dark matter density field. The cosmological parameters can be inferred by comparing the structures in this distribution from the observed survey data and those predicted by theoretical models (see Sánchez et al., 2017, and references therein). Current cosmological analyses typically compress the information contained in the galaxy positions into two-point statistics, such as power spectra and correlation functions (Alam et al., 2021). The two-point statistics are only sufficient for Gaussian random fields and therefore cannot fully capture the richer information contained in the galaxy positions.
Using more powerful features, such as higher-order correlation functions (Samushia et al., 2021), or other approaches (Banerjee and Abel, 2021; Eickenberg et al., 2022), either singularly or combined with each other, can improve performance. Yet, the selection of an appropriate set of summary statistics is problem-dependent and prone to human bias. This aspect motivates the adoption of tools to automatically extract and combine summary statistics in a meaningful way, i.e. to improve the prediction of cosmological parameters. Aside from galaxy positions, other features can be added to increase the constraining power. An example of such a property is the local density of the galaxy. Marked correlation functions (Satpathy et al., 2019; Philcox et al., 2021; Massara et al., 2022) report increased precision of measurements for various strategies to up-weight certain density regions. This requires careful design of the marking strategy.
Motivated by advancements in machine learning, recent work attempts to estimate parameters from the galaxy positions directly. As an early example, Ntampaka et al. (2020) frame the task as a 3D voxel regression, by applying an arbitrary scale partition of the input space into equally sized blocks. A disadvantage of this approach is that the dynamical range of the density of galaxies makes the voxelisation either very lossy or computationally inefficient. Furthermore, the permutation symmetries of the task are not respected.
A more natural representation is treating the data as a graph and employing graph neural networks (GNNs) Villanueva-Domingo and Villaescusa-Navarro (2022); Makinen et al. (2022), which are able to handle irregular and sparse data, via a message passing protocol defined between connected nodes. However, this setting comes with two fundamental limitations. Firstly, treating the data as a graph requires defining an adjacency matrix between the galaxies a priori. Neighbors in this case are usually specified as points within a hard-defined threshold distance. Secondly, these methods can scale poorly when increasing the available number of points, which is of major concern due to the relatively large galaxy catalogues which in the ongoing galaxy redshift surveys like DESI (Flaugher and Bebek, 2014) can reach the order of objects.
We instead propose to treat the positional data directly in 3D space without making any further assumptions. As a result, the underlying relationship between the positions can be learned automatically and no assumptions on an initial adjacency matrix are needed. Point clouds are a natural representation of these geometric point sets, where an invariance to the order of the points within the set is desired. Distances between points define a local neighborhood, whose properties should give good indications of the underlying data distribution. We base our work on PointNet (Qi et al., 2016) and subsequent advances that learn features from point sets in a metric space.
An additional advantage of the analysis of PointNet is the fact that local density information can be naturally included in the input vector, extending the set of 3D positions with an additional local density proxy parameter, for example the halo virial mass . Marked correlation functions use the local density values to optimally weight the correlation, and this weighting strategy needs to be carefully tuned. In contrast, the PointNet machine learning algorithm automatically finds the optimal weighting to maximize the information gain.
In this work, we demonstrate the potential of using PointNets for analysing redshift surveys with a large number of galaxies, reaching objects, with prospects of further increase when ran on larger hardware. We show that the local density information can be straightforwardly included in the data vector, extending the set of galaxy properties by one additional parameter. We compare the accuracy of PointNets and two-point statistics in predicting the underlying cosmological parameters and show that our approach performs favourably, especially when the additional feature is included.
2 Methodology
Our dataset is derived from the dark matter halo catalogs contained in the CosmoGridV1 (Kacprzak et al., 2022; Fluri et al., 2022), which contains dark-matter-only N-body simulations varying the six cosmological parameters , , , , and of the CDM model. The distribution of halos is primarily affected by the parameters , the present-day fraction of matter in the Universe, and , a measure of the variance, or clumpiness, of the matter distribution. We, therefore, restrict the present study to these two parameters. The remaining ones are implicitly marginalized over in the analysis. To simplify the physics modeling, we use dark matter halo positions as a proxy for galaxy positions and work in physical space, rather than redshift space.
The positions of the halos define a permutation-invariant set of points in 3D comoving coordinates. We assume that the distance metric between these points defines a local neighborhood that encodes properties of the underlying data generation process. This concept of local neighborhood allows for the capture of attributes that may not be uniformly distributed across the set of available points, which is in contrast to the global view two-point functions provide. Therefore, our basic intuition is to exploit the local structure and learn fine-tuned spatial features based on these neighborhood attributes. In addition, we include the halo mass as a proxy for the local density in selected experiments. Then, the input to the neural net is a set of positions and mass: .
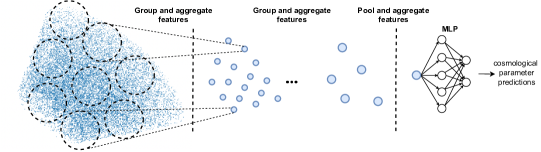
Based on recent work on hierarchical neural network point set learning (Qi et al., 2017; Zhao et al., 2021), we partition the set of halos on overlapping local regions by the distance metric of the underlying space, which is Euclidean. By aggregating predictions across these regions on increasingly large scales, we progressively expand the receptive field and produce higher-level features, see also Fig. 1. This enables us to efficiently train on large sets of point clouds, which capture both local and global information.
3 Experiments
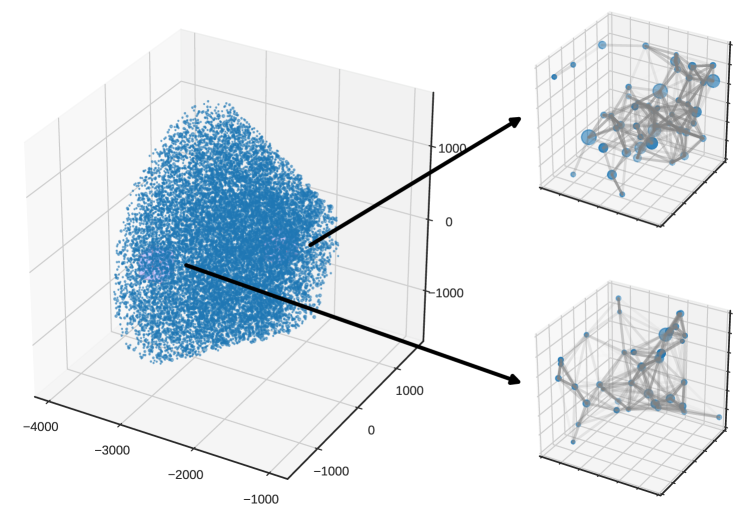
Data. The survey volume encompasses a round patch of 1000 square degrees, which is roughly of the full sky and a redshift range of , see Fig. 2(a) for a visualisation. The dark matter halos create a lightcone, where the properties of the density field evolve in redshift; in effect, the higher halos are clustered the way they were at the time in cosmic history corresponding to that redshift. The number of dark matter halos contained in this volume is cosmology-dependent. For consistency, we only consider point clouds of a fixed number of points (see Table 1) and discard cosmologies with fewer points, which are only found for the lowest values of the parameter. These are orders of magnitude more points than in previous analyses employing GNNs, which was in Makinen et al. (2022), and in Villanueva-Domingo and Villaescusa-Navarro (2022).
The CosmoGridV1 is made up of 2500 unique combinations of the six cosmological parameters distributed according to a Sobol sequence. The suite contains seven independent N-body simulation runs for each such grid point, which result from differing random initial conditions and each cover the full sky. We cut out 12 non-overlapping survey patches from each of these to arrive at 84 independent realizations of the point cloud per cosmology. Therefore, the dataset encompasses a total of 210 000 elements before the removal of cosmologies which only contain an insufficient number of halos. We split the original data into training () and testing ().
We obtain consistent comoving coordinates throughout the grid of cosmologies by fixing a fiducial cosmology with respect to which the observable angular and redshift coordinates are converted. In addition to the comoving coordinates , the catalogs contain the halo mass .
Point cloud networks. We build upon the recent innovations in point cloud processing by neural networks in the PointNet family (Qi et al., 2016). These are based on the idea that the density of point sets is not uniform across the receptive field, hindering performance when methods disregard this fact. PointNet++ (Qi et al., 2017) and succeeding improvements proposed in PointNeXt (Qian et al., 2022), learn layers in an adaptive fashion, from multiple scales. We adopt the latter of these methods, which was recently shown to achieve state-of-the-art results across a variety of point cloud applications.
Two-point statistics. We use isotropic two-point correlation functions as the baseline for our experiments and estimate them using the TreeCorr Jarvis (2015) library. The correlation functions are calculated between the same numbers of points as the ones that make up the point clouds. We compress these two-point feature vectors using a simple multilayer perceptron (MLP) regressor, allowing for a more direct comparison to the PointNeXt models, as well as enabling efficient conditional density estimation. For further details, see Appendices A.2 and A.3.
| # points | PointNeXt (pos) | PointNeXt (pos+) | Two-point statistic |
|---|---|---|---|
Results. We consider two metrics to assess the performance of our methods: the mean-squared error (MSE) on the test set and the posterior distribution of the cosmological parameters with respect to a fixed mock observation.
The MSE of PointNeXt and the two-point statistic is shown in Table 1. The results indicate that PointNeXt obtains more precise predictions for the same number of halos. The difference between the two methods is larger for smaller numbers of points, which implies that the PointNets are more robust to noise. More striking is the boost in performance the inclusion of the mass as an additional feature brings. For the PointNets, the MSE drops by more than a factor of two with this additional information.
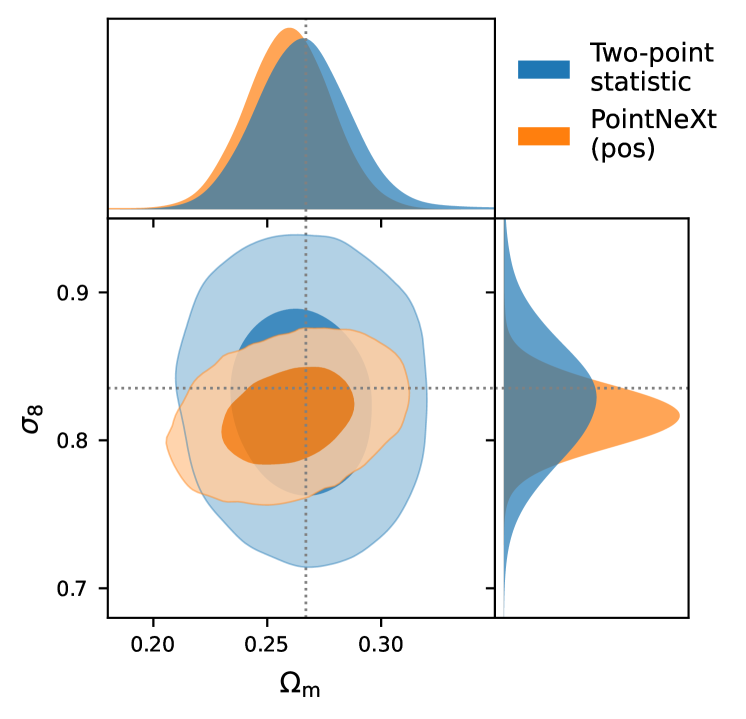
To estimate the posterior distributions of cosmological parameters, we perform conditional density estimation on the regressed parameters from PointNeXt and the compressor of the two-point statistics. We refer the reader to appendix A.3 for details on the posterior inference. In Fig. 2(b), we visualize the resulting parameter posteriors when using points. In line with what is observed for the MSE, PointNeXt is able to constrain the parameters more precisely than the two-point statistic, especially the parameter , which describes the variance of the matter field. While the MSE of the PointNeXt model is markedly improved by the inclusion of the mass as a feature, we find that this is mainly due to a reduction of outliers. The size of the posterior is however not strongly affected by the inclusion of the halo mass as a feature.
4 Discussion
For our experimental setting, the standard two-point correlation function does not offer any further potential for improvement beyond the results reported in Table 1, thus reaching its limits. While marked functions could be used to incorporate the evidently beneficial mass information into the correlators, these require careful modeling choices. In contrast, the PointNets automatically learn how to optimally handle the information contained in this additional feature, which makes them especially suited for the task. As in this study we have not performed an extensive optimization of the PointNets both in terms of hyperparameter tuning and the selection of architecture, we anticipate that the gap in performance between the methods in Table 1 can be increased, even when considering only the galaxy positions. Similarly, the size and complexity of the PointNet can be increased on larger hardware, thus potentially leading to more precise parameter measurements. Another avenue of improvement is to utilize models that ensure the adherence to physical symmetries like rotation or translation equivariance, as this was shown to improve the results in Makinen et al. (2022).
5 Conclusion and Outlook
In this work, we use PointNets to directly regress cosmological parameters from simplified simulated galaxy redshift surveys. We show that for an equal number of points, our PointNet implementation outperforms the de facto standard approach, the two-point correlation function. We show that the improvement is twofold: Firstly, the PointNets obtain better results when acting on the positions only, presumably by extracting non-Gaussian information the correlators aren’t sensitive to. Secondly, the inclusion of the mass as an additional feature improves their performance in terms of the MSE, while only marignally improving the constraints. Given the ease of including more features to the point vector, this is a promising result. We leave the investigation of how it can be used to gain constraining power to future work.
With this in mind, it is a notable advantage of the PointNets that additional features can be incorporated directly and without the need for fine-tuning, which is not the case for extensions to the correlation function. Therefore, a promising direction for follow up work is to apply the method to point clouds made up of galaxies instead of dark matter halos, as more physical features apart from the positions and mass can be modeled. For example, the inclusion of measurements of galaxy magnitudes and colors can help constrain galaxy evolution models in connection to their density environment.
Our implementation of PointNets can currently handle galaxies at a time, which marks an improvement of roughly two orders of magnitude compared to earlier work deploying deep learning methods to this application. As there is still an order of magnitude gap to the galaxy positions mapped in ongoing state-of-the-art galaxy redshift surveys, scaling our method to even larger numbers of points is another direction for future extensions of this work. We expect that this can be achieved, for example, by using the latest large memory, multi-GPU nodes.
Impact statement
Upcoming galaxy surveys are expected to provide a wealth of new data that can shed light on the nature of dark matter and dark energy. The design of new tools and techniques to process such data is of paramount importance to this task. The presented approach contributes to this by demonstrating a simulation-based inference analysis framework with PointNets. They can efficiently operate on large galaxy point clouds, naturally incorporate more galaxy properties, and maximize the information gain form the data. We do not foresee any ethical concerns with this work.
References
- Alam et al. [2021] S. Alam, M. Aubert, S. Avila, C. Balland, J. E. Bautista, M. A. Bershady, D. Bizyaev, M. R. Blanton, A. S. Bolton, J. Bovy, et al. Completed sdss-iv extended baryon oscillation spectroscopic survey: Cosmological implications from two decades of spectroscopic surveys at the apache point observatory. Physical Review D, 103(8):083533, 2021.
- Alsing et al. [2019] J. Alsing, T. Charnock, S. Feeney, and B. Wandelt. Fast likelihood-free cosmology with neural density estimators and active learning. Monthly Notices of the Royal Astronomical Society, 488(3):4440–4458, 2019.
- Banerjee and Abel [2021] A. Banerjee and T. Abel. Nearest neighbour distributions: New statistical measures for cosmological clustering. Monthly Notices of the Royal Astronomical Society, 500(4):5479–5499, 2021.
- Charnock et al. [2018] T. Charnock, G. Lavaux, and B. D. Wandelt. Automatic physical inference with information maximizing neural networks. Physical Review D, 97(8):083004, 2018.
- Cranmer et al. [2020] K. Cranmer, J. Brehmer, and G. Louppe. The frontier of simulation-based inference. Proceedings of the National Academy of Sciences, 117(48):30055–30062, 2020.
- Eickenberg et al. [2022] M. Eickenberg, E. Allys, A. M. Dizgah, P. Lemos, E. Massara, M. Abidi, C. Hahn, S. Hassan, B. R.-S. Blancard, S. Ho, et al. Wavelet moments for cosmological parameter estimation. arXiv preprint arXiv:2204.07646, 2022.
- Flaugher and Bebek [2014] B. Flaugher and C. Bebek. The dark energy spectroscopic instrument (desi). In Ground-based and Airborne Instrumentation for Astronomy V, volume 9147, pages 282–289. SPIE, 2014.
- Fluri et al. [2019] J. Fluri, T. Kacprzak, A. Lucchi, A. Refregier, A. Amara, T. Hofmann, and A. Schneider. Cosmological constraints with deep learning from kids-450 weak lensing maps. Phys. Rev. D, 100:063514, Sep 2019. doi: 10.1103/PhysRevD.100.063514. URL https://link.aps.org/doi/10.1103/PhysRevD.100.063514.
- Fluri et al. [2021] J. Fluri, T. Kacprzak, A. Refregier, A. Lucchi, and T. Hofmann. Cosmological parameter estimation and inference using deep summaries. Physical Review D, 104(12):123526, 2021.
- Fluri et al. [2022] J. Fluri, T. Kacprzak, A. Lucchi, A. Schneider, A. Refregier, and T. Hofmann. Full w cdm analysis of kids-1000 weak lensing maps using deep learning. Physical Review D, 105(8):083518, 2022.
- Hermans et al. [2021] J. Hermans, A. Delaunoy, F. Rozet, A. Wehenkel, and G. Louppe. Averting a crisis in simulation-based inference. arXiv preprint arXiv:2110.06581, 2021.
- Jarvis [2015] M. Jarvis. Treecorr: Two-point correlation functions. Astrophysics Source Code Library, pages ascl–1508, 2015.
- Jeffrey et al. [2021] N. Jeffrey, J. Alsing, and F. Lanusse. Likelihood-free inference with neural compression of des sv weak lensing map statistics. Monthly Notices of the Royal Astronomical Society, 501(1):954–969, 2021.
- Kacprzak et al. [2022] T. Kacprzak, J. Fluri, A. Schneider, A. Refregier, and J. Stadel. Cosmogridv1: a simulated cdm theory prediction for map-level cosmological inference. arXiv preprint arXiv:2209.04662, 2022.
- Landy and Szalay [1993] S. D. Landy and A. S. Szalay. Bias and variance of angular correlation functions. The Astrophysical Journal, 412:64–71, 1993.
- Makinen et al. [2022] T. L. Makinen, T. Charnock, P. Lemos, N. Porqueres, A. Heavens, and B. D. Wandelt. The cosmic graph: Optimal information extraction from large-scale structure using catalogues. arXiv preprint arXiv:2207.05202, 2022.
- Massara et al. [2022] E. Massara, F. Villaescusa-Navarro, C. Hahn, M. M. Abidi, M. Eickenberg, S. Ho, P. Lemos, A. M. Dizgah, and B. R.-S. Blancard. Cosmological information in the marked power spectrum of the galaxy field. arXiv preprint arXiv:2206.01709, 2022.
- Ntampaka et al. [2020] M. Ntampaka, D. J. Eisenstein, S. Yuan, and L. H. Garrison. A hybrid deep learning approach to cosmological constraints from galaxy redshift surveys. The Astrophysical Journal, 889(2):151, 2020.
- Philcox et al. [2021] O. H. Philcox, A. Aviles, and E. Massara. Modeling the marked spectrum of matter and biased tracers in real-and redshift-space. Journal of Cosmology and Astroparticle Physics, 2021(03):038, 2021.
- Qi et al. [2016] C. R. Qi, H. Su, K. Mo, and L. J. Guibas. Pointnet: deep learning on point sets for 3d classification and segmentation. corr abs/1612.00593 (2016). arXiv preprint arXiv:1612.00593, 2016.
- Qi et al. [2017] C. R. Qi, L. Yi, H. Su, and L. J. Guibas. Pointnet++: Deep hierarchical feature learning on point sets in a metric space. Advances in neural information processing systems, 30, 2017.
- Qian et al. [2022] G. Qian, Y. Li, H. Peng, J. Mai, H. A. A. K. Hammoud, M. Elhoseiny, and B. Ghanem. Pointnext: Revisiting pointnet++ with improved training and scaling strategies. arXiv preprint arXiv:2206.04670, 2022.
- Samushia et al. [2021] L. Samushia, Z. Slepian, and F. Villaescusa-Navarro. Information content of higher order galaxy correlation functions. Monthly Notices of the Royal Astronomical Society, 505(1):628–641, 2021.
- Sánchez et al. [2017] A. G. Sánchez, R. Scoccimarro, M. Crocce, J. N. Grieb, S. Salazar-Albornoz, C. D. Vecchia, M. Lippich, F. Beutler, J. R. Brownstein, C.-H. Chuang, et al. The clustering of galaxies in the completed sdss-iii baryon oscillation spectroscopic survey: cosmological implications of the configuration-space clustering wedges. Monthly Notices of the Royal Astronomical Society, 464(2):1640–1658, 2017.
- Satpathy et al. [2019] S. Satpathy, R. A C Croft, S. Ho, and B. Li. Measurement of marked correlation functions in sdss-iii baryon oscillation spectroscopic survey using lowz galaxies in data release 12. Monthly Notices of the Royal Astronomical Society, 484(2):2148–2165, 2019.
- Villanueva-Domingo and Villaescusa-Navarro [2022] P. Villanueva-Domingo and F. Villaescusa-Navarro. Learning cosmology and clustering with cosmic graphs. arXiv preprint arXiv:2204.13713, 2022.
- Zhao et al. [2021] H. Zhao, L. Jiang, J. Jia, P. H. Torr, and V. Koltun. Point transformer. In Proceedings of the IEEE/CVF International Conference on Computer Vision, pages 16259–16268, 2021.
Appendix A Experimental Setup
A.1 Point cloud networks
More details regarding our implementation setup are displayed in Table 2. We highlight that we mainly follow the experimental settings of Qian et al. [2022]. For our most computational intensive experiments we train on 8 NVIDIA Tesla P100 GPUs.
| Hyperparameters | Value | |
|---|---|---|
| Architecture | radius | 0.1 |
| strides | [4, 4, 4, 4] | |
| blocks | [4, 4, 7, 4] | |
| width | 32 | |
| expansion | 4 | |
| nsample | 32 | |
| Training | Learning rate | |
| Learning rate scheduler | ‘cosine’ | |
| Adam | (0.9, 0.999) | |
| Batch size | 64 | |
| Weight decay | 0.0001 | |
| Loss | ‘mse-loss’ | |
A.2 Two-point statistics
We fix the number of randoms in the Landy-Szalay estimator Landy and Szalay [1993] to in all cases. The summary statistic leaves freedom to choose appropriate binning, which controls both the scales included (via the bin limits), and the amount of noise (via the bin widths). We fix these parameters such that we obtain 50 linearly spaced bins in the range from 0 Mpc to 300 Mpc.
A.3 Cosmology parameter inference
We wish to derive posterior distributions on the cosmological parameters, similar to what is being done in traditional cosmological analyses. Since the likelihood of the halo distribution is intractable, we make use of simulation-based inference Alsing et al. [2019], Cranmer et al. [2020]. The high dimensionality of the input data, the halo catalog, makes the direct application of conditional density estimation difficult. We therefore compress the input data to a low-dimensional representation on which we can then perform conditional neural density estimation. Different choices as to how one can compress the high-dimensional data have been proposed for cosmological data sets Charnock et al. [2018], Fluri et al. [2019], Jeffrey et al. [2021], Fluri et al. [2021]. Here we consider three approaches: using the cosmological parameters as summaries, together with a simple MSE loss; using the cosmological parameters as summaries while also predicting their covariance, together with a likelihood loss, similar to Fluri et al. [2019]; and using summaries that maximise the mutual information with the true cosmological parameters, similar to Jeffrey et al. [2021].
We assess the efficiency of these three compression schemes on the two-point statistics due to the lower computational cost compared to the PointNeXt model. We use an MLP with two hidden layers of width as the compressor, trained for 200 epochs, with the learning rate decreasing from every 40 epoch by a factor of two. We find that the differences between these three approaches when compressing the two-point statistics are negligible, both in terms of the MSE, as well as the inferred posterior distributions. We therefore use the cosmological parameters as summaries, together with a MSE loss, as our fiducial choice for both the two-point data and PointNeXt.
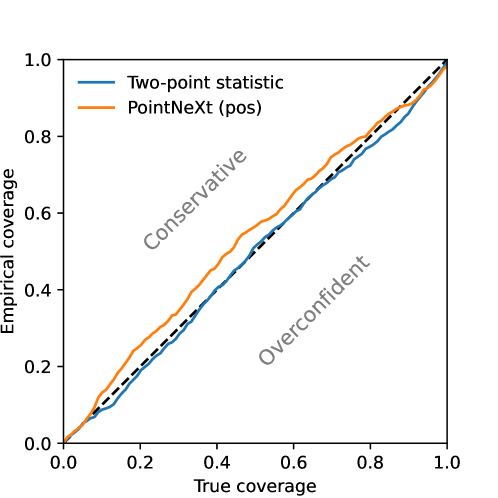
We use a three-component Gaussian mixture model for the conditional density estimation of the summaries. The posterior distributions are then obtained by conditioning the density estimator on a single representative sample of the summaries. The coverage of the estimated posterior distributions are validated using the empirical expected coverage probability Hermans et al. [2021] and are found to be well calibrated, as shown in Fig. 3.
As a sanity check we also approximate a Gaussian likelihood for the two-point statistics by considering the mean over all realisations at each grid point as the model and using the realisations at the fiducial cosmology for the data covariance matrix. This gives a noisy and sparse estimate of the likelihood over the whole prior volume. The resulting posterior distribution agrees with that of the compressed two-point statistics but we refrain from a quantitative comparison due to the sparsity of the posterior samples and noise of this Gaussian likelihood approximation.