figuret
Predicting sub-millimeter flux densities from global galaxy properties
Abstract
Recent years have seen growing interest in post-processing cosmological simulations with radiative transfer codes to predict observable fluxes for simulated galaxies. However, this can be slow, and requires a number of assumptions in cases where simulations do not resolve the ISM. Zoom-in simulations better resolve the detailed structure of the ISM and the geometry of stars and gas, however statistics are limited due to the computational cost of simulating even a single halo. In this paper, we make use of a set of high resolution, cosmological zoom-in simulations of massive ( at ), star-forming galaxies from the FIRE suite. We run the skirt radiative transfer code on hundreds of snapshots in the redshift range and calibrate a power law scaling relation between dust mass, star formation rate and flux density. The derived scaling relation shows encouraging consistency with observational results from the sub-millimeter-selected AS2UDS sample. We extend this to other wavelengths, deriving scaling relations between dust mass, stellar mass, star formation rate and redshift and sub-millimeter flux density at observed-frame wavelengths between and . We then apply the scaling relations to galaxies drawn from EAGLE, a large box cosmological simulation. We show that the scaling relations predict EAGLE sub-millimeter number counts that agree well with previous results that were derived using far more computationally expensive radiative transfer techniques. Our scaling relations can be applied to other simulations and semi-analytical or semi-empirical models to generate robust and fast predictions for sub-millimeter number counts.
keywords:
galaxies: evolution – galaxies: starburst – galaxies: star formation – submillimetre: galaxies – radiative transfer – infrared: galaxies1 Introduction
Robust constraints on the history of star formation in the Universe are fundamental to studies of galaxy evolution. Rest-frame ultraviolet (UV) surveys, particularly in the Hubble Deep Fields, have measured unobscured star formation out to and beyond (e.g. Oesch et al., 2018; Bouwens
et al., 2019, 2021; Bouwens et al., 2022; Stefanon et al., 2021; Finkelstein
et al., 2022; Tacchella
et al., 2022). However, such surveys are biased towards the least dust-obscured systems, which may represent a sub-dominant population at certain cosmic epochs. The population of rare but bright sub-millimeter galaxies (SMGs, Smail
et al. 1997; Barger et al. 1998; Hughes
et al. 1998; Blain
et al. 2002) discovered by early single-dish sub-millimeter observations appears to contribute significantly to the star formation rate density of the Universe (SFRD). Zavala
et al. (2021) estimate that dust-obscured star formation dominates the SFRD out to , and roughly equals the contribution of unobscured star formation (traced by the rest-frame UV and optical emission) at (see also Swinbank
et al., 2014; Dunlop
et al., 2017; Casey
et al., 2018; Bouwens
et al., 2020).
The most extreme SMGs () form stars at rates of thousands of solar masses per year, have established high stellar masses (; Magnelli
et al. 2012; Simpson
et al. 2014; Da Cunha
et al. 2015; Miettinen
et al. 2017; Dudzeviciute
et al. 2020) within the first few Gyr of cosmic time, and reside in the most massive haloes (Hickox
et al., 2012; Wilkinson
et al., 2017; Marrone
et al., 2018; Miller
et al., 2018; Garcia-Vergara et al., 2020; Stach et al., 2021). They hence place important constraints on the formation of dust and metals in the early Universe (Rowlands
et al., 2014; Magnelli
et al., 2020). However, detailed study of these systems has historically been difficult, due in part to the poor spatial resolution of single dish telescopes such as SCUBA and the lack of deep multi-wavelength data for cross-matching sub-millimeter detections (often of blended sources) to counterparts at other wavelengths.
However, recent developments in sub-millimeter interferometry, most recently the depth and angular resolution brought by ALMA, has transformed our understanding of SMGs (see the comprehensive review by Hodge &
da Cunha, 2020). We can now locate individual sources precisely, and derive much stronger constraints on source multiplicity (e.g. Stach et al. 2018 find that of single dish sources with are blends of two or more ALMA-detectable SMGs, each with flux density ; see also Hayward et al. 2013a, b; Hayward
et al. 2018). This has led to more robust SMG number counts, redshift distributions, and counterpart identification, which has enabled estimates of physical properties (e.g. Dudzeviciute
et al., 2020). We can now resolve the dust continuum and line emission of distant galaxies on sub-kiloparsec scales (and even lower for some strongly-lensed sources; e.g. Rybak et al. 2015a, b, 2020; Fujimoto
et al. 2021). A number of studies have reported that observed dust continuum emission is not co-located with emission in the rest-frame UV and optical (e.g. Chen et al., 2017; Cochrane et al., 2021), with the longer-wavelength emission typically being more compact (e.g. ; Hodge et al. 2016; Tadaki
et al. 2017; Calistro Rivera
et al. 2018; Chen et al. 2020). In some high-redshift sources, dust attenuation is high enough to render the sources near-infrared-faint (see Smail et al., 2021, for a statistical study).
Despite these major observational strides, SMGs present a challenge to models of galaxy formation. The majority of semi-analytic models (SAMs) fail to match the number counts of SMGs, under-predicting their numbers by 1-2 orders of magnitude (e.g. Cole et al., 2000; Granato et al., 2000; Somerville et al., 2012). Previously explored solutions have involved invoking different variants of a top-heavy IMF (Baugh et al., 2005; Lacey et al., 2016; Cowley et al., 2019); adopting a particularly extreme flat IMF in starbursts enabled Baugh et al. (2005) to match observed SMG number counts and redshift distribution as well as the local band luminosity function. However, given the wide range of tuneable parameters in SAMs, it remains unclear whether this is the solution (Safarzadeh
et al., 2017). One fundamental limitation is the lack of geometrical information in SAMs; while galaxies can be parametrised by, for example, a disk plus bulge component on which post-processing may be applied, the detailed relative geometries of dust and stars are not captured.
Hydrodynamical simulations track the positions of stellar and gas (and sometimes dust) particles, and hence do contain some information about their relative spatial distributions. There has been substantial recent interest in casting these simulations into the ‘observational plane’, made possible by radiative transfer codes such as skirt (Baes et al., 2011; Camps &
Baes, 2015), powderday (Narayanan
et al., 2021) and sunrise (Jonsson
et al., 2010). These codes work by propagating photons from ionising sources through a dust grid. Following substantial success in applying these codes to individual galaxies and limited samples of zoom-in simulations (e.g. Narayanan
et al., 2010, 2015; Hayward et al., 2011, 2012; Cochrane
et al., 2019, 2022; Parsotan et al., 2021), recent work has focused on application to large scale cosmological simulations. The EAGLE project presents predictions for galaxy spectral energy distributions (SEDs) using skirt (Camps et al., 2016; Trayford
et al., 2017). McAlpine
et al. (2019) show the good agreement between the physical properties (including the redshift distribution, SFRs, stellar and dust masses) of modelled and observed sub-mm sources (defined as those with ). However, the number counts of the most extreme sources are at least an order of magnitude lower than inferred from observations (Cowley et al., 2019; Wang
et al., 2019). Radiative transfer calculations (with powderday) have also been performed on the Simba simulations (Davé
et al., 2019). Lovell et al. (2021) show that their model is more successful at matching observed number counts than EAGLE (though the redshift distribution of bright sources is skewed to higher redshifts than is currently measured by observations). Simba’s larger number of sub-millimeter bright sources is tied to the ‘on-the-fly’ dust model, which produces galaxies with dust masses that are higher by a factor of than those calculated using a more commonly-adopted dust-to-metals ratio of . It is also related to the distribution of star formation rates at different redshifts: Simba models more high mass, high specific star formation rate galaxies than EAGLE at and by the global star formation rate density is higher than inferred from observations (Davé
et al., 2019). These existing works highlight the utility of SMG number counts as one of numerous observational constraints for the various physical processes included in galaxy formation models, such as AGN and stellar feedback and dust physics.
One key limitation of applying radiative transfer to cosmological simulations is the computational resources required. For a project such as CAMELS (Villaescusa-Navarro et al., 2021, 2022), which involves thousands of simulations with different initial conditions and parameter choices, this is intractable. Furthermore, for large-box simulations like EAGLE, the resolution is low and particle mass is high (), such that the cold molecular gas phase of the ISM is not resolved, and young stars can appear ‘clumped’ into a few, point-like regions (Camps et al., 2016). It is therefore necessary to artificially increase the particle mass and time resolution by performing a resampling procedure on the gas and young star particles prior to the radiative transfer procedure.
An alternative to running radiative transfer on large cosmological simulations is to apply well-calibrated scaling relations to the physical properties of simulated galaxies to estimate their fluxes. Hayward et al. (2011) used hydrodynamic simulations of isolated and merging galaxies to derive a relation between dust mass, SFR and (see also Hayward et al., 2013a). While a parametrised relation would be harder to derive for emission at shorter wavelengths, which have more complex dependencies on stellar populations and geometry/inclination, this works fairly well for sub-mm fluxes, which are expected to depend fundamentally on dust mass and dust temperature. Such a relation can then be applied to cosmological simulations (with lower particle resolution) to predict sub-mm flux densities with a trivial computational cost. Hayward
et al. (2021) applied the scaling relation derived in Hayward et al. (2013a) to derive SMG number counts for galaxies in the original Illustris (Genel et al., 2014; Vogelsberger
et al., 2014) and more recent IllustrisTNG simulations (Pillepich
et al., 2018; Weinberger
et al., 2017). Their predicted number counts for the two simulations differed significantly, with IllustrisTNG hosting fewer SMGs than Illustris by an order of magnitude. They argued that this was due to the lower dust masses and SFRs of high mass galaxies in IllustrisTNG. These differences in demographics relate to the differing subgrid recipes in the two simulations, and may relate to early, efficient galaxy quenching in IllustrisTNG. This example again highlights the sensitivity (and constraining power) of SMG number counts and redshift distributions to the subgrid models employed in cosmological simulations.
The Feedback In Realistic Environments project (Hopkins
et al., 2014, 2018b) provides an ideal set of high resolution zoom-in simulations with which to derive new scaling relations. Crucially, these simulations resolve the formation of giant molecular clouds, which is currently not possible over cosmological volumes. The implementation of radiative transfer does not, therefore, require particle resampling, and the detailed geometry of stars and dust can be better resolved (assuming that the dust traces the gas with a fixed dust-to-metals mass ratio). Coupling with radiative transfer models has shown that these simulations produce galaxies with realistic sizes in the sub-mm (Cochrane
et al., 2019). The focus of this paper is on deriving updated scaling relations to predict sub-mm flux densities using the FIRE-2 simulations.
The structure of this paper is as follows. In Section 2, we describe the FIRE simulations in detail and outline the radiative transfer methods used to make predictions for the rest-frame FIR emission of each simulation snapshot. In Section 3, we show that the predicted scaling relations between dust mass, star formation rate and observable sub-mm flux density are broadly consistent with a large, homogeneously-selected observational sample of SMGs. We then use our simulations to derive a simple, analytical formula that enables us to make rapid predictions for sub-mm flux density from SFR and dust mass. We validate this new relation using the observational data. In Section 4, we extend this study to predict sub-mm flux densities at various wavelengths by also including stellar mass and redshift terms. We apply the model to galaxies in the EAGLE simulations in Section 5 and draw conclusions in Section 7.
| Name | ||||||
|---|---|---|---|---|---|---|
| A1 | ||||||
| A2 | ||||||
| A4 | ||||||
| A8 | ||||||
| B1 | ||||||
| B2 | ||||||
| C1 | ||||||
| C2 |
2 Hydrodynamical simulations and radiative transfer calculations
2.1 Galaxies in the FIRE-2 simulations
The FIRE project (Hopkins
et al., 2014, 2018b) is a suite of state-of-the-art hydrodynamical cosmological zoom-in simulations designed to explore the role of stellar feedback in galaxy formation and evolution. Without stellar feedback, the ISM would collapse on dynamical timescales, leading to accelerated star formation. This is ruled out by the gas consumption timescales of observed galaxies, as well as by galaxy stellar mass functions and the stellar mass-halo mass relation (see the overviews presented in Hopkins
et al. 2011 and Somerville &
Davé 2015). Galactic outflows are believed to regulate the mass of galaxies over time (Kereš et al., 2009; Faucher-Giguère
et al., 2015; Anglés-Alcázar et al., 2017b) and to enrich the circumgalactic medium (see Hafen et al., 2019) and intergalactic medium (see the review by Rupke 2018). Numerous stellar feedback processes are believed to contribute, in a complex, non-linear manner. These include supernovae, protostellar jets, photo-heating, stellar mass loss from O- and AGB-stars and radiation pressure (see the review of Dale, 2015). Cosmological zoom simulations have only recently achieved sufficient resolution to model these feedback processes directly.
Multi-channel feedback is modelled by FIRE using two primary techniques. Firstly, FIRE resolves the formation of giant molecular clouds (GMCs), with star formation taking place only in self-gravitating (according to the Hopkins
et al. 2013 criterion), self-shielding molecular gas (following Krumholz &
Gnedin 2011) at high densities ( in the simulations we use here). Secondly, FIRE includes models for energy and momentum return from the main stellar feedback processes, with direct implementation of the predictions of stellar population synthesis models without parameter tuning. Once a star particle forms, the simulations explicitly follow several different stellar feedback mechanisms, as detailed in Hopkins
et al. (2018a), including (1) local and long-range momentum flux from radiation pressure (in both the initial UV/optical single-scattering regime and re-radiated light in the IR); (2) energy, momentum, mass and metal injection from SNe (Types Ia and II) and stellar mass loss (both OB and AGB); and (3) photo-ionization and photo-electric heating. Every star particle is treated as a single stellar population with known mass, age, and metallicity. All feedback event rates, luminosities and energies, mass-loss rates, and all other quantities are tabulated directly from stellar evolution models (starburst99; Leitherer
et al. 1999), assuming a Kroupa (2002) initial mass function. The FIRE prescription enables the self-consistent generation of galactic winds (Muratov et al., 2015; Anglés-Alcázar et al., 2017b; Pandya
et al., 2021) and the reproduction of many observed galaxy properties, including stellar masses, star formation histories and the ‘main sequence’ of star-forming galaxies (see Hopkins
et al. 2014; Sparre
et al. 2017), metallicities and abundance ratios (Ma et al., 2016; van de Voort et al., 2015), as well as morphologies and kinematics of both thin and thick disks (Ma et al., 2018).
For this paper, we study the central galaxies of eight massive haloes originally selected and simulated by Feldmann et al. (2016, 2017) with the original FIRE model (Hopkins
et al., 2014) as part of the MassiveFIRE suite. The first four of these are drawn from the ‘A-series’ of Feldmann et al. (2017) (A1, A2, A4 and A8). These haloes were selected to have dark matter halo masses of at . The central galaxies of these haloes have stellar masses of at (detailed in Table 1), with a variety of formation histories; see Feldmann et al. (2017) for details. The subset of four A-series haloes studied in this paper are drawn from Anglés-Alcázar et al. (2017c), who re-simulated them down to with the upgraded FIRE-2 physics model (Hopkins
et al., 2018b) and with a novel on-the-fly treatment for the seeding and growth of supermassive black holes (SMBHs; see Anglés-Alcázar
et al. (2017a) for details of the gravitational torque-driven model). Compared to FIRE-1, FIRE-2 simulations are run with a new, more accurate hydrodynamics solver (a mesh-free Godunov solver implemented in the gizmo111http://www.tapir.caltech.edu/~phopkins/Site/GIZMO.html code; Gaburov &
Nitadori 2011; Hopkins 2015). They also feature improved treatments of cooling and recombination rates, gravitational softening and numerical feedback coupling, and they adopt a higher density threshold for star formation (Hopkins
et al., 2018a). Note that these simulations do not include feedback from the accreting SMBHs 222Given that in extreme cases, AGN can be the dominant driver of cold dust emission (McKinney
et al., 2021), it would be interesting to repeat our analyses with simulations including AGN feedback and emission in future work. However, we expect this effect to be unimportant for the bulk of the population.. A small number of snapshots from these haloes were also studied in Cochrane
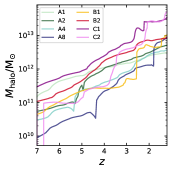
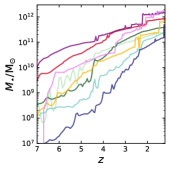
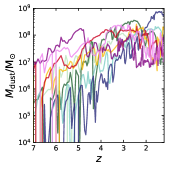
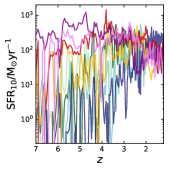
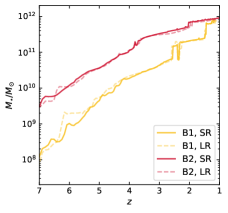
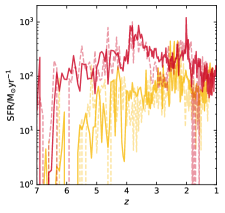
et al. (2019) and Parsotan et al. (2021). For this study, we supplement the four ‘A-series’ haloes by re-running four more haloes from Feldmann et al. (2017), with the updated FIRE-2 physics. Two of the haloes are drawn from their ‘B-series’ (B1 and B2) and two from the ‘C-series’ (Cm1:0, hereafter C1, and C2:0, hereafter C2). The B and C series haloes were selected to have dark matter halo masses of and at , respectively. For these four haloes, we do not implement black hole seeding or growth. In Figure 1 we show the evolution of the halo mass of each of the eight haloes, as well as the evolution of the stellar mass, dust mass, and star formation rate of their central galaxies.
The mass resolution of our A-series simulations is for gas and star particles and for dark matter particles (high resolution, hereafter HR). The mass resolution of our B-series simulations is for gas and star particles and for dark matter particles (standard resolution, hereafter SR). The mass resolution of our C-series simulations is for gas and star particles and for dark matter particles (low resolution, hereafter LR). We describe the resolution tests in Appendix A, and show that even the lowest resolution simulations are converged.
2.2 Performing radiative transfer to predict realistic galaxy fluxes
Modelling the multi-wavelength emission from simulated galaxies can be challenging due to the need to account for the complex three-dimensional spatial distribution of radiation sources (stars and AGN), and the dust particles that scatter, absorb and re-emit light. Performing the detailed radiative transfer modelling necessary can be computationally expensive (see Steinacker
et al., 2013, for a review).
In this work we follow the methods described in Cochrane
et al. (2019) to apply the Stellar Kinematics Including Radiative Transfer (skirt)333http://www.skirt.ugent.be Monte Carlo radiative transfer code (Baes et al., 2011; Camps &
Baes, 2015) to FIRE-2 galaxies in post-processing. Monte Carlo radiative transfer codes like skirt treat the radiation field as a flow of photons through the dusty medium of a galaxy to compute the effects of dust absorption, scattering, and re-emission of the absorbed light, including dust self-absorption. While Cochrane
et al. (2019) selected only the most sub-mm bright snapshots for their analysis, we have run skirt on all simulation snapshots for each of the eight haloes studied. We briefly summarise the method here.
Gas and star particles (along with their properties such as age and metallicity) are drawn from the FIRE-2 simulations at each snapshot. Prior to input to skirt, we rotate the particles to align the line-of-sight with the angular momentum vector of the gas particles within , such that the galaxy is ‘face on’ (for disk galaxies) at a viewing angle of 0 degrees. Dust particles are assumed to follow the distribution of the metals, with a dust-to-metals mass ratio of (Dwek, 1998; James
et al., 2002). We assume dust destruction at (Draine &
Salpeter, 1979; Tielens
et al., 1994). We model a mixture of graphite, silicate and PAH grains using the Weingartner &
Draine (2001) Milky Way dust prescription. Star particles are assigned Bruzual &
Charlot (2003) SEDs based on their ages and metallicities, assuming a Chabrier (2003) IMF. We use an octree dust grid, in which cell sizes are adjusted according to the dust density distribution, with the condition that no dust cell may contain more than of the total dust mass of the galaxy. We use photon packages, following tests that show convergence see Appendix B).
The skirt output at a given modelled source orientation comprises spatially-resolved images (on a grid with pixel side length ) at discrete rest-frame wavelengths, spaced uniformly in log(wavelength) between rest-frame UV and FIR wavelengths. We also add the rest-frame wavelength corresponding to each ALMA band, for each snapshot (i.e. different rest-frame wavelengths that depend on the redshift of the snapshot). We model seven detectors at different orientations with respect to the disk plane of the galaxy. The field of view is set to 10% of the virial radius for each galaxy snapshot studied. Tests confirm that this radius encloses all the sub-millimeter flux density from the simulated galaxy, even at the highest redshifts studied, where the virial radius is smallest.
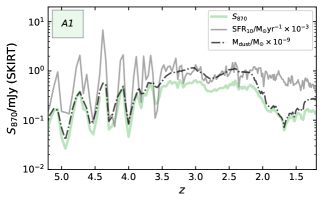
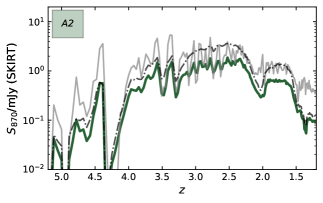
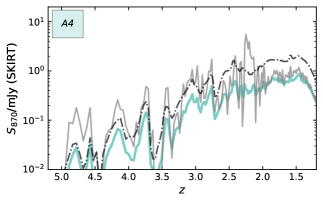
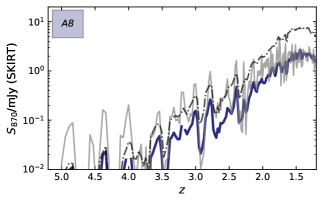
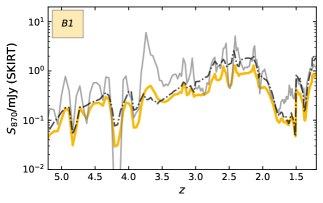
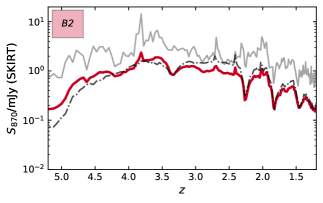
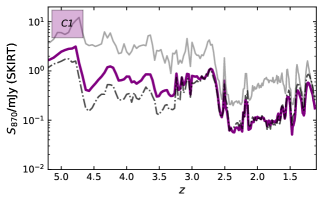
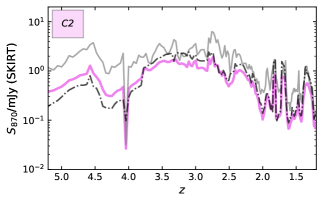
Although skirt provides predictions for UV-FIR fluxes, in this paper, we focus on observed-frame sub-mm emission. The measured emission at these wavelengths is insensitive to orientation since we are usually in the optically thin regime (e.g. Cochrane
et al., 2019), so we consider just the ‘face-on’ skirt-generated SED. In Figure 2, we plot the evolution of the predicted (observed-frame) flux density, , SFR and dust mass, for each of the eight simulated haloes. All physical quantities are calculated within a 3D aperture of radius .
3 Scaling relations between , SFR and dust mass
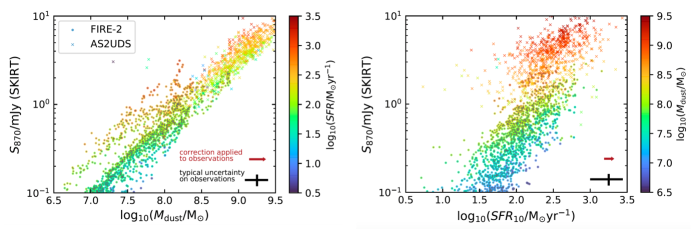
In this section, we derive a simple power-law scaling relation between SFR, dust mass and flux density. First, we establish that the FIRE-2 galaxies broadly follow the same trends in and as observed galaxies. In Figure 3, we plot dust mass and SFR against skirt-predicted for all snapshots studied for each of the eight haloes. We overplot observational data from the AS2UDS sample of sub-mm sources Dudzeviciute
et al. (2020), homogeneously selected from the SCUBA-2 Cosmology Legacy Survey map of the UKIDSS/UDS field (Stach
et al., 2019). Dudzeviciute
et al. (2020) use the magphys SED fitting code to infer dust mass and SFR from UV-radio photometry. Dudzeviciute
et al. (2020) test the reliability of the magphys-derived quantities by fitting mock photometry of simulated EAGLE galaxies with known physical properties. They thereby infer correction factors (‘true’ dust mass is a factor of higher than derived by magphys, while ‘true’ SFR is a factor of higher). We apply these correction factors to their derived estimates. From these plots, it is clear that our predictions are in reasonable agreement with the observationally derived relations, though we do not reach the brightest sub-mm flux densities observed in AS2UDS, due to the limited parameter space probed by our small set of simulations (in particular, we do not reach extremely high values of SFR or ).
As seen from Figure 3, it is clear from both observations and our simulations that both dust mass and SFR correlate with . Neither dust mass nor SFR predicts alone: at fixed dust mass, galaxies with higher star formation rates have higher , and at fixed star formation rate, galaxies with larger dust masses also have higher . In Section 3.1, we fit a power-law relation to relate the three quantities.
3.1 Predicting from SFR and dust mass for FIRE galaxies
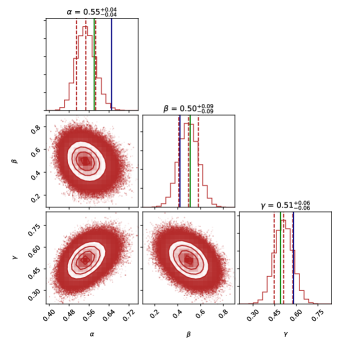
Following Hayward et al. (2011), we fit the following relation using the emcee package (Foreman-Mackey et al., 2013):
| (1) |
Here, corresponds to the star formation rate averaged over the before the snapshot; this approximately corresponds to the timescales probed by observable SFR tracers (e.g. Flores
Velázquez et al., 2021). is the total dust mass used by skirt in the radiative transfer. We were motivated to adopt this functional form due to its success in fitting radiative transfer-predicted flux densities previously (Hayward et al., 2011, 2013b) and its simplicity.
We present our results in Figure 4. The derived parameters are , , and . Hayward et al. (2011) derived , , and . We overplot their results in blue. Lovell et al. (2021) perform a similar fit to galaxies in SIMBA, and obtain , , and . We overplot their results in green. No uncertainties are provided by either of these works. While the estimates of Lovell et al. (2021) are within of ours, those of Hayward et al. (2011) deviate more. The correlations between the fitted parameters shown in Figure 4 help explain some discrepancies. While their estimate of is lower than ours, their estimate of is greater. This makes sense given the negative correlations between the two parameters shown in 4. Their value of deviates from ours by over . Despite these differences, it is encouraging that the derived relations agree to the degree that they do; Hayward et al. (2011), for example, used highly idealized simulations with less sophisticated models for star formation, the ISM and stellar feedback.
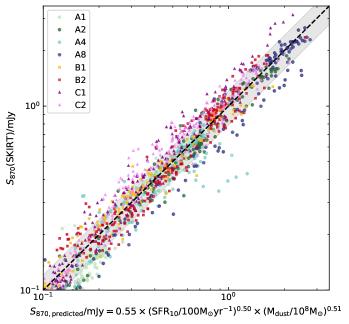
In Figure 5, we compare the sub-mm flux densities predicted by our formula to the flux densities derived using the radiative transfer, for the FIRE galaxy snapshots used in deriving the scaling relation. This shows how well the combination of and dust mass can predict sub-mm flux density. For galaxies with , the mean is . The standard deviation is . This indicates that can typically be predicted to within from the star formation rate and dust mass of a simulated galaxy alone. The tightness of this relation is encouraging. We explore the validity of application to other simulations in our application of FIRE-derived scaling relations to EAGLE galaxies in Section 5.
3.2 Comparison with observational data
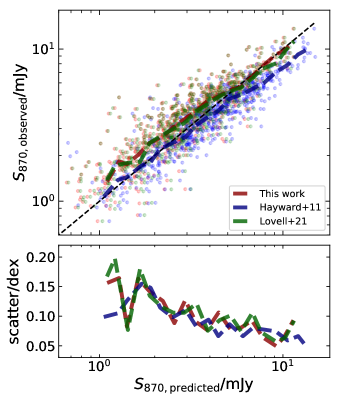
To validate our power law relation, we apply it to the (systematic bias-corrected) dust mass and SFR values predicted by magphys for the AS2UDS galaxies. In Figure 6 (upper panel), we show observed versus predicted flux densities. The median value of is (see middle panel). The standard deviation in is shown in the lower panel and is fairly constant with observed flux density, remaining at . This adds confidence that our simulation-derived relations are consistent with those of real observed galaxies.Note that without the correction for bias in the magphys-inferred physical properties, the is systematically higher than predicted by the relation by .
4 Extension to other FIR/sub-mm flux densities
Following the success of our simple power law scaling between star formation rate, dust mass and flux density, presented in Section 3, we attempt to predict the FIR SED at more wavelengths via a similar parametrisation. We develop a model that may be applied to the global properties of simulated galaxies to make rapid predictions for galaxy number counts at various sub-mm wavelengths. These simulated galaxies could include large box simulations, for which running radiative transfer would be computationally infeasible; simulations with lower resolution (and more poorly resolved ISM) for which the output of radiative transfer may be unreliable; and semi-analytic models, where detailed spatial distributions of stars and dust do not exist.
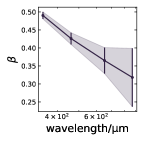
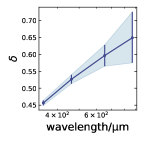
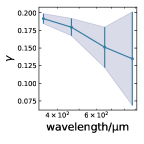
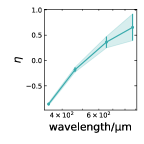
We fit the following relation to SKIRT-predicted observed-frame flux densities at , , and (corresponding to ALMA Bands 10, 9, 8 & 7, respectively), for snapshots in the redshift range :
| (2) |
Redshift is an important added parameter in this extension to other wavelengths, since we are fitting various observed-frame wavelengths and hence cannot rely on the negative correction for redshift-independence. As in Section 3.1, we use the SFR averaged over the prior to each snapshot. We again use the emcee package. Our best-fitting parameters are presented in Table 2 and plotted as a function of wavelength in Figure 7. We note the following trends in fitted parameters with wavelength. The normalisation factor, , decreases with increasing wavelength, in line with the expected decrease in flux density with wavelength. decreases with increasing wavelength, reflecting the increased role of SFR in determining sub-mm flux density around the peak of the dust SED. increases with wavelength, reflecting the increasing dominance of dust mass in driving sub-mm flux density as one approaches the Rayleigh-Jeans tail (see also Cochrane
et al. 2022). is low () at all wavelengths, showing the weak dependence of sub-mm flux density on stellar mass. increases with wavelength, in line with expectations from the negative -correction.
Our derived scaling relations recover the skirt-derived flux densities accurately at all four wavelengths. Median values of offsets and scatter are , , and , for , , and , respectively. Using our scaling relations, the majority of the flux densities are predicted to within , with no strong trends with flux density (see Figure 8). In Section 5, we apply the derived relations to simulated galaxies from EAGLE.


5 Application of the FIRE-trained relations to the EAGLE simulation
5.1 The EAGLE simulation
The Virgo Consortium’s Evolution and Assembly of GaLaxies and their Environments project (EAGLE444http://icc.dur.ac.uk/Eagle/; Crain et al. 2015; Schaye
et al. 2015) comprises a suite of simulations based on a modified version of the GADGET 3 SPH code (Springel
et al., 2005). The simulations use subgrid models for radiative cooling, star formation, stellar mass loss and metal enrichment, gas accretion onto black holes, black hole mergers, and energy feedback from both massive stars and AGN.
Feedback models are calibrated to the observationally inferred galaxy stellar mass function, the galaxy stellar mass - size relation, and the galaxy-black hole mass relation (Crain et al., 2015). EAGLE reproduces a number of other observed galaxy relations (among them, distributions of specific star formation rate, passive fractions, the evolution of the stellar mass function, galaxy rotation curves, and the Tully-Fisher relation), despite not being explicitly calibrated to match them (Furlong, 2017; Schaller
et al., 2015; Schaye
et al., 2015; Trayford
et al., 2015).
The various simulations within the EAGLE suite are presented in McAlpine
et al. (2016). We draw our galaxy samples from the largest box (version Ref-L100N1504; comoving side length , 7 billion particles) to give the best number statistics. We select galaxies within the redshift range . For the version of the EAGLE simulation we use, the particle mass resolution for gas is , and the particle mass resolution for dark matter is . The resolution was chosen to marginally resolve the Jeans mass of the gas at the star formation threshold. The comoving (Plummer equivalent) gravitational softening length is . Since EAGLE is a large box cosmological simulation, its resolution is low compared to the HR and SR FIRE zoom-ins.
5.2 Modelled sub-millimeter flux densities for EAGLE galaxies
We draw synthetic fluxes for the EAGLE galaxies from the ‘DustyFluxes’ table, which is part of the public database. These observed-frame fluxes were generated following the methods described in Camps et al. (2018), which we summarise here.
For each galaxy, gas and star particles were extracted within proper of the centre of mass of the star particles. Although the EAGLE project also uses the skirt radiative transfer code to generate galaxy SEDs, their methods of generating the intrinsic stellar emission differ from ours (primarily due to the lower particle mass resolution of EAGLE). Star particles with ages and gas particles with non-zero SFRs were re-sampled into a number of sub-particles. These sub-particles have lower masses, drawn randomly from a mass distribution function chosen based on observations of molecular clouds in the Milky Way. Each sub-particle has a random formation time, assuming constant SFR over the previous . Of the generated set of sub-particles, those with assigned ages define a set of ‘star-forming’ particles input separately to the radiative transfer. Older sub-particles were added to the set of star particles with ages . Gas sub-particles that have not yet formed stars were added to the set of gas particles with zero SFR. There were then three inputs to the skirt radiative transfer: stars with ages , stars with ages , and gas.
Within skirt, dust was modelled based on the ‘cold’ gas particles (those with a non-zero SFR or temperature ), assuming a dust-to-metals mass fraction of and a Zubko
et al. (2004) dust model. SEDs were assigned to stellar particles with ages using a Bruzual &
Charlot (2003) models, taking into account mass, metallicity and age. Younger star particles were assigned starburst SEDs from the MAPPINGS III family (Groves et al., 2008; Jonsson
et al., 2010), which aims to model the HII regions as well as the photodissociation regions (PDRs). Each young particle was also assigned a position based on the position and smoothing length of its parent particle. Since dust is partially modelled by the MAPPINGS implementation of the PDR, the implicit PDR dust masses were subtracted from the diffuse dust distribution surrounding the star-forming region (otherwise this dust would be ‘double counted’). The radiative transfer was then performed on an octree grid.
5.3 Rapid predictions of number counts using the trained scaling relations
In this section, we apply the scaling relations derived using FIRE galaxies (as described in Section 4) to EAGLE galaxies, generating predicted flux densities in four ALMA bands for each EAGLE galaxy. We generate number counts using these predicted flux densities, as well as using the flux densities derived directly from the application of skirt to EAGLE described in Section 5.2, and compare the resulting number counts.
We first select EAGLE galaxies in the redshift range . We input the relevant features for each of the EAGLE snapshots in the sample to the scaling relations derived in Section 4. Note that although EAGLE have used a different dust-to-metals mass ratio in their calculation of dust mass (, compared to our ), this does not affect the robustness of our flux density estimates because the dust mass rather than the gas mass is used in our scaling relation. The process of predicting the flux densities that would be observed at the wavelengths of the various ALMA bands, for all EAGLE snapshots, from the dust mass, star formation rate, stellar mass and redshift takes just a few minutes on a laptop.
We compare the flux densities predicted using our scaling relations to those predicted using skirt. We show the median difference between model and skirt-predicted flux density values, as a function of model-predicted flux density, in the middle panel of Figure 8. Encouragingly, there is no significant bias (i.e. the median offset is ), except at the shortest wavelength studied, where skirt predicts lower flux densities than our relations for the faintest sources. The scatter in this relation is shown in the lower panel of Figure 8. The scatter for EAGLE galaxies is low, within across over two orders of magnitude of flux density, for all wavelengths studied. The success of our FIRE-derived scaling relations in predicting the flux densities for EAGLE galaxies is notable. It means that, for galaxies drawn from EAGLE and FIRE with a given set of physical parameters (dust mass, stellar mass, star formation rate and redshift), skirt predicts very similar sub-millimeter flux density values, despite the different input physics, subgrid models and resolutions of the two simulations. This is encouraging for the broader application of the scaling relations.
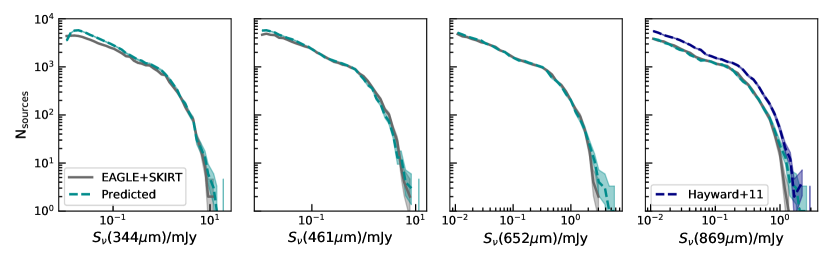
We display the number counts predicted by the scaling relations and those derived directly from EAGLE+skirt in Figure 9. These show excellent agreement, in general to within Poisson uncertainties (unlike those derived using the scaling relation derived by Hayward et al. 2011, which over-predict counts by at all flux densities). We marginally over-predict bright sources, possibly due to Eddington (1913) bias. The overall success of our scaling relations is particularly encouraging given that they were trained on simulations with different input physics and resolutions, and with slightly different radiative transfer setup.
This shows that our scaling relations can be applied to other simulations and semi-analytical or semi-empirical models to generate robust and fast predictions for number counts.
6 Discussion
Our FIRE-trained scaling relations are remarkably accurate in predicting sub-millimeter flux densities of EAGLE galaxies from global galaxy properties alone. They provide a promising path for rapid generation of sub-millimeter number counts where radiative transfer is infeasible. Here, we will discuss some limitations of our method and avenues for future work.
Although the FIRE-2 simulations used here succeed in reproducing many observed galaxy properties, including the compact sizes of massive sub-millimeter galaxies (Cochrane
et al., 2019), there remain some limitations to the model. Firstly, as shown in Parsotan et al. (2021), the optical sizes of massive FIRE-2 galaxies are over-compact compared to the observationally-derived size-stellar mass relation, particularly at . Less massive FIRE-2 galaxies do not display this issue (El-Badry et al., 2016). This is at least partially attributable to the lack of AGN feedback in the models; numerous works have shown that AGN-driven winds leave an impact on galaxy stellar sizes and densities (e.g. Choi et al., 2018; Zoldan et al., 2019; Van der Vlugt
et al., 2021). Efforts to implement AGN feedback into the simulations have already begun (Wellons
et al., 2022; Anglés-Alcázar et al., 2022), and future work will explore the impact of AGN-driven winds on physical and observable galaxy sizes (Cochrane &
Angles-Alcazar, 2022). An AGN feedback implementation would impact the evolution of stellar mass and star formation rate in a simulated massive galaxy. However, in this work we derive scaling relations to predict sub-millimeter flux density given some input physical quantities, so this work should be robust to changes in the details of the feedback models. The success of our model in predicting sub-millimeter number counts of galaxies drawn from the EAGLE simulations, which do include thermal AGN feedback (Schaye
et al., 2015), supports this.
Secondly, although our radiative transfer method is well-established and sophisticated compared to simple dust screen models, we do not model dust production, growth or destruction in a self-consistent manner. In this paper we use a fixed dust-to-metals ratio of ; this assumption and slight variations on it are common in the post-processing of zoom and cosmological scale simulations (e.g. Camps et al., 2016; Liang
et al., 2018, 2019; Trayford &
Schaye, 2019; Cochrane
et al., 2019; Parsotan et al., 2021; Popping
et al., 2022), though note that efforts to implement dust evolution in FIRE are ongoing (Choban et al., 2022). In Simba, which does include a model for on-the-fly dust production and destruction (following McKinnon et al. 2017), average dust masses are a factor of higher than if this fixed dust-to-metals ratio had been applied (Lovell et al., 2021). These leads to more bright sub-millimeter galaxies in Simba. Nevertheless, since dust mass is an input parameter to our scaling relations, the derived relations should not be highly sensitive to the exact values. Of more concern is the spatially-invariant dust-to-metals ratio; observational results disagree about the validity of this assumption (see Chiang et al. 2018 and references therein). If the geometry of the dust is important for the flux densities and unrealistic, our scaling relations could be biased. However, the success of our model in bypassing radiative transfer for EAGLE galaxies, which are simulated at lower spatial resolution, points towards this being of negligible importance at the wavelengths studied.
We have limited the scope of this work to a small set of observed-frame sub-millimeter flux densities. As argued, sub-millimeter number counts and redshift distributions can provide an important constraint to galaxy formation models. Ideally, though, our model would be generalizable to shorter wavelengths and able to make fast predictions for full galaxy SEDs. In future work, we will explore machine learning-based approaches to this problem.
7 Conclusions
In this paper, we have trained simple scaling relations between observable sub-millimeter flux densities of simulated high redshift galaxies and combinations of their key intrinsic physical properties, including star formation rate, dust mass, stellar mass and redshift. We use a set of high-resolution cosmological zoom-in simulations of massive, star-forming galaxies from the FIRE suite. We use skirt to perform radiative transfer on the simulated galaxies, thereby incorporating a realistic star-dust geometry (assuming that the dust-to-metals mass ratio is constant and does not vary spatially). We generate observed-frame galaxy SEDs, from which we extract predictions for the emission that would be measured by ALMA bands , , , and ().
The primary aim of this project is to make use of our very high resolution and computationally expensive simulations to derive relations that can be applied to other models. Applications include large box simulations, for which running radiative transfer can be infeasible; lower-resolution simulations for which the dust-star geometry is inadequately resolved for robust SED prediction; and semi-analytic and semi-empirical models for which detailed detailed spatial distributions of stars and dust do not exist. The relations we derive between physical properties (dust mass, stellar mass, and redshift) and flux density have strong physical bases. At longer wavelengths, the dependence of flux density on dust mass increases, as would be expected as we move closer to the Rayleigh-Jeans regime. Star formation rate plays an increased role at shorter wavelengths, further from the Rayleigh-Jeans regime, where flux density is expected to depend super-linearly on dust temperature. At all wavelengths studied, flux density is only weakly dependent on stellar mass. The relations we derive are broadly consistent with previous work using both single halo idealised zooms and cosmological scale simulations; this indicates that global galaxy properties determine most of the variation in the sub-mm flux densities of galaxies.
We apply our derived scaling relations to galaxies from EAGLE, a large box cosmological hydrodynamical simulation. Importantly, radiative transfer has already been performed on these EAGLE galaxies, with skirt outputs provided as part of the publicly-available online database. We find that EAGLE sub-millimeter number counts derived using our simple scaling relations agree remarkably well with those constructed using the radiative transfer-derived flux densities. This provides confidence in the validity of the application of the scaling relations to simulations with very different resolutions and physics to FIRE-2. As highlighted by Cochrane
et al. (2019), UV-optical emission is expected to be more strongly dependent on the resolved ISM geometry and viewing angle; predictions for emission at these shorter wavelengths thus strongly motivate detailed radiative transfer. In future work, we will explore methods to predict the entire UV-FIR galaxy SED from intrinsic galaxy properties.
Acknowledgements
We thank the anonymous reviewer, Caleb Choban and Desika Narayanan for helpful comments on earlier versions of this paper. The Flatiron Institute is supported by the Simons Foundation. RKC is grateful for the support of the John Harvard Distinguished Science Fellowship. DAA was supported in part by NSF grants AST-2009687 and AST-2108944, and CXO grant TM2-23006X. The FIRE project is supported by the NSF and TACC, by grants AST21010 and AST20016.
Data availability
The data underlying this article will be shared on reasonable request to the corresponding author.
References
- Anglés-Alcázar et al. (2017a) Anglés-Alcázar D., Davé R., Faucher-Giguère C.-A., Özel F., Hopkins P. F., 2017a, MNRAS, 464, 2840
- Anglés-Alcázar et al. (2017b) Anglés-Alcázar D., Faucher-Giguère C.-A., Kereš D., Hopkins P. F., Quataert E., Murray N., 2017b, MNRAS, 470, 4698
- Anglés-Alcázar et al. (2017c) Anglés-Alcázar D., Faucher-Giguère C. A., Quataert E., Hopkins P. F., Feldmann R., Torrey P., Wetzel A., Kereš D., 2017c, MNRAS, 472, L109
- Anglés-Alcázar et al. (2022) Anglés-Alcázar D., Mercedes-Feliz J., Al E., Al E., 2022, in prep.
- Baes et al. (2011) Baes M., Verstappen J., De Looze I., Fritz J., Saftly W., Vidal Pérez E., Stalevski M., Valcke S., 2011, ApJS, 196
- Barger et al. (1998) Barger A. J., Cowie L., Sanders D. B., Fulton E., Taniguchi Y., Sato Y., Kawara K., Okuda H., 1998, Nature, 394, 248
- Baugh et al. (2005) Baugh C. M., Lacey C. G., Frenk C. S., Granato G. L., Silva L., Bressan A., Benson A. J., Cole S., 2005, MNRAS, 356, 1191
- Blain et al. (2002) Blain A. W., Smail I., Ivison R. J., Kneib J. P., Frayer D. T., 2002, Phys. Rep., 369, 111
- Bouwens et al. (2019) Bouwens R. J., Stefanon M., Oesch P. A., Illingworth G. D., Nanayakkara T., Roberts-Borsani G., Labbé I., Smit R., 2019, ApJ, 880, 25
- Bouwens et al. (2020) Bouwens R., et al., 2020, ApJ, 902, 112
- Bouwens et al. (2021) Bouwens R. J., et al., 2021, ApJ, 162, 47
- Bouwens et al. (2022) Bouwens R. J., Illingworth G., Ellis R. S., Oesch P., Paulino-Afonso A., Ribeiro B., Stefanon M., 2022, ApJ, 931, 81
- Bruzual & Charlot (2003) Bruzual G., Charlot S., 2003, MNRAS, 344, 1000
- Calistro Rivera et al. (2018) Calistro Rivera G., et al., 2018, ApJ, 863, 56
- Camps & Baes (2015) Camps P., Baes M., 2015, Astronomy and Computing, 9, 20
- Camps et al. (2016) Camps P., Trayford J. W., Baes M., Theuns T., Schaller M., Schaye J., 2016, MNRAS, 462, 1057
- Camps et al. (2018) Camps P., et al., 2018, ApJ, 234, 20
- Casey et al. (2018) Casey C. M., et al., 2018, ApJ, 862, 77
- Chabrier (2003) Chabrier G., 2003, PASP, 115, 763
- Chen et al. (2017) Chen C.-C., et al., 2017, ApJ, 846, 108
- Chen et al. (2020) Chen C.-C., et al., 2020, A&A, 635, A119
- Chiang et al. (2018) Chiang I.-D., Sandstrom K. M., Chastenet J., Johnson L. C., Leroy A. K., Utomo D., 2018, ApJ, 865, 117
- Choban et al. (2022) Choban C. R., Hopkins D. K. P. F., Sandstrom K. M., Hayward C. C., Faucher-Giguère C.-A., 2022, MNRAS, 22, 1
- Choi et al. (2018) Choi E., Somerville R. S., Ostriker J. P., Naab T., Hirschmann M., 2018, ApJ, 866, 91
- Cochrane & Angles-Alcazar (2022) Cochrane R., Angles-Alcazar D., 2022, in prep.
- Cochrane et al. (2019) Cochrane R. K., et al., 2019, MNRAS, 488, 1779
- Cochrane et al. (2021) Cochrane R. K., Best P. N., Smail I., Ibar E., Cheng C., Swinbank A. M., Molina J., Sobral D., 2021, MNRAS, 503, 2622
- Cochrane et al. (2022) Cochrane R. K., Hayward C. C., Angles-Alcazar D., 2022, ApJL, 939, L27
- Cole et al. (2000) Cole S., et al., 2000, MNRAS, 326, 255
- Cowley et al. (2019) Cowley W. I., Lacey C. G., Baugh C. M., Cole S., Frenk C. S., Lagos C. d. P., 2019, MNRAS, 487, 3082
- Crain et al. (2015) Crain R. A., et al., 2015, MNRAS, 450, 1937
- Da Cunha et al. (2015) Da Cunha E., et al., 2015, ApJ, 806, 110
- Dale (2015) Dale J. E., 2015, New Astronomy Reviews, 68, 1
- Davé et al. (2019) Davé R., Anglés-Alcázar D., Narayanan D., Li Q., Rafieferantsoa M. H., Appleby S., 2019, MNRAS, 486, 2827
- Draine & Salpeter (1979) Draine B. T., Salpeter E. E., 1979, ApJ, 231, 77
- Dudzeviciute et al. (2020) Dudzeviciute U., et al., 2020, MNRAS, 494, 3828
- Dunlop et al. (2017) Dunlop J. S., et al., 2017, MNRAS, 466, 861
- Dwek (1998) Dwek E., 1998, ApJ, 1, 643
- Eddington (1913) Eddington A. S., 1913, MNRAS, 73, 359
- El-Badry et al. (2016) El-Badry K., Wetzel A., Geha M., Hopkins P. F., Kereš D., Chan T. K., Faucher-Giguère C.-A., 2016, ApJ, 820, 131
- Faucher-Giguère et al. (2015) Faucher-Giguère C. A., Hopkins P. F., Kerěs D., Muratov A. L., Quataert E., Murray N., 2015, MNRAS, 449, 987
- Feldmann et al. (2016) Feldmann R., Hopkins P. F., Quataert E., Faucher-Giguère C. A., Kerěs D., 2016, MNRAS, 458, L14
- Feldmann et al. (2017) Feldmann R., Quataert E., Hopkins P. F., Faucher-Giguére C. A., Kereš D., 2017, MNRAS, 470, 1050
- Finkelstein et al. (2022) Finkelstein S. L., et al., 2022, ApJ, 928, 52
- Flores Velázquez et al. (2021) Flores Velázquez J. A., et al., 2021, MNRAS, 501, 4812
- Foreman-Mackey (2016) Foreman-Mackey D., 2016, JOSS, 24
- Foreman-Mackey et al. (2013) Foreman-Mackey D., Hogg D. W., Lang D., Goodman J., 2013, PASP, 125, 306
- Fujimoto et al. (2021) Fujimoto S., et al., 2021, ApJ, 911, 99
- Furlong (2017) Furlong M., 2017, MNRAS, 465, 722
- Gaburov & Nitadori (2011) Gaburov E., Nitadori K., 2011, MNRAS, 414, 129
- Garcia-Vergara et al. (2020) Garcia-Vergara C., Hodge J., Hennawi J. F., Weiss A., Wardlow J., Myers A. D., Hickox R., 2020, ApJ, 904
- Gehrels (1986) Gehrels N., 1986, ApJ, 303, 336
- Genel et al. (2014) Genel S., et al., 2014, MNRAS, 445, 175
- Granato et al. (2000) Granato G. L., Lacey C. G., Silva L., Bressan A., Baugh C. M., Cole S., Frenk C. S., 2000, ApJ, 542, 710
- Groves et al. (2008) Groves B., Dopita M. A., Sutherland R. S., Kewley L. J., Fischera J., Leitherer C., Brandl B., van Breugel W., 2008, ApJS, 176, 438
- Hafen et al. (2019) Hafen Z., et al., 2019, MNRAS, 488, 1248
- Hayward et al. (2011) Hayward C. C., Kereš D., Jonsson P., Narayanan D., Cox T. J., Hernquist L., 2011, ApJ, 743
- Hayward et al. (2012) Hayward C. C., Jonsson P., Kereš D., Magnelli B., Hernquist L., Cox T. J., 2012, MNRAS, 424, 951
- Hayward et al. (2013a) Hayward C. C., Narayanan D., Kereš D., Jonsson P., Hopkins P. F., Cox T. J., Hernquist L., 2013a, MNRAS, 428, 2529
- Hayward et al. (2013b) Hayward C. C., Behroozi P. S., Somerville R. S., Primack J. R., Moreno J., Wechsler R. H., 2013b, MNRAS, 434, 2572
- Hayward et al. (2018) Hayward C. C., et al., 2018, MNRAS, 476, 2278
- Hayward et al. (2021) Hayward C. C., et al., 2021, MNRAS, 502, 2922
- Hickox et al. (2012) Hickox R. C., et al., 2012, MNRAS, 421, 284
- Hodge & da Cunha (2020) Hodge J. A., da Cunha E., 2020, Royal Society Open Science, 7, 200556
- Hodge et al. (2016) Hodge J. A., et al., 2016, ApJ, 833, 1
- Hopkins (2015) Hopkins P. F., 2015, MNRAS, 450, 53
- Hopkins et al. (2011) Hopkins P. F., Quataert E., Murray N., 2011, MNRAS, 417, 950
- Hopkins et al. (2013) Hopkins P. F., Narayanan D., Murray N., 2013, MNRAS, 432, 2647
- Hopkins et al. (2014) Hopkins P. F., Kereš D., Oñorbe J., Faucher-Giguère C. A., Quataert E., Murray N., Bullock J. S., 2014, MNRAS, 445, 581
- Hopkins et al. (2018a) Hopkins P. F., et al., 2018a, MNRAS, 477, 1578
- Hopkins et al. (2018b) Hopkins P. F., et al., 2018b, MNRAS, 480, 800
- Hughes et al. (1998) Hughes D. H., et al., 1998, Nature, 394, 241
- James et al. (2002) James A., Dunne L., Eales S., Edmunds M. G., 2002, MNRAS, 335, 753
- Jonsson et al. (2010) Jonsson P., Groves B. A., Cox T. J., 2010, MNRAS, 403, 17
- Kereš et al. (2009) Kereš D., Katz N., Fardal M., Davé R., Weinberg D. H., 2009, MNRAS, 395, 160
- Kroupa (2002) Kroupa P., 2002, Science, 295, 82
- Krumholz & Gnedin (2011) Krumholz M. R., Gnedin N. Y., 2011, ApJ, 729, 36
- Lacey et al. (2016) Lacey C. G., et al., 2016, MNRAS, 462, 3854
- Leitherer et al. (1999) Leitherer C., et al., 1999, ApJS, 123, 3
- Liang et al. (2018) Liang L., Feldmann R., Faucher-Giguère C.-A., Kereš D., Hopkins P. F., Hayward C. C., Quataert E., Scoville N. Z., 2018, MNRAS, 88, 83
- Liang et al. (2019) Liang L., et al., 2019, MNRAS, 489, 1397
- Lovell et al. (2021) Lovell C. C., Geach J. E., Davé R., Narayanan D., Li Q., 2021, MNRAS, 502, 772
- Ma et al. (2016) Ma X., Hopkins P. F., Faucher-Giguère C. A., Zolman N., Muratov A. L., Kereš D., Quataert E., 2016, MNRAS, 456, 2140
- Ma et al. (2018) Ma X., et al., 2018, MNRAS, 478, 1694
- Magnelli et al. (2012) Magnelli B., et al., 2012, A&A, 539, A155
- Magnelli et al. (2020) Magnelli B., et al., 2020, ApJ, 892, 66
- Marrone et al. (2018) Marrone D. P., et al., 2018, Nature, 553, 51
- McAlpine et al. (2016) McAlpine S., et al., 2016, Astronomy and Computing, 15, 72
- McAlpine et al. (2019) McAlpine S., et al., 2019, MNRAS, 488, 2440
- McKinney et al. (2021) McKinney J., Hayward C. C., Rosenthal L. J., Martinez-Galarza J. R., Pope A., Sajina A., Smith H. A., 2021, ApJ, 921, 55
- McKinnon et al. (2017) McKinnon R., Torrey P., Vogelsberger M., Hayward C. C., Marinacci F., 2017, MNRAS, 468, 1505
- Miettinen et al. (2017) Miettinen O., et al., 2017, A&A, 606, 1
- Miller et al. (2018) Miller T. B., et al., 2018, Nature, 556, 469
- Muratov et al. (2015) Muratov A. L., Kereš D., Faucher-Giguère C. A., Hopkins P. F., Quataert E., Murray N., 2015, MNRAS, 454, 2691
- Narayanan et al. (2010) Narayanan D., et al., 2010, MNRAS, 407, 1701
- Narayanan et al. (2015) Narayanan D., et al., 2015, Nature, 525, 496
- Narayanan et al. (2021) Narayanan D., et al., 2021, ApJS, 252, 12
- Oesch et al. (2018) Oesch P. A., Bouwens R. J., Illingworth G. D., Labbé I., Stefanon M., 2018, ApJ, 855, 105
- Pandya et al. (2021) Pandya V., et al., 2021, MNRAS, 508, 2979
- Parsotan et al. (2021) Parsotan T., Cochrane R. K., Hayward C. C., Anglés-Alcázar D., Feldmann R., Faucher-Giguère C. A., Wellons S., Hopkins P. F., 2021, MNRAS, 501, 1591
- Pillepich et al. (2018) Pillepich A., et al., 2018, MNRAS, 475, 648
- Popping et al. (2022) Popping G., et al., 2022, MNRAS, 510, 3321
- Rowlands et al. (2014) Rowlands K., Gomez H. L., Dunne L., Aragón-Salamanca A., Dye S., Maddox S., da Cunha E., van der Werf P., 2014, MNRAS, 441, 1040
- Rupke (2018) Rupke D. S. N., 2018, Galaxies, 6, 138
- Rybak et al. (2015a) Rybak M., McKean J. P., Vegetti S., Andreani P., White S. D., 2015a, MNRAS, 451, L40
- Rybak et al. (2015b) Rybak M., Vegetti S., McKean J. P., Andreani P., White S. D., 2015b, MNRAS, 453, L26
- Rybak et al. (2020) Rybak M., Hodge J. A., Vegetti S., van der Werf P., Andreani P., Graziani L., McKean J. P., 2020, MNRAS, 494, 5542
- Safarzadeh et al. (2017) Safarzadeh M., Hayward C. C., Ferguson H. C., 2017, ApJ, 840, 15
- Schaller et al. (2015) Schaller M., et al., 2015, MNRAS, 451, 1247
- Schaye et al. (2015) Schaye J., et al., 2015, MNRAS, 446, 521
- Simpson et al. (2014) Simpson J. M., et al., 2014, ApJ, 788
- Smail et al. (1997) Smail I., Ivison R. J., Blain A. W., 1997, ApJ, 490, L5
- Smail et al. (2021) Smail I., et al., 2021, MNRAS, 502, 3426
- Somerville & Davé (2015) Somerville R. S., Davé R., 2015, ARA&A, 53, 51
- Somerville et al. (2012) Somerville R. S., Gilmore R. C., Primack J. R., Domínguez A., 2012, MNRAS, 423, 1992
- Sparre et al. (2017) Sparre M., Hayward C. C., Feldmann R., Faucher-Giguère C. A., Muratov A. L., Kereš D., Hopkins P. F., 2017, MNRAS, 466, 88
- Springel et al. (2005) Springel V., et al., 2005, Nature, 435, 629
- Stach et al. (2018) Stach S. M., et al., 2018, ApJ, 860, 161
- Stach et al. (2019) Stach S. M., et al., 2019, MNRAS, 487, 4648
- Stach et al. (2021) Stach S. M., et al., 2021, MNRAS, 504, 172
- Stefanon et al. (2021) Stefanon M., Bouwens R. J., Labbé I., Illingworth G. D., Gonzalez V., Oesch P. A., 2021, ApJ, 922, 29
- Steinacker et al. (2013) Steinacker J., Baes M., Gordon K., 2013, ARA&A, pp 63–105
- Swinbank et al. (2014) Swinbank A. M., et al., 2014, MNRAS, 438, 1267
- Tacchella et al. (2022) Tacchella S., et al., 2022, ApJ, 927, 170
- Tadaki et al. (2017) Tadaki K.-i., et al., 2017, ApJL, 841, L25
- Tielens et al. (1994) Tielens A. G. G. M., McKee C. F., Seab C. G., Hollenbach D. J., 1994, ApJ, 431, 321
- Trayford & Schaye (2019) Trayford J. W., Schaye J., 2019, MNRAS, 485, 5715
- Trayford et al. (2015) Trayford J. W., et al., 2015, MNRAS, 452, 2879
- Trayford et al. (2017) Trayford J. W., et al., 2017, MNRAS, 470, 771
- Van der Vlugt et al. (2021) Van der Vlugt D., et al., 2021, ApJ, 907, 5
- Villaescusa-Navarro et al. (2021) Villaescusa-Navarro F., et al., 2021, ApJ, 915, 71
- Villaescusa-Navarro et al. (2022) Villaescusa-Navarro F., et al., 2022, arXiv:2201.01300
- Vogelsberger et al. (2014) Vogelsberger M., et al., 2014, MNRAS, 444, 1518
- Wang et al. (2019) Wang L., Pearson W. J., Cowley W., Trayford J. W., Béthermin M., Gruppioni C., Hurley P., Michałowski M. J., 2019, A&A, 624, 1
- Weinberger et al. (2017) Weinberger R., et al., 2017, MNRAS, 465, 3291
- Weingartner & Draine (2001) Weingartner J. C., Draine B. T., 2001, ApJ, 548, 296
- Wellons et al. (2022) Wellons S., et al., 2022, eprint arXiv:2203.06201
- Wilkinson et al. (2017) Wilkinson A., et al., 2017, MNRAS, 464, 1380
- Zavala et al. (2021) Zavala J. A., et al., 2021, ApJ, 909, 165
- Zoldan et al. (2019) Zoldan A., De Lucia G., Xie L., Fontanot F., Hirschmann M., 2019, MNRAS, 487, 5649
- Zubko et al. (2004) Zubko V., Dwek E., Arendt R. G., 2004, ApJS, 152, 211
- van de Voort et al. (2015) van de Voort F., Quataert E., Hopkins P. F., Kereš D., Faucher-Giguére C. A., 2015, MNRAS, 447, 140
Appendix A Resolution tests
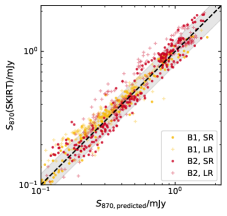
We perform convergence tests on the FIRE simulations using haloes B1 and B2. We re-run the zoom-in simulations at LR, to complement the SR simulations used in this work. We find excellent convergence of key properties, including stellar mass and star formation rate (see Figure 10). We also re-run the radiative transfer on the LR simulations and find no substantive differences in the relationships between sub-mm flux density and dust mass or SFR. In the right-hand panel of Figure 10, we plot skirt-predicted observed-frame flux densities for the SR and LR runs versus the values predicted from our fit to the standard resolution haloes, presented in Section 3.1. The consistency between skirt fluxes derived from the SR and LR runs indicates that the lowest resolution used in this paper (LR) is sufficient for our purposes.
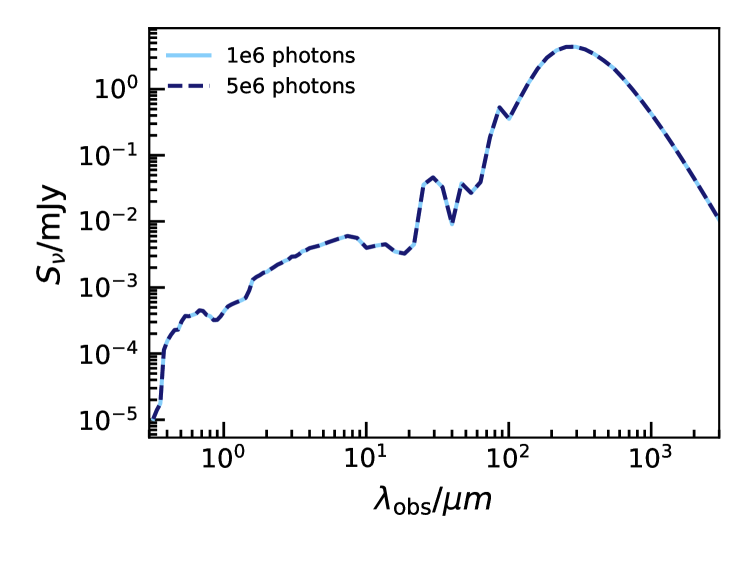
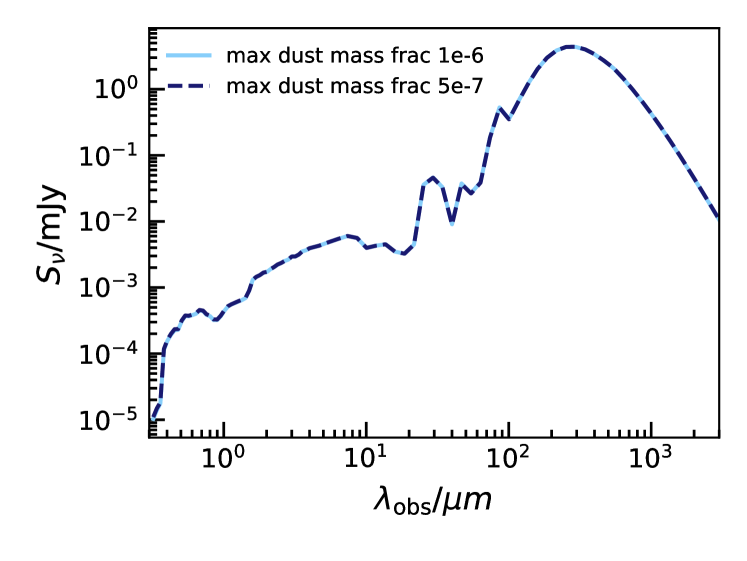
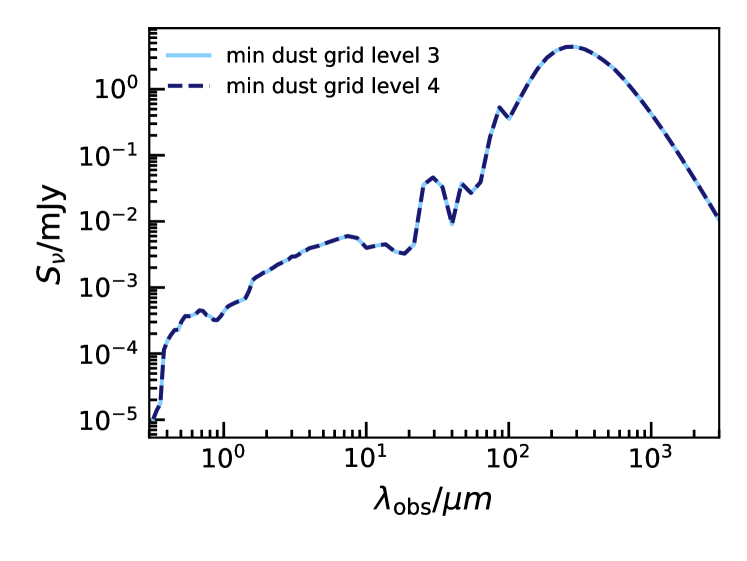
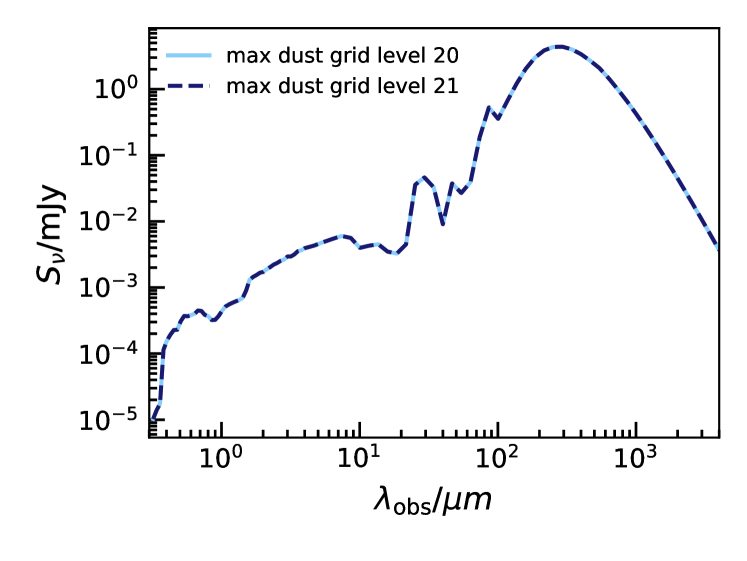
Appendix B Convergence tests with radiative transfer
We perform convergence tests on the parameters used in the radiative transfer. In Figure 11, we show the skirt-predicted SED for halo A1 at , for different skirt- parameter choices. We re-run the radiative transfer using photon packages (compared to the fiducial ), maximum fraction of the dust mass per cell (compared to the fiducial ), minimum dust grid level 4 (compared to the fiducial 3), and maximum dust grid level 21 (compared to the fiducial 20). The output SED is converged with respect to all these parameters, at all wavelengths.