subject
Article \SpecialTopicSpecial Topic: Peering into the Milky Way by FAST \Year2022 \MonthDecember \Vol65 \No12 \DOI10.1007/s11433-022-2031-7 \ArtNo129705 \ReceiveDateJuly 14, 2022 \AcceptDateNovember 9, 2022 \OnlineDateNovember 24, 2022
Peering into the Milky Way by FAST: IV. Identification of two new Galactic supernova remnants G203.1+6.6 and G206.7+5.9
xygao@nao.cas.cn xhsun@ynu.edu.cn hjl@nao.cas.cn
X. Y. Gao \AuthorCitationX. Y. Gao, W. Reich, X. H. Sun, H. Zhao, T. Hong, Z. S. Yuan, P. Reich, and J. L. Han
Peering into the Milky Way by FAST:
IV. Identification of two new Galactic supernova remnants G203.1+6.6 and G206.7+5.9
Abstract
A sky area containing two large radio structures of G203.1+6.6 and G206.7+5.9 with a size of about 25 and 35 respectively is scanned by using the L-band 19-beam receiver of the Five-hundred-meter Aperture Spherical radio Telescope (FAST). The FAST L-band receiver covers a frequency range of 1.0-1.5 GHz. Commissioning of the receiving system, including the measurements of the half-power beam width, gain, and main-beam efficiency is made by observing the calibrators. The multi-channel spectroscopy backend mounted to the receiver allows an in-band spectral-index determination. The brightness-temperature spectral indices of both objects are measured to be to . Polarized emission is detected from the archival Effelsberg 11 cm data for all the shell structures of G203.1+6.6 and G206.7+5.9. These results clearly indicate a non-thermal synchrotron emitting nature, confirming that G203.1+6.6 and G206.7+5.9 are large shell-type supernova remnants (SNRs). Based on morphological correlation between the radio continuum emission of G206.7+5.9 and the H i structures, the kinematic distance to this new SNR is estimated to be about 440 pc, placing it in the Local Arm.
keywords:
KeyWords: supernova remnants, interstellar medium, magnetic fields, polarization98.38.Mz, 98.38.-j, 98.38.Am, 95.30.Gv
1 Introduction
The Five-hundred-meter Aperture Spherical radio Telescope (FAST, Nan, 2008; Nan et al., 2011), mounted with the L-band 19-beam receiver, is an extremely sensitive radio telescope to observe pulsars (Han et al., 2021), the spectral line of atomic hydrogen (Hong et al., 2022), and the radio recombination lines of ionized gas (Hou et al., 2022). We work on a series of papers which are dedicated to investigations of the Galactic interstellar medium (ISM) by FAST. The first two papers (Hong et al., 2022; Hou et al., 2022) are based on the spectral-line data simultaneously recorded by the Galactic Plane Pulsar Snapshot (GPPS) survey (Han et al., 2021) of the FAST accessible sky with . Hong et al. (2022, Paper I) focused on the H i structures from the high-resolution and high-sensitivity piggyback H i-line observations of the FAST GPPS survey, while Hou et al. (2022, Paper II) studied the radio recombination lines of ionized gas. In the third paper, Xu et al. (2022) revealed the interstellar magnetic fields by measuring the Faraday effect of a large number of weak pulsars. The work presented here is the fourth in the series. We scan a sky area to get the radio continuum image by using the L-band 19-beam receiver of FAST, and identify two new large supernova remnants (SNRs) G203.1+6.6 and G206.7+5.9.
SNRs are prominent radio sources that play an important role in the Galactic ecological system by processing the interstellar medium. Up to now, about 300 SNRs have been discovered in the Galaxy (Green, 2019), most of which are identified based on radio observations (e.g. Dubner & Giacani, 2015). Despite occasional reports on some individual or a small group of new SNRs (e.g Gao et al., 2011; Foster et al., 2013; Sabin et al., 2013; Gao & Han, 2014; Kothes et al., 2014; Gerbrandt et al., 2014), numerous Galactic SNRs are still waiting to be discovered.
In the last few years, sensitive and high angular resolution radio observations utilizing synthesis arrays bring a boost. With an angular resolution down to 20′′, The HI /OH/Recombination line survey of the inner Milky Way (THOR) project (Anderson et al., 2017) surveyed a narrow section of the inner Galactic plane of , and by using the Very Large Array (VLA), and identified 76 new SNR candidates. Another project conducted with the VLA but working at the C-band (4-8 GHz, GLOSTAR project, Dokara et al., 2021) discovered another 80 new SNR candidates within the Galactic plane area of and . With the Murchison Widefield Array operating in the frequency range of 72-231 MHz, several tens of new SNRs have been identified in the Galactic plane area of , and (Hurley-Walker et al., 2019b, a). Recently, Heywood et al. (2022) surveyed a 6.5- sky area at the Galactic center by using MeerKAT with an extremely high angular resolution of 4′′, a few new SNR candidates and many radio arcs have been revealed.
Besides these SNRs/SNR candidates discovered in the narrow stripes of the Galactic plane, some SNRs have been uncovered at higher Galactic latitude, e.g. G159.6+7.3 (Fesen & Milisavljevic, 2010), G70.021.5 (Fesen et al., 2015), G181.1+9.5 (Kothes et al., 2017), G107.0+9.0 (Fesen et al., 2020), and G17.8+16.7 (Araya et al., 2022). They are out of the sky coverage of major Galactic plane surveys, which are often limited up to , e.g. the Effelsberg 11 cm survey (Fürst et al., 1990; Reich et al., 1990), the Sino-German 6 cm survey (Sun et al., 2007; Gao et al., 2010; Sun et al., 2011; Xiao et al., 2011), and the 1.4-GHz southern Galactic plane survey (Haverkorn et al., 2006). Some Galactic plane surveys have extended to high latitudes in selected areas. For example, the Canadian Galactic Plane Survey (Taylor et al., 2003; Landecker et al., 2010) extended to in the Galactic longitude range of -. The 2.4-GHz southern Galactic plane survey extended in some of its coverage to and (Duncan et al., 1997). The Effelsberg Medium Latitude Survey (EMLS, Uyanıker et al., 1998; Reich et al., 2004) conducted with the Effelsberg 100-m radio telescope aims to cover a Galactic latitude range of in its accessible sky. The first published section released the data in four fields, covering 1 100 in total (Uyanıker et al., 1999). From the unpublished data of EMLS in the Galactic anti-center area, Reich (2002) presented two SNR candidates, G203.1+6.6 and G206.7+5.9, both of which show limb-brightened shell structures. However, the narrow-band total-intensity observations without polarization measurements did not allow to identify the nature of these two objects.
FAST is the largest single-dish telescope in the world. Inspired in utilizing FAST for radio-continuum study, we develop the FAST calibration and data-processing procedures, and scan a sky area which contains G203.1+6.6 and G206.7+5.9 with the FAST L-band 19-beam receiver. The paper is organized as follows. In Sect. 2, we introduce the FAST observations and data reduction. We present the observational results and distance estimate in Sect. 3. The conclusions are given in Sect. 4.
2 Observations and data reduction
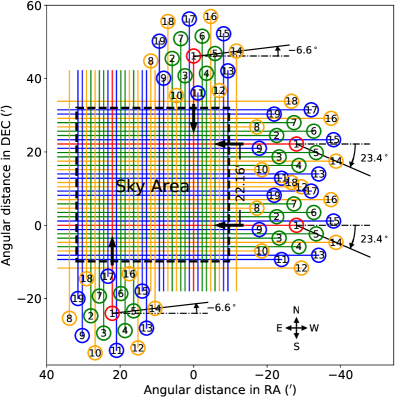
The FAST observations of G203.1+6.6 and G206.7+5.9 were conducted with the L-band 19-beam receiver under two observation modes. The drift-scan mode with the 19-beam receivers rotated by 234 was used for scans along the RA direction during the FAST commissioning phase in late 2019 and 2020 (FAST PID: 0355), while the multi-beam “On-The-Fly” (MultiBeam OTF) mode with a rotation angle of 66 was adopted in 2021 for scans along the DEC direction during the FAST shared-risk phase (FAST PID: PT2020-0118). Considering the FAST L-band half-power beam-width (HPBW) of about 3′ at the higher frequency end of the band (Jiang et al., 2020), both modes provide a full Nyquist sampling with a scan separation of about 117. A sketch map of the two observation modes is shown in Fig. 1.
To establish the scale between the antenna temperature and source flux-density, 3C 138 as the main calibration source
was observed regularly using the FAST “Multi-beam Calibration” mode, in which each of the 19 beams tracked the calibrator in turn for one minute. To monitor and correct for the system-temperature drift, all observations utilized a noise tube with a periodically-injected reference signal of about 1.1 K for the target source and about 12.5 K for the calibrator. The scans of the targeted area and the observations toward the calibrators took about 20 hours in total.
2.1 System characteristics of FAST observations
The system performance must be verified before observations. The half-power beam width characterizes the main beam of the telescope through which majority of the radio emission power is received. The gain represents the conversion factor from the flux-density scale in Jy into antenna-temperature scale in K . Both HPBW and gain are then used to derive the main-beam efficiency, which further helps convert the map unit from antenna temperature into brightness temperature . We discuss these basic system performance parameters in the following.
2.1.1 Half-power beam width
The 19 FAST feeds are hexagonally mounted (see Fig. 1 for reference). Rotating the hexagon to a certain position angle will align some feeds along the RA direction at the same DEC. Then a drift scan toward a calibration source can be made to assess the HPBW from Gaussian fitting, e.g. 0∘ rotation allows the beams No. 8, 2, 1, 5, and 14 to drift across a calibration source, while a +30∘ rotation will align the beams No. 9, 1, and 15. Such measurements were applied toward several calibrators, i.e. 3C 48, 3C 84, 3C 286, and 3C 380. The HPBW values obtained for the same feed were then averaged. We finally averaged the HPBWs of all the 19 beams according to the observing frequencies and show the result in Fig. 2. At the same observing frequency, the standard deviation of the HPBW between different beams is less than 2.5%. Within the usable band, the FAST HPBW was found to be at the lower-frequency end at 1.039 GHz and about
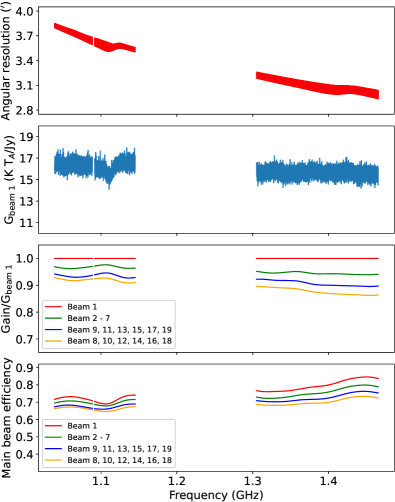
at the higher-frequency end at 1.465 GHz. These results are compatible with the values found by Sun et al. (2021), but slightly higher than the values of Jiang et al. (2020). Another feature of the FAST HPBW is the inversion seen at about 1.11 GHz and 1.41 GHz. This was also noticed by Sun et al. (2021) when estimating FAST HPBW through 2-D Gaussian fits to the calibrator in their work.
By measuring the time delay of the fitted Gaussian peaks, we can estimate the angular separation between the FAST adjacent beams. An average spacing is 587, which can be used to determine the coordinates of the FAST offset beams (Beam No.2 to No.19).
2.1.2 Gain
The gain of FAST, defined as , is essential for the antenna temperature-flux density conversion (unit: K /Jy). It is also of great importance to adjust the different gain levels of different beams. We estimated of FAST based on the flux density of 3C 138 given in Perley & Butler (2017), in which of 3C 138 can be obtained from , where is in GHz, and is in Jy. For simplicity in display, we divided the hexagon-configured 19 FAST beams into four groups: the central beam No.1 and three outer rings according to their angular distance to Beam 1, i.e. the first ring: Beam Nos. 2-7 with a distance of 587, the second ring: Beam Nos. 9, 11, 13, 15, 17, and 19, and the outer-most ring: Beam Nos. 8, 10, 12, 14, 16, and 18, with an angular distance of 1017 and 1174, respectively (see Fig. 1). The gains of different beams in the same ring were found nearly identical, with a standard deviation () of about 2%. We averaged the gains of beams in the same group and normalized them with respect to that of the central beam. The result is shown in the middle panels of Fig. 2. It is evident that the gain decreases with increasing distance to the center. On average, the gains in the first, second, and the outer-most rings are about 97%, 94%, and 92% of that of the central beam at the lower-frequency band, and 95%, 91%, and 88% at the higher-frequency band. For each single beam, the gain decreases with the observing frequency.
| Source | 4C 11.24 | 4C 10.21 | ICRF J065917.9+081330 | 4C 08.24 | 4C 08.23 | 4C 06.27 |
|---|---|---|---|---|---|---|
| RANVSS (h:m:s) | 06:56:41.84 | 06:55:48.36 | 06:59:17.97 | 06:58:46.96 | 06:56:01.03 | 06:55:59.37 |
| RAFAST (h:m:s) | 06:56:42.50 | 06:55:49.37 | 06:59:18.47 | 06:58:46.86 | 06:56:01.86 | 06:56:00.24 |
| DECNVSS (∘:′:′′) | 11:55:18.1 | 10:42:58.8 | 08:13:31.8 | 08:20:20.9 | 08:34:07.1 | 06:39:00.8 |
| DECFAST (∘:′:′′) | 11:55:13.4 | 10:42:53.2 | 08:13:32.6 | 08:20:28.9 | 08:34:13.9 | 06:39:18.8 |
| Offset (′′) | 10.8 | 15.9 | 7.5 | 8.1 | 14.1 | 22.2 |
| (mJy) | 37475 | 910180 | 908180 | 37475 | 679140 | 45591 |
| (mJy) | 36419 | 87745 | 77539 | 38120 | 68335 | 41421 |
| 1.030.05 | 0.780.05 | 0.030.04 | 1.020.06 | 0.940.04 | 0.730.04 | |
| 1.130.19 | 0.970.19 | 0.160.19 | 1.160.19 | 1.170.19 | 0.980.19 |
2.1.3 Brightness temperature
Instead of the instrumental dependent antenna temperature , the main-beam brightness temperature is used when analyzing astronomical objects. The relation between and can be written as , where and denote the main-beam and beam solid angle, respectively. can be estimated via 1.13 for a Gaussian beam, where is the HPBW in radian. can be calculated as , where represents the observing wavelength in centimeter, k is the Boltzmann constant 1.38 , and is the reciprocal of the gain in Jy/K TA. By combining the above expressions, the relation between and at a given observing wavelength can be simplified as:
| (1) |
where the units of the gain , the HPBW and the observing wavelength are used in the units of , arcmin, and centimeter, respectively. The ratio of is also known as the main-beam efficiency. As for the FAST gain, we present the FAST main-beam efficiency also in four groups (see the bottom panel of Fig. 2). It shows that the FAST L-band main-beam efficiency ranges from 0.65 to 0.85. The value increases with the observing frequencies in general. This is unusual but not unique. The same trend is seen in the 1.28-1.75 GHz survey conducted by the 25.6-m telescope of the Dominion Radio Astrophysical Observatory (Wolleben et al., 2021). These factors, which consider the HPBW and gain of different beams at different observing frequencies, are used to convert the FAST image data into units.
2.2 Data processing of FAST observations
The FAST L-band receiver covers a frequency range of 1.0 GHz to 1.5 GHz, and the band is split into 65 536 channels in the digital backend. The first and the last 35 MHz of the entire bandwidth were not used because of the low system gain. The central continuous 1.145-1.305 GHz band was heavily contaminated by radio frequency interference (RFI) during the observations and the data in this frequency range were discarded. The Galactic H i emission, centered at 1420.41 MHz covering about 70 channels (0.5 MHz) and a narrow band centered at 1.09 GHz (3 MHz wide) affected by the civil aviation were both masked. To eliminate the remaining accidental RFI, two methods were tried. The asymmetrically re-weighted penalized least squares smoothing (ArPLS, Baek et al., 2015) has been demonstrated to be very effective in flagging RFI (Zeng et al., 2021). The second is simply the iteration of clipping signals above the r.m.s level of the band value in the frequency domain. The ArPLS method results in a relatively high percentage of RFI elimination, however, consumes much more computing time. Therefore the second method was adopted in this work, which achieved good results with much less computing time. After RFI mitigation, about a half of the total 500 MHz bandwidth was left. For the in-band spectral-index determination, we split the available bandwidth into five sub-bands. They are centered at 1.065 GHz, 1.118 GHz, 1.334 GHz, 1.391 GHz, and 1.443 GHz with a bandwidth of approximately 50 MHz each. For such a small frequency span, the data within each sub-band were combined neglecting the small difference in angular resolution.
Sun et al. (2021) made the FAST radio continuum polarization calibration based on the polarization characteristics of the injected reference signal. The differential gain between the Stokes and , and the differential phase between the Stokes and were corrected. The method was demonstrated to work well with the FAST radio continuum data. The same scheme is applied in this work. The detailed procedure can be referred to Sun et al. (2021) and will not be repeated here.
2.3 Verification of FAST data processing
Recently, two bright SNRs G74.08.5 (Cygnus Loop, Sun et al., 2021, 2022) and G166.0+4.3 (VRO 42.05.01, Xiao et al., 2022) were studied based on the FAST L-band radio continuum observations. The data-processing pipelines were separately developed. The Cygnus Loop and VRO 42.05.01 are both well-known SNRs, whose flux density and spectrum can be readily compared with the previously published values. However, the two objects G203.1+6.6 and G206.7+5.9 presented in this paper are investigated for the first time. Therefore, the data-processing procedure and the correctness of the derived in-band spectral index should be verified prior to the study. Strong point-like sources from the NVSS (Condon et al., 1998) were taken for this purpose. The image containing G203.1+6.6 and G206.7+5.9 was retrieved from the NVSS database111https://www.cv.nrao.edu/nvss/ and compared with the FAST image. The sources detected by FAST and cannot be further resolved into multiple components by NVSS were required. Finally, six strong sources, 4C 11.24 and 4C 10.21 within the field of G203.1+6.6, and ICRF J065917.9+081330, 4C 08.24, 4C 08.23, and 4C 06.27 within G206.7+5.9 were chosen. The positional accuracy of FAST was verified by the comparison between the coordinates obtained from the 2D Gaussian fits to these selected sources in the FAST image and those extracted from the NVSS source catalog. The differences are 7.5′′ to 22.2′′ (see Table. 1), which is acceptable for the FAST HPBW of 3′. The NVSS 1.4-GHz (mean of 1364.9 MHz & 1435.1 MHz) flux densities of the sources are listed against the average values measured by FAST at 1.391 GHz and 1.443 GHz, which shows good consistency between the two sets of data. The FAST in-band spectral indices were derived from the flux densities determined at the five sub-bands. The uncertainty of the total flux density is about 5%, which consists of the instability of the injected reference signals, the effect from the pointing accuracy (Jiang et al., 2020), the uncertainties of the main-beam efficiency, and the Gaussian fits. For comparison, we fit the flux-density data extracted from the third version of SPECFIND (Stein et al., 2021). The two sets of spectral indices are listed in the last two rows of Table 1. The spectral indices based on the SPECFIND data are derived over a much wider frequency range, while the largest frequency span of FAST is only 380 MHz. The FAST in-band spectra are slightly steeper, but still agree with the SPECFIND results within uncertainties. We noticed that a better consistency between the two sets of results is achieved when the data in SPECFIND below 100 MHz or 200 MHz are omitted, especially for the sources 4C 11.24, 4C 10.21, and 4C 08.23. This may result from the absorption that flattens the spectra at the low-frequency end.
Based on the results shown above, the FAST data processing procedures are well proved and can be used for further radio continuum study.


2.4 Effelsberg 11 cm observations
We complemented the FAST L-band observations with the archival 11 cm observations by the Effelsberg 100-m telescope in 2006. Foster et al. (2013) presented SNR observations conducted at the same period and gave a detailed description of the Effelsberg 11 cm receiver, the backend, and also the observing method and reduction procedures. We therefore give a brief summary of the key parameters. The central observing frequency was 2639 MHz and the bandwidth was 80 MHz. The HPBW of the 100-m telescope at this frequency band is about 44, similar to that of FAST at L-band. The IF-polarimeter has eight channels with 10-MHz bandwidth each and a broadband 80-MHz channel. All channels have their Stokes , , and . The calibration was based on 3C 286 assuming a flux density of 10.4 Jy, with 9.9% of linear polarization and a polarization position angle of 33∘. G203.1+6.6 and G206.7+5.9 were observed separately and ten maps were obtained for each. The data of the 80-MHz channel were used when RFI was low, otherwise the average data from the seven narrow-band channels were used after the lowest frequency channel (2599 MHz to 2609 MHz) was omitted because of strong RFI.
3 Results
We identify G203.1+6.6 and G206.7+5.9 as SNRs according to their non-thermal nature by showing steep radio continuum spectra and polarized emission. We also try to estimate the distances of these two objects based on the morphological correlation between radio continuum and H i emission.
3.1 Total-intensity map and spectrum determination
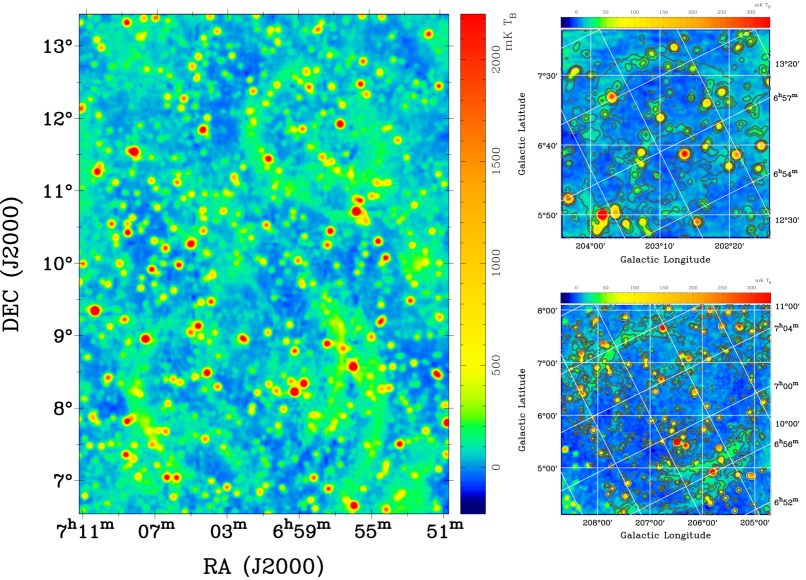
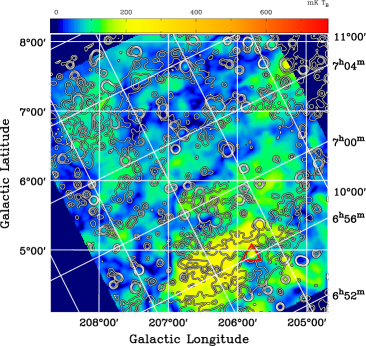
We present the total-intensity map of G203.1+6.6 and G206.7+5.9 observed by FAST at L band in Fig. 3. The image is a combination of the five sub-band maps after they were convolved to a common angular resolution of 4′. The RA and Dec directional scans were weaved together by using the “basket-weaving” technique (Emerson & Gräve, 1988). The rms noise of the image is about 14 mK . G203.1+6.6 shows a large arc which spans about 25 and opens to the west. At the center, a smaller and dim ring-like structure of about 1∘ can also be identified. However, the weak and fuzzy emission from some parts of the ring is difficult to discriminate because of the presence of numerous unresolved extra-galactic sources. G206.7+5.9 is a large object of about 35 in diameter with a classical bilateral structure. It has one shell in the east and two shells in the west (in the Equatorial coordinates). Such an appearance could be a result of SNR shock front expanding perpendicular to a well-ordered large-scale magnetic field (e.g. van der Laan, 1962; Gaensler, 1998). Therefore the shells may indicate the orientations of the local magnetic field.
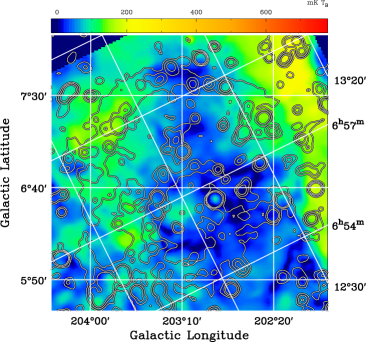
The Effelsberg 11 cm total-intensity images of G203.1+6.6 and G206.7+5.9 are shown in the right panels of Fig. 3. The angular resolution is 44. Unlike the FAST observations made in the Equatorial coordinates, Effelsberg observations were conducted in the Galactic frame. We therefore overlaid the RA-DEC coordinates and FAST total-intensity contours onto the Effelsberg images for reference. As expected, the total-intensity emission structures revealed by FAST and Effelsberg resemble each other under similar angular resolution.
Spectral index is a key parameter to distinguish between optically-thin H ii regions (, ) and non-thermal synchrotron emitting shell-type SNRs, most of which have a spectral index around (e.g Dubner & Giacani, 2015) in their adiabatic evolution phase. The Temperature-Temperature plots, namely TT-plots (Turtle et al., 1962), provide a reliable tool to assess the spectral index. They are less affected by base-level differences between the maps and therefore have often been used when analyzing radio continuum maps. The brightness temperatures of corresponding pixels observed at two different frequencies are compared. A good linear relation implies the existence of a power-law spectrum of the extended emission, while the slope provides the brightness-temperature spectral index , which relates to the flux-density spectral index as . We performed the TT-plot analysis to the arc of G203.1+6.6 and the three shells of G206.7+5.9. The FAST radio maps at five sub-bands were analyzed. First, we masked the un-related point-like sources overlapping the shell structures based on the NVSS source catalog (Condon et al., 1998). To alleviate the uncertainties introduced by using a narrow frequency separation, the data in the first sub-band (1065 MHz) are plotted against those of the 4th (1391 MHz) and 5th (1443 MHz) sub-band. The results are shown in Fig. 4. For G203.1+6.6, the spectral index is found to be between 1065 and 1391 MHz, and between 1065 and 1443 MHz. Both values agree with each other within errors. Analyzing in the same way, we found a spectral index of for the eastern shell of G206.7+5.9, while the spectral indices of the inner and outer shells in the west are and , respectively. These results provide strong evidence that G203.1+6.6 and G206.7+5.9 are extended, shell-type, synchrotron-emitting SNRs. We also tried to estimate the brightness-temperature spectral index between the FAST L-band and the Effelsberg 11 cm data. We got for the arc of G203.1+6.6, and for all the three shells of G206.7+5.9 with a large uncertainty. No reliable TT-plot results were obtained for the central ring structure inside G203.1+6.6.
3.2 Polarization
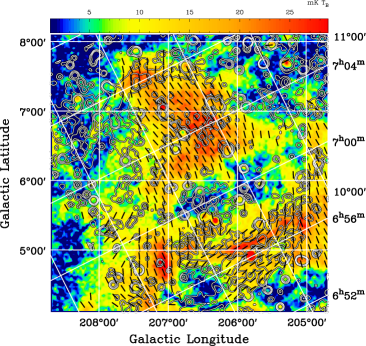
Synchrotron radiation is intrinsically polarized. The absence of polarization detection is often caused by depolarization, e.g. beam depolarization and/or depth depolarization (Burn, 1966; Sokoloff et al., 1998). Beam depolarization occurs when varying polarized emission regions smaller than the beam size are averaged within the beam, while depth depolarization is caused by the mixture of synchrotron emitting medium and Faraday rotating medium. The polarized emission originated in different depths along the same line of sight undergoes different Faraday rotations. The polarized emission cancels each others when added together. Because Faraday rotation is larger at lower observing frequencies, such as in L band, the FAST Stokes and data of each sub-band cannot be simply combined as we did for the total intensity. The sub-band data at the highest observing frequency of 1.443 GHz were selected and the images were convolved to an angular resolution of 5′ to increase the signal to noise ratio. The polarization intensity is calculated as (Wardle & Kronberg, 1974), where is the rms noise of about 8 mK measured in the and maps. We show the FAST 1.443-GHz polarization-intensity () images of G203.1+6.6 and G206.7+5.9 in Fig. 5. Some weak polarized emission is seen within the arc of G203.1+6.6 and in the shell regions of G206.7+5.9. However, it is difficult to verify the true association. In case of beam depolarization which is additionally introduced as we smoothed the polarization data, the , , and the resulting images were examined at their original resolution. The above result remains that no un-ambiguous polarized emission that is associated to the SNRs can be confirmed. The most pronounced feature shown in the FAST 1.4-GHz polarization image is an extended polarized “blob” centered at () (2064, 46) in G206.7+5.9. It can be identified in all of the five sub-bands. The “blob” overlaps both of the double shells in the southwest of G206.7+5.9 and the gap in between (Galactic coordinates, see in Fig. 5).
Rotation measure () is the integral of magnetic field along the line of sight, weighted by electron density. By fitting the polarization angles of the entire “blob” against the wavelength square in the five sub-bands, a good linear relation was obtained and the can be estimated () to be 294 rad m-2. We estimated the values of the shell region and the gap region separately. No significant difference was found, suggesting that the “blob” itself is likely a discrete structure unrelated to G206.7+5.9.
To search for the imprints of magnetic fields of G203.1+6.6 and G206.7+5.9, we compared the values of the sources whose line of sight pass and do not pass the two large structures. We retrieved values of extra-galactic sources from the catalog of Xu & Han (2014) within a radius of 3∘ to the center of G203.1+6.6 and 4∘ for G206.7+5.9, which are large enough to cover the two objects with a radius of about 75′ and 105′, respectively. Seventeen sources with measured values were found outside G203.1+6.6. The average weighted by 1/ was found to be 3925 rad m-2. In the same way, a similar value of 4021 rad m-2 was found for G206.7+5.9 by averaging 27 sources in its vicinity. A possible double source which has two components located at () = () and () = (20374, 723) coincides in the arc region of G203.1+6.6. The measured values for the double source are 57.812.7 rad m-2 and 67.514.2 rad m-2, respectively. However, with large uncertainties of the values both inside and outside the arc of G203.1+6.6, it is difficult to claim a clear excess caused by the SNR. The case is the same for G206.7+5.9. The values overlapping the north-eastern shell and in the central region of G206.7+5.9 were found to be 5110 rad m-2 and 6629 rad m-2. They seem to be larger but are still consistent with the reference value of 4021 rad m-2 within the errors. changes introduced by the SNRs depend on the view angles with respect to the magnetic fields. The change could be significant through a compression to the magnetic fields running parallel to the line of sight, because the front and the rear parts of the SNR contribute the with the same sign. The change, however, may be insignificant when the line of sight is perpendicular to the magnetic fields, since the signs of the s become reverse in this case. Therefore, the comparison shown above implies that the magnetic field compressed by G203.1+6.6 and G206.7+5.9 might predominantly run perpendicular to the line of sight and contributes no significant . The source 4C 08.23 (indicated by the red triangle in Fig. 5) is close to the “blob” and has a value of 268 rad m-2 (Van Eck et al., 2011). It is the only source found in the southwest of G206.7+5.9. The value of 4C 08.23 is smaller than those for the other sources (55 rad m-2) seen through G206.7+5.9, but agrees well with = 29 rad m-2 derived for the “blob”. Another source located at () = (20539, 418) outside the south-western double shell of G206.7+5.9 has a measured of 17.910.6 rad m-2. These three similar and smaller values of the blob and through the Galaxy indicate that the contribution from the background may be very small in this area.
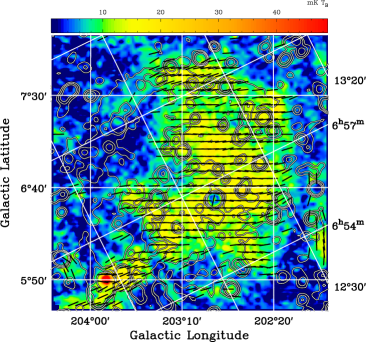
For comparison, we show the 44-resolution Effelsberg 11 cm polarization images of G203.1+6.6 and G206.7+5.9 in the lower panel of Fig. 5, at which frequency less depolarization is expected. B-vectors as the observed magnetic-field orientation are overlaid. Polarized emission from both G203.1+6.6 and G206.7+5.9, although mixed with some un-related overlapping polarized emission, can still be identified. For G203.1+6.6, two structures with pronounced polarized emission are seen, i.e. in the center of the image and along the arc of G203.1+6.6. A depression at about roughly separates these two structures. It is clear that the visible in the center of the image is un-related to G203.1+6.6, where no total-intensity emission was detected. For the polarized emission in the arc region, it seems that the weak seen in the part of may come from the arc, while for the area of , at least part of is not related. Because the observed polarization intensity here exceeds the total-intensity signal, violating the maximum percentage polarization of 75% for synchrotron emission. This is caused by the settings of the relative zero-levels of the maps for , and , or , assuming zero intensities at the field edges. If the ratio is apparently above 1, the polarized emission arises at least partly somewhere in the ISM, and is not related to the total-intensity structure. For G206.7+5.9, intense polarized emission is perfectly traced for the inner shell in the southwest (Galactic coordinates). The emission is about 13 mK at 11 cm for the “blob”-overlapped shell region. It therefore can be extrapolated to be about 66 mK at 1.4 GHz, by using the spectral index found in Fig. 4. This is far less than 180 mK detected by FAST in the same area, indicating that at least majority of the polarized emission seen for the “blob” at L-band is not related to G206.7+5.9. The rotation measure of = 294 rad m-2 can cause a polarization-angle rotation of 75∘ at L-band and heavily depolarize the polarized emission coming from behind. If the “blob” is in the foreground of G206.7+5.9, the polarized emission originated from the SNR is therefore not likely to be seen at the L band and a clockwise rotation of 20∘ needs to be applied to the B-vectors in the 11 cm image. This will better align the magnetic fields along the inner shell of G206.7+5.9. Such parallel configuration suggests that G206.7+5.9 is likely an evolved SNR in the adiabatic phase (Reich, 2002). The 11 cm polarized emission of the other two shells of G206.7+5.9 is weaker, but still corresponds well to the total-intensity emission.
In brief, the associated polarized emission traced in the shell region of G203.1+6.6 and G206.7+5.9 at 11 cm adds solid proof on the non-thermal nature of G203.1+6.6 and G206.7+5.9. A reliable percentage polarization is not easy to obtain due to the confusion with un-related extended Galactic polarized emission.
3.3 Distance estimates
Distance is a basic parameter for astronomical objects. The distance to SNRs can be inferred through the association with objects that have known distances (e.g. stars; Humphreys, 1978; Fesen et al., 2021) or the kinematic method for related structures e.g. of H i emission or absorption clouds or CO emission (e.g. Kothes et al., 2003; Tian et al., 2007). Kassim et al. (1994) pointed out that X-ray emission can also help to determine the distance to shell-type SNRs. In addition, dust reddening of stars (e.g. Chen et al., 2017; Yu et al., 2019; Zhao et al., 2020) and red clump stars (Shan et al., 2018) have been used for the distance estimates for SNRs. We checked the ROSAT hard- (0.5-2.0 keV) and soft-band (0.1-0.4 keV) data (Voges et al., 1999) toward G203.1+6.6 and G206.7+5.9. Only a few clumps in the hard-band (0.5-2.0 keV) are visible in the area of G206.7+5.9, but with a low signal-to-noise ratio. We also failed to find adequate CO data currently available in this sky area.
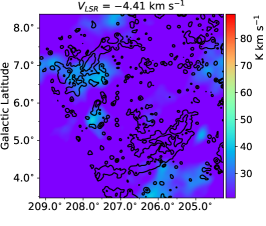
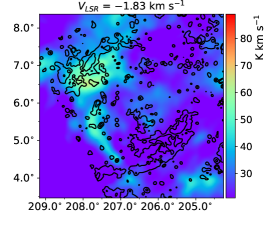
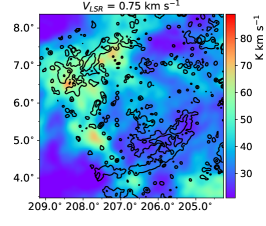
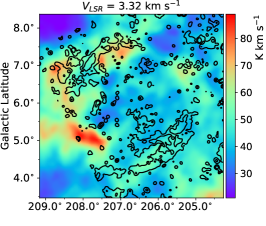
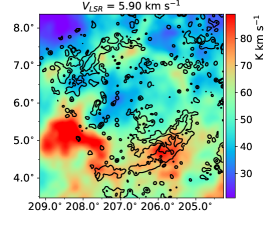
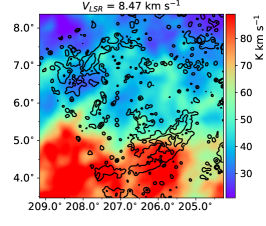
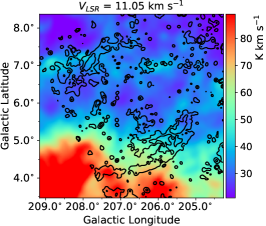
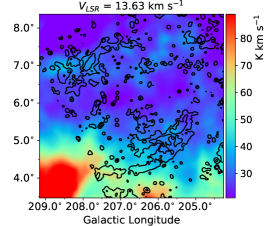
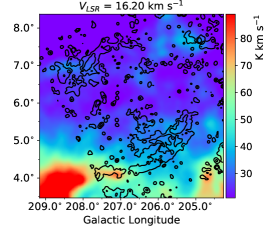
Morphological correlation between the radio continuum map of an SNR and H i emission structure provides another possibility in estimating the kinematic distance of SNRs (e.g. Foster et al., 2013; Kothes et al., 2001). The Effelsberg H i survey (hereafter EBHIS; Winkel et al., 2016) observed the sky north of with an angular resolution of 108. The spectral resolution is about 1.29 km s-1 and the brightness temperature noise level is about 90 mK TB. We searched for the SNR-related structures in the EBHIS channel maps after integrating the velocity step to 2.6 km s-1 among the entire velocity range of 600 to 600 km s-1, especially in the range of 10 km s-1 to +50 km s-1. For SNR G206.7+5.9, the morphological resemblance is found between the radio continuum map and integrated H i map in the velocity range of 0-8 km s-1, with the best correlation seen in 3.3-5.9 km s-1. An H i cavity is noticed, which is probably created by the progenitor star or the SN event (see in Fig. 6). By using the kinematic distance calculation tool of Wenger et al. (2018) based on the rotation curve and updated solar motion parameters of Reid et al. (2014), we obtain the average value of which corresponds to a kinematic distance of about 0.44 kpc. This places the SNR G206.7+5.9 in the Local Arm (Reid et al., 2019; Hou, 2021) and results in a physical size of 27 pc. No H i structure is found to be clearly associated with G203.1+6.6.
In addition, three known pulsars in the ATNF pulsar catalog222http://www.atnf.csiro.au/research/pulsar/psrcat/ (Manchester et al., 2005) are found in the field close to G203.1+6.6 and G206.7+5.9. The pulsars J0659+1414 and J0709+0458 which are out of the boundary of Fig. 3 have a distance estimate of 0.29 kpc and 1.20 kpc, respectively. But if such a scenario holds that pulsars run away from the center of the SNe, neither of the two pulsars are related to G203.1+6.6 or G206.7+5.9, because they cannot even be traced back to the central area of the two SNRs based on their proper motion measurements (Brisken et al., 2003; Martinez et al., 2019). The pulsar J0711+0931 is near the eastern shell of G206.7+5.9 and has an estimated distance of about 1.17 kpc. No proper motion information is available yet for such discussion.
4 Conclusions
We conducted new scanning observations with the L-band 19-beam
receiver of FAST. Through the observations toward calibration sources,
we commissioned the FAST L-band receiving system and set up a
data-reduction pipeline which can be successfully applied to the FAST
radio-continuum observations. Two new supernova remnants G203.1+6.6
with a size of 5 and G206.7+5.9 with a size of about
35 were confirmed with the FAST L-band observations together
with the Effelsberg 11 cm polarization
measurements. G203.1+6.6 appears to be a single arc structure, while
G206.7+5.9 shows bilateral shells, with a double shell on one
side. The multi-channel backend of FAST enabled an in-band spectral
determination. The spectral indices of G203.1+6.6 and G206.7+5.9 were
both found to be to . Significant polarized
emission was not detected toward the two SNRs at L band, but seen for
all the shell structures of G203.1+6.6 and G206.7+5.9 at
11 cm. The morphology, spectral and polarization data prove
that both objects are SNRs emitting synchrotron radiation. Through
identifying morphological correlation between radio continuum and
H i, we were able to make distance estimate toward G206.7+5.9.
A kinematic distance of 440 pc is determined, indicating a
physical size of about 27 pc. This distance makes G206.7+5.9 a Local
Arm object.
Acknowledgements. The work was supported by the National Key R&D Program of China (No. 2021YFA1600401 and 2021YFA1600400), the National Natural Science Foundation of China (No. 11988101), and the National SKA Program of China (Grant No. 2022SKA0120103). Xuyang Gao acknowledges the CAS-NWO Cooperation Program (Grant No. GJHZ1865), and the Open Project Program of the Key Laboratory of FAST, NAOC, Chinese Academy of Sciences. Xiaohui Sun is supported by the Cultivation Project for FAST Scientific Payoff and Research Achievement of CAMS-CAS, and the Science & Technology. Tao Hong is supported by the National Natural Science Foundation of China (Grant No. 12003044). We would like to thank Prof. Biwei Jiang for helpful discussion on the distance of the SNRs. This work made use of the data from FAST (Five-hundred-meter Aperture Spherical radio Telescope). FAST is a Chinese national mega-science facility, operated by National Astronomical Observatories, Chinese Academy of Sciences. This research is based in part on observations with the 100-m telescope of the Max-Planck-Institut für Radioastronomie at Effelsberg.
The work was supported by the National Key R&D Program of China (No. 2021YFA1600401 and 2021YFA1600400), the National Natural Science Foundation of China (No. 11988101), and the National SKA Program of China (Grant No. 2022SKA0120103). Xuyang Gao acknowledges the CAS-NWO Cooperation Program (Grant No. GJHZ1865), and the Open Project Program of the Key Laboratory of FAST, NAOC, Chinese Academy of Sciences. Xiaohui Sun is supported by the Cultivation Project for FAST Scientific Payoff and Research Achievement of CAMS-CAS, and the Science & Technology. Tao Hong is supported by the National Natural Science Foundation of China (Grant No. 12003044). We would like to thank Prof. Biwei Jiang for helpful discussion on the distance of the SNRs. This work made use of the data from FAST (Five-hundred-meter Aperture Spherical radio Telescope). FAST is a Chinese national mega-science facility, operated by National Astronomical Observatories, Chinese Academy of Sciences. This research is based in part on observations with the 100-m telescope of the Max-Planck-Institut für Radioastronomie at Effelsberg.
References
- Anderson et al. (2017) Anderson, L. D., Wang, Y., Bihr, S., et al. 2017, A&A, 605, A58
- Araya et al. (2022) Araya, M., Hurley-Walker, N., & Quirós-Araya, S. 2022, MNRAS, 510, 2920
- Baek et al. (2015) Baek, S.-J., Park, A., Ahn, Y.-J., & Choo, J. 2015, The Analyst, 140, 250
- Brisken et al. (2003) Brisken, W. F., Thorsett, S. E., Golden, A., & Goss, W. M. 2003, ApJ, 593, L89
- Burn (1966) Burn, B. J. 1966, MNRAS, 133, 67
- Chen et al. (2017) Chen, B. Q., Liu, X. W., Ren, J. J., et al. 2017, MNRAS, 472, 3924
- Condon et al. (1998) Condon, J. J., Cotton, W. D., Greisen, E. W., et al. 1998, AJ, 115, 1693
- Dokara et al. (2021) Dokara, R., Brunthaler, A., Menten, K. M., et al. 2021, A&A, 651, A86
- Dubner & Giacani (2015) Dubner, G., & Giacani, E. 2015, A&A Rev., 23, 3
- Duncan et al. (1997) Duncan, A. R., Haynes, R. F., Jones, K. L., & Stewart, R. T. 1997, MNRAS, 291, 279
- Emerson & Gräve (1988) Emerson, D. T., & Gräve, R. 1988, A&A, 190, 353
- Fesen & Milisavljevic (2010) Fesen, R. A., & Milisavljevic, D. 2010, AJ, 140, 1163
- Fesen et al. (2015) Fesen, R. A., Neustadt, J. M. M., Black, C. S., & Koeppel, A. H. D. 2015, ApJ, 812, 37
- Fesen et al. (2021) Fesen, R. A., Weil, K. E., Cisneros, I., Blair, W. P., & Raymond, J. C. 2021, MNRAS, 507, 244
- Fesen et al. (2020) Fesen, R. A., Weil, K. E., Raymond, J. C., et al. 2020, MNRAS, 498, 5194
- Foster et al. (2013) Foster, T. J., Cooper, B., Reich, W., Kothes, R., & West, J. 2013, A&A, 549, A107
- Fürst et al. (1990) Fürst, E., Reich, W., Reich, P., & Reif, K. 1990, A&AS, 85, 691
- Gaensler (1998) Gaensler, B. M. 1998, ApJ, 493, 781
- Gao & Han (2014) Gao, X. Y., & Han, J. L. 2014, A&A, 567, A59
- Gao et al. (2011) Gao, X. Y., Sun, X. H., Han, J. L., et al. 2011, A&A, 532, A144
- Gao et al. (2010) Gao, X. Y., Reich, W., Han, J. L., et al. 2010, A&A, 515, A64
- Gerbrandt et al. (2014) Gerbrandt, S., Foster, T. J., Kothes, R., Geisbüsch, J., & Tung, A. 2014, A&A, 566, A76
- Green (2019) Green, D. A. 2019, Journal of Astrophysics and Astronomy, 40, 36
- Han et al. (2021) Han, J. L., Wang, C., Wang, P. F., et al. 2021, Research in Astronomy and Astrophysics, 21, 107
- Haverkorn et al. (2006) Haverkorn, M., Gaensler, B. M., McClure-Griffiths, N. M., Dickey, J. M., & Green, A. J. 2006, ApJS, 167, 230
- Heywood et al. (2022) Heywood, I., Rammala, I., Camilo, F., et al. 2022, ApJ, 925, 165
- Hong et al. (2022) Hong, T., Han, J. L., Hou, L. G., et al. 2022, SCPMA, 65, 129702
- Hou (2021) Hou, L. G. 2021, Frontiers in Astronomy and Space Sciences, 8, 103
- Hou et al. (2022) Hou, L. G., Han, J. L., Hong, T., Gao, X. Y., & Wang, C. 2022, SCPMA, 65, 129703
- Humphreys (1978) Humphreys, R. M. 1978, ApJS, 38, 309
- Hurley-Walker et al. (2019a) Hurley-Walker, N., Gaensler, B. M., Leahy, D. A., et al. 2019a, PASA, 36, e048
- Hurley-Walker et al. (2019b) Hurley-Walker, N., Filipović, M. D., Gaensler, B. M., et al. 2019b, PASA, 36, e045
- Jiang et al. (2020) Jiang, P., Tang, N.-Y., Hou, L.-G., et al. 2020, Research in Astronomy and Astrophysics, 20, 064
- Kassim et al. (1994) Kassim, N. E., Hertz, P., van Dyk, S. D., & Weiler, K. W. 1994, ApJ, 427, L95
- Kothes et al. (2001) Kothes, R., Landecker, T. L., Foster, T., & Leahy, D. A. 2001, A&A, 376, 641
- Kothes et al. (2017) Kothes, R., Reich, P., Foster, T. J., & Reich, W. 2017, A&A, 597, A116
- Kothes et al. (2003) Kothes, R., Reich, W., Foster, T., & Byun, D.-Y. 2003, ApJ, 588, 852
- Kothes et al. (2014) Kothes, R., Sun, X. H., Reich, W., & Foster, T. J. 2014, ApJ, 784, L26
- Landecker et al. (2010) Landecker, T. L., Reich, W., Reid, R. I., et al. 2010, A&A, 520, A80
- Manchester et al. (2005) Manchester, R. N., Hobbs, G. B., Teoh, A., & Hobbs, M. 2005, AJ, 129, 1993
- Martinez et al. (2019) Martinez, J. G., Gentile, P., Freire, P. C. C., et al. 2019, ApJ, 881, 166
- Nan (2008) Nan, R. 2008, in Society of Photo-Optical Instrumentation Engineers (SPIE) Conference Series, Vol. 7012, Ground-based and Airborne Telescopes II, ed. L. M. Stepp & R. Gilmozzi, 70121E
- Nan et al. (2011) Nan, R., Li, D., Jin, C., et al. 2011, International Journal of Modern Physics D, 20, 989
- Perley & Butler (2017) Perley, R. A., & Butler, B. J. 2017, ApJS, 230, 7
- Reich (2002) Reich, W. 2002, in Neutron Stars, Pulsars, and Supernova Remnants, ed. W. Becker, H. Lesch, & J. Trümper, 1
- Reich et al. (1990) Reich, W., Fürst, E., Reich, P., & Reif, K. 1990, A&AS, 85, 633
- Reich et al. (2004) Reich, W., Fürst, E., Reich, P., et al. 2004, in The Magnetized Interstellar Medium, ed. B. Uyanıker, W. Reich, & R. Wielebinski, 45
- Reid et al. (2014) Reid, M. J., Menten, K. M., Brunthaler, A., et al. 2014, ApJ, 783, 130
- Reid et al. (2019) Reid, M. J., Menten, K. M., Brunthaler, A., et al. 2019, ApJ, 885, 131
- Sabin et al. (2013) Sabin, L., Parker, Q. A., Contreras, M. E., et al. 2013, MNRAS, 431, 279
- Shan et al. (2018) Shan, S. S., Zhu, H., Tian, W. W., et al. 2018, ApJS, 238, 35
- Sokoloff et al. (1998) Sokoloff, D. D., Bykov, A. A., Shukurov, A., et al. 1998, MNRAS, 299, 189
- Stein et al. (2021) Stein, Y., Vollmer, B., Boch, T., et al. 2021, A&A, 655, A17
- Sun et al. (2022) Sun, X. H., Gao, X. Y., Reich, W., et al. 2022, Research in Astronomy and Astrophysics, 22, 125011
- Sun et al. (2007) Sun, X. H., Han, J. L., Reich, W., et al. 2007, A&A, 463, 993
- Sun et al. (2021) Sun, X.-H., Meng, M.-N., Gao, X.-Y., et al. 2021, Research in Astronomy and Astrophysics, 21, 282
- Sun et al. (2011) Sun, X. H., Reich, W., Han, J. L., et al. 2011, A&A, 527, A74
- Taylor et al. (2003) Taylor, A. R., Gibson, S. J., Peracaula, M., et al. 2003, AJ, 125, 3145
- Tian et al. (2007) Tian, W. W., Leahy, D. A., & Wang, Q. D. 2007, A&A, 474, 541
- Turtle et al. (1962) Turtle, A. J., Pugh, J. F., Kenderdine, S., & Pauliny-Toth, I. I. K. 1962, MNRAS, 124, 297
- Uyanıker et al. (1998) Uyanıker, B., Fürst, E., Reich, W., Reich, P., & Wielebinski, R. 1998, A&AS, 132, 401
- Uyanıker et al. (1999) Uyanıker, B., Fürst, E., Reich, W., Reich, P., & Wielebinski, R. 1999, A&AS, 138, 31
- van der Laan (1962) van der Laan, H. 1962, MNRAS, 124, 179
- Van Eck et al. (2011) Van Eck, C. L., Brown, J. C., Stil, J. M., et al. 2011, ApJ, 728, 97
- Voges et al. (1999) Voges, W., Aschenbach, B., Boller, T., et al. 1999, A&A, 349, 389
- Wardle & Kronberg (1974) Wardle, J. F. C., & Kronberg, P. P. 1974, ApJ, 194, 249
- Wenger et al. (2018) Wenger, T. V., Balser, D. S., Anderson, L. D., & Bania, T. M. 2018, ApJ, 856, 52
- Winkel et al. (2016) Winkel, B., Kerp, J., Flöer, L., et al. 2016, A&A, 585, A41
- Wolleben et al. (2021) Wolleben, M., Landecker, T. L., Douglas, K. A., et al. 2021, AJ, 162, 35
- Xiao et al. (2011) Xiao, L., Han, J. L., Reich, W., et al. 2011, A&A, 529, A15
- Xiao et al. (2022) Xiao, L., Zhu, M., Sun, X.-H., Jiang, P., & Sun, C. 2022, Research in Astronomy and Astrophysics, 22, 035003
- Xu & Han (2014) Xu, J., & Han, J.-L. 2014, Research in Astronomy and Astrophysics, 14, 942
- Xu et al. (2022) Xu, J., Han, J. L., Wang, P. F., & Yan, Y. 2022, SCPMA, 65, 129704
- Yu et al. (2019) Yu, B., Chen, B. Q., Jiang, B. W., & Zijlstra, A. 2019, MNRAS, 488, 3129
- Zeng et al. (2021) Zeng, Q., Chen, X., Li, X., et al. 2021, MNRAS, 500, 2969
- Zhao et al. (2020) Zhao, H., Jiang, B., Li, J., et al. 2020, ApJ, 891, 137