cegpy: Modelling with Chain Event Graphs in Python
Abstract
Chain event graphs (CEGs) are a recent family of probabilistic graphical models that generalise the popular Bayesian networks (BNs) family. Crucially, unlike BNs, a CEG is able to embed, within its graph and its statistical model, asymmetries exhibited by a process. These asymmetries might be in the conditional independence relationships or in the structure of the graph and its underlying event space. Structural asymmetries are common in many domains, and can occur naturally (e.g. a defendant vs prosecutor’s version of events) or by design (e.g. a public health intervention). However, there currently exists no software that allows a user to leverage the theoretical developments of the CEG model family in modelling processes with structural asymmetries. This paper introduces cegpy, the first Python package for learning and analysing complex processes using CEGs. The key feature of cegpy is that it is the first CEG package in any programming language that can model processes with symmetric as well as asymmetric structures. cegpy contains an implementation of Bayesian model selection and probability propagation algorithms for CEGs. We illustrate the functionality of cegpy using a structurally asymmetric dataset.
keywords:
chain event graphs , staged trees , event trees , graphical models , asymmetric processes , context-specific independence , PythonPACS:
0000 , 1111MSC:
0000 , 1111[inst1]city=Kenilworth, postcode=CV8 1JY, country=UK \affiliation[inst2]organization=Statistics Department, University of Warwick,city=Coventry, postcode=CV4 7AL, country=UK \affiliation[inst3]organization=Centre for Complexity Science, University of Warwick,city=Coventry, postcode=CV4 7AL, country=UK
[inst4]organization=Alan Turing Institute,city=London, postcode=NW1 2DB, country=UK
1 Introduction
A probabilistic graphical model (PGM) is composed of a statistical model and a graph representing the conditional independence relationships between the defining random variables or events of the underlying model. The graph of a PGM gives a compact visual representation of the factorisation of the joint probability distribution of a statistical model, and provides a way to perform efficient inference using local computations (Pearl, 2009). A key benefit of PGMs is that the gist of its graph can typically be understood by those without formal statistical or mathematical training; thereby facilitating interactions between statisticians, domain experts and decision makers.
Bayesian networks (BNs) (Pearl, 2009), currently the most popular family of PGMs, have been successfully applied to a wide range of domains. Notwithstanding the great success of BNs, they do have some shortcomings. In particular, BNs are unable to fully describe processes that exhibit asymmetries either in their conditional independence relationships or in their structure. The former indicates the presence of context-specific conditional independencies which are independence relationships that only hold for certain values of the conditioning variables. Whereas, the latter refers to the presence of structural missing values, i.e. values that are missing which have no underlying meaningful value, and/or structural zeros333These are in contrast to sampling zeros which occur due to limitations of data sampling., i.e. observations of a zero frequency for a category of a categorical variable where a non-zero observation is logically restricted. Such asymmetries are common in many real-world processes especially in domains such as medicine, risk analysis, policing, forensics, law, ecology and reliability engineering where processes are best described through an unfolding of events (see e.g. Zhang and Poole (1999); Boutilier et al. (1996); Shenvi et al. (2018)).
Chain event graphs were introduced in Smith and Anderson (2008) for asymmetric processes and they generalise BNs. A CEG is constructed from the event tree description of a process by leveraging the probabilistic symmetries existing within it to reduce the number of nodes and edges required. Thereby, CEGs ensure the resultant statistical model and graph are not any more complex than they need to be to represent the process. Since their relatively recent introduction, several methodological developments have now been made for the CEG family. These include model selection algorithms (Freeman and Smith, 2011a; Silander and Leong, 2013; Cowell and Smith, 2014), probability propagation algorithms (Thwaites et al., 2008; Shenvi and Smith, 2020b) and a d-separation theorem (Wilkerson, 2020) as well as tools for causal inference (Thwaites et al., 2010; Thwaites, 2013; Yu and Smith, 2021) and diagnostics in a CEG (Wilkerson, 2020). Applications of CEGs in public health (Barclay et al., 2013; Shenvi et al., 2018), medicine (Keeble et al., 2017b, a), educational studies (Freeman and Smith, 2011b), asymmetric Bayesian games (Thwaites and Smith, 2017), migration studies (Strong et al., 2021), and policing (Collazo, 2017; Bunnin and Smith, 2019) have also been explored.
Despite the prevalence of asymmetric processes and the proven flexibility offered by CEGs in modelling such processes, CEGs are yet to be widely adopted by applied statisticians. A major hindrance to the wider application of CEG methodologies is the lack of existing software, particularly when it comes to modelling structurally asymmetric processes. There currently exist two R packages for modelling with CEGs, namely ceg (Collazo and Taranti, 2017) and stagedtrees (Carli et al., 2022). However, neither of these supports processes with structural asymmetries. In contrast, for modelling with BNs, there exist several well-developed and maintained softwares such as Netica (Norsys Software Corp, 2020), Weka (Eibe et al., 2016), BARD (Nyberg et al., 2022), GeNIe (BayesFusion, LLC, 2022), and Hugin (HuginExpert, 2022), as well as packages such as bnlearn (Scutari, 2010) and deal (Bottcher and Dethlefsen, 2018) in R; BayesPy (Luttinen, 2016), GOBNILP (Cussens, 2020) and BayeSuites in Python. In this paper, we present cegpy, the first Python package for modelling with CEGs, and the first package across all languages to support modelling of processes with structural asymmetries.
Section 2 discusses the prevalence of structurally asymmetric processes, and it provides a review of CEGs as is relevant for cegpy. Section 3 discusses the implementation of cegpy in Python. Section 4 illustrates the strength of cegpy through modelling of an asymmetric public health intervention designed to reduce falls-related injuries among the elderly. We conclude the paper with a discussion about future functionalities for cegpy in Section 5.
2 Modelling with Chain Event Graphs
2.1 Asymmetric Processes
Before reviewing CEGs, we first discuss the generality of asymmetric processes. In particular, the main advantage of CEGs over other PGMs is that they can model processes with structural asymmetries. Asymmetric structures may occur naturally (e.g. prosecutor vs defendant’s versions of events in a courtroom trial) or by design (e.g. an intervention to provide all or some of (i) behavioural counselling, (ii) group therapy and (iii) nicotine replacement products to individuals depending on their smoking history). Below we list further examples of structurally asymmetric processes.
-
•
A public health intervention process: To maximise the effects of the intervention given limited resources, the level of support is typically varied based on the needs of the individuals (e.g. annual flu vaccines provided by the UK’s National Health Services to those most at risk).
-
•
A medical diagnosis process: Diagnosis involves identifying the patient’s ailment based on their background covariates (e.g. age, sex, health history), the sequence of symptoms already exhibited by them, and the additional symptoms that they may exhibit in the future according to the possible diagnoses. Different diseases might have an overlap of symptoms, and further, not all patients suffering from a certain disease exhibit all associated symptoms.
-
•
A forensic proceeding: The contrasting explanations for forensic evidence given by a defendant and prosecutor typically result in asymmetric developments in the sequence of events in the two arguments.
-
•
A policing process: Depending on the current preparedness of an individual intent on committing a crime, the sequence of preparatory tasks undertaken by the individual can be very varied; e.g.: training, help of like-minded criminals, target identification acquisition of resources.
-
•
A machinery failure process: Several different sequences of events can lead to faults in machinery, involving different failing components.
As evidenced by the above examples, we conjecture that asymmetric processes are common – or at the very least, not uncommon – in several domains. However, a large number of statistical methods and techniques rely on using variables as building blocks in their description of the process, and thereby, implicitly expect process to have symmetric structures. This expectation influences the choice of variables used to describe a process (e.g. choosing proxy variables to circumvent structural missing values) and also the way in which the data is recorded. In Section 4 we describe how structural zeros and structural missing values can be easily recorded within the dataset of an asymmetric process for modelling with CEGs within our cegpy package.
2.2 Chain Event Graphs
CEGs provide an alternative to BNs for processes exhibiting asymmetries in their conditional independencies and/or structures. With major modifications (typically tree-based), a BN can represent context-specific conditional independencies. However, currently there is no way to embed structural asymmetries within a BN model. The existence of asymmetric structures has been recognised in several domains, but until the development of CEGs, had not been explicitly addressed within the graphical modelling framework.
The construction of the CEG for a process begins by eliciting the event tree describing the process being studied. An event tree is a directed tree graph with a single root node. The nodes with no emanating edges are called leaves, and the non-leaf nodes are called situations. Each situation is associated with a transition parameter vector which indicates the conditional probability of an individual, who has arrived at the situation, going along one of its edges. The event tree undergoes a sequence of transformations to become the graph of its associated CEG. A non-technical summary of these transformations as given in Shenvi and Smith (2020a) is presented below.
-
•
Situations in the event tree whose immediate evolutions, i.e. their associated conditional transition parameter vectors, are equivalent are said to be in the same stage and are assigned the same node colouring to indicate this symmetry.
-
•
Situations whose rooted subtrees (i.e. the subtree obtained by considering that situation as the root) are isomorphic in the structure and colour preserving sense are said to be in the same position and are merged into a single node. This node retains the colouring of the situations it merged.
-
•
All the leaves are merged into a single sink node.
Formally, let denote an event tree with a finite node set and an edge set . A directed edge from nodes to with label is an ordered triple given by ; or by when unambiguous. Let and denote the sets of leaves and situations respectively.
Definition 1 (Stage).
In an event tree , two situations and are said to be in the same stage whenever . Additionally, for we require that and where edge emanates from and emanates from .
Identification of the stages in the event tree can be done using any suitable model selection algorithm. The collection of stages partitions the nodes of the event tree. An event tree whose nodes are coloured to represent its stage memberships is called a staged tree. It is common practice to suppress the colouring of singleton stages in the graphs of the staged tree and CEG for visual clarity. Within cegpy, singleton stages are coloured white, leaves and their corresponding sink node are in light-grey. Stages enable us to reduce the parameter space of the CEG model. For compacting the representation of the CEG model, an additional concept of positions is required.
Definition 2 (Position).
In a staged tree , two situations and are said to be in the same position whenever we have where and are the coloured subtrees of rooted at and respectively.
The collection of positions is a finer partition of the node set of the event tree. Situations which are in the same position can be represented by a single node in the graph of the CEG as their complete future unfoldings are identical. We now formally define a CEG.
Definition 3 (Chain Event Graph).
A CEG is defined by the triple with the following properties:
-
•
where is the set of situations representing each position set in , is the sink node and for , . Nodes in retain their stage colouring.
-
•
Situations in belonging to the same position set in are contracted into their representative node contained in . This node contraction merges multiple edges between two nodes into a single edge only if they share the same edge label.
-
•
Leaves of are contracted into sink node .
Staged trees and CEGs that embed context-specific independencies but not structural asymmetries are said to be stratified. Those that additionally embed structurally asymmetries are said to be non-stratified.
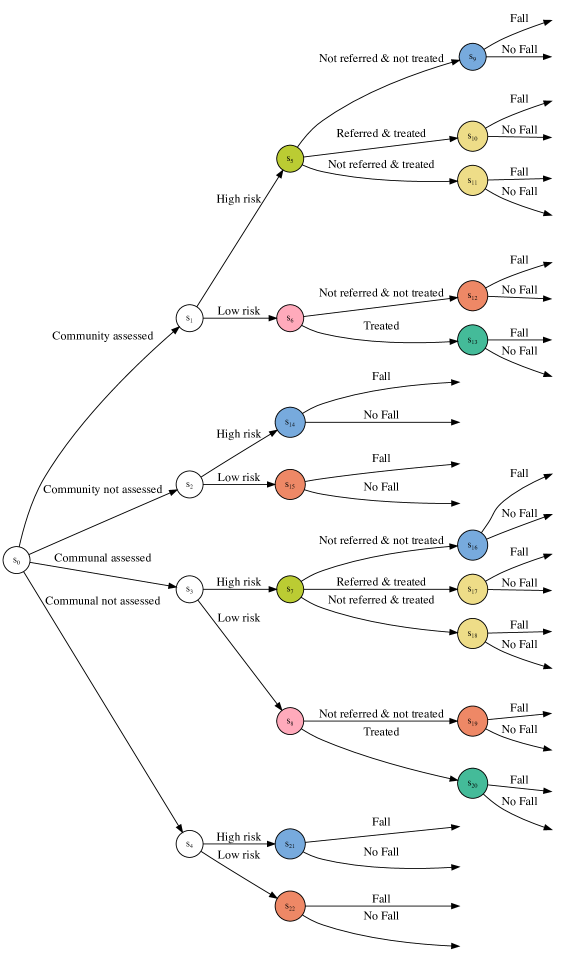
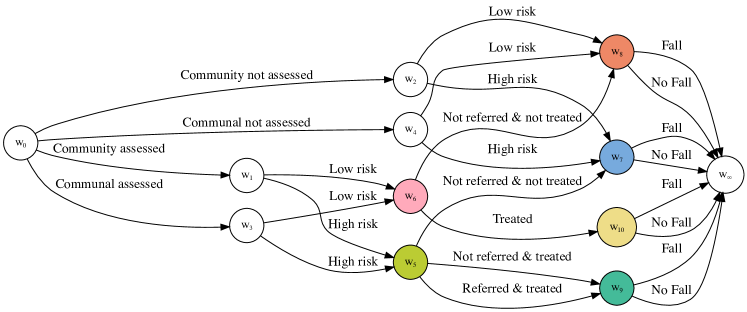
Example 4 (Falls Intervention).
We consider here a non-pharmacological intervention designed to reduce falls-related injuries and fatalities among the elderly as presented in Eldridge et al. (2005) and later modelled with a CEG in Shenvi et al. (2018). The intervention aims to enhance assessment, referral pathways, and treatment for individuals aged over 65 years living in the community as well as those in communal establishments (i.e. care homes, nursing homes and hospitals) who have a substantial risk of falling. Under this intervention, a certain proportion of individuals aged over 65 would be assessed and classified as low or high risk. Those assessed to be at a high risk are referred to a falls clinic for an advanced assessment. All those who are referred, 50% of other high risk individuals, and 10% of low risk individuals go on to receive treatment. It is assumed that those who are not assessed receive neither referral nor treatment.
Figure 1 shows a hypothesised staged tree and its corresponding CEG for this process. It is clear from the staged tree that the process has an asymmetric structure by interventional design, and therefore the staged tree and CEG representing this process are non-stratified. Nodes and are coloured the same to indicate that having arrived at one of these nodes, the probability of being referred and treated (/not being referred but being treated/ not being treated) is the same. These nodes are also in the same position as their rooted subtrees are isomorphic in the colour- and structure-preserving sense. Therefore, and are represented by the single node in the graph of the CEG.
2.2.1 Bayesian Model Selection
A CEG is uniquely defined by its staged tree and the parameters over its staged tree, (Shenvi and Smith, 2020a). Hence, model selection in CEGs is equivalent to identifying the sets of stages in the event tree to obtain the staged tree. The two main approaches to learning the stages in an event tree are (i) the agglomerative hierarchical clustering (AHC) algorithm (Freeman and Smith, 2011a) and (ii) a brute-force approach using dynamic programming (Cowell and Smith, 2014; Silander and Leong, 2013). Both of these are score-based algorithms that aim to maximise a chosen score function, typically the log marginal likelihood score of the model.
Within cegpy, we implemented the AHC algorithm as it is computationally efficient for moderate-sized event trees – which we envision will be what the package will be used for – and at present, it is the most popular approach for applications involving CEGs. The AHC algorithm does not rely on structural symmetry and is directly applicable to the non-stratified class.
The AHC algorithm is a greedy, bottom-up hierarchical clustering algorithm. It begins with each situation in the event tree being in its own singleton stage. Thereafter, at each step, it merges the two stages that give the highest improvement in terms of the log marginal likelihood score. The algorithm terminates when the score can no longer be improved by merging two stages. The technical details of the AHC and its associated pseudo-code are presented in Appendix A in the supplementary material.
2.2.2 Probability Propagation
Probability propagation refers to updating of posterior parameters using local computations, given the observation of some “evidence”. The probability propagation algorithm for CEGs was given by Thwaites et al. (2008).
Observation of evidence for CEGs corresponds to the observation that an individual (or equivalently, a set of exchangeable individuals) has visited a node or an edge. This type of evidence may be referred to as positive evidence where we observe that a node/edge was visited as compared to negative evidence where we observe that a node/edge was not visited. Further, evidence is certain when observations occur with probability one and uncertain evidence when there is a non-trivial probability distribution associated with a possible set of events or states. Note that negative evidence can be recast as uncertain positive evidence. The CEG propagation algorithm requires that the evidence is intrinsic; this condition is trivially met when the evidence is defined in terms of nodes and edges visited (Collazo et al., 2018).
Unlike most other graphical models, the observation of a node or edge in a CEG reduces the complexity of the process under consideration by rendering some other nodes and edges unvisited with probability one. Conditional on the evidence, such nodes and edges can be removed without loss of information. If we denote a CEG by , and evidence by , then the -reduced graph of does not contain the nodes and edges rendered impossible by . The propagation algorithm for CEGs is a backward-forward message-passing algorithm involving closed-form calculations to revise the probabilities associated with the -reduced graph of . The technical details of the propagation algorithm are given in Appendix B in the supplementary material.
3 The cegpy Package
cegpy is the first Python implementation of CEGs, the first across all languages to support structurally asymmetric processes and the first to support probability propagation. It is developed using a Bayesian framework which provides a structured way to incorporate prior knowledge, to update the posterior as more data is received, and to perform modelling with a combination of expert knowledge and data when working on problems with limited data.
3.1 Python Implementation
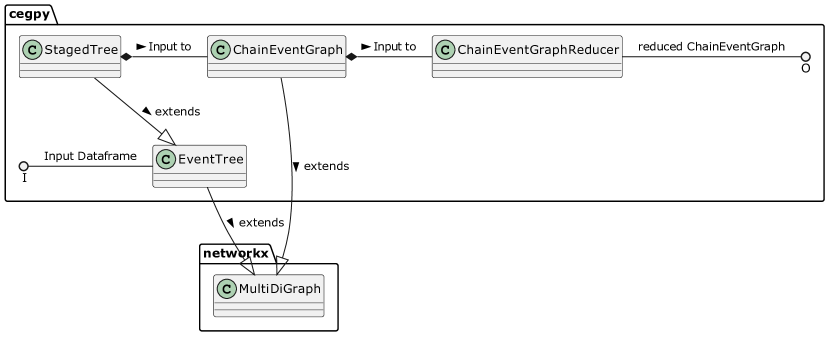
cegpy is built in Python, and makes use of the open source packages pandas, NetworkX, and GraphViz. It is designed to harness the object-oriented functionalities of Python. The class diagram in Figure 2 shows the object-oriented inheritance structure of the various classes in the package. The EventTree, StagedTree, ChainEventGraph and ChainEventGraphReducer (corresponding to an -reduced CEG, see Section 2.2.2) are all object classes. From the inheritance structure, we can see that, for instance, the StagedTree class inherits the features of the EventTree class and extends it. The EventTree class and ChainEventGraph class inherit from the MultiDiGraph (directed multi-graph) class of NetworkX which is a well-developed and thoroughly tested package for studying graphs and networks in Python.
The EventTree class is the entry-point for data into the package. It converts the input data into an event tree so that a model selection algorithm can be run on it to then create a StagedTree. To construct the event tree, the EventTree object scans each row of a column-based data set, and counts all the unique sequences of events, i.e. paths, contained in it. This data is stored in a Python dictionary, where each key in the dictionary represents an edge (expressed as a path from the root up to that edge) in the tree, and maps to the number of times that path has been observed in the dataset which corresponds to the number of transitions along that edge.
| Housing Assessment | Risk | Treatment | Fall |
| Community Not Assessed | Low Risk | Not Referred and Not Treated | Fall |
| Community Not Assessed | High Risk | Not Referred and Not Treated | Fall |
| Community Assessed | Low Risk | – | Don’t Fall |
| Community Assessed | High Risk | Referred and Treated | Fall |
For example, consider the example dataset for the falls intervention in Table 1. This is transformed into a dictionary like so:
By design, the paths are ordered alphabetically, which enables consistent node-naming, even when the rows in the dataset are reordered. Once the paths are determined, the edges dictionary is used to create a NetworkX MultiDiGraph object, which is then used as the data structure representation of the event tree.
As the StagedTree class inherits from the EventTree class, the former is simply a special case of the latter. A StagedTree object determines which nodes of the EventTree are in the same stage and applies a colour scheme to them to show the distinct stages. The cegpy package contains an implementation of the AHC algorithm described in Section 2.2.1 for identifying the stages from the EventTree. Under a Bayesian framework, the algorithm is initiated with a prior specification for each situation (i.e. each initial singleton stage) in the EventTree. With the default settings in cegpy, this is done using the approach of Collazo et al. (2018) whereby an imaginary sample size for the root is set and this is then propagated uniformly through the EventTree. The default imaginary sample size is given by the maximum number of edges emanating out of any situation in the EventTree. Further, cegpy also supports specification of priors for the colouring of the StagedTree (and thus, the structure of the ChainEventGraph) by indicating which situations are allowed to be merged together. This is done by specifying a hyperstage (Collazo, 2017) which is a collection of sets such that two situations cannot be in the same stage unless they belong to the same set in the hyperstage. Under a default setting in cegpy, all situations which have the same number of outgoing edges and equivalent set of edge labels are in the same set within the hyperstage. Note that users can specify their own prior, imaginary sample size or hyperstage.
The AHC implementation is run within the StagedTree object and it is parallelised for efficiency. Once the stages have been identified, a ChainEventGraph object can be created by passing the StagedTree as input. The ChainEventGraph object merges the nodes that are in the same position. To do this, it uses the transformation algorithm described in Shenvi and Smith (2020a). cegpy also includes an implementation of the probability propagation algorithm described in Section 2.2.2. In order to propagate probabilities through a CEG, the ChainEventGraphReducer object is first instantiated from the ChainEventGraph object. Evidence can be specified to this object in terms of the nodes and edges as certain or uncertain evidence. Once all the evidence has been provided, the -reduced CEG with the updated probabilities can then be created as a new ChainEventGraph object.
3.2 Related Work
There are two previous packages that can learn and visualise CEGs from data. In 2017, the R package ceg (Collazo and Taranti, 2017) was the first package able to learn CEGs from data. This package implements the AHC for Bayesian model selection in CEGs. In 2021, the R package stagedtrees (Carli et al., 2022) was released, which included several score-based and clustering-based algorithms for non-Bayesian model selection in CEGs such as hill-climbing, backward hill-climbing and k-means. Whilst both these packages are able to represent context-specific conditional independencies, neither are able to represent asymmetric structures, i.e. non-stratified staged trees and CEGs. Therefore, neither of these packages can be used to model processes with asymmetrical unfolding of events such as those described in Section 2.1; see examples in Appendix C in the supplementary material. cegpy fills this gap.
| Package | Language | CEG class | Model selection | Propagation |
| ceg | R | Stratified only | Bayesian | ✗ |
| stagedtrees | R | Stratified only | Frequentist | ✗ |
| cegpy | Python | Stratified and non-stratified | Bayesian | ✓ |
The path-based approach of cegpy is in contrast to the column-based approach of other CEG packages such as ceg and stagedtrees. In the former approach, all the data is associated with edges of the event tree and it corresponds to using events as the building blocks of the model. It can routinely handle non-stratified CEGs. On the other hand, the column-based approach associates the data to the variables of the model and to their corresponding state spaces. This approach makes it extremely difficult to model non-stratified CEGs. For instance, the structural missing values associated with the Treatment variable for individuals who are not assessed cannot be recorded easily within the column-based approach. An alternative is to create a new category for the Treatment variable called “Not referred & not treated” which then renders the counts on the other categories of this variable into structural zeros leading to redundancies in the parameters and loss of representation.
Finally, Python’s object-oriented architecture lends itself well to extensibility. The functionality and CEG classes supported by cegpy can be easily built upon using inheritance. For example, to create a new class of CEGs in cegpy with arbitrary holding time distributions (such as in Barclay et al. (2015)), a new TemporalEventTree class can be created which inherits from the EventTree class and extends it to handle the holding times in the input dataset. Similarly, a TemporalStagedTree class can be created such that it inherits the initialisation and functions from the TemporalEventTree class as well as just the functions from the StagedTree class.
4 An Illustrative Example
In this section, we illustrate the key functionalities of the cegpy package through the analysis of a structurally asymmetric process. We revisit the public health intervention to reduce falls-related injuries and fatalities among the elderly as described in Example 4. We use the synthetic dataset simulated by Shenvi et al. (2018) and provided with the supplementary materials. Note that illustrations and guidance for the full range of functionalities support by cegpy can be found at https://github.com/peterrhysstrong/cegpy-binder.
4.1 Creating the Event Tree
The Falls dataset provides information concerning adults over the age of 65, and includes four categorical variables as given below with their state spaces:
-
•
Living situation and whether they have been assessed, state space: {Communal Assessed, Communal Not Assessed, Community Assessed, Community Not Assessed};
-
•
Risk of a future fall, state space: {High Risk, Low Risk};
-
•
Referral and treatment status, state space: {Not Referred & Not Treated, Not Referred & Treated, Referred & Treated};
-
•
Outcome, state space: {Fall, Don’t Fall}.
Recall from the description in Example 4 that this process has structural asymmetries. None of the individuals assessed to be low risk are referred to the falls clinic and thus, for this group, the count associated with the ‘Referred & Treated’ category is a structural zero. Moreover, for individuals who are not assessed, their responses are structurally missing for the referral and treatment variable.
Observe that since cegpy constructs the event tree by creating a dictionary of the paths in the input dataset, there is no need to specify structural zeros as they do not occur in the dataset. On the other hand, we encode structural missing values in the dataset as NaNs. For example, a NaN value in the column relating to the referral and treatment variable is interpreted by cegpy as a structural missing value.
output:
        HousingAssessment       Risk Treatment        Fall
0  Community Not Assessed   Low Risk       NaN        Fall
1  Community Not Assessed  High Risk       NaN        Fall
2  Community Not Assessed   Low Risk       NaN  Don’t Fall
3  Community Not Assessed   Low Risk       NaN  Don’t Fall
4  Community Not Assessed   Low Risk       NaN        Fall
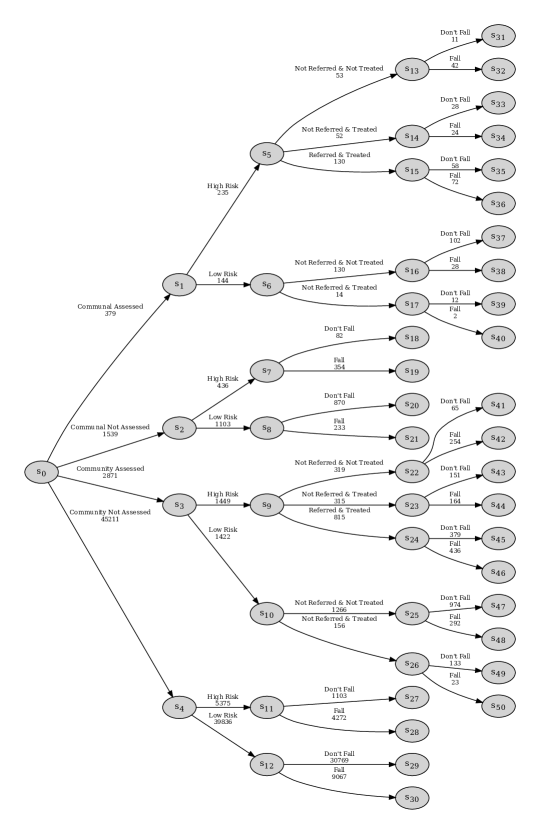
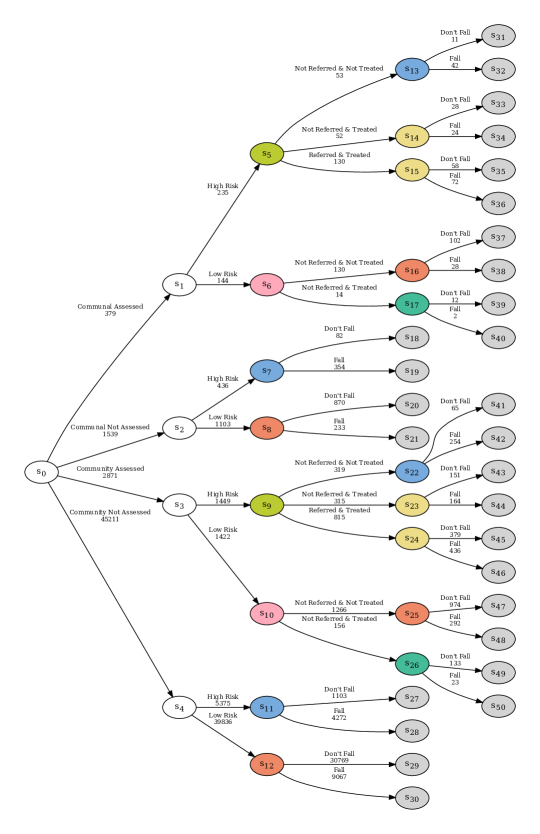
The event tree can be constructed from the falls dataset by initialising an EventTree object using the code given below and as shown in Figure 3.
Note here that any paths that should logically be in the event tree description of the process but are absent from the dataset due to sampling limitations would need to be manually added by the user using the sampling_zero_paths argument when initialising the EventTree object. Further, not all missing values in the dataset will be structurally missing. To demarcate the difference, a user can give different labels to the structural and sampling missing values in the dataset and provide these labels to the struct_missing_label and missing_label arguments respectively when initialising the EventTree object.
4.2 Creating the Staged Tree
We now look at creating a staged tree from our dataset. To do this, we initialise a StagedTree object with our dataset as the input. Note that it is not necessary to first initialise an EventTree object. To create a staged tree, we must first identify the stages in the event tree. We do this by running the AHC algorithm within the StagedTree object. The code and output below show the default settings of the hyperstage, alpha (imaginary sample size at the root, see Section 3.1) and prior for the falls dataset. The priors and posteriors are saved as fractions to maintain accuracy through the iterative calculations.
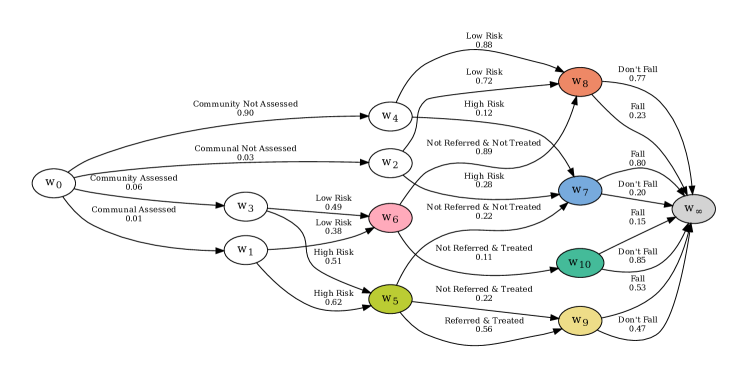
We now run the AHC algorithm with the above default settings using the code below and generate the associated staged tree figure as shown in Figure 4. Additionally, a user can specify a list of colours or palette to be used in the staged tree and its corresponding CEG. In this example, we have used a colourblind-friendly palette as shown by the colours list below.
4.3 Creating the Chain Event Graph
Once the stages have been identified by running the AHC algorithm on the StagedTree object, we can initialise a ChainEventGraph object that takes the StagedTree object as an input. Using this StagedTree object, the ChainEventGraph object can generate the CEG figure using the code below and as shown in Figure 5.
4.4 Probability Propagation on the Chain Event Graph
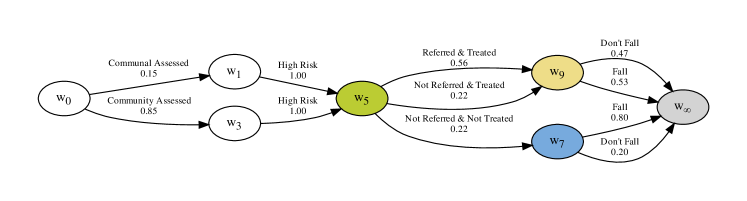
Finally, we demonstrate how cegpy can be used for probability propagation on a given CEG after observing some evidence associated with it. For instance, suppose that we have observed an assessed, high risk individual. This is equivalent to observing the node in the CEG in Figure 5 with certainty. The probabilities associated with the CEG can be updated in light of this certain observation by first initialising a ChainEventGraphReducer object with the CEG as the input and then adding the certain evidence as shown in the code below. The graph and conditional probabilities of the updated CEG are given in Figure 6. We can see that based on this observation, the probability that the observed individual is from a communal establishment is updated from (sum of communal assessed and communal not assessed) to .
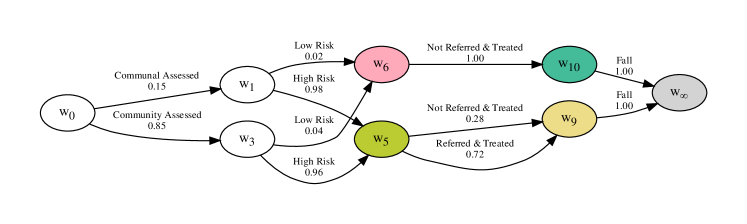
We can also use cegpy to propagate uncertain evidence. For example, consider the evidence that the individuals under consideration had been treated but they still suffered a fall. Based on this information, we know that the individuals must have passed through one of the following sequences of edges in the CEG in Figure 5: (i) and ; (ii) and ; or (iii) and . To simplify, this is equivalent to having uncertain evidence about nodes and , and about the edges and . As earlier, to update the graph and the conditional probabilities in the CEG, we can initialise a ChainEventGraphReducer object with the CEG as the input, add both sets of uncertain evidence and obtain the updated figure. The code for this is given below and the graph of the updated CEG is in Figure 7.
5 Discussion
cegpy is an open-source Python package that facilitates modelling with staged trees and CEGs, providing functionality for Bayesian model selection and probability propagation. This package is the first implementation of staged trees and CEGs in Python, and, unlike previous implementations in R which focus only on the stratified class, cegpy’s functionality extends to all staged trees and CEGs, stratified and non-stratified alike. Further, it is the first package that provides support for probability propagation. Therefore, cegpy can support users with categorical data to create models of processes with structural asymmetries, which can be analysed to understand complex dependence structures. We discuss below a few avenues for greatly enhancing the current functionality provided by cegpy444Contributions on https://github.com/g-walley/cegpy are always welcome and will be much appreciated..
In the current version of cegpy, we have focused on Bayesian methods. However, it is straightforward to implement other classical methods and we plan to do this in a future version. Moreover, currently cegpy only provides support for the AHC algorithm. Other existing Bayesian model selection algorithms have considerable drawbacks: dynamic programming Silander and Leong (2013) is computationally infeasible for all but the smallest of data sets. Further research is needed to explore computationally efficient Bayesian model selection techniques for CEGs. Strong and Smith (2022)’s work on Bayesian model averaging using a modification of the AHC algorithm has been implemented as an extension to cegpy (see https://github.com/peterrhysstrong/cegpy_BMA) and we plan to make this available in a future version of the package. Further extensions could implement other model selection techniques, such as those in stagedtree.
As described in Section 3.2, cegpy uses a path-based approach to constructing the event tree. Thereby, sampling zeros paths are not automatically filled in for unobserved combinations of variables. Currently, users must add these paths manually. Filling in of sampling zero paths can be automated by assuming that the tree is stratified. This can be added as an argument for the EventTree class to create these paths at the point of initialisation of an EventTree object.
Finally, for the purposes of expert elicitation, it would be extremely useful to enable a user to directly specify an event tree, staged tree or CEG structure – with colouring and possibly, with parameters – in the cegpy package. Of course, model selection algorithms cannot be used due to the absence of data but it would be beneficial for visualisation and evidence propagation. We are currently looking into adding this functionality by directly importing graphs specified using the DOT language used by GraphViz.
References
- Barclay et al. (2015) Barclay, L.M., Collazo, R.A., Smith, J.Q., Thwaites, P.A., Nicholson, A.E., 2015. The Dynamic Chain Event Graph. Electron. J. of Stat. 9, 2130–2169.
- Barclay et al. (2013) Barclay, L.M., Hutton, J.L., Smith, J.Q., 2013. Refining a Bayesian Network Using a Chain Event Graph. Intern. J. of Approx. Reason. 54, 1300–1309.
- BayesFusion, LLC (2022) BayesFusion, LLC, 2022. GeNIe Modeler. Version 4.0.
- Bottcher and Dethlefsen (2018) Bottcher, S.G., Dethlefsen, C., 2018. deal: Learning Bayesian Networks with Mixed Variables. R pkg Version 1.2-39.
- Boutilier et al. (1996) Boutilier, C., Friedman, N., Goldszmidt, M., Koller, D., 1996. Context-Specific Independence in Bayesian Networks, in: Proc. of the 12th Intern. Conf. on Uncertain. in Artif. Intell., pp. 115–123.
- Bunnin and Smith (2019) Bunnin, F.O., Smith, J.Q., 2019. A Bayesian Hierarchical Model for Criminal Investigations. Bayesian Anal. 16, 1–30.
- Carli et al. (2022) Carli, F., Leonelli, M., Riccomagno, E., Varando, G., 2022. The R Package stagedtrees for Structural Learning of Stratified Staged Trees. J. of Stat. Soft. 102, 1–30.
- Collazo (2017) Collazo, R., 2017. The Dynamic Chain Event Graph. Ph.D. thesis. The University of Warwick.
- Collazo et al. (2018) Collazo, R., Görgen, C., Smith, J.Q., 2018. Chain Event Graphs. CRC Press.
- Collazo and Taranti (2017) Collazo, R., Taranti, P., 2017. ceg: Chain Event Graph. R pkg Version 0.1.0.
- Cowell and Smith (2014) Cowell, R.G., Smith, J.Q., 2014. Causal Discovery through MAP Selection of Stratified Chain Event Graphs. Electron. J. of Stat. 8, 965–997.
- Cussens (2020) Cussens, J., 2020. GOBNILP: Learning Bayesian Network Structure with Integer Programming, in: Intern. Conf. on Probab. Graph. Models, PMLR. pp. 605–608.
- Eibe et al. (2016) Eibe, F., Hall, M.A., Witten, I.H., 2016. The WEKA Workbench, Morgan Kaufmann Publishers.
- Eldridge et al. (2005) Eldridge, S., Spencer, A., Cryer, C., Parsons, S., Underwood, M., Feder, G., 2005. Why Modelling a Complex Intervention is an Important Precursor to Trial Design. J. of Health Serv. Res. & Policy 10, 133–142.
- Freeman and Smith (2011a) Freeman, G., Smith, J.Q., 2011a. Bayesian MAP Model Selection of Chain Event Graphs. J. Multivar. Anal. 102, 1152–1165.
- Freeman and Smith (2011b) Freeman, G., Smith, J.Q., 2011b. Dynamic Staged Trees for Discrete Multivariate Time Series: Forecasting, Model Selection and Causal Analysis. Bayesian Anal. 6, 279–305.
- HuginExpert (2022) HuginExpert, 2022. HUGIN. Version 9.2.
- Keeble et al. (2017a) Keeble, C., Thwaites, P., Baxter, P., Barber, S., Parslow, R., Law, G., 2017a. Learning through Chain Event Graphs: The Role of Maternal Factors in Childhood Type 1 Diabetes. Am. J. of Epidemiol. 186, 1204–1208.
- Keeble et al. (2017b) Keeble, C., Thwaites, P.A., Barber, S., Law, G., Baxter, P., 2017b. Adaptation of Chain Event Graphs for use with Case-Control Studies in Epidemiology. Intern. J. of Biostat. 13.
- Luttinen (2016) Luttinen, J., 2016. BayesPy: Variational Bayesian Inference in Python. J. of Mach. Learn. Res. 17, 1419–1424.
- Norsys Software Corp (2020) Norsys Software Corp, 2020. Netica. Version 6.08.
- Nyberg et al. (2022) Nyberg, E.P., Nicholson, A.E., Korb, K.B., Wybrow, M., Zukerman, I., Mascaro, S., Thakur, S., Oshni Alvandi, A., Riley, J., Pearson, R., et al., 2022. BARD: A Structured Technique for Group Elicitation of Bayesian Networks to Support Analytic Reasoning. Risk Anal. 42, 1155–1178.
- Pearl (2009) Pearl, J., 2009. Causality. Cambridge University Press.
- Scutari (2010) Scutari, M., 2010. Learning Bayesian Networks with the bnlearn R package. J. of Stat. Soft. 35, 1–22.
- Shenvi and Smith (2020a) Shenvi, A., Smith, J.Q., 2020a. Constructing a Chain Event Graph from a Staged Tree, in: Proc. of the 10th Intern. Conf. on Probab. Graph. Models.
- Shenvi and Smith (2020b) Shenvi, A., Smith, J.Q., 2020b. Propagation for Dynamic Continuous Time Chain Event Graphs. ArXiv:2006.15865.
- Shenvi et al. (2018) Shenvi, A., Smith, J.Q., Walton, R., Eldridge, S., 2018. Modelling with Non-Stratified Chain Event Graphs, in: Intern. Conf. on Bayesian Stat. in Action, Springer. pp. 155–163.
- Silander and Leong (2013) Silander, T., Leong, T.Y., 2013. A Dynamic Programming Algorithm for Learning Chain Event Graphs, in: Intern. Conf. on Discov. Sci., Springer. pp. 201–216.
- Smith and Anderson (2008) Smith, J.Q., Anderson, P.E., 2008. Conditional Independence and Chain Event Graphs. Artif. Intell. 172, 42–68.
- Strong et al. (2021) Strong, P., McAlpine, A., Smith, J.Q., 2021. A Bayesian Analysis of Migration Pathways using Chain Event Graphs of Agent Based Models. ArXiv:2111.04368.
- Strong and Smith (2022) Strong, P., Smith, J.Q., 2022. Bayesian Model Averaging of Chain Event Graphs for Robust Explanatory Modelling, in: Proc. of the 11th Intern. Conf. on Probab. Graph. Models, pp. 61–72.
- Thwaites (2013) Thwaites, P.A., 2013. Causal Identifiability via Chain Event Graphs. Artif. Intell. 195, 291–315.
- Thwaites and Smith (2017) Thwaites, P.A., Smith, J.Q., 2017. A New Method for Tackling Asymmetric Decision Problems. Intern. J. of Approx. Reason. 88, 624–639.
- Thwaites et al. (2008) Thwaites, P.A., Smith, J.Q., Cowell, R.G., 2008. Propagation using Chain Event Graphs, in: Proc. of the 24th Intern. Conf. on Uncertain. in Artif. Intell., pp. 546–553.
- Thwaites et al. (2010) Thwaites, P.A., Smith, J.Q., Riccomagno, E., 2010. Causal Analysis with Chain Event Graphs. Artif. Intell. 174, 889–909.
- Wilkerson (2020) Wilkerson, R.L., 2020. Customising Structure of Graphical Models. Ph.D. thesis. The University of Warwick.
- Yu and Smith (2021) Yu, X., Smith, J.Q., 2021. Causal Algebras on Chain Event Graphs with Informed Missingness for System Failure. Entropy 23, 1308.
- Zhang and Poole (1999) Zhang, N.L., Poole, D., 1999. On the Role of Context-Specific Independence in Probabilistic Inference, in: Proc. of the 16th Intern. Jt. Conf. on Artif. Intell., pp. 1288–1293.