A Tale of Frozen Clouds: Quantifying the Impact of Algorithmic Complexity Vulnerabilities in Popular Web Servers
Abstract.
Algorithmic complexity vulnerabilities are a class of security problems that enables attackers to trigger the worst-case complexity of certain algorithms. Such vulnerabilities can be leveraged to deploy low-volume, asymmetric, CPU-based denial-of-service (DoS) attacks. Previous work speculates that these vulnerabilities are more dangerous in certain web servers, like Node.js, than in traditional ones, like Apache. We believe it is of utmost importance to understand if this is indeed the case or if there are ways to compensate against such problems using various deployment strategies. To this end, we study the resilience of popular web servers against CPU-based DoS attacks in four major cloud platforms under realistic deployment conditions. We find that there are indeed significant differences in how various web servers react to an attack. However, our results suggest a more nuanced landscape than previously believed: while event-based systems tend to recover faster from DoS in certain scenarios, they also suffer the worst performance degradation overall. Nevertheless, in some setups, Apache performs worse than event-based systems, and there are cloud platforms in which all the considered servers are seriously exposed to the attack. We also find that developers can harden their servers against CPU-based DoS attacks by increasing the number of server instances running in parallel. This, in turn, can lead to an increased cost of operation or a slight degradation of performance in non-DoS conditions.
1. Introduction
In a classical, distributed denial-of-service (DDoS) attack, the adversary dedicates significant resources like thousands or millions of machines, possibly as part of a botnet, to attack the target system. Recently, Cloudflare mitigated one of the largest DDoS attacks with 17.2 million requests per second that originated from over 20,000 bots111https://blog.cloudflare.com/cloudflare-thwarts-17-2m-rps-ddos-attack-the-largest-ever-reported/. In contrast, CPU-based DoS attacks can be carried away by a single adversary with limited bandwidth and computing resources, achieving a similar impact. This type of attack is enabled by an easy-to-trigger, slow computation, available on the server-side, which the attacker can trigger repeatedly. While such CPU-heavy computations can be introduced by careless developers, e.g., writing a file to disk using synchronous API in event-based systems, in recent years, we have seen an increased interest in studying algorithmic complexity vulnerabilities as a building block for CPU-based DoS attacks (Staicu and Pradel, 2018; Davis et al., 2018a, 2021a; Bai et al., 2021; Davis, 2019; Turonová et al., [n. d.]; Barlas et al., 2022). These types of vulnerabilities enable an adversary to trigger the worst-case performance of a target algorithm by providing carefully crafted inputs.
One example of algorithmic complexity vulnerability is regular expression denial of service (ReDoS), where the attacker exploits a backtracking-based algorithm in the regular expression engine by crafting adversarial inputs. For example, it takes 15 seconds for Node.js engines to match against a sequence of 30 characters (Staicu and Pradel, 2018). Practitioners rely on simple rules of thumb to judge ReDoS: if a regular expression can be used to cause a one-second slowdown, using reasonable-sized input, it is considered vulnerable222Node Security Project considers every regular expression that can be used to trigger a slowdown larger than one second as vulnerable.. There is an extensive body of recent work studying this security problem (Ojamaa and Düüna, 2012; Davis et al., 2017; Staicu and Pradel, 2018), showing that it affects web applications in production (Staicu and Pradel, 2018), and proposing tools for detecting and remedying it (Davis et al., 2021b; Wüstholz et al., 2017; Bai et al., 2021; Liu et al., 2021; Shen et al., 2018).
However, we believe that the relation between algorithmic complexity vulnerabilities and CPU-based DoS attacks is not fully understood by the community, and that there are a lot of speculations, unsupported by solid empirical evidence. First, both researchers, e.g., Davis et al. (Davis et al., 2017) and Staicu and Pradel (Staicu and Pradel, 2018), and practitioners333https://snyk.io/blog/redos-and-catastrophic-backtracking/444https://nodejs.org/en/docs/guides/dont-block-the-event-loop/ claim that algorithmic complexity vulnerabilities, and ReDoS in particular, are more severe in asynchronous, event-based systems than in traditional web servers. Supposedly, this is due to the single-threaded nature of these runtimes. Second, practitioners22footnotemark: 2, but also related academic work (Davis et al., 2018b; Staicu and Pradel, 2018), mostly consider payloads larger than one second as problematic. More generally, Davis et al. (Davis et al., 2018b) postulate that users can set a clear timeout threshold for slow operations, below which requests are considered harmless. We challenge these assumptions by studying the resilience of modern web servers to CPU-based DoS attacks, under realistic deployment conditions.
To the best of our knowledge, we are the first to perform a comparative study of the servers’ landscape to assess the impact of algorithmic complexity vulnerabilities in widely-used web servers. We believe that our measurements can help the community better understand these types of vulnerabilities, and at the same time, shed light on an unexplored tradeoff involved in choosing the design of web servers. Specifically, we answer the following research questions:
-
•
Q1: How do different web servers deployed in the cloud perform under CPU-based DoS attacks? Are some servers more exposed to this attack than others? (§4.3)
-
•
Q2: Is it possible to mitigate CPU-based DoS attacks using different deployment strategies? (§4.4)
-
•
Q3: Can slowdowns smaller than one second be leveraged for low-bandwidth DoS attacks against web servers deployed in the cloud? (§4.5)
Answering these questions brings up a crucial methodological challenge: how can we uniformly set up different servers to observe them under the same attack so that no particular server faces unjustified advantages or disadvantages over the others. This challenge stems from the availability of diverse deployment strategies such as different hardware, load balancers, intrusion detection systems, etc. All these different choices may have a significant effect on the performance of the server, influencing our measurement study.
We address this challenge by using platform-as-a-service (PaaS) solutions to deploy testbeds for our study. PaaS platforms provide a ready-to-use software and hardware stack with minimal configuration options, i.e., developers’ only tasks are to provide the server’s source code and choose a pricing model. In this way, we use a fair testbed, ensuring that we do not inadvertently advantage certain systems over others, and at the same time, study straight-forward deployment strategies available to developers.
Underlying our study, there is a novel methodology for quantifying the impact of denial-of-service attacks. We benchmark different web servers under simulated attacks using the most popular benchmarking tools used by the practitioners and proposed two new metrics, such as Attacker’s gain and Throttled time to summarise the effects of CPU-based DoS attacks under different attack scenarios. We apply this methodology to both the considered setups and compare the response of different systems to CPU-based DoS attacks. It is worth noting that we use our newly proposed metrics to summarize and combine multiple attack scenarios for quantitative comparison. Both metrics are calculated from the throughput, and together with latency, they portray the effects of CPU-based DoS attacks on different web servers.
Our results reveal a more complex picture than previously believed. Even though event-based web servers like Node.js are significantly more vulnerable to CPU-based DoS attacks than the other considered systems in most cases, the difference between servers is significantly reduced when they are deployed under constrained conditions, i.e., on the free tier. Moreover, we observe that in several cloud setups, the performance of event-based systems is comparable, or even better, than Apache’s performance.
Additionally, we show that developers have multiple configuration options to increase the resilience of their single-threaded runtimes to CPU-based DoS. They can increase the number of preforked workers, an option available in both the considered event-based servers. Doing so significantly reduces the susceptibility of these systems to CPU-based DoS attacks, but it may affect the server performance in non-DoS conditions. They can also deploy multiple powerful machines, but that will also incur additional costs. Concretely, we show that by carefully configuring this parameter, one can achieve an attack response for Node.js comparable to that of multi-threaded systems like Tomcat.
Finally, our measurements are a warning to the community to also consider sub-second slowdowns as potential vulnerabilities. We show that a 50 milliseconds slowdown can be weaponized against well-configured systems in the considered cloud setups.
In summary, this work makes the following contributions:
-
•
We provide empirical evidence about the fundamental differences between the responses of different web servers to CPU-based DoS attacks. We find that event-based servers tend to exhibit a very sudden drop in quality of service, while one-thread-per-client ones suffer more gradual performance degradation.
-
•
We discuss developers’ options for configuring their cloud applications to be more resilient against CPU-based DoS attacks. We propose further ways to reduce the differences between server architectures.
-
•
We show that the threshold used by practitioners for judging algorithmic complexity vulnerabilities is too high, and we advocate for case-by-case consideration.
2. Background
In this section, we introduce typical web server architectures used by practitioners, and the platform as a service paradigm.
2.1. Web server architectures
During the years, many architectures were proposed for building web servers, each promising the best performance. It is beyond the scope of this paper to survey all of them, and thus, we limit our discussion to the most important classes, highlighting popular servers implementing them.
One thread per client
In this architecture, each incoming request gets mapped to a single thread. The threads are sometimes managed by a thread pool, to avoid the high cost of spawning new threads on demand. The main advantage of this architecture is its simplicity, while the main disadvantage is poor performance in the presence of long-lasting requests. This architecture is the most widely adopted one, with prominent examples including Apache555https://httpd.apache.org/docs/2.2/mod/worker.html and Tomcat666https://tomcat.apache.org/tomcat-7.0-doc/jdbc-pool.html.
One process per client
In this architecture, each request is mapped to a single process. A pool of processes is often spawned when the server starts and is sometimes referred to as preforked workers or processes. The advantages of this architecture are a more clear separation of user requests than in the previous architecture and the avoidance of thread-safety bugs. The most popular server implementing this strategy is Apache in prefork mode777https://httpd.apache.org/docs/2.4/mod/prefork.html.
Single-threaded, async I/O
Managing the life cycle of processes or threads, and context switching between them, as proposed by previous architectures, comes at a high cost. Hence, in recent years, we have seen an increased interest in single-threaded, event-based architectures. In this case, the server handles all the requests in a single thread and offloads slow computation, e.g., input/output operations, to a thread pool. The most widely adopted server implementing this mode of operation is Node.js.
Preforked workers, async I/O
Practitioners also use a hybrid between two of the architectures above: multiple single-thread, event-based workers are preforked on the same machine, and incoming requests are distributed to the worker with the lowest load at each moment. Gunicorn888https://github.com/benoitc/gunicorn for Python uses this default mode of operation, and recently, Node.js introduced the Cluster API to enable it as well. In this paper, we sometimes use the term event-driven architectures to refer to the last two server architectures described above.
Light threads
A different approach for reducing the overhead caused by multiple threads is multiplexing several requests on the same thread. This can be done using so-called light threads, e.g., goroutines. A prominent server example of this architecture is the built-in Go server (benoitc, 2022).
As seen from the examples above, modern web servers sometimes offer configuration options to choose between different architectures. For example, Apache offers most of the above modes of operation999https://en.wikipedia.org/wiki/Apache_HTTP_Server#Performance.
2.2. Platform as a service
Platform as a service (PaaS) is a cloud computing paradigm in which developers seemingly deploy web services as software bundles without worrying about the underlying infrastructure. The PaaS platform handles the setup of the actual machine and its software stack, and provides ready-to-use instances for deploying the bundles on.
PaaS paradigm promises several benefits: it allows developers to concentrate on writing code instead of spending time managing the infrastructure, and it reduces costs when compared to the more traditional modes of operation. Instead of providing an entire physical machine for each user, in the PaaS case, a single machine can host multiple virtual ones, each running a PaaS instance allocated to a different user.
The main drawback of the PaaS paradigm is the loss of control for developers. Most of the configurations, such as which operating system version or load balancer to use, are not under the developer’s control but decided by the platform. This perceived drawback makes PaaS systems an attractive target for our measurements study: they enable us to easily deploy the web servers we want to study in the cloud and observe their behavior under realistic deployment conditions.
3. Methodology
As discussed in introduction, the two core challenges for our measurements study are: how to simulate equivalent attacks against different web servers and how to measure the attack’s impact. Below, we discuss in detail our novel methodology that tackles these two challenges. We first define the attacker’s capabilities and how a DoS attack affects the users of a system (§3.1). We then show how to specify reusable CPU-based DoS attacks that can be simulated against multiple systems (§3.2). Finally, we discuss a set of metrics to be collected in the empirical study (§3.3).
3.1. Threat model
We assume that two users are interacting with a system simultaneously: the attacker and the victim. The attacker’s objective is to reduce the server’s quality of service by sending several well-crafted requests to the server. In the ideal case, the victim should not perceive any degradation of the server’s quality of service. Using this intuition, we can define a system’s resilience against denial-of-service attacks:
Definition 3.1.
Let an observer perform two sets of measurements: under attack conditions, and under non-attack conditions. We say that a system is DoS-noninterferent, if given the pair , the observer cannot reliably choose the measurements done under attack conditions.
DoS-noninterference is a noble goal for a system, but we notice that if the attack is powerful enough, most systems do not achieve it in practice. Hence, an observer can obtain information about the server’s performance by measuring certain properties of the served requests, e.g., response time. We propose quantifying the server’s performance degradation by repeatedly observing the difference between the measurements under attack () and non-attack () conditions.
3.2. Attack specification
We remind the reader that our objective is to simulate equivalent CPU-based DoS attacks against multiple systems. Thus, we need to carefully control a set of attack parameters.
Payload size
Each request made to a web server consumes a certain CPU time budget on the server. Hence, for an individual request, we define the payload size as the CPU time consumed on the server-side for processing that request, and we measure it in milliseconds. Measuring this parameter is not trivial, and it is highly dependent on the exact analyzed system. In our experimental setup, we describe how we precompute this value for the considered systems.
Bandwidth-bound attacker
We assume an attacker cannot send arbitrary many requests to a server. This is because production-ready applications usually deploy some form of rate-limiting or intrusion detection systems that constrain the attacker’s capabilities. Hence, we limit the number of requests sent by the attacker to an upper bound value called attack’s bandwidth, and we measure it in requests per second.
Attack window
We assume the attacker sends malicious requests in a limited time interval called attack window, which we specify in seconds. Shan et al. (Shan et al., 2017) show that denial-of-service attacks consisting of short bursts, followed by longer cool-down periods are effective against web applications. In this work, we aim to study the system’s behavior both during the attack and in the recovery phase.
Using the above parameters, we define a CPU-based denial-of-service attack as the tuple , where is the payload size, is the bandwidth, and is the attack window. We argue that by carefully controlling these parameters, one can instantiate equivalent attacks against different systems.
3.3. Measurements
As discussed in Section 3.1, we propose measuring the server’s performance remotely. More precisely, the observer machine performs several requests and records relevant parameters for the served responses. While this way of measuring may appear noisy at first, we argue that it reflects the real performance degradation of a system, as perceived by the end-user. We believe that realistic measurements should include all the factors that can influence the user experience, beyond the actual throughput measured on the server’s end, e.g., load balancers, firewalls, network caches. This is also in line with the mode of operation of popular benchmarking tools used by developers. In fact, we build our measurements infrastructure on top of wrk2101010https://github.com/giltene/wrk2, a widely-used open-source benchmarking tool for web applications. We describe below the most important measurements we collect and a couple of relevant parameters for our study.
Measurement rate
We call the number of measurement requests sent by an observer in a given time interval, measurement rate, and we measure it in requests per second. To avoid negatively influencing the measurements, the observer must strive to send measurement requests with minimal CPU-load and avoid caching, e.g., by appending a random value to the request. They must also ensure that the sum of the measurement rate and the attack’s bandwidth is below the throughput of the server in non-attack conditions. Otherwise, instead of performing a measurements study, one would exhaust the bandwidth of the server.
Measurement window
The time interval in which the observer sends measurement requests is called measurement window , and we measure it in seconds. The measurement window should ideally include the attack window but not perfectly overlap. That is because we want to observe the server’s behavior in non-attack conditions, during the attack, and in the recovery phase.
Throughput
We call throughput the number of requests an observer receives back from the server in a given second. We note that in the DoS-noninterference conditions, and when the processing time for a request is constant, the throughput should be equal to the measurement rate, which we sometimes call expected throughput . If these conditions are not met, the expected throughput should be calculated by repeatedly observing the server’s throughput in non-attack conditions. We point the reader’s attention to the fact that both and are discrete functions whose domains are limited to seconds in the measurement window.
Latency
For a given request, we call latency the time interval between the moment it was sent from the observer’s machine until its response was received back. We note that both latency and throughput have a slightly different meaning than previously defined in the literature: instead of measuring these two values on the server-side, we measure them at the observer’s end. Hence, they do not directly measure the performance of the server on all the served requests, but only on the ones served to the observer. We argue that this is a more adequate way to measure a server’s performance, in line with how practitioners benchmark their servers.
Attacker’s gain
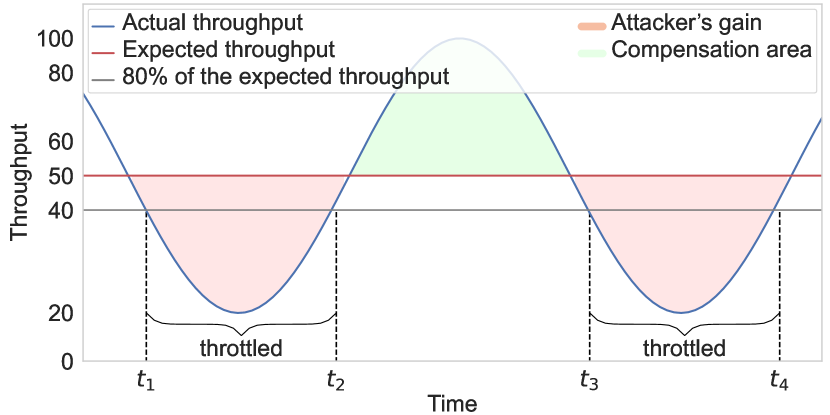
The two previously discussed metrics are enough for analyzing the behavior of a single server under a single attack. We observe that multiple benchmarking tools used by developers output these two values, often in the form of time series. However, since in our study we aim to observe the effect of certain parameters on the attack’s performance, we need to define some metrics that can capture the server’s performance degradation in a single scalar value. Without these, one has to look into thousands time series graphs to assess the impact of an attack in different settings over multiple runs. Thus, for a large-scale comparison study that we aim to present in this work, defining new metrics is essential to summarise the degradation of the server’s quality of service under different attack scenarios. Let us consider the actual server’s throughput (blue line) in Figure 1, and the expected throughput (red line) as 50 requests per second. As can be observed, the throughput seriously degrades reaching less than 20 requests per second for some time, followed by a compensation phase in which more requests are served than the expected throughput, and finally going through a second degradation phase in which the throughput goes below 40 requests per second. We assume that the depicted throughput graph is caused by two adjacent attacks. We propose calling the red area in the figure Attacker’s gain. This area shows the deviation of the actual throughput from its expected value, and it captures the perceived degradation in the quality of service, as measured by the observer. For example, at moment , the observer expects to receive 50 requests back from the server, but only 40 are actually received. Below, we introduce a rigorous definition for this intuition.
Given the expected throughput of a server, and its actual throughput under attack , we compute two polynomials and that interpolate the values in and , respectively. We define the attacker’s gain as:
| (1) |
Where is the actual throughput upper bounded by the expected throughput :
| (2) |
Without bounding , the difference between the two quantities will often be zero, because servers tend to recover after the attack stops. More precisely, if there are no requests dropped by the server, then . That is because some requests are served after a long time, but served nevertheless, i.e., the ones in compensation area in Figure 1.
Throttled time
Attacker’s gain captures the attack’s effect on the throughput over time, but it does not capture how large the attack’s impact is in its worst moments. That is, two areas of the same size can have very different shapes: one that is very high in amplitude and one that is rather stretched over a long period. Thus, we propose a metric that quantifies the amount of time the server’s throughput was below a given threshold. By computing this metric for different thresholds, we can see both for how long the attack’s effect lingered and how bad the peak of the attack was. In general, we consider the threshold as a percentage of the expected throughput.
Given a throughput and a percentage , we define throttled time as:
| (3) |
We say that ”the throttled time at is ”. For example, in Figure 1, the throttled time at 80% is , i.e., in those time intervals the throughput is below 80% of the expected throughput.
We warn the reader about the dangers of using a single metric to quantify something as complex as servers’ performance degradation. Looking at any of the metrics above, in isolation, is not sufficient. For example, analyzing Attacker’s gain, without complementing it with throttled time or latency, may lead us to false conclusions. Hence, in the results section, we discuss multiple metrics at once.
4. Empirical study
In this section, we present a measurements study performed using the described methodology. We first introduce our setup (§4.1), describe our validation process and results using local machines (§4.2), and present the results for the cloud experiments (§4.3). We then explore different ways to increase the server’s resilience to CPU-based DoS attacks (§4.4), and investigate whether payloads smaller than one second can be used for a successful attack (§4.5). Finally, we discuss the implications of our findings (§4.6).
| CPU | Memory | |||
| Free | Pro | Free | Pro | |
| AWS | 1 vCPU | 1 vCPU | 0.5 GB | 4 GB |
| Azure | 1 vCPU | 1 vCPU | 1.75 GB | 3.5 GB |
| Digitalocean | 1 vCPU | 1 vCPU | 512 MB | 1 GB |
| Heroku | 1 vCPU | 1 vCPU | 512 MB | 512 MB |
4.1. Study’s setup
Local setup
For our local experiments, the web servers are hosted on a MacBook Pro machine, running macOS Big Sur on Intel Core i7 6-Core CPU with 2.6 GHz and 16 GB RAM. We consider five web servers for our study: Apache, Tomcat, Node.js, the built-in Go web server, and Django’s development server. We use the out-of-the-box settings for all servers. The local experiments are intended to give us a cheap testing bed for our methodology, where we can quickly prototype a new hypothesis. We believe that these setups are only rarely used in production by inexperienced developers.
Cloud setup
We select the following PaaS providers for our study: AWS Elastic Beanstalk, Azure Web Apps, Heroku, and DigitalOcean App Platform. These four platforms are the most popular ones, controlling more than 60% of the PaaS market share111111https://www.statista.com/statistics/478119/paas-vendor-market-share-ranking-worldwide/. We study three configurations for each platform: a free instance, a professional instance, and two professional instances with a load balancer. Table 1 lists all the configurations used in the study, as detailed on the platforms’ websites. As the reader may notice, there are significant differences in the hardware used by the platforms. We argue that this is beneficial for our study, since it allows us to observe the given systems under multiple, realistic deployment conditions. In the cloud setup, we study the same servers as in our local setup, except for Django, for which we study Gunicorn, which is recommended by the community.
Lightweight web application
To study the given web server, we create a simple web application with three endpoints: (i) a measurement endpoint that accepts a single parameter and returns it as response, (ii) a vulnerable endpoint that simulates an algorithmic complexity vulnerability, i.e., an input-dependent slow computation, and (iii) a calibration endpoint that is used in the setup phase to fix the attack parameters. We claim that this very simple application allows us to analyze the performance of the underlying web server in the case of CPU-heavy requests.
For implementing the vulnerable endpoint, we use modular exponentiation () to simulate the presence of a vulnerability. Modular exponentiation is very common in encryption and key generation, and it is computationally expensive. For example, in our local machine, it takes 100 ms to decrypt a 2,000 characters message that is encrypted with a 7,680-bits key, using node-rsa121212https://www.npmjs.com/package/node-rsa library. We fix and to two large primes and use as the payload in our requests. It is worth noting that in real systems, our specified slowdowns can be induced in many ways e.g., vulnerable regular expression engine, synchronous file or database operations. Thus, our methodology and measurement study is independent of the actual vulnerability used to trigger the slowdown.
Before the actual experiment, we perform payload calibration for each system: for a target slowdown, e.g., 100 ms, we search for the value that triggers a CPU-computation of that length. Because of the difference in underlying hardware or software, we need different values to incur the same slowdown in the same server, hosted by different providers. For example, while it takes to cause a one-second slowdown in AWS for Node.js, in DigitalOcean, the value is , for the same slowdown and server. Since this process is crucial for simulating equivalent attacks against target systems, we pay special attention to ensuring the chosen value triggers the desired slowdown: (i) we perform precise measurements on the server-side, (ii) for each candidate value, we repeat the experiment ten times and compute the average computation time. To avoid the effects of caching, each request contains a random query parameter.
Simulate attack
For most of the experiments, we use a five seconds attack window, we set the attack’s bandwidth to 100 requests per second, and we vary the payload size from few milliseconds to one second. The measurement rate is 100 requests per second, and the measurement window is 60 seconds. We believe these are sensible parameter choices that enable us to study a short, low-bandwidth burst that could be used in on-off attacks, as described by Shan et al. (Shan et al., 2017). Moreover, it allows us to observe the server’s behavior before, during, and after the attack. For all of our experiments, we simulate the attack five times and present aggregated results.
4.2. Local validation
Before applying our methodology to PaaS platforms, we first test it in our local setup. We do this for two reasons: (1) to verify our measurements methodology in an isolated and controlled environment where the influence of external factors is low, e.g., network latency, (2) to confirm that there are indeed worth-reporting differences between web server architectures. This section explains our findings in the local setup and shows how we utilize the newly-proposed metrics for comparing the response of different servers to CPU-based DoS attacks.
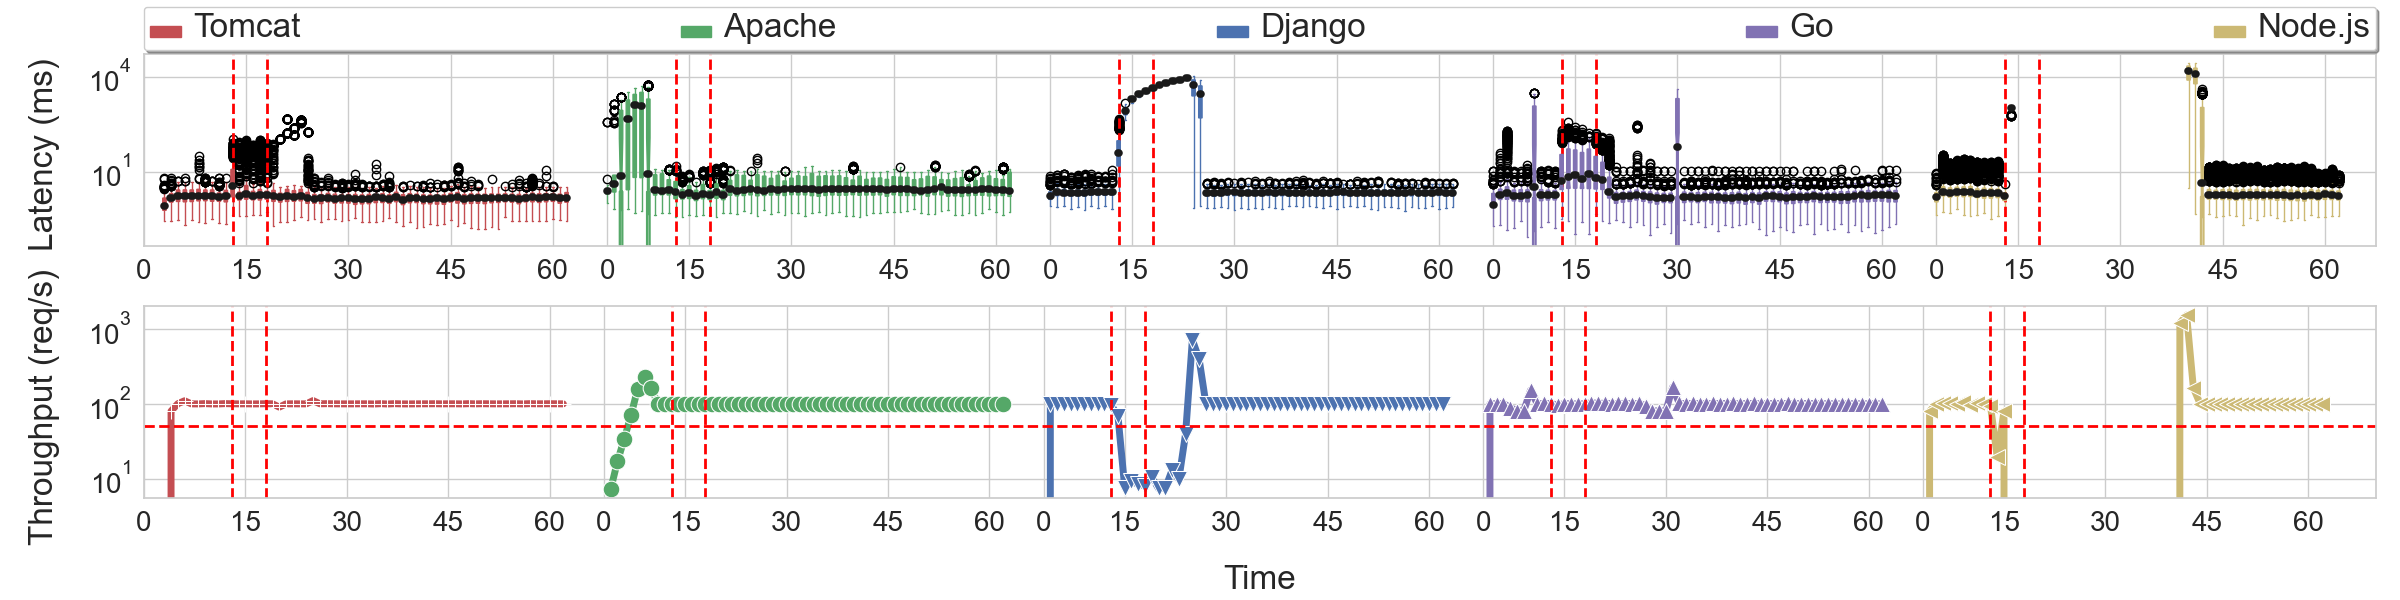
Let us first analyze the servers’ response to a single attack, in our local setup: . Figure 2 shows the throughput and latency for all the considered servers before, during, and after the attack. We depict the attack between vertical dashed lines.
The first striking observation is that for Node.js, it is possible to cause serious damage to the server’s performance by using such a small payload. Even though the server starts serving requests eventually, it takes almost 25 seconds for the latency and throughput to return to the expected level. We remind the reader that our attack window is only five seconds, but its effect lingers for 25 seconds. As seen in the figure, Django also exhibits this behavior, albeit less severe: the attack’s effect is visible for slightly longer than ten seconds. However, the server continues to serve requests during this time, but at a lower rate. We believe that the difference between the two servers is because Django uses four worker threads, while Node.js uses a single-process event loop.
In contrast, the other considered systems show only minor performance deterioration: the latency increases slightly during the attack for Go and Tomcat, but the degradation is larger for Go due to a higher median and larger inter-quartile distance. Apache exhibits only a minor effect, i.e., the number of outlier requests with latency higher than average is slightly increased during the attack. However, before the actual attack, Apache goes through a warm-up phase, in which its performance is lower than that of other servers.
Now, let us illustrate how we propose to use our metrics to depict a server’s performance degradation without the need to analyze time series, like above. We compute an Attacker’s gain (§3.3) of 9, 0, 1,276, 61, and 2,603 for Tomcat, Apache, Django, Go, and Node.js, respectively. This is consistent with the discussion above: Node.js and Django have the most serious drop in throughput, while the others barely have any reduction. To interpret a concrete Attacker’s gain value like 1,200 we must imagine the surface it represents, e.g., it can depict a drop in throughput of 40 points for 30 seconds, or a drop of 100 points (server completely inactive) for 12 seconds. We note that the theoretical maximum for Attacker’s gain in this experiment is 5,000, i.e., expected throughput is 100 requests per second, and measurement window after the attack starts is 50 seconds.
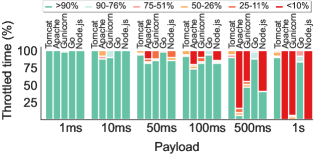
We also measure a Throttled time (§3.3) at 50% of zero, zero, ten, zero, and 26 seconds for Tomcat, Apache, Django, Go, and Node.js respectively. This, again, is aligned with the discussion above: for more than 25 seconds the throughput of Node.js is low, while for Django that is the case for 10 seconds. In this particular experiment, the Throttled time is more or less aligned with the drop in gain, but later in this section, we discuss cases when this is not the case. These two metrics do not suffice to cover all the complexities of the previous discussion of Figure 2, and we need to complement our high-level view with information about request’s latency, e.g., what is the typical, or maximum latency.
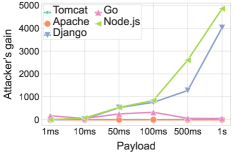
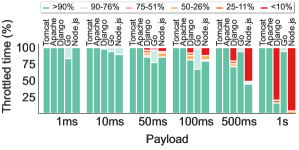
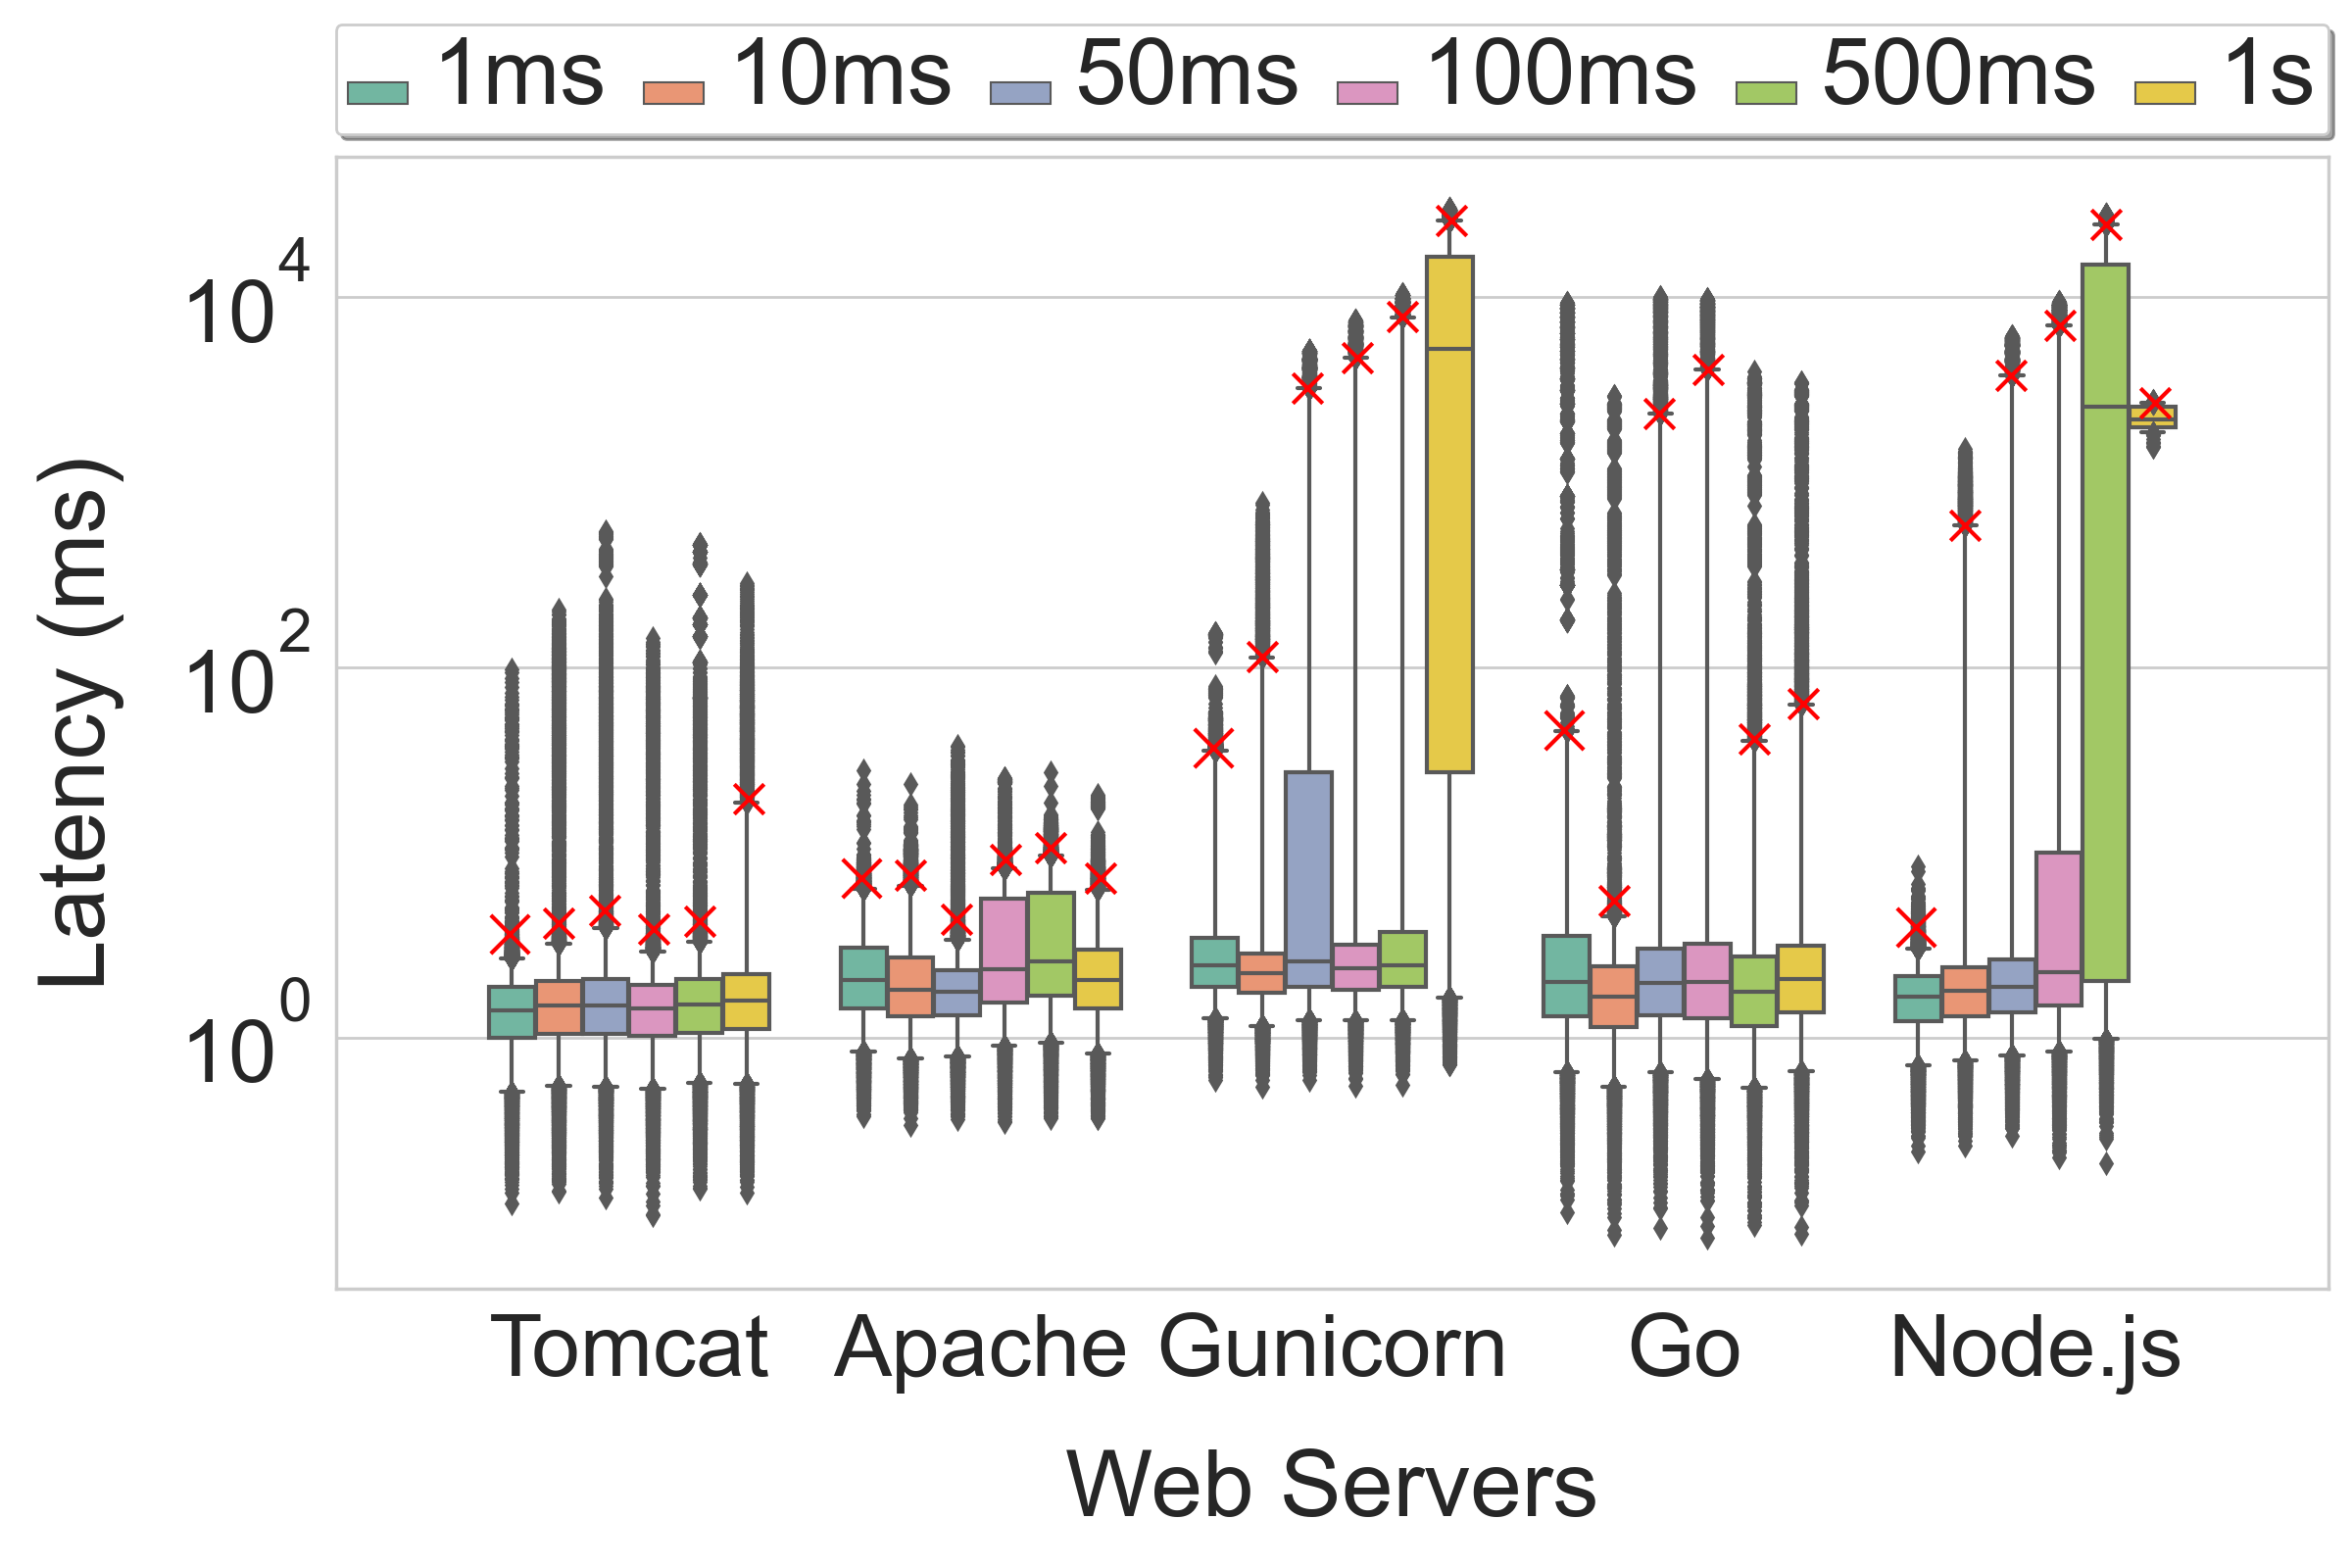
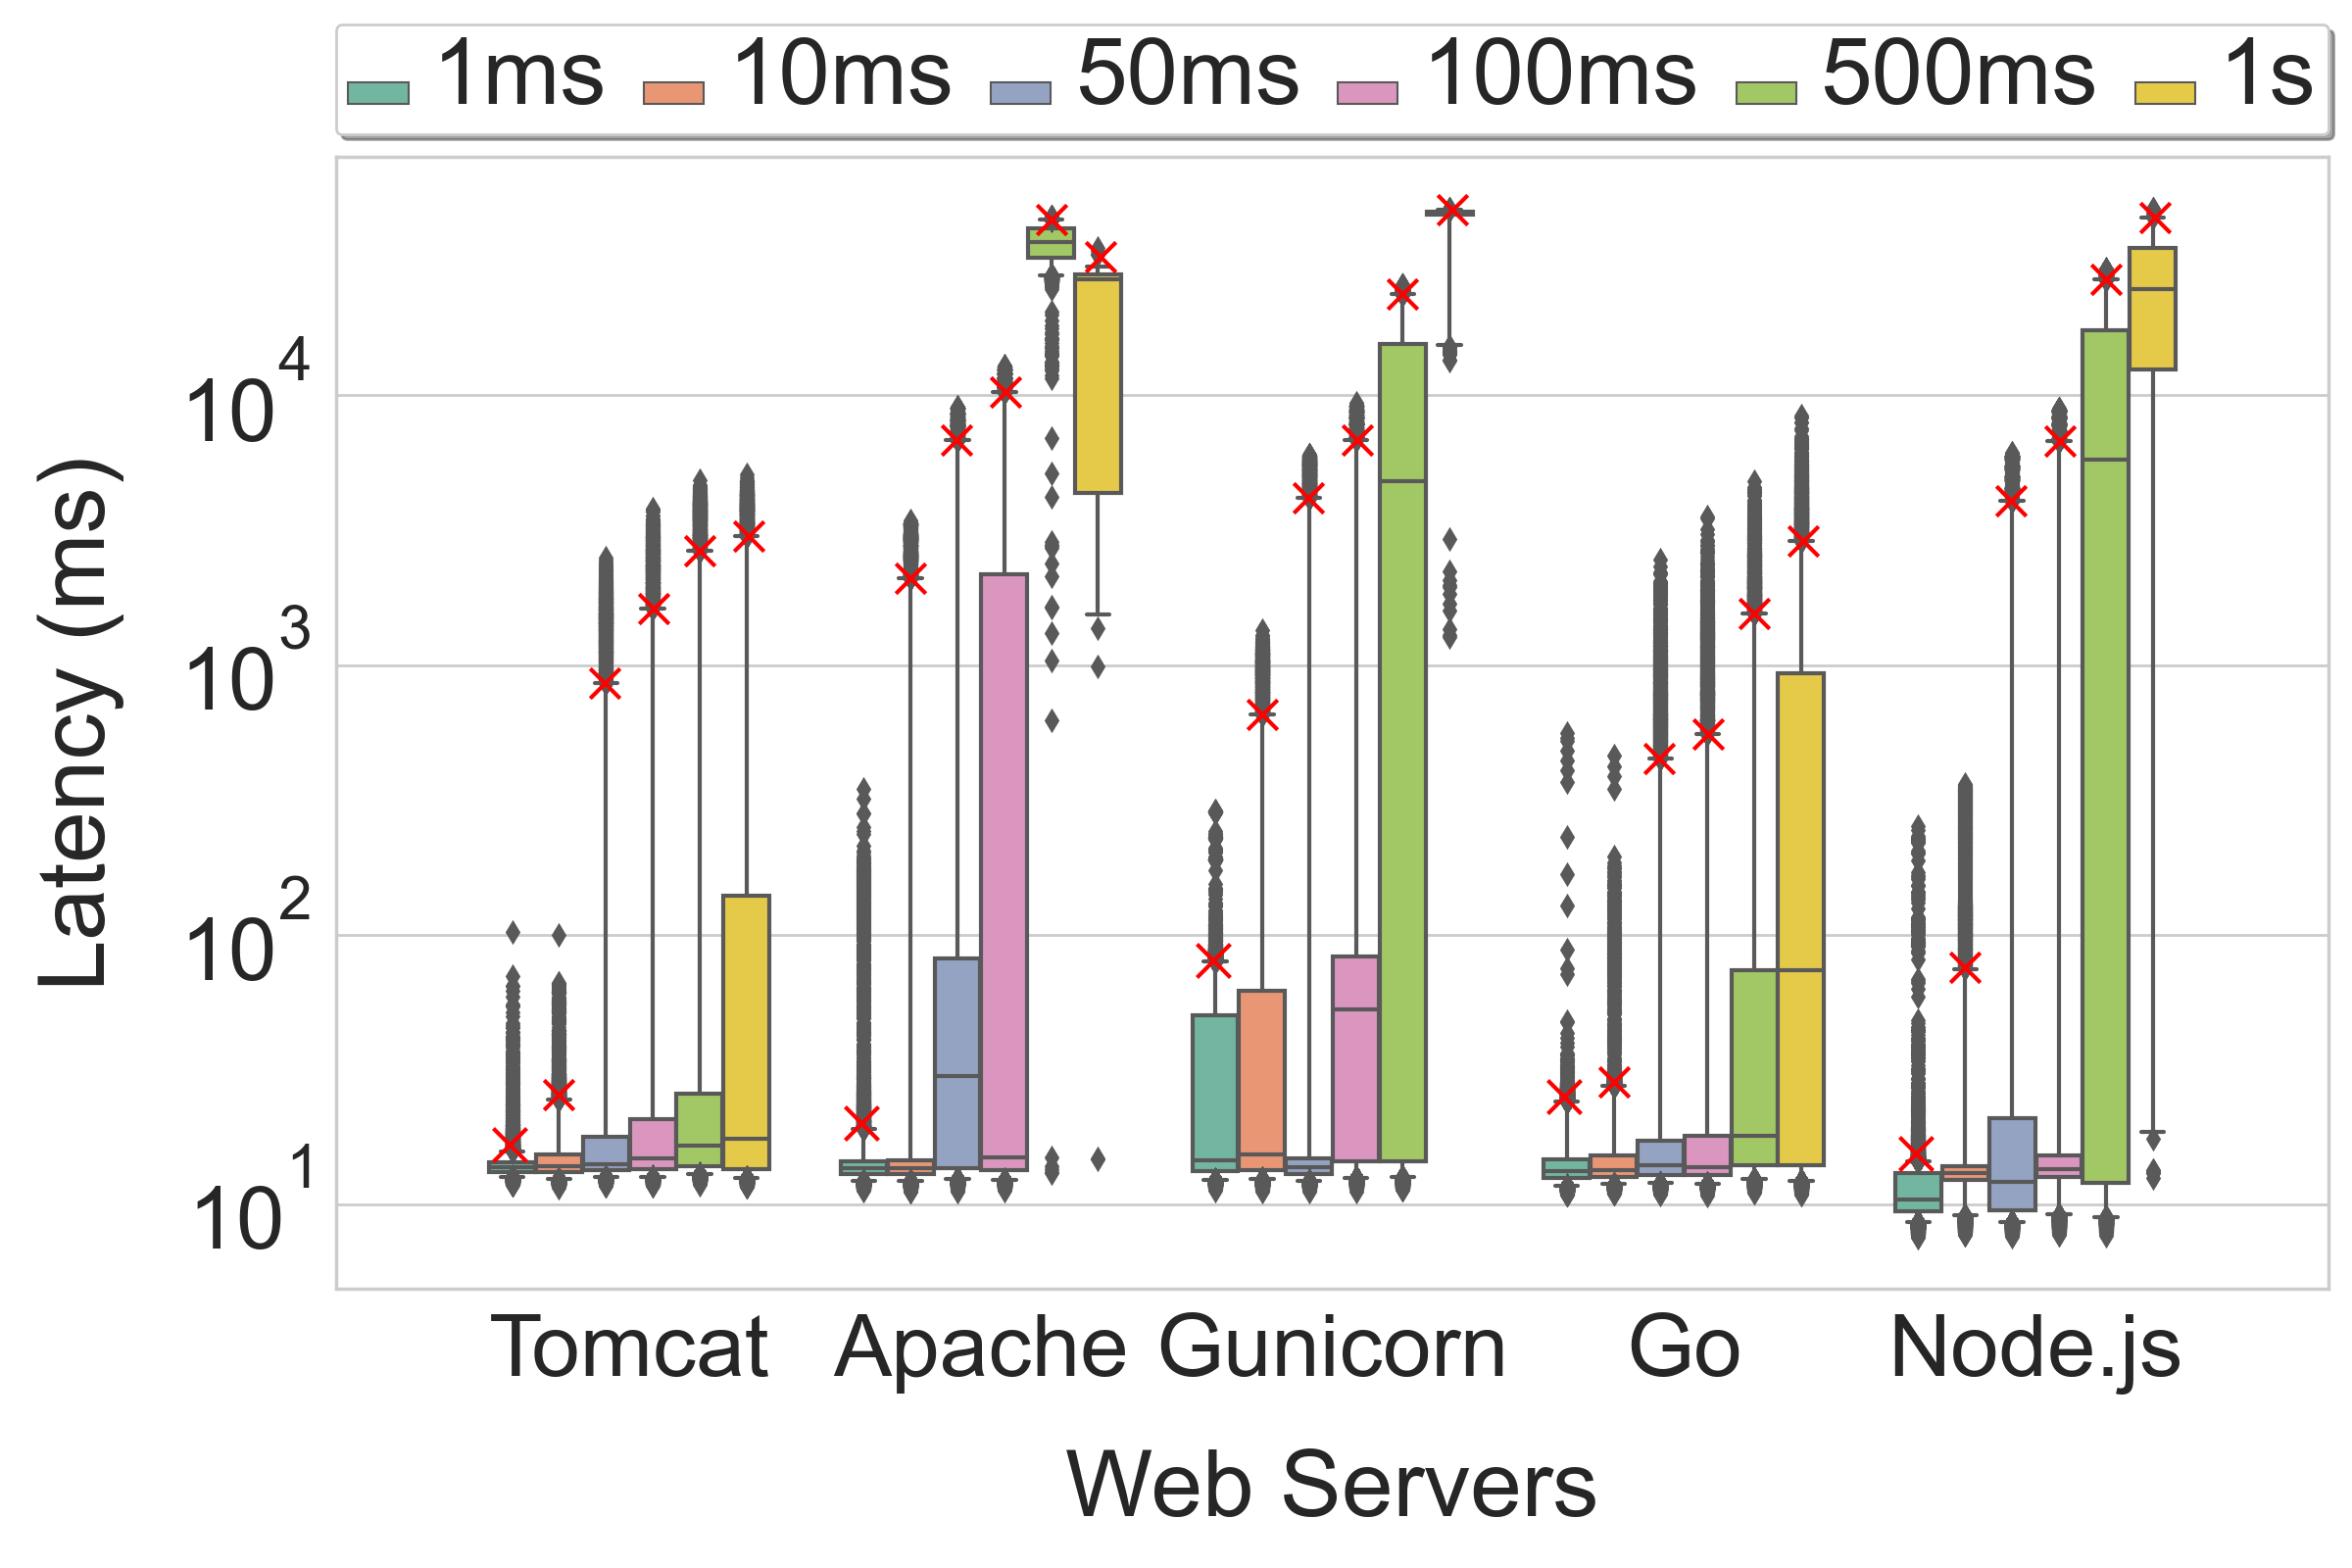
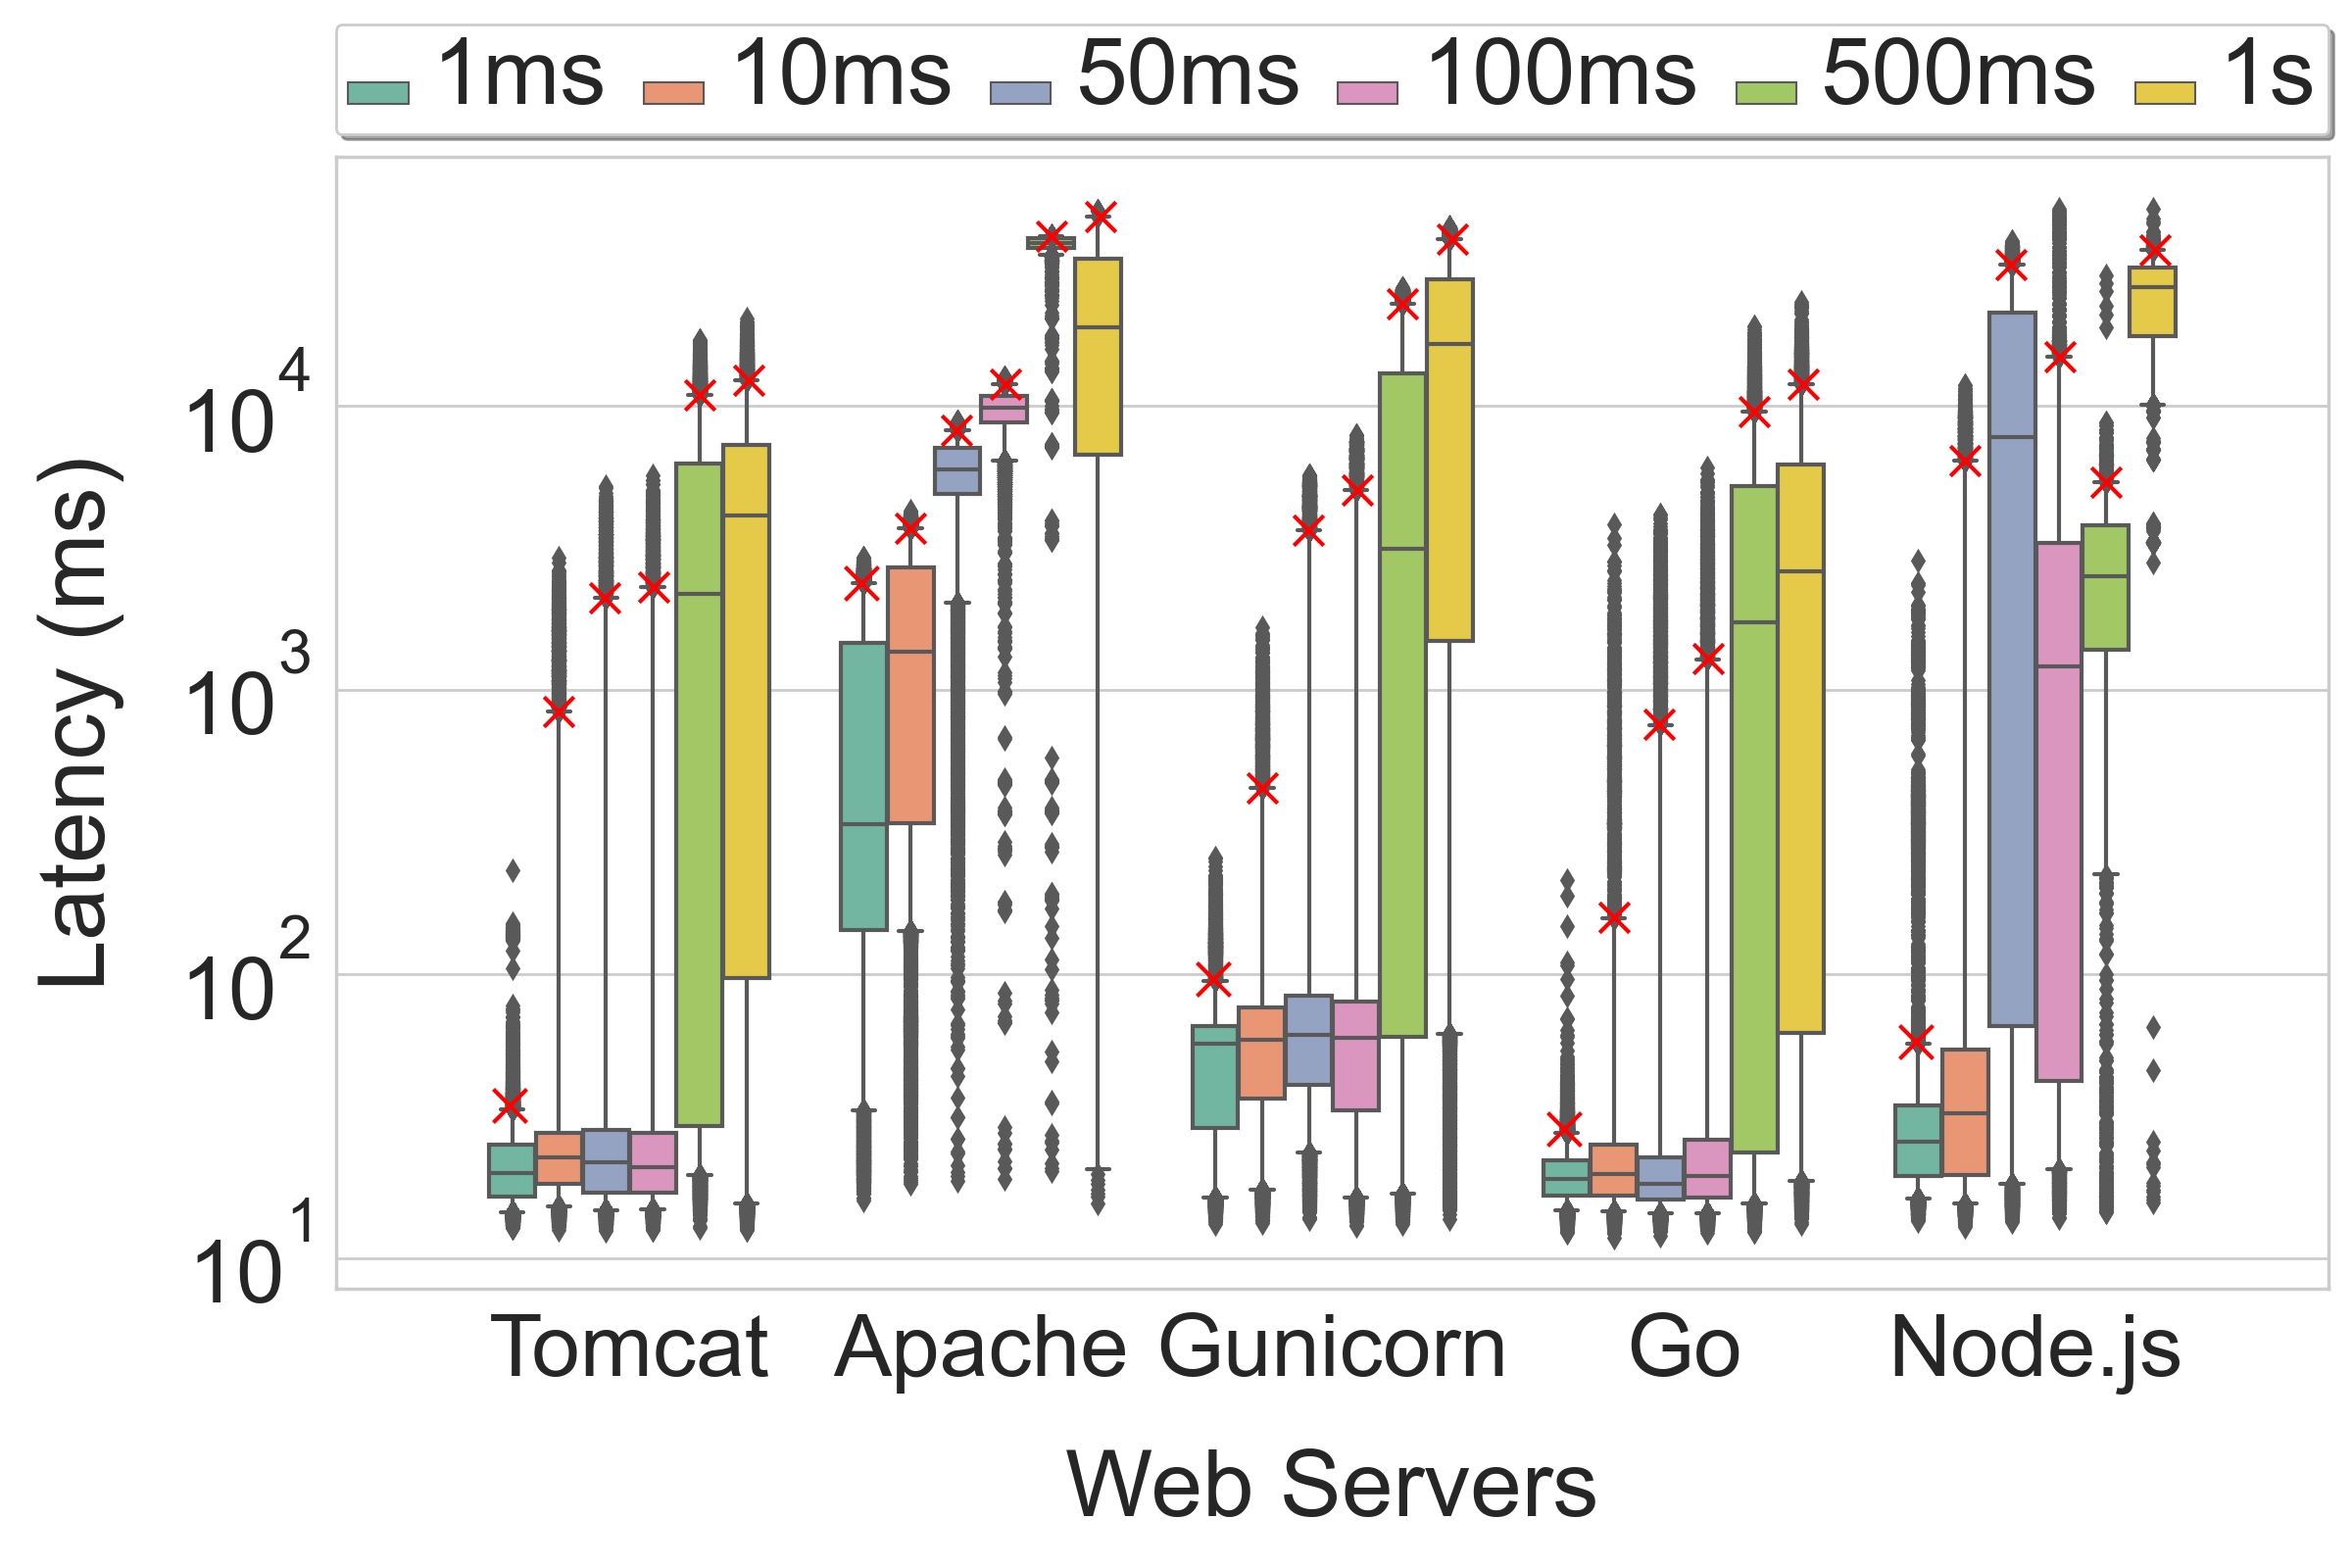
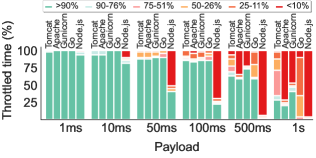
Let us now consider the ”500ms” data points in Figure 3. They depict the same experiments as Figure 2, but in a more condensed form. They show that the Attacker’s gain is the largest for Node.js and Django, as well as the Throttled time, showing several seconds with very reduced throughput, i.e., less than 10% of the expected throughput. The result also shows that for Django, Node.js, and Go there are several requests with more than a few seconds slowdown, but that for Node.js, this effect is the most visible, i.e., the median request takes few seconds to be served, as part of the compensation area consisting of the large spike in Figure 2. We conclude that by analyzing correlated metrics like the above, one can characterize the general performance degradation of a server without the need to look at hundreds of throughput and latency graphs.
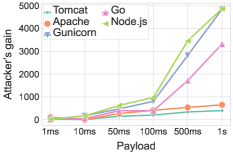
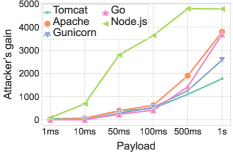
Let us now consider the entire Figure 3(a), showing the effect of increasing the payload size on the performance of the server. We observe a superlinear increase in gain for the event-driven architectures but no noticeable increase for the other architectures. By increasing the slowdown from 500ms to 1s, it is possible to grow the Attacker’s gain by 342% and 214% in Node.js and Django, respectively. When analyzing the Throttled time, we see again an increase in the time in which the server performs very poorly (10% of the expected throughput). To our surprise, the transition between the state in which the server performs close to the expected throughput to the state in which it performs very poorly is very sudden. We barely observe any intermediary states for Django and Node.js. On the contrary, for Go, we see a slight degradation in performance that appears sporadically during the experiments, and no measurable change in Throttled time for Tomcat and Apache. When analyzing the latency plot, in Node.js and Django, we observe a consistent increase in latency from small payloads to large ones. The median latency increases from 1.7ms to 16.1s for Node.js, while for Django, it goes from 2.4ms to 5.2s from the smallest payload to the largest one. This value only increases by 12% for Tomcat for the same payloads. The percentile latency also increases from 3.3ms and 35ms to 24s and 25s for Node.js and Django respectively, which is denoted by the red cross (x) in Figure 3(c). Go also exhibits an increase for outlier requests: for one-second payloads, there are 252 requests that take more than one second, while for Apache and Tomcat, there are none. Such slow requests were considered security-relevant by prior work (Shan et al., 2017).
On the one hand, our results so far confirm the assertion made by previous work: in their out-of-the-box setup, event-based systems are more vulnerable to CPU-based DoS attacks than traditional architectures. On the other hand, payloads as low as 100ms can be used to make a server inactive for several seconds, disproving the hypothesis that there is a special threshold below which CPU-heavy payloads are inoffensive. Now let us proceed to study more realistic setups.
4.3. Q1: Differences in the cloud
| AWS | Azure | Digitalocean | Heroku | |||||
| Throughput | Latency | Throughput | Latency | Throughput | Latency | Throughput | Latency | |
| Tomcat | 0.00 ± 0.00 | 0.11 ± 0.05 | 0.01 ± 0.04 | 0.07 ± 0.11 | 0.01 ± 0.04 | 0.23 ± 0.09 | 0.03 ± 0.04 | 0.06 ± 0.05 |
| Apache | 0.01 ± 0.01 | 0.30 ± 0.35 | 0.04 ± 0.18 | 0.06 ± 0.03 | 0.02 ± 0.02 | 0.48 ± 0.08 | 0.04 ± 0.05 | 0.04 ± 0.03 |
| Gunicorn | 0.01 ± 0.01 | 0.22 ± 0.14 | 0.01 ± 0.02 | 0.15 ± 0.09 | 0.00 ± 0.00 | 0.47 ± 0.04 | 0.01 ± 0.01 | 0.09 ± 0.08 |
| Go | 0.02 ± 0.05 | 0.13 ± 0.06 | 0.00 ± 0.00 | 0.09 ± 0.10 | 0.02 ± 0.05 | 0.22 ± 0.10 | 0.03 ± 0.05 | 0.05 ± 0.06 |
| Node.js | 0.00 ± 0.00 | 0.15 ± 0.12 | 0.07 ± 0.26 | 0.14 ± 0.17 | 0.00 ± 0.01 | 0.31 ± 0.13 | 0.03 ± 0.03 | 0.15 ± 0.30 |
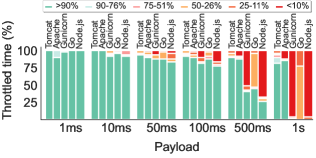
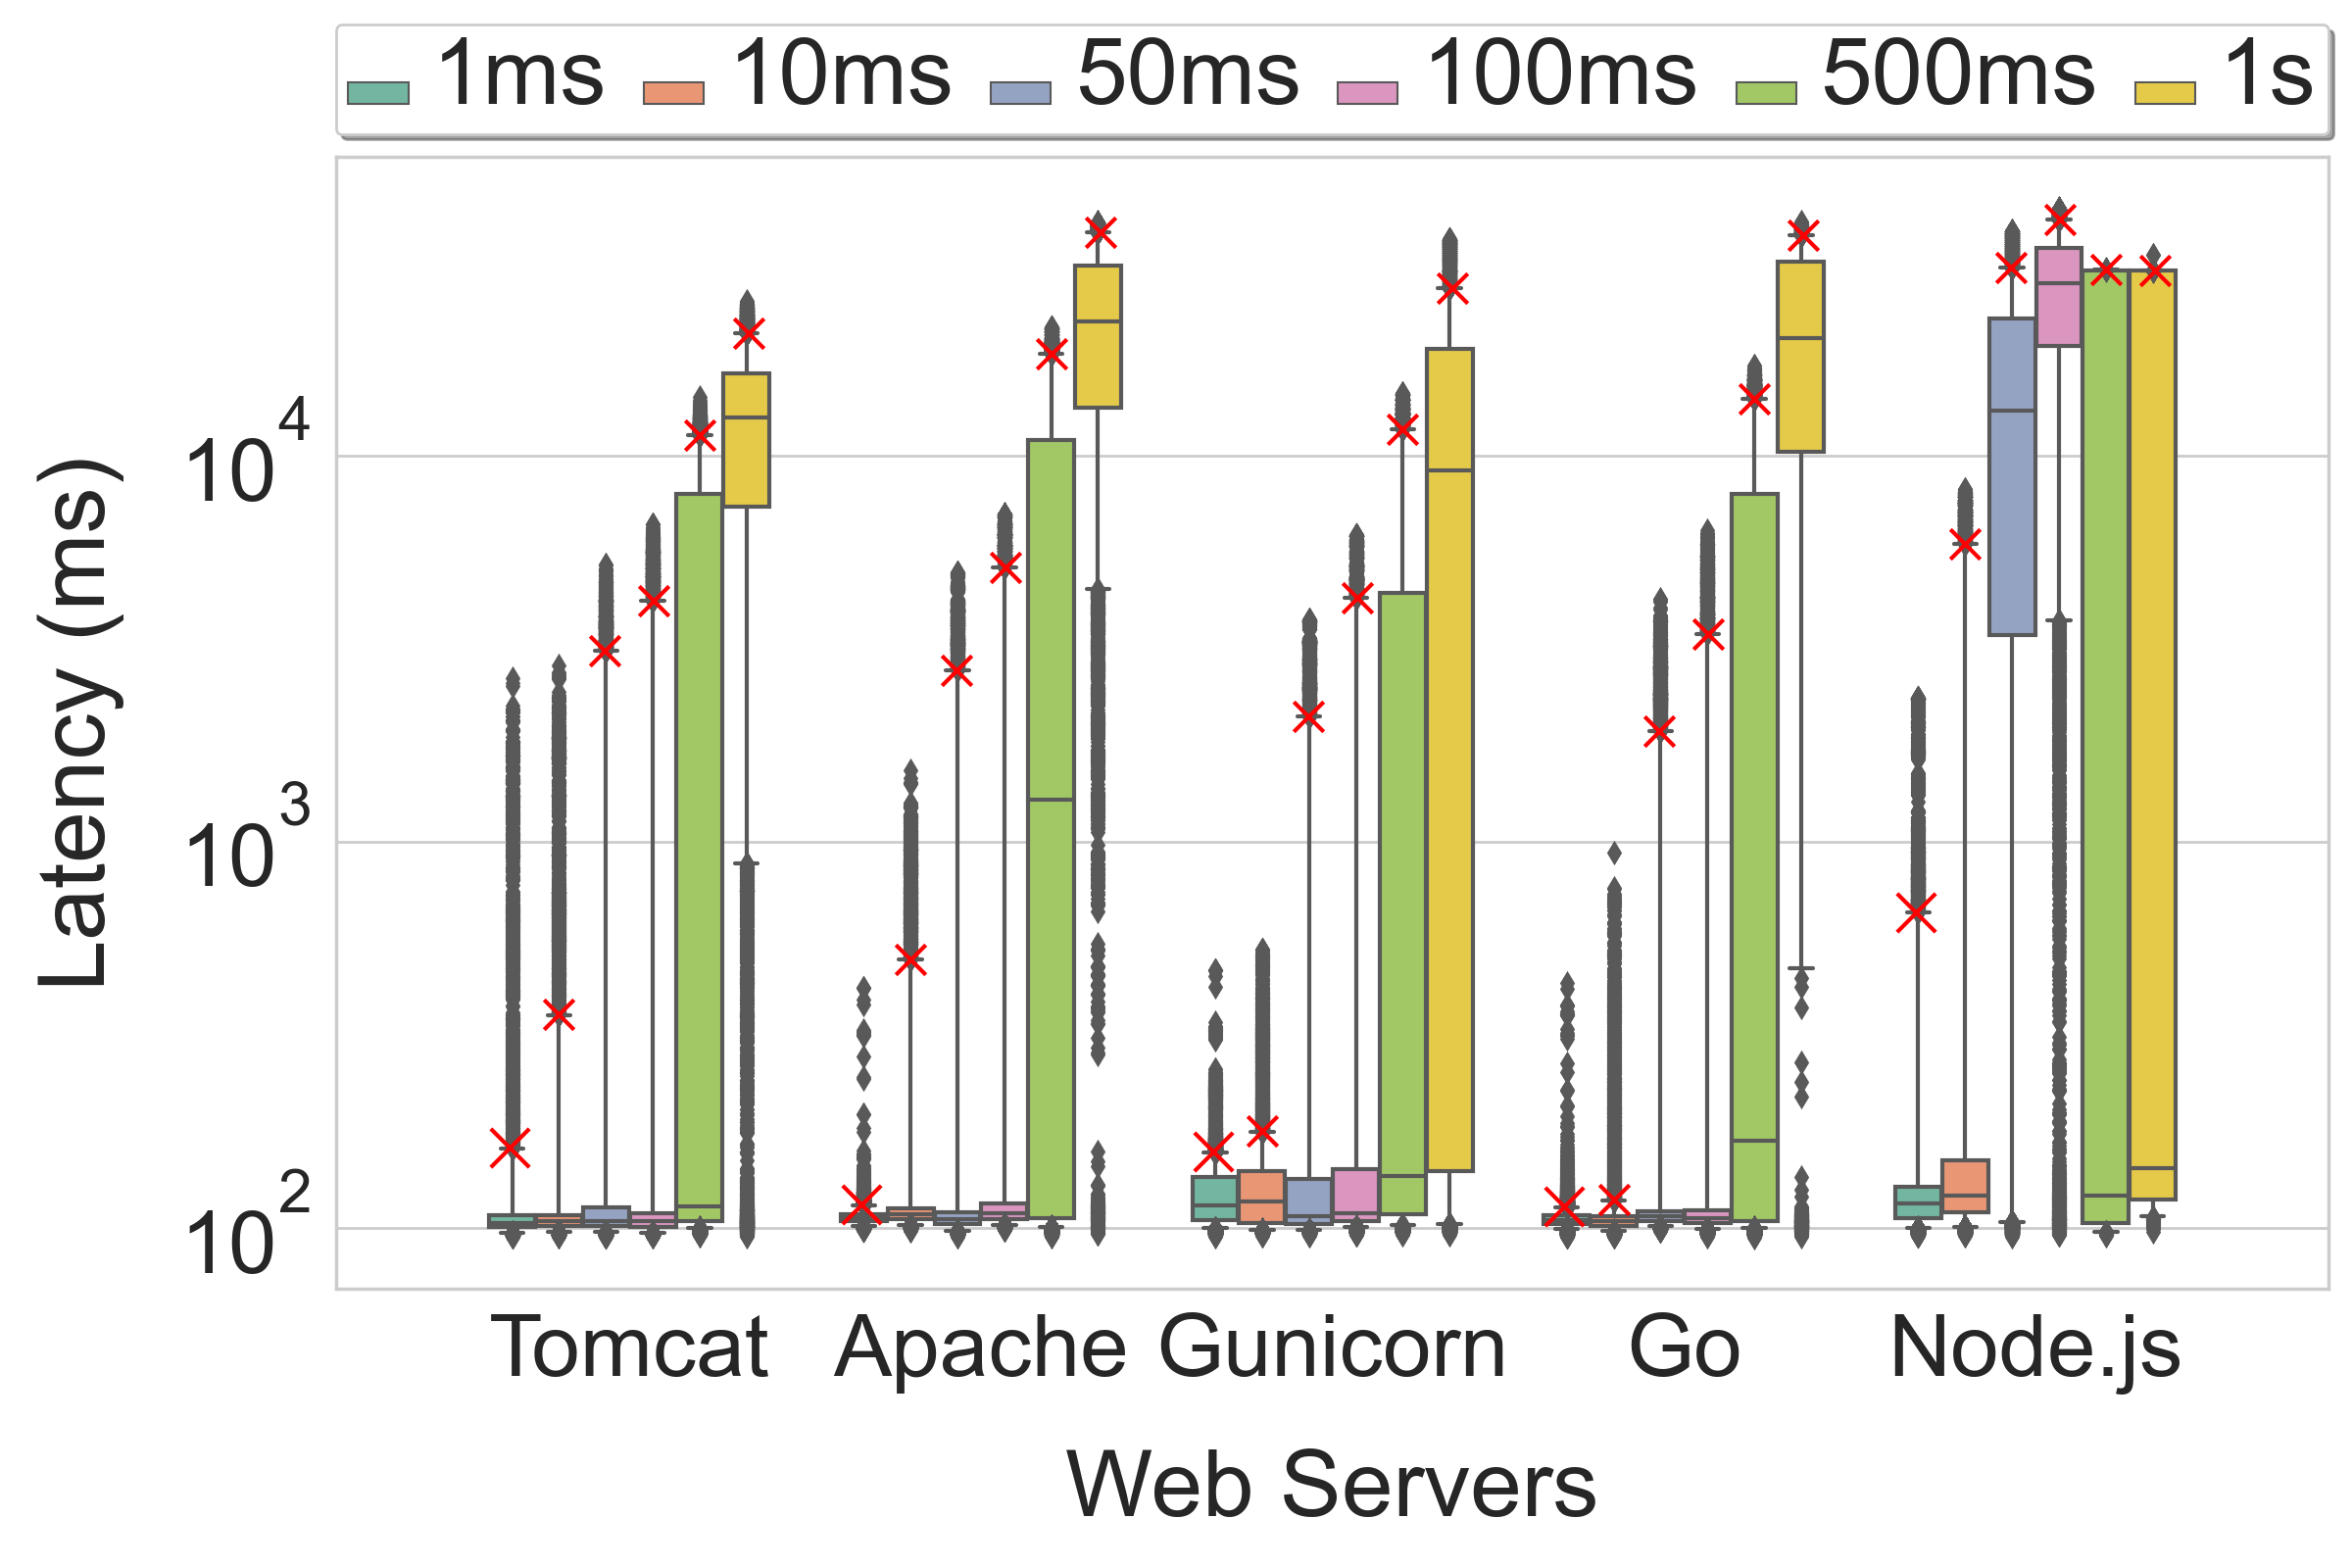
Figures 7-7 show our experimental results in the four considered PaaS platforms. We use one paid, professional instance for all the experiments. To increase confidence in our measurements, we start by presenting the root mean square percentage error (RMSPE) values of both throughput and latency. Table 2 shows the RMSPE values for all considered web servers on all platforms, in stable non-attack conditions. In our attack scenario, the attack starts after 10s, and sometimes it takes a few seconds for the server to warm up. Therefore, we consider the 5th-10th seconds as the stable period and calculate RMSPE over this period. The first column of the table shows the RMSPE values for throughput for five different runs. We use the expected throughput as the true value for the RMSPE calculation. The data shows that throughput remains stable during non-attack conditions as the error percentage is in all cases, except for one where it is close to . The second column shows the error percentage for latency during the same runs. Unlike throughput, latency depends on multiple components and can vary highly depending on the conditions. Our data shows the latency error was in most cases except for a few outliers. We believe that these values are small enough to allow us to draw important conclusions about the analysed servers.

It is worth noting that, the RMSPE values for the entire first 10 seconds do not deviate much from the previous one. However, we notice that some Apache instances have high latency at the beginning of this time interval, and we hypothesize that it is because they only initialize the thread pool once requests start arriving.
We can also confirm this by observing that the gain for the smallest considered payload (1ms) is always very close to zero, showing that when the attacker does not possess powerful enough payloads, the server approaches DoS noninterference, i.e., the observer’s throughput is almost perfectly matching the expected throughput. These data points also serve as a quick validation for our measurements, showing that the throughput of the observer is the expected one, in non-attack conditions. Related to this, we do not observe any form of rate-limiting enforced by the cloud platform. During our measurements, we could send several hundred requests per second without being restricted in any way, e.g., by an intrusion detection system.
The Azure results (Figure 7) appear to best match our local ones: the performance degradation is most serious for Gunicorn and Node.js, while for Tomcat and Apache is very low. Contrary to our local setup, the attack’s impact on latency, for Tomcat is more significant for large payloads, causing several requests to be served after one second. Moreover, Go shows much more serious performance degradation: Attacker’s gain is much higher than in our local experiment, and the throughput is less than 50% of the expected one, for most of the time after the attack started.
The AWS results (Figure 7) are also mostly consistent with our local ones. However, Apache exhibits the worst performance degradation on this platform, even worse than that of event-driven systems. We hypothesize that AWS could use Apache in one process per client mode. It is also worth mentioning that the average latency for 1s payloads in Go is higher than the one for Gunicorn with a 50ms attack, even though the gain is higher for the latter. That is because Go tends to attenuate the attack over time, without a dramatic momentary reduction in throughput. In contrast, for Gunicorn, immediately after the attack starts, the throughput falls below 10%, a trend also seen in our local experiments.
Figure 7 shows our result in DigitalOcean. All servers are much more impacted than in all the previous experiments: (i) for large payloads, we see a significant Attacker’s gain for all systems, (ii) the throughput for one-second payloads is almost always below 90% of the expected throughput, and (iii) the median latency for all servers is larger than one second. Moreover, Node.js and Gunicorn show unusual behavior that we do not see in any other setup: the degradation of throughput is gradual, more similar to what we would expect from a thread-based system. In Appendix C, we show that the actual throughput after the attack looks very peculiar: it is most of the time zero, with large spikes from time to time. We also observe these spikes for other systems deployed on DigitalOcean. We hypothesize that they are caused by the load balancer forwarding requests out-of-order to the server, i.e., measurement requests are interleaved with attack requests. Further experiments are needed to confirm this hypothesis.
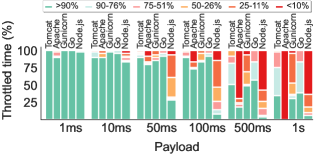
Figure 7 presents our experimental results in Heroku for the selected web servers. Node.js suffers significant degradation due to the attack: the Throttled time figure indicates that even for small payloads like 50 or 100ms, the server becomes almost completely unresponsive for more than 70% of the time. Even though the attacker gain is comparable in Gunicorn, Go, and Apache, all three systems react differently to the DoS attack. While the throughput of Gunicorn degrades drastically as soon as the attack starts, it stabilizes the throughput to the expected level not long after the attack stops, i.e., in the Throttled time graphs, one can see that Gunicorn recovers the fastest from the attack, serving for the longest time at ¿90% of expected throughput. Contrarily, Go barely goes under 10% of the expected throughput, even during attacks with large payloads, but for most of the time, it serves requests at less than half of the expected throughput, and the latency of the requests is, overall, higher.
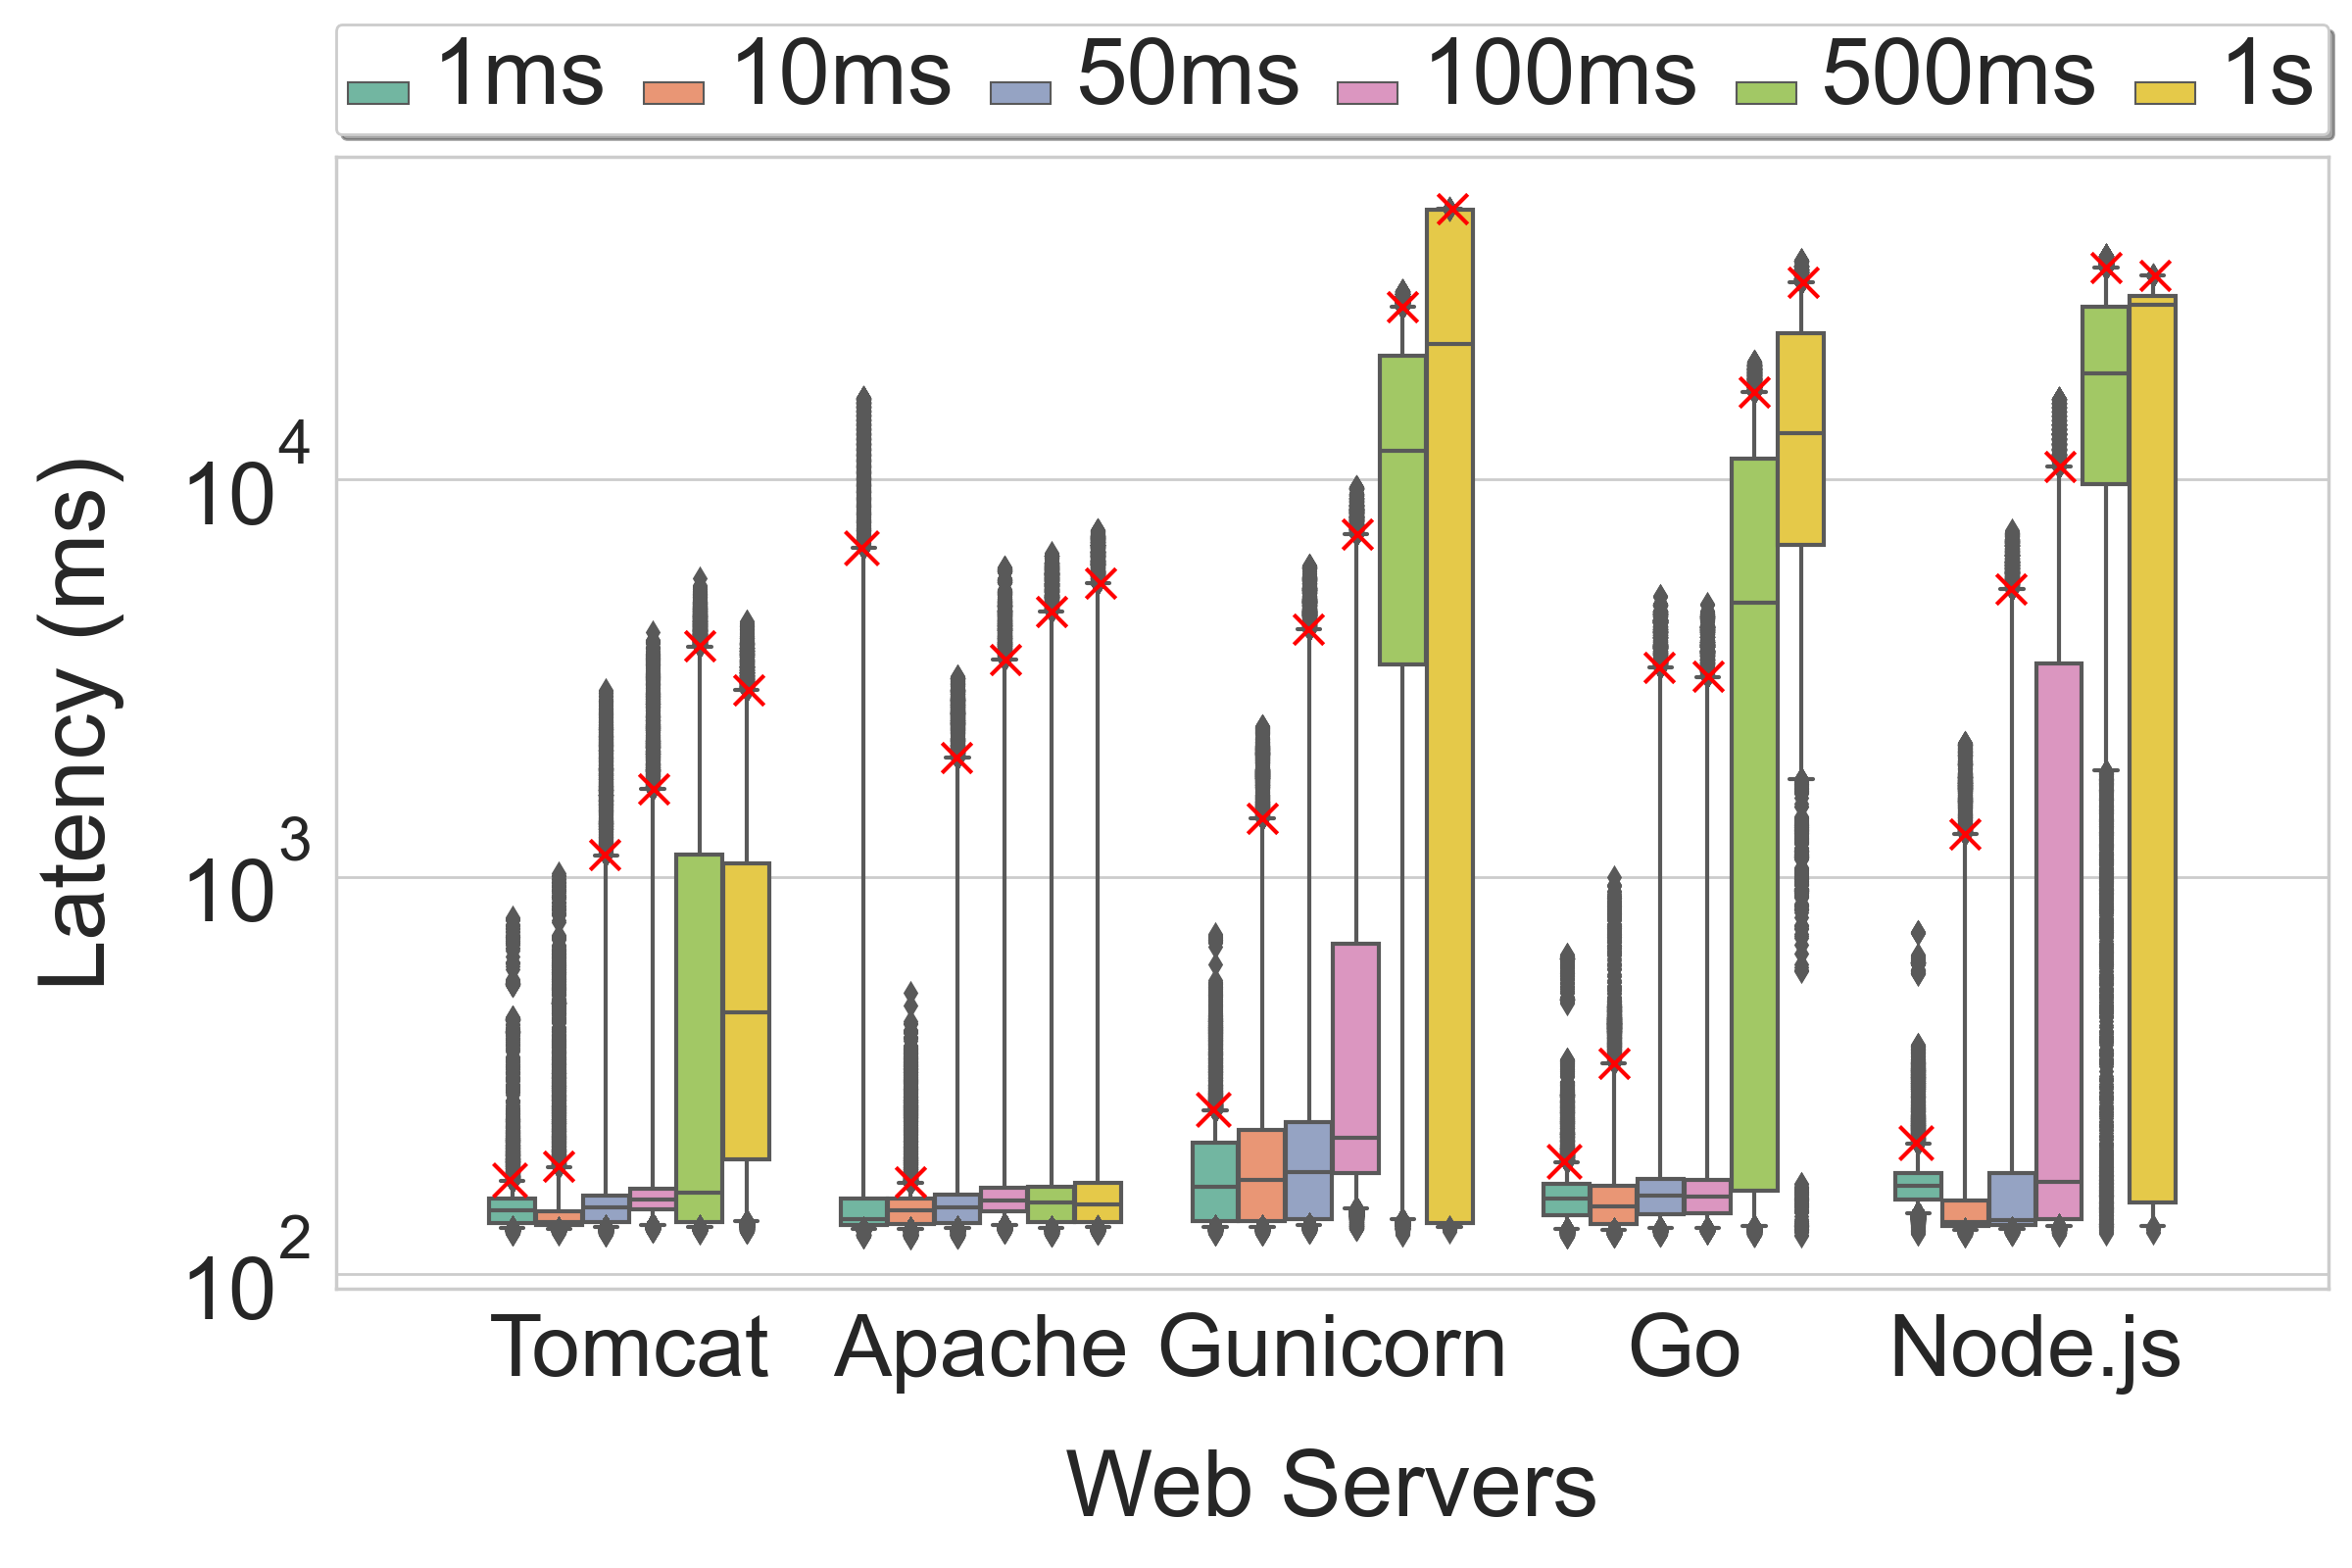
Unlike AWS and Azure, our results in Heroku and DigitalOcean show that Tomcat servers are not fully resilient against CPU-based DoS attacks with large payloads like 500ms or 1s. Figure 7(c) and 6(c) show that the median latency increases from 102 ms to 12.5s in Heroku, and 19 ms to 4.1s in Digitalocean. We believe this is due to the difference in hardware provided by these platforms. While AWS and Azure provide four and 3.5 GB memory respectively, Heroku and Digitalocean provide less than 1 GB. As Tomcat spawns a new thread for each request, the memory footprint is larger for Tomcat than for other systems. Thus, this server does not perform optimally in platforms with low computational resources. In the following section, we discuss the idea of increasing the hardware capabilities as a way to mitigate CPU-based DoS.
We observe that in most of the cloud experiments Gunicorn and Node.js confirm our local results and show a very sudden drop in performance after the attack, followed by a very sudden recovery. This is because the process(es) that serve attacker payloads quickly get clogged, unable to serve any additional incoming requests. On the contrary, thread-based systems show a much more gradual degradation of performance caused by the attacker slowly depleting the CPU resources, one thread at a time.
We also notice that for 50 ms payloads and higher, virtually all the servers in all the configurations exhibit a long-tail latency. That is, several measurement requests are served in more than a second. There is an extensive body of work studying this effect (Pu et al., 2017; Shan et al., 2017; Tennage et al., 2019; Zhang et al., 2019; Wang et al., 2017; Berger et al., 2018), but to the best of our knowledge, we are the first to show that a low-bandwidth DoS attack with relatively small payloads produces this effect against web applications deployed in the cloud, consistently.
4.4. Q2: Increase resilience
Our previous results show that the resiliency of a server architecture depends highly on the system configuration of the platform. For example, Tomcat excels highly in our local setup, AWS, and Azure, while it shows a slight performance degradation in Heroku and DigitalOcean against large payloads. Therefore, we study if changing the instance type, the number of instances, or other configurations affect the server’s resilience to DoS attacks. We consider three configurations for each platform: an entry-level instance, a professional instance, and two professional instances.
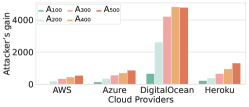
Figure 8 shows the average Attacker’s gain among these three configurations in the considered platforms. For each configuration, we repeat our experiments with increasing payloads and compute the average Attacker’s gain. For most servers, increasing the capabilities of the instance, i.e., going from entry-level to professional, result in a reduction in Attacker’s gain. A noticeable exception is Heroku, where the switch between the two types of machine is not reflected in better hardware, but in guarantees about the machine’s availability. Similarly, adding more instances in parallel does appear to help as well, in most of the cases. While this naive mitigation strategy provides a clear benefit, we believe developers are not willing to pay the extra (monthly) cost to protect against threats that may never happen.
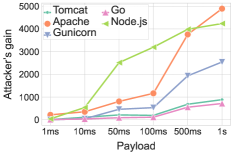
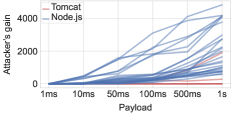
For event-based systems, we propose a much cheaper mitigation strategy: we hypothesize that by increasing the number of preforked workers, one can achieve a better resilience to CPU-based DoS attacks at a low cost. The current developers’ consensus is that the number of workers should be equal to (twice) the number of physical cores available on the machine131313https://docs.gunicorn.org/en/stable/design.html#how-many-workers141414https://devcenter.heroku.com/articles/node-concurrency#tuning-the-concurrency-level. In our local experiments described in Appendix B, we find that increasing this value beyond this recommendation provides increased resilience to the attack. To see if this hypothesis holds in the cloud, for each platform, we rerun our Node.js experiments with increasing number of threads. Since most platforms limit the number of workers to small values, we consider five configurations between 1 and 20, using increments of five. In Figure 9(a), we show the Attacker’s gain for all configurations and all cloud providers, for Node.js versus the default Tomcat configurations. When comparing with Figures 7-7, we see that the default configurations are clustered at the top of the figure and that most configurations with a higher number of workers have lower Attacker’s gain, comparable to some of the Tomcat servers. In AWS, the gain for Node.js with 20 workers drops by 2,222 from the default settings. However, as we discuss in Appendix C, the responses of a Node.js and a Tomcat server with comparable Attacker’s gains, are very different.

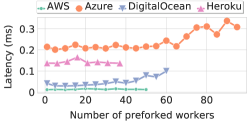
While this approach is effective at increasing the server’s resilience to the attack, it also comes with a cost. Figure 9(b) shows the latency of benign requests, in non-attack conditions, for different numbers of workers, on the four cloud platforms. Increasing the number of workers has a negative effect on the latency of requests. While the latency increases by 30% for the maximum number of workers in Azure, it increases by 59% in DigitalOcean. Thus, even though fixing up the number of workers to a high value improves the resiliency of the systems against DoS attacks, the system will suffer from higher latency in non-attack scenarios.
4.5. Q3: Vulnerability threshold
Our results so far show that there is no special threshold from which a CPU-heavy payload should be considered a vulnerability. Instead, we observe a clear correlation between the size of the payload and the attacker’s advantage during the attack. For example, using 500 ms payloads, which are not considered problematic by practitioners, in Node.js on Heroku, the attackers can bring down the server for more than 50s, which is more than 90% of the considered measurement window. We now explore a previously neglected part of the attack model: can the attacker use larger bandwidths with small payloads for an effective attack? To this end, for each platform, we choose the best performing setup in our previous experiment, i.e., the number of preforked workers that gives the lowest total gain, and we simulate attacks with small payloads against it.
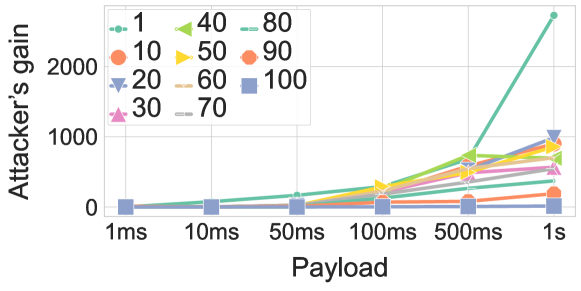
Figure 9(c) shows the result of attacking these servers with 50ms payloads, using increasing attack’s bandwidth. In all four platforms, it is possible to achieve a higher gain using a larger bandwidth, which is not entirely unexpected. However, it is once again surprising that there is no built-in mechanism to prevent this increase in bandwidth, e.g., rate-limiting. Another unexpected effect is that by increasing the bandwidth five times, we obtain an average 16-fold increase in Attacker’s gain. While the server never goes completely down in the smallest bandwidth attack, the throughput falls below 10% for five, seven, 48, and 12 seconds in AWS, Azure, DigitalOcean, and Heroku respectively, in the case of the largest bandwidth attack. We conclude that very small payloads can also be leveraged to harm web applications.
4.6. Discussion
Considering the trade-off discussed in Section 4.4 between the server’s resilience to CPU-based DoS attacks and its latency in non-attack conditions, we propose a load balancing solution for event-based systems: dynamically adjust the sizes of the asynchronous I/O thread pool and of the (preforked) workers pool, based on the type of received requests. That is, if a lot of I/O-heavy requests are observed, the thread pool should be reasonably high, but if the requests are CPU-heavy, the number of workers should be high instead. We believe that by implementing this strategy in the current event-based systems, one can increase their resilience to CPU-based DoS, without the additional cost for the non-attack scenario.
The results in Section 4.5 show that small payloads can be weaponized against well-configured servers in the cloud. Hence, we propose a multi-step mitigation strategy. First, developers should strive to limit the attacker’s bandwidth as much as possible, e.g., by using aggressive rate limiting. Second, they should identify any slow computation in their web server, i.e., as low as few tens of milliseconds. As discussed earlier, something as widely used as decryption with a strong key may be of concern. Developers should be encouraged to make slow computation hard to trigger, e.g., only allow it to logged-in users. Using the largest identified CPU-heavy request and the maximum bandwidth, developers should estimate the maximum damage an attacker can achieve against their server, possibly using our methodology.
5. Related work
CPU-based denial-of-service attacks
Crosby and Wallach (Crosby and Wallach, 2003) were the first to introduce bandwidth-bound, CPU-based DoS attacks. They analyze how an attacker can utilize vulnerabilities in hash tables and binary trees to deteriorate the performance of different systems. Shan et al. (Shan et al., 2017) show another variety of low-volume DoS attacks that utilize the architectural vulnerabilities in n-tier web applications, with repetitive small attack windows. Meng et al. (Meng et al., 2018) propose Rampart, a defense against CPU-exhaustion attacks that uses function profiling to detect and stop attacks at run time. Demoulin et al. (Demoulin et al., 2019) propose a machine learning model that uses the resource monitoring system in Linux kernel to detect long-running requests at run time. REGEXNET (Bai et al., 2021) uses a machine learning-based system to classify requests as malicious, and run them in a sandbox as a defense. Davis et al. (Davis et al., 2018b) propose timeouts as a way to prevent triggering CPU-heavy payloads. None of this work analyzes the effect of the server’s architecture on its resilience to DoS attacks.
Algorithmic complexity vulnerabilities
There is an extensive body of work to detect and mitigate algorithmic complexity vulnerabilities, most of them focusing on a particular system or application. Various dynamic (Liu et al., 2021) and static program analysis (Chang et al., 2009; Wüstholz et al., 2017) tools have been proposed for detecting these security problems. Olivo et al. (Olivo et al., 2015) introduce second-order DoS vulnerabilities and propose a static analysis technique for detecting them. Previous work also discusses how bugs in serialization libraries (Dietrich et al., 2017) or parsers (Rasheed et al., 2021) can be used to exhaust CPU resources of a system. Shen et al. (Shen et al., 2018), Davis et al. (Davis et al., 2017, 2021b), and Staicu et al. (Staicu and Pradel, 2018) study regular expressions vulnerabilities, a widespread problem in the Node.js ecosystem. DISCOVER (Awadhutkar et al., 2019) analyzes Java source code and detect vulnerabilities. REVEALER (Liu et al., 2021) uses both static and dynamic analysis to detect vulnerable regular expressions, and then produces an input string to exploit the detected vulnerability. Researchers have also proposed different fuzzing-based (Petsios et al., 2017; Blair et al., 2020) or symbolic execution-based (Noller et al., 2018; Burnim et al., 2009) systems to automatically generate malicious inputs that trigger algorithmic complexity vulnerabilities. Vulnerabilities can also be present in third-party code, published in open-source ecosystems (Davis et al., 2018a; Zimmermann et al., 2019; Alfadel et al., 2021). Instead of studying algorithmic complexity vulnerabilities directly, we study their potential impact on web applications deployed in the cloud.
Performance of web servers
Pariag et al. (Pariag et al., 2007) compares the performance of event-driven, thread per connection, and staged event-driven architectural servers. They also propose a new high-throughput architecture incorporating their suggested modification. Pai et al. (Pai et al., 1999) propose an asymmetric, multi-process, event-driven architecture for web servers that combines the performance of both event-driven and multi-threaded servers. Von Behren et al. (Von Behren et al., 2003) show a performance comparison of event-driven and multi-threaded architectures and demonstrated that by modifying the default threading implementation, multi-threaded servers can also handle large concurrent requests. While related, none of this work deals with malicious adversaries. Millibottlenecks (Pu et al., 2017; Wang et al., 2017) are a known performance problem of web applications that can lead to long-tail latency problems. Shan et al. (Shan et al., 2017) show how an adversary may leverage this to attack web applications, and Zhange et al. (Zhang et al., 2019) show that collocating virtual machines in the cloud can also produce long-tail effects in web applications. We are the first to study the effect of equivalent DoS attacks on the performance of widely-used web servers.
Performance problems
A lot of work have been done for detecting performance bottlenecks, profiling programs, and generating problematic input. Wei et al. (Wei et al., 2018) propose a genetic algorithm-based program synthesis that works on recurrent computation graphs to find the worst-case asymptotic complexity of an application. PerfFuzz (Lemieux et al., 2018) automatically generates inputs that trigger the worst-case performance of a program, using a multi-directional feedback loop. PerfSyn (Toffola et al., 2018) uses combinatorial and graph search algorithms to synthesize programs to find performance bottlenecks, while SyncProf (Yu and Pradel, 2016) uses concurrency-focused profiling to detect synchronization bottlenecks in programs. Nistor et al. (Nistor et al., 2013) propose an oracle based on memory access patterns for detecting performance bugs. Selakovic et al. (Selakovic and Pradel, 2017) identify the root causes of performance issues in popular JavaScript projects, and He et al. (He et al., 2020) propose a testing framework for identifying configuration-related performance problems. Liu et al. (Liu et al., 2014) study performance bugs in Android applications and propose a static analysis approach for detecting them. While performance problems can be used for DoS attacks, none of the work above considers malicious adversaries. Significant work has also been done on server scalability, performance, and availability (Wolter and Reinecke, 2010; Manjhi et al., 2006; Alomari and Menasce, 2012; Nylander et al., 2018; Tadakamalla and Menasce, 2020), but none of them focuses on malicious adversaries that aim to repeatedly trigger slow computations.
Comparison of ecosystems and frameworks
Duan et al. (Duan et al., 2021) use program analysis techniques to assess the functional and security features of package managers in Python, Node.js, and Ruby. Kikas et al. (Kikas et al., 2017) also report the significant differences in package dependency networks across three ecosystems. Decan et al. (Decan et al., 2017) analyzes the package dependency networks for seven languages and proposes novel metrics to highlight the growth, similarity, and differences between networks. We are the first to compare the resilience of widely-used web servers to CPU-based DoS attacks.
6. Conclusion
In this work, we study the resilience of widely-used web servers to CPU-based denial-of-service attacks. We show that servers react very differently to attacks: event-based systems tend to exhibit a very sudden drop in quality of service, while one-thread-per-client systems suffer more gradual performance degradation. We also show that, contrary to practitioners’ beliefs, sub-second slowdowns can be leveraged for effective attacks against web applications deployed in the cloud, under realistic deployment conditions. Our results are a call to arms for new defenses against CPU-based DoS attacks, and a warning about the hidden security trade-off involved in choosing the architecture of a web application.
References
- (1)
- Alfadel et al. (2021) Mahmoud Alfadel, Diego Elias Costa, and Emad Shihab. 2021. Empirical Analysis of Security Vulnerabilities in Python Packages. In International Conference on Software Analysis, Evolution and Reengineering (SANER).
- Alomari and Menasce (2012) Firas Alomari and Daniel A Menasce. 2012. An autonomic framework for integrating security and quality of service support in databases. In 2012 IEEE Sixth International Conference on Software Security and Reliability. IEEE, 51–60.
- Awadhutkar et al. (2019) Payas Awadhutkar, Ganesh Ram Santhanam, Benjamin Holland, and Suresh Kothari. 2019. DISCOVER: detecting algorithmic complexity vulnerabilities. In Joint Meeting on Foundations of Software Engineering (ESEC/FSE).
- Bai et al. (2021) Zhihao Bai, Ke Wang, Hang Zhu, Yinzhi Cao, and Xin Jin. 2021. Runtime Recovery of Web Applications under Zero-Day ReDoS Attacks. In Symposium on Security and Privacy (S&P).
- Barlas et al. (2022) Efe Barlas, Xin Du, and James C Davis. 2022. Exploiting Input Sanitization for Regex Denial of Service. (2022).
- benoitc (2022) benoitc. 2022. benoitc/gunicorn: gunicorn ’Green Unicorn’ is a WSGI HTTP Server for UNIX, fast clients and sleepy applications. (2022). https://github.com/benoitc/gunicorn
- Berger et al. (2018) Daniel S. Berger, Benjamin Berg, Timothy Zhu, Siddhartha Sen, and Mor Harchol-Balter. 2018. RobinHood: Tail Latency Aware Caching - Dynamic Reallocation from Cache-Rich to Cache-Poor. In USENIX Symposium on Operating Systems Design and Implementation, OSDI.
- Blair et al. (2020) William Blair, Andrea Mambretti, Sajjad Arshad, Michael Weissbacher, William Robertson, Engin Kirda, and Manuel Egele. 2020. HotFuzz: Discovering Algorithmic Denial-of-Service Vulnerabilities Through Guided Micro-Fuzzing. In Network and Distributed System Security Symposium (NDSS). San Diego, CA.
- Burnim et al. (2009) Jacob Burnim, Sudeep Juvekar, and Koushik Sen. 2009. WISE: Automated test generation for worst-case complexity. In International Conference on Software Engineering (ICSE).
- Chang et al. (2009) Richard Chang, Guofei Jiang, Franjo Ivancic, Sriram Sankaranarayanan, and Vitaly Shmatikov. 2009. Inputs of Coma: Static Detection of Denial-of-Service Vulnerabilities. In Computer Security Foundations Symposium (CSF).
- Crosby and Wallach (2003) Scott A Crosby and Dan S Wallach. 2003. Denial of Service via Algorithmic Complexity Attacks. In USENIX Security Symposium.
- Davis et al. (2017) James Davis, Gregor Kildow, and Dongyoon Lee. 2017. The case of the poisoned event handler: Weaknesses in the Node.js event-driven architecture. In European Workshop on Systems Security.
- Davis (2019) James C Davis. 2019. Rethinking regex engines to address redos. In Proceedings of the 2019 27th ACM Joint Meeting on European Software Engineering Conference and Symposium on the Foundations of Software Engineering. 1256–1258.
- Davis et al. (2018a) James C. Davis, Christy A. Coghlan, Francisco Servant, and Dongyoon Lee. 2018a. The impact of regular expression denial of service (ReDoS) in practice: an empirical study at the ecosystem scale. In Joint Meeting on Foundations of Software Engineering (ESEC/FSE).
- Davis et al. (2021a) James C Davis, Francisco Servant, and Dongyoon Lee. 2021a. Using selective memoization to defeat regular expression denial of service (ReDoS). In 2021 IEEE symposium on security and privacy (SP). IEEE, 1–17.
- Davis et al. (2021b) James C Davis, Francisco Servant, and Dongyoon Lee. 2021b. Using Selective Memoization to Defeat Regular Expression Denial of Service (ReDoS). In Symposium on Security and Privacy (S&P).
- Davis et al. (2018b) James C. Davis, Eric R. Williamson, and Dongyoon Lee. 2018b. A Sense of Time for JavaScript and Node.js: First-Class Timeouts as a Cure for Event Handler Poisoning. In USENIX Security Symposium.
- Decan et al. (2017) Alexandre Decan, Tom Mens, and Philippe Grosjean. 2017. An Empirical Comparison of Dependency Network Evolution in Seven Software Packaging Ecosystems. (2017). arXiv:cs.SE/1710.04936
- Demoulin et al. (2019) Henri Maxime Demoulin, Isaac Pedisich, Nikos Vasilakis, Vincent Liu, Boon Thau Loo, and Linh Thi Xuan Phan. 2019. Detecting Asymmetric Application-layer Denial-of-Service Attacks In-Flight with FineLame. In USENIX Annual Technical Conference (ATC).
- Dietrich et al. (2017) Jens Dietrich, Kamil Jezek, Shawn Rasheed, Amjed Tahir, and Alex Potanin. 2017. Evil Pickles: DoS Attacks Based on Object-Graph Engineering. In European Conference on Object-Oriented Programming (ECOOP).
- Duan et al. (2021) Ruian Duan, Omar Alrawi, Ranjita Pai Kasturi, Ryan Elder, Brendan Saltaformaggio, and Wenke Lee. 2021. Towards Measuring Supply Chain Attacks on Package Managers for Interpreted Languages. In Network and Distributed System Security Symposium (NDSS).
- He et al. (2020) Haochen He, Zhouyang Jia, Shanshan Li, Erci Xu, Tingting Yu, Yue Yu, Ji Wang, and Xiangke Liao. 2020. CP-Detector: Using Configuration-related Performance Properties to Expose Performance Bugs. In International Conference on Automated Software Engineering, (ASE).
- Kikas et al. (2017) Riivo Kikas, Georgios Gousios, Marlon Dumas, and Dietmar Pfahl. 2017. Structure and Evolution of Package Dependency Networks. In International Conference on Mining Software Repositories (MSR).
- Lemieux et al. (2018) Caroline Lemieux, Rohan Padhye, Koushik Sen, and Dawn Song. 2018. PerfFuzz: automatically generating pathological inputs. In International Symposium on Software Testing and Analysis (ISSTA).
- Liu et al. (2014) Yepang Liu, Chang Xu, and Shing-Chi Cheung. 2014. Characterizing and detecting performance bugs for smartphone applications. In International Conference on Software Engineering (ICSE).
- Liu et al. (2021) Yinxi Liu, Mingxue Zhang, and Wei Meng. 2021. REVEALER: Detecting and Exploiting Regular Expression Denial-of-Service Vulnerabilities. (2021).
- Manjhi et al. (2006) Amit Manjhi, Anastassia Ailamaki, Bruce M Maggs, Todd C Mowry, Christopher Olston, and Anthony Tomasic. 2006. Simultaneous scalability and security for data-intensive web applications. In Proceedings of the 2006 ACM SIGMOD international conference on Management of data. 241–252.
- Meng et al. (2018) Wei Meng, Chenxiong Qian, Shuang Hao, Kevin Borgolte, Giovanni Vigna, Christopher Kruegel, and Wenke Lee. 2018. Rampart: Protecting Web Applications from CPU-Exhaustion Denial-of-Service Attacks. In USENIX Security Symposium.
- Nistor et al. (2013) Adrian Nistor, Linhai Song, Darko Marinov, and Shan Lu. 2013. Toddler: detecting performance problems via similar memory-access patterns. In International Conference on Software Engineering (ICSE).
- Noller et al. (2018) Yannic Noller, Rody Kersten, and Corina S. Pasareanu. 2018. Badger: complexity analysis with fuzzing and symbolic execution. In International Symposium on Software Testing and Analysis (ISSTA).
- Nylander et al. (2018) Tommi Nylander, Marcus Thelander Andrén, Karl-Erik Årzén, and Martina Maggio. 2018. Cloud application predictability through integrated load-balancing and service time control. In 2018 IEEE International Conference on Autonomic Computing (ICAC). IEEE, 51–60.
- Ojamaa and Düüna (2012) Andres Ojamaa and Karl Düüna. 2012. Assessing the security of Node.js platform. In International Conference for Internet Technology and Secured Transactions.
- Olivo et al. (2015) Oswaldo Olivo, Isil Dillig, and Calvin Lin. 2015. Detecting and Exploiting Second Order Denial-of-Service Vulnerabilities in Web Applications. In Conference on Computer and Communications Security (CCS). Denver Colorado USA.
- Pai et al. (1999) Vivek S Pai, Peter Druschel, and Willy Zwaenepoel. 1999. Flash: An efficient and portable Web server.. In USENIX Annual Technical Conference (ATC).
- Pariag et al. (2007) David Pariag, Tim Brecht, Ashif Harji, Peter Buhr, Amol Shukla, and David R Cheriton. 2007. Comparing the performance of web server architectures. ACM SIGOPS Operating Systems Review (2007).
- Petsios et al. (2017) Theofilos Petsios, Jason Zhao, Angelos D. Keromytis, and Suman Jana. 2017. SlowFuzz: Automated Domain-Independent Detection of Algorithmic Complexity Vulnerabilities. In Conference on Computer and Communications Security (CCS).
- Pu et al. (2017) Calton Pu, Joshua Kimball, Chien-An Lai, Tao Zhu, Jack Li, Junhee Park, Qingyang Wang, Deepal Jayasinghe, PengCheng Xiong, Simon Malkowski, Qinyi Wu, Gueyoung Jung, Younggyun Koh, and Galen S. Swint. 2017. The Millibottleneck Theory of Performance Bugs, and Its Experimental Verification. In International Conference on Distributed Computing Systems, (ICDCS).
- Rasheed et al. (2021) Shawn Rasheed, Jens Dietrich, and Amjed Tahir. 2021. Caught in the Web: DoS Vulnerabilities in Parsers for Structured Data. In European Symposium on Research in Computer Security (ESORICS).
- Selakovic and Pradel (2017) Marija Selakovic and Michael Pradel. 2017. Performance Issues and Optimizations in JavaScript: An Empirical Study. In International Conference on Software Engineering (ICSE).
- Shan et al. (2017) Huasong Shan, Qingyang Wang, and Calton Pu. 2017. Tail Attacks on Web Applications. In Conference on Computer and Communications Security (CCS).
- Shen et al. (2018) Yuju Shen, Yanyan Jiang, Chang Xu, Ping Yu, Xiaoxing Ma, and Jian Lu. 2018. ReScue: crafting regular expression DoS attacks. In International Conference on Automated Software Engineering (ASE).
- Staicu and Pradel (2018) Cristian-Alexandru Staicu and Michael Pradel. 2018. Freezing the Web: A Study of ReDoS Vulnerabilities in JavaScript-based Web Servers. In USENIX Security Symposium.
- Tadakamalla and Menasce (2020) Venkat Tadakamalla and Daniel Menasce. 2020. Autonomic elasticity control for multi-server queues under generic workload surges in cloud environments. IEEE Transactions on Cloud Computing (2020).
- Tennage et al. (2019) Pasindu Tennage, Srinath Perera, Malith Jayasinghe, and Sanath Jayasena. 2019. An Analysis of Holistic Tail Latency Behaviors of Java Microservices. In International Conference on High Performance Computing and Communications; International Conference on Smart City;International Conference on Data Science and Systems, (HPCC/SmartCity/DSS).
- Toffola et al. (2018) Luca Della Toffola, Michael Pradel, and Thomas R. Gross. 2018. Synthesizing programs that expose performance bottlenecks. In International Symposium on Code Generation and Optimization (CGO). ACM.
- Turonová et al. ([n. d.]) Lenka Turonová, Lukáš Holík, Ivan Homoliak, Ondrej Lengál, Margus Veanes, and Tomáš Vojnar. [n. d.]. Counting in Regexes Considered Harmful: Exposing ReDoS Vulnerability of Nonbacktracking Matchers. ([n. d.]).
- Von Behren et al. (2003) J Robert Von Behren, Jeremy Condit, and Eric A Brewer. 2003. Why Events Are a Bad Idea (for High-Concurrency Servers).. In HotOS.
- Wang et al. (2017) Qingyang Wang, Chien-An Lai, Yasuhiko Kanemasa, Shungeng Zhang, and Calton Pu. 2017. A Study of Long-Tail Latency in n-Tier Systems: RPC vs. Asynchronous Invocations. In International Conference on Distributed Computing Systems, (ICDCS).
- Wei et al. (2018) Jiayi Wei, Jia Chen, Yu Feng, Kostas Ferles, and Isil Dillig. 2018. Singularity: pattern fuzzing for worst case complexity. In Joint Meeting on Foundations of Software Engineering (ESEC/FSE).
- Wolter and Reinecke (2010) Katinka Wolter and Philipp Reinecke. 2010. Performance and security tradeoff. International School on Formal Methods for the Design of Computer, Communication and Software Systems (2010), 135–167.
- Wüstholz et al. (2017) Valentin Wüstholz, Oswaldo Olivo, Marijn JH Heule, and Isil Dillig. 2017. Static detection of DoS vulnerabilities in programs that use regular expressions. In International Conference on Tools and Algorithms for the Construction and Analysis of Systems (TACAS).
- Yu and Pradel (2016) Tingting Yu and Michael Pradel. 2016. SyncProf: detecting, localizing, and optimizing synchronization bottlenecks. In International Symposium on Software Testing and Analysis (ISSTA).
- Zhang et al. (2019) Shungeng Zhang, Huasong Shan, Qingyang Wang, Jianshu Liu, Qiben Yan, and Jinpeng Wei. 2019. Tail Amplification in n-Tier Systems: A Study of Transient Cross-Resource Contention Attacks. In International Conference on Distributed Computing Systems, (ICDCS).
- Zimmermann et al. (2019) Markus Zimmermann, Cristian-Alexandru Staicu, Cam Tenny, and Michael Pradel. 2019. Small World with High Risks: A Study of Security Threats in the npm Ecosystem. In USENIX Security Symposium.
Appendix A Ethics
This work does not raise any ethical concerns, as all our experiments were carried against servers under our control.
Appendix B Multiple workers in local setup
To test the hypothesis that high number of preforked workers can increase the resilience of event-based systems to CPU-based DoS attacks, we perform a local experiment with Node.js. Using the built-in Cluster API, we vary the number of workers in increments of ten, and simulate attacks with different payloads, against each configuration. In Figure 10, we show the Attacker’s gain for various numbers of workers. The results show that there is an inverse relationship between the number of workers and the Attacker’s gain: the higher the number of workers, the more resilient the server is to an attack.

Appendix C Example responses to attack
Below, we discuss several interesting server responses that we encountered during our experiments.
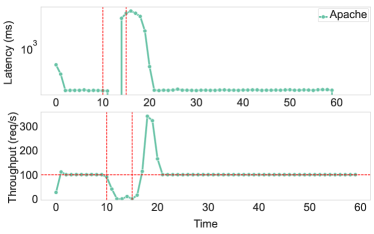
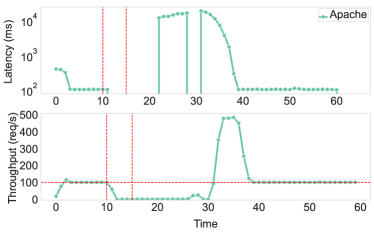
Let us first consider Figure 12, showing Apache’s response to 500 milliseconds payloads in two different cloud providers. For both setups, there are several seconds with zero throughput, in which no requests are served. There is also a high difference in recovery time between the two setups: a couple of seconds after the attack stopped in Azure, and more than ten seconds in Heroku. This could, in theory, be caused by the better hardware used in Azure instances, but the difference is too high to be explained in this way. It is also interesting to compare these results with Apache’s response to the same attack in our local setup, showed in Figure 2. Seeing all these dramatic differences, we hypothesize that Apache runs using different multi-processing modules151515https://httpd.apache.org/docs/2.4/mpm.html, in all these setups. This could explain the inconsistent responses we see for this web server.
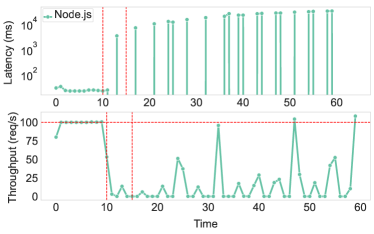
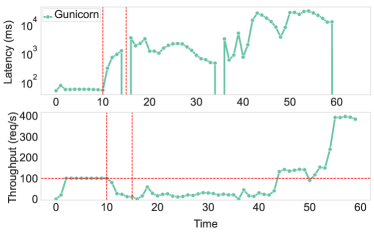
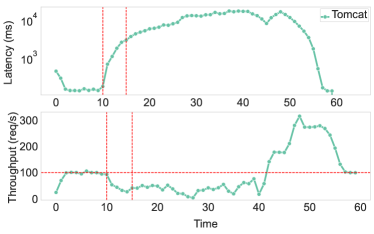
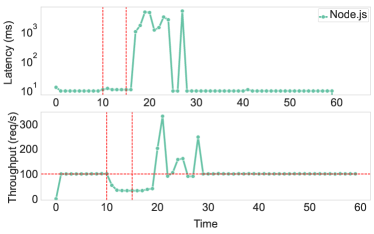
In Figure 12, we see the response of four servers to an attack with five seconds payloads, in DigitalOcean. Gunicorn appears to recover the fastest, i.e., the throughput consistently exceeds the expected one 25 seconds after the attack. For Tomcat and Go, while the throughput is kept at consistent levels throughout the experiments, the latency is continuously increasing during our observation period. Hence, we argue that it is hard to decide which one of these behaviors is the desired one for a web server. Another interesting aspect worth noticing is the high number of spikes we observe for Node.js, Tomcat, and Go. We do not observe this effect in any other setup we consider. In most of the other cases, we obtain a rather smooth throughput curve, like the ones in Figure 12 or Figure 13. We hypothesize that the cause for this effect in DigitalOcean is server-independent, e.g., the load balancer scheduling requests in a peculiar order.
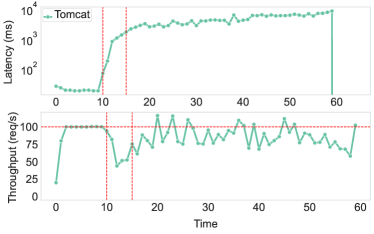
Finally, let us discuss the examples Figure 13. While Tomcat and Node.js are deployed on two different cloud providers here, i.e., Azure and AWS, respectively, we argue that the underlying hardware is similar as seen from Table1. For the considered attack and cloud setups, we can safely say that Node.js performs better than Tomcat: the drop in throughput is smaller for Node.js, and it lasts for a shorter time, while the increase in latency is only perceivable for 20 seconds, as opposed to 40 seconds for Tomcat. Nevertheless, we observe that the increase in latency is gradual for Tomcat but sudden for Node.js. This example illustrates that event-based servers do not always perform worse than thread-based ones against CPU-based DoS. However, it is unlikely that developers use such high numbers of preforked workers in practice.