subject \ArticleTypeArticle \SpecialTopicSpecial Topic: Peering into the Milky Way by FAST \Year2022 \MonthDecember \Vol65 \No12 \DOI10.1007/s11433-022-2039-8 \ArtNo129703 \ReceiveDateJul 14, 2022 \AcceptDateNov 16, 2022
Peering into the Milky Way by FAST: II. Ionized gas in the inner Galactic disk revealed by the piggyback line observations of the FAST GPPS survey
Hou L. G., Han J. L., Hong T.
L. G. Hou, J. L. Han, T. Hong, X. Y. Gao and C. Wang
Peering into the Milky Way by FAST:
II. Ionized gas in the
inner Galactic disk revealed by the piggyback line observations of
the FAST GPPS survey111News and views on this paper
Abstract
As one of the major components of the interstellar medium, the ionized gas in our Milky Way, especially the low-density diffuse component, has not been extensively observed in the radio band. The Galactic Plane Pulsar Snapshot (GPPS) survey covers the sky area within the Galactic latitude of around the Galactic plane visible by the Five-hundred-meter Aperture Spherical radio Telescope (FAST), and the spectral line data are simultaneously recorded during the pulsar survey observations. With an integration time of 5 minutes for each beam, the GPPS survey project provides the most sensitive piggyback spectra for tens of radio recombination lines (RRLs) in the band of 10001500 MHz for H, He, C, as well as H and H. We processed the spectral data of RRLs, and obtained a sensitive averaged H RRL map of a sky area of 88 square degrees in the inner Galaxy of 33∘ 55∘ and 20. The final spectral data of the H RRLs have a spatial resolution of 3′, a spectral resolution of 2.2 km s-1, and a typical spectral rms noise of 0.25 mJy beam-1 or 6.3 mK in main-beam brightness temperature. The FAST GPPS H RRL observations are sensitive down to an emission measure of about 200 cm-6 pc if a 3 detection limit is required. The new H RRL map shows complex structural features dominated by a number of H ii regions and large extended diffuse ionized gas regions. We detect about 94% of the known H ii regions and confirm 43 WISE H ii regions in the observed sky area. Several large H ii regions or star-forming complexes in the distant outer Galaxy are resolved in the map of H RRLs. Extended RRL features of the diffuse ionized gas are detected. In addition, the GPPS piggyback spectral-line data also provide sensitive detection for other kinds of RRLs, such as the He, C, H and H RRLs. The RRL data products of the GPPS survey will be published and updated at http://zmtt.bao.ac.cn/MilkyWayFAST/.
keywords:
Key Words: surveys, ISM, HII regions, radio lines95.80.+p, 98.38.-j, 98.58.Hf, 95.30.Ky
1 Introduction
Ionized gas is one of the major components of the interstellar medium (ISM). It is widely distributed in the Milky Way, from the Galactic center to the far outer Galaxy, making up about 20% of the total gas mass of the Galaxy (Lequeux, 2005). Observations of the Galactic ionized gas are crucial for understanding many relevant astrophysics, such as the star formation and H ii regions, the kinematics of ionized ISM, the electron density distribution and the spiral structure of the Galaxy, and the gaseous metallicity and recycling of materials in the Galactic ISM (e.g., Downes et al., 1980; Alves et al., 2015; Hou & Han, 2014; Thompson et al., 2015; Balser et al., 2018; Anderson et al., 2021).
In comparison to many surveys of interstellar atomic gas (e.g., Kalberla et al., 2005; McClure-Griffiths et al., 2009; Beuther et al., 2016; Winkel et al., 2016; HI4PI Collaboration et al., 2016), molecular gas (e.g., Dame et al., 2001; Dempsey et al., 2013; Rigby et al., 2016; Su et al., 2019; Eden et al., 2020; Benedettini et al., 2021; Schuller et al., 2021) and dusts (e.g., Arendt et al., 1998; Flagey et al., 2006; Gold et al., 2011; Planck Collaboration et al., 2014), previous surveys for the ionized gas (see below), especially for the low-density diffuse ionized gas (e.g., Anderson et al., 2021), have to be improved in aspects of the observation sensitivity, spatial resolution, spectral resolution, and sky coverage.
1.1 Observation methods for the Galactic ionized gas
Generally, ionized gas exists in the Milky Way in three forms: H ii regions, diffuse ionized gas, and hot ionized gas (e.g., Ferrière, 2001; Lequeux, 2005). The ionization sources could be the far-UV radiation of hot stars or other mechanisms such as collisional ionization by interstellar shocks. The H ii regions and diffuse ionized gas can be detected over a wide range of the electromagnetic spectrum. Hot ionized gas originating from supernova remnants and bubbles is generally detected in the high-energy band. In the following we concentrate on H ii regions and diffuse ionized gas in the Milky Way.
Some direct and indirect methods have been adopted to observe H ii regions and interstellar diffuse ionized gas: (1) optical recombination lines such as the H line (e.g., Haffner et al., 1999; Gaustad et al., 2001); (2) fine-structure lines of the elements of oxygen (O), nitrogen (N), and sulfur (S) from UV to infrared bands (e.g., Wright et al., 1991; Gry et al., 1992; Haffner et al., 1999); (3) radio recombination lines of hydrogen (H), helium (He), and carbon (C) (e.g., Mezger & Hoglund, 1967; Caswell & Haynes, 1987; Anderson et al., 2011); (4) dispersion measures of pulsars in the radio band (e.g., Taylor & Cordes, 1993; Cordes & Lazio, 2002; Yao et al., 2017); (5) radio free-free continuum emission (e.g., Felli & Churchwell, 1972; Kuchar & Clark, 1997; Gao et al., 2019); (6) free-free absorption of background synchrotron continuum (e.g., Su et al., 2018). Each approach has its own advantages and shortcomings. Since the H line is strong, it can be used to probe low-density ionized gas and has been surveyed throughout the entire sky (Gaustad et al., 2001; Haffner et al., 2003). However, observations of the H line in the optical band suffer from severe dust extinction. Dispersion measures of pulsars are the integration of thermal electron density from a pulsar to us, and measurements are limited to selected sight lines to pulsars, though the models of the free-electron distribution in the Milky Way can be constructed (e.g., Taylor & Cordes, 1993; Cordes & Lazio, 2002; Yao et al., 2017). Radio continuum surveys for free-free emission can avoid interstellar dust extinction, but the decomposition of diffuse thermal emission from the Galactic synchrotron radio emission (Xu et al., 2013) needs well-calibrated measurements on many bands and careful disentangling of data (Planck Collaboration et al., 2016).
Radio recombination lines (RRLs) are good tracers for ionized gas. Though the strengths of RRLs are weak in general, they have some unique advantages: (1) RRLs in radio band almost do not suffer from extinction, hence are suitable for measuring the ionized gas in very distant regions of the Galactic disk; (2) modern large radio telescopes, such as the FAST and the Green Bank Telescope (GBT), possess a great sensitivity to detect weak RRLs with a high spatial resolution and a good spectral resolution. If such a large telescope is equipped with a multi-beam system or a phased array feed, the survey efficiency could be improved significantly; (3) with developments of broadband receiver and high-speed digital backend, multiple-transitions of RRLs in a wide observation bandwidth can be recorded simultaneously. After a reasonable stacking, sensitive RRL spectra can be obtained within a reasonable integration time (e.g., Balser, 2006). Exactly relying on these advantages, RRL observations become a feasible approach to survey the ionized gas throughout the Milky Way (e.g., Thompson et al., 2015; Balser et al., 2018; Anderson et al., 2021).
1.2 Previous efforts in RRL observations
There have been many efforts on the study of the Galactic ionized gas through observing RRLs, either by targeted observations towards H ii regions or by wide-area surveys for H ii regions and diffuse ionized gas.
1.2.1 Targeted observations towards H ii regions
H ii regions are hot gas clouds with a typical electron temperature 8000 K and an electron density cm-3. They have well-defined boundaries and are generally distributed in interstellar space with a filling factor 1% (e.g., Ferrière, 2001; Lequeux, 2005). According to the size and evolutionary stage, H ii regions are often distinguished and named as large H ii regions, compact H ii regions, ultra-compact H ii regions, and hyper-compact H ii regions.
Soon after Kardashev (1959) predicted the RRLs from hydrogen and helium in H ii regions, Dravskikh & Dravskikh (1967) detected H104 and Hoglund & Mezger (1965) observed H109 from some Galactic H ii regions. Following these predictions and observations, many efforts were devoted to searching for the Galactic H ii regions and measure their physical properties by using RRLs (e.g., Mezger & Hoglund, 1967; Dieter, 1967; Reifenstein et al., 1970; Downes et al., 1980; Wink et al., 1983; Caswell & Haynes, 1987; Lockman, 1989; Lockman et al., 1996). Their distributions were used to delineate the Galactic spiral structures (e.g., Georgelin & Georgelin, 1976; Paladini et al., 2004; Hou et al., 2009; Hou & Han, 2014). Up to now more than 7 000 Galactic H ii regions and candidates have been catalogued (Anderson et al., 2014; Armentrout et al., 2021), but only about 1 000 H ii regions have RRL detection as of year 2009 (Hou et al., 2009). In the last decade, there have been several projects aiming to discover a large number of H ii regions by using RRLs: the GBT H ii Region Discovery Survey at 48 GHz or 810 GHz (Bania et al., 2010; Anderson et al., 2011, 2018a), the Arecibo H ii Region Discovery Survey at -band (Bania et al., 2012); the Southern H ii Region Discovery Survey with the Australia Telescope Compact Array at 410 GHz (Brown et al., 2017; Wenger et al., 2019, 2021); a search of radio continuum emission from H ii region candidates with the Karl G. Jansky Very Large Array (VLA, Armentrout et al., 2021); and the survey of RRLs of more than 500 high-mass star-forming regions at -band (4.56.9 GHz) with the Shanghai 65-m Tianma radio telescope (Chen et al., 2020).
At present, more than 2 000 H ii regions have RRL detected. However, the physical parameters (e.g., electron temperature and density) for most of them have not been well measured. A large number of H ii region candidates ( 5 000, see Anderson et al., 2014; Armentrout et al., 2021) remain to be confirmed with sensitive observations.
1.2.2 Extensive surveys for ionized gas
Large RRL surveys have been conducted to study the Galactic H ii regions and the diffuse ionized gas. The diffuse ionized gas exists outside the well-defined H ii regions, and is widely distributed in the Galaxy, typically with 8000 K, cm-3 and a filling factor 20%50% (e.g., Ferrière, 2001; Lequeux, 2005), making up about 90% of the total mass of Galactic ionized gas (Reynolds, 1991).
| RRL | Frequency | RRL | Frequency | RRL | Frequency | RRL | Frequency | RRL | Frequency |
|---|---|---|---|---|---|---|---|---|---|
| (MHz) | (MHz) | (MHz) | (MHz) | (MHz) | |||||
| H | 1477.335 | He | 1477.937 | C | 1478.072 | H | 1482.886 | H | 1491.528 |
| H | 1450.716 | He | 1451.307 | C | 1451.440 | H | 1461.600 | H | 1472.766 |
| H | 1424.734 | He | 1425.314 | C | 1425.444 | H | 1440.720 | H | 1454.317 |
| H | 1399.368 | He | 1399.938 | C | 1400.066 | H | 1420.236 | H | 1436.175 |
| H | 1374.601 | He | 1375.161 | C | 1375.286 | H | 1400.138 | H | 1418.334 |
| H | 1350.414 | He | 1350.965 | C | 1351.088 | H | 1380.417 | H | 1400.786 |
| H | 1326.792 | He | 1327.333 | C | 1327.454 | H | 1361.065 | H | 1383.528 |
| H | 1303.718 | He | 1304.249 | C | 1304.368 | H | 1342.073 | H | 1366.551 |
| H | 1281.175 | He | 1281.697 | C | 1281.814 | H | 1323.433 | H | 1349.851 |
| H | 1259.150 | He | 1259.663 | C | 1259.778 | H | 1305.136 | H | 1333.422 |
| H | 1237.626 | He | 1238.130 | C | 1238.243 | H | 1287.176 | H | 1317.259 |
| H | 1216.590 | He | 1217.086 | C | 1217.197 | H | 1269.543 | H | 1301.356 |
| H | 1196.028 | He | 1196.516 | C | 1196.625 | H | 1252.231 | H | 1285.708 |
| H | 1175.927 | He | 1176.406 | C | 1176.514 | H | 1235.232 | H | 1270.310 |
| H | 1156.274 | He | 1156.745 | C | 1156.851 | H | 1218.539 | H | 1255.156 |
| H | 1137.056 | He | 1137.520 | C | 1137.624 | H | 1202.146 | H | 1240.243 |
| H | 1118.262 | He | 1118.718 | C | 1118.820 | H | 1186.046 | H | 1225.565 |
| H | 1099.880 | He | 1100.328 | C | 1100.429 | H | 1170.232 | H | 1211.118 |
| H | 1081.898 | He | 1082.339 | C | 1082.438 | H | 1154.697 | H | 1196.897 |
| H | 1064.307 | He | 1064.740 | C | 1064.838 | H | 1139.437 | H | 1182.897 |
| H | 1047.094 | He | 1047.521 | C | 1047.617 | H | 1124.444 | H | 1169.116 |
| H | 1030.251 | He | 1030.671 | C | 1030.765 | H | 1109.713 | H | 1155.547 |
| H | 1013.767 | He | 1014.180 | C | 1014.273 | H | 1095.238 | H | 1142.188 |
| H | 1081.014 | H | 1129.033 | ||||||
| H | 1067.036 | H | 1116.080 | ||||||
| H | 1053.297 | H | 1103.325 | ||||||
| H | 1039.793 | H | 1090.763 | ||||||
| H | 1026.519 | H | 1078.391 | ||||||
| H | 1013.470 | H | 1066.205 | ||||||
| H | 1000.641 | H | 1054.202 | ||||||
| H | 1042.379 | ||||||||
| H | 1030.732 | ||||||||
| H | 1019.258 | ||||||||
| H | 1007.953 |
Early surveys (Gordon & Cato, 1972; Hart & Pedlar, 1976; Cersosimo et al., 1989; Cersosimo, 1990; Azcárate et al., 1997; Roshi & Anantharamaiah, 2000) were conducted below 1.7 GHz and focused on understanding the properties of diffuse ionized gas. Lockman (1976) measured the H166 at some selected positions in the Galactic longitude range from 4∘ to 446, and Heiles et al. (1996a, b) observed the RRLs of H as well as He, C, H, and H around 1.4 GHz towards more than 580 positions in the Galactic longitude ranging from 3∘ to 2544. They investigated the distribution and physical properties of the extended low-density warm ionized medium.
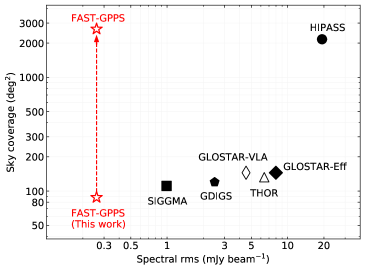
In the last decade, large radio telescopes have conducted several modern RRL surveys. Alves et al. (2010, 2015) analyzed the H166168 RRLs recorded in the H i Parkes All-Sky Survey (HIPASS, Barnes et al., 2001). The HIPASS data of RRLs cover a Galactic longitude range of 164 and a latitude range of , with a spatial resolution of 144 and a sensitivity of 6.4 mJy beam-1 at a velocity resolution of 20 km s-1. It has the largest sky coverage of more than 2 000 square degrees. The data can be used for the studies of large H ii regions and diffuse ionized gas. The Survey of Ionized Gas of the Galaxy Made with the Arecibo telescope (SIGGMA, Liu et al., 2013, 2019) observed the H163174 RRLs towards the Galactic plane of , and , with a spatial resolution of 6′ and a sensitivity of 0.65 mJy beam-1 at a velocity resolution of 5.1 km s-1. It is a sensitive RRL survey for discrete objects. The H i, OH, Recombination line survey of the Milky Way (THOR, Wang et al., 2020; Beuther et al., 2016) observed the Galactic longitude range of and with the VLA in band, including 19 H RRLs. THOR has a sensitivity of about 3.0 mJy beam-1 at a velocity resolution of 10 km s-1. Its high spatial resolution of about 067 is most suitable for measuring the compact sources. The GBT Diffuse Ionized Gas Survey (GDIGS, Anderson et al., 2021) is a project to observe RRLs in the Galactic longitude range of , and at band (48 GHz), with some extensions along the Galactic latitude directions for some selected fields, such as the star-forming complex W 43. The sensitivity of the GDIGS is about 10.3 mK at a velocity resolution of 0.5 km s-1 for the H transitions, and the spatial resolution is about 265. The GDIGS is a sensitive survey for both H ii regions and diffuse ionized gas at band. The GLOSTAR survey (Brunthaler et al., 2021) aims to cover the Galactic plane in the range of , and , at band with the VLA (GLOSTAR-VLA) and the Effelsberg 100-m telescope (GLOSTAR-Eff), including 7 and 24 RRLs in the VLA and Effelsberg observations, respectively. The first results of the GLOSTAR survey for the Galactic longitude range of have been presented by Brunthaler et al. (2021).
Obviously, the RRLs have attracted many attentions in the last few years, since the properties of diffuse ionized gas in a large portion of the Galactic disk have not been well observed.
1.3 Peering into the interstellar medium by FAST
A systematic survey of RRLs with a high sensitivity, a good spatial resolution and extensive sky coverage will significantly improve our understanding on the diffuse ionized interstellar gas (e.g., Anderson et al., 2021), which is currently a major omission among the multi-phases of the ISM.
The Five-hundred-meter Aperture Spherical radio Telescope (FAST) is the largest single-dish telescope in the world, with an illuminated aperture of 300-m in diameter (Nan et al., 2011). With the -band 19-beam receivers covering the observational band of 10001500 MHz (Jiang et al., 2019, 2020), it is a powerful equipment to observe pulsars (Han et al., 2021), H i line (Hong et al., 2022) and RRLs. The Galactic Plane Pulsar Snapshot (GPPS) survey aims to make the most sensitive systematic search for pulsars within the Galactic latitude of 10∘ of the Galactic plane visible by the FAST (Han et al., 2021) within an angle of originally from the zenith but now extended to . The GPPS survey observations are conducted by using the snapshot mode. A single snapshot contains four nearby pointings of the 19 beams, 5-minute integration time for each pointing, together with three quick position switches done in some seconds. It consumes 21 minutes in total for a cover. The four pointings of the 19 beams fully cover a sky area of 0.1575 square degrees (see Figure 4 in Han et al., 2021). The GPPS survey speed can be set to about 3 to 3.5 hours per square degree if we add the slewing time of 10 minutes for each cover. This high efficiency usage of the telescope time is crucial for a large-area survey.
With the digital spectroscopy backend connected to the -band 19-beam receiver, the piggyback spectral line data in the band of 10001500 MHz are recorded simultaneously during the GPPS survey. The high sensitivity due to the huge collecting area of FAST and the 5-minute integration time for each beam, together with an excellent spectral resolution (channel spacing 0.477 kHz), make the spectral line data from the GPPS survey valuable to reveal the characteristics of interstellar ionized gas.
This paper series is dedicated to investigations of the interstellar medium by FAST. The first paper is presented by Hong et al. (2022) for the piggyback H i data recorded in the GPPS survey. This is the second paper. In the third paper by Xu et al. (2022), the magnetic fields in the Galactic halo and farther spiral arms are revealed by new measurements of Faraday effect of a large sample of pulsars observed mostly by the GPPS survey. The FAST scan observations for radio continuum emission have been made to a sky region for the identification of two large supernova remnants as presented by Gao et al. (2022) in the fourth paper.
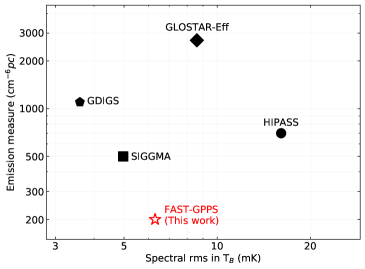
By using the piggyback spectral line data obtained during the GPPS survey (Han et al., 2021), we aim to obtain the data cubes of H RRLs, and we will also work on He, C, H and H RRLs in the future (see Table 1). The sensitivity of the GPPS H RRL observations is compared with previous surveys as shown in Figure 1. In this paper, we publish the H RRL map in the area covering and . In Sect. 2, we describe the observation status and the data processing for the RRLs of the FAST GPPS survey. Results on RRLs are presented and discussed in Sect. 3. The conclusions and discussions are given in Sect. 4.
2 Processing the RRL data of the GPPS survey
As one of five FAST key science projects approved by the FAST science committee at the end of 2019, the GPPS survey222http://zmtt.bao.ac.cn/GPPS/ aims to hunter for pulsars in all accessible sky by FAST with a Galactic latitude in the range of , and the highest priority is given to the inner Galaxy with (see Han et al., 2021, for details). The survey formally started in February 2020. Some test observations were made in 2019. The main observational parameters of the survey are listed in Table 2.
Observations for the GPPS survey are conducted by using the snapshot mode, in which four adjunct pointings are finely adjusted by a step of , the same as the size of the -band receiver beams, to fully cover a sky patch of 0.1575 square degrees, and nearby covers can also be joined together. That is to say, the sky region so observed is fully covered though not Nyquist sampled with the telescope beam size. In each of the four pointings, all 19 beams track the given positions in the sky for 5 minutes, which ensures the great sensitivity of observations.
| FAST GPPS survey | Parameter value |
|---|---|
| Galactic longitude range | , |
| Galactic latitude range | |
| Observed frequency range | 10001500 MHz |
| Effective frequency range | 10501450 MHz |
| Beam size | |
| Integration time | 5 minutes |
| Channel number | 1024 K |
| Polarization products | XX, YY, X∗Y, XY∗ |
| Sampling time | 1 s |
| This first RRL data release | Parameter value |
| Sky coverage | , |
| RRLs analyzed | H183H165 |
| LSR velocity range | km s-1 to km s-1 |
| Channel spacing | 2.2 km s-1 |
| Typical spectral rms noise | 0.25 mJy beam-1 (6.3 mK ) |
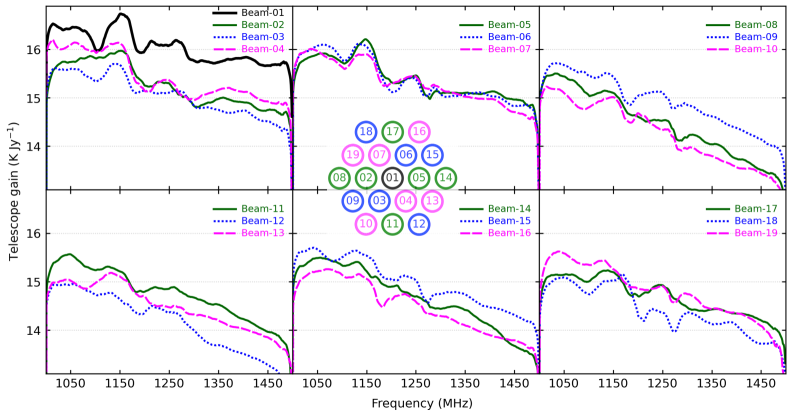
Each observation session consists of observations for many snapshot covers, often lasting for 2 to 4 hours. A periodical reference signal with an amplitude of about 1 K is injected in advance of some snapshot covers, typically before the first cover, in the middle and after the last cover, which ensures the spectral line data can be reliably calibrated. The gains of the FAST -band 19-beam receiver (see Figure 2) are stable over a few hours, typically with a fluctuation of only a few percent (Jiang et al., 2020).
During the FAST GPPS survey, four polarization products (XX, YY, X∗Y, XY∗) of spectral lines are simultaneously recorded for all of the 19 beams. The accumulating time of spectral data for recording is 1 second. The raw spectral data have 1 024 K channels covering the band of 10001500 MHz, which corresponds to a channel width of about 0.477 kHz or a velocity resolution of about 0.10 km s-1 for the H i line at 1420 MHz. Though the system gains at the edges of the band outside 1050 MHz and 1450 MHz are degraded (see Figure 2), the spectral data there can still be calibrated and useful.
The GPPS piggyback RRL data will be fully processed and gradually released, relying on the GPPS survey progress that in practice depends on the tight FAST observation schedule.
In the following, we describe the data processing for the H RRLs. The flowchart is shown in Figure 3.
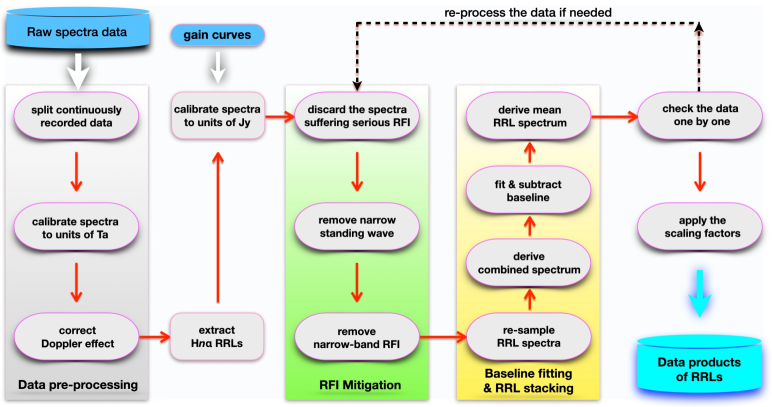
2.1 Pre-processing of the raw data
The pre-processing of the raw spectral data acquired by the snapshot observation generally includes three steps (see Hong et al., 2022, for details): (1) splitting the continuously recorded data into FITS files for every pointing of each beam, which contain the full polarization information XX, YY, X∗Y, and XY∗, resulting in 76 FITS files for one snapshot covering a sky area of 0.1575 square degrees; (2) calibrating the XX and YY products to the units of antenna temperature by using the scales obtained from the periodically injected reference signal. Then, the power values of XX and YY are added to get the spectrum of total intensity; (3) correcting the velocity to the local standard of rest (LSR) frame. In this stage, the pre-processed spectral data are downgraded from 1024 K channels to 64 K channels to enhance the signal-to-noise ratio of RRLs, which corresponds to a channel width of 7.813 kHz or a velocity resolution of about 2.2 km s-1 at 1064.037 MHz (H183). This velocity resolution is good enough to depict the profiles of strong RRLs, since the typical RRL widths (full-width at half maximum, FWHM) is about 25 km s-1 (e.g., Anderson et al., 2021).
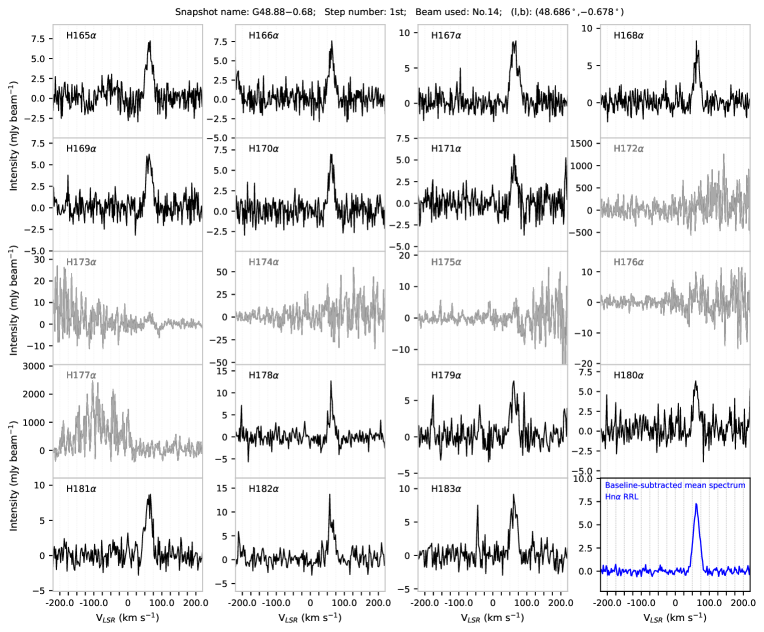
Subsequently, we extract 19 H RRLs from a pre-processed spectrum, including H at a rest frequency of 1064.307 MHz to the H at 1450.716 MHz, and convert the scale from the units of to the flux density unit of Jy according to the averaged telescope gain curves (Figure 2). Based on the long-term monitoring of the standard flux density calibrators of 3C 138 and 3C 286, variations of the telescope gain curves are found to be generally less than 10% (e.g., Gao et al., 2022). In this first data release, we adopt an averaged gain curve for each of the 19 beams as shown in Figure 2, and extract a median correction factor in the corresponding VLSR range of km s-1 to km s-1 for a RRL of a given beam, then apply it to the RRL spectrum. The calibrated RRL spectra (see examples in Figure 4) are used in the following analysis.
2.2 Mitigation of the radio frequency interference
In some frequency channels (e.g., 1175, 1207, 1270, and 1480 MHz), there always exist strong and broad-band ( 1 MHz) radio frequency interference (RFI) signals caused by satellites and/or civil aviation (e.g., Jiang et al., 2020; Zhang et al., 2022), and some narrow-band RFI signals occasionally emerge in some channels. In addition, the observed spectra are always contaminated by the standing waves of about 1 MHz, and occasionally by the RFI with fluctuations of about 0.04 MHz, though the standing waves only have about 0.3% in amplitude for the 19-beam system (Jiang et al., 2020). In this paper, we fit and subtract the band-pass profile with the asymmetrically re-weighted penalized least squares smoothing (ArPLS) algorithm (Baek et al., 2015; Zeng et al., 2021), which was developed for the baseline correction in the spectral analysis. Different approaches were tested to deal with the complex band-pass profiles of the GPPS spectra (e.g. higher-order polynomial, sinusoidal baseline-fitting), and the ArPLS algorithm (Baek et al., 2015; Zeng et al., 2021) is found to be currently the most optimal solution for a good baseline fitting and standing waves removal (see also Hong et al., 2022).
The RFI mitigation in the data processing includes three steps: (1) discarding the RRL spectra suffering from severe RFI. The output from the ArPLS fitting (Baek et al., 2015; Zeng et al., 2021) is the spectrum with RFI. We first calculate the rms values for the spectra of H165 167 RRLs which are almost free from strong RFI. The line-free channels for calculating the spectral rms are approximately between the VLSR ranges of to km s-1 and to 200 km s-1. Then, any RRL spectra with a rms five times larger than the median rms of the H165 167 are discarded since they are RFI contaminated, especially H172 177 as shown in Figure 4. (2) removing RFI with fluctuations of about 0.04 MHz mainly for the spectra recorded by beams No. 08 and No. 02 before March 02, 2022. They result in a larger spectral rms value (typically around 0.4 mJy) and influence the identifications of weak RRLs. This narrow RFI signature can be easily identified from the discrete Fourier transform of the observed spectra, then it will be removed and replaced by interpolation. The data are then transformed back to form the corrected spectra. (3) removing the narrow-band RFI. For each of the RRL spectra, a median filter with a kernel size of 9 channels is applied to a spectrum, then the spectral channels with values greater than 5 times the spectral rms relative to the median value are masked and replaced by interpolation. In some difficult cases, a different method for removing the narrow-band RFI was also applied to the spectra for a comparison: we fit and subtract the band-pass profile with the ArPLS algorithm, and the spectral channels with a value greater than 3.5 times of the rms level are discarded.
After these steps, most RFI has been removed although weak RFI signals may still be left in some of the RRL spectra. The cleaned RRL spectra are then used for stacking in the following steps.
2.3 Baseline fitting and RRL stacking
In the normal observations of spectral lines, an “off-source” reference spectrum is often needed to eliminate the complex band-pass profile of the “on-source” spectrum in order to better identify the weak signals of spectral lines. Being different from the position-switching, beam-switching, or “on-the-fly” mapping modes commonly adopted in spectral line observations, the GPPS survey does not have “off-source” integration during the snapshot observations, which would be very time-consuming otherwise. It is always difficult to find a reasonable clean “off-source” reference spectrum of a beam from the GPPS data to perform the traditional “on-off” subtraction because of that: (1) many of the RRL sources are much extended compared to the telescope beam size; (2) the four sequential pointings of a certain beam in a snapshot are adjacent to each other in their targeted positions in the sky, looking like one “on” with three “off”, but for such diffuse emission of ionized gas, this does not help much; (3) the response and band-pass properties of different beams have their own characteristics, as shown in Figure 2, and therefore cannot be used in mixture. In addition, the band-pass is also very diverse for different RRL frequencies.
With the development of instruments in recent years, such an “off” reference spectrum may not be essential for spectral line observations, because modern radio telescopes have good stability of the band-pass. Instead of performing the traditional “on-off” subtraction, the narrow spectral lines can be reliably identified and calibrated merely from the “on-source” integration spectrum alone after a baseline fitting and removal (e.g., Pagani et al., 2020), so that the observing efficiency can be significantly improved. This approach has been tested and found to be applicable to the piggyback spectral line data of the FAST GPPS survey.
The RRL stacking has been widely used in various studies to improve the observation sensitivity and survey efficiency (e.g., Balser, 2006; Alves et al., 2015; Wang et al., 2020; Liu et al., 2019; Anderson et al., 2021). Because the RRLs in the FAST observation band are very weak in nature, it would be very time-consuming to accumulate only one RRL to a high signal-to-noise ratio. For the concerned -band RRLs, H to H, the RRL intensity is expected to differ by less than 30% without considering the beam size effects (Equation A7 of Anderson et al., 2021). As these RRLs originate from the same astronomical sources, their line widths and velocities should resemble each other. In the first order approximation, it is reasonable to average all detectable RRLs to get a mean spectrum, which can significantly improve the signal-to-noise ratio.
In the practical data processing of the piggyback spectral lines of the GPPS survey, two slightly different approaches have been tested.
In the first approach, the baseline of each usable RRL spectra with the 5-minute integration of each beam was fitted and subtracted. Then the RRL spectra are re-sampled with a velocity resolution of 2.2 km s-1, and added together to derive a mean spectrum. We noticed that the averaged spectra sometimes show visible pits near the line-wing regions caused by the overestimates of the baseline level. Though the pit is almost negligible for a single RRL spectrum, but it becomes significant after adding all RRL spectra. Therefore this approach is not optimal for processing the RRL data.
A modified method is developed. We make data stacking for these RRLs first and then do the baseline fitting and removal. The modified method consists of four steps: (1) re-sampling all usable RRL spectra with the same velocity resolution of 2.2 km s-1 which is the value for H; (2) adding all re-sampled spectra together to generate a combined spectrum, with the weighting factor of integration time; (3) fitting and subtracting the baseline with the ArPLS algorithm (Baek et al., 2015; Zeng et al., 2021), so that the broader standing waves (1 MHz) mentioned in Jiang et al. (2020) can be naturally removed in this step; (4) deriving a mean spectrum of RRLs. In this step, the baselines around each RRL are not modified. The baseline of the combined spectrum has a much higher signal-to-noise and can be fitted and removed more easily. In addition, the systematic dip occasionally seen with the first method disappears.
The modified method is also applied separately to the first eight (H to H) and the remaining 11 RRL spectra (H to H), to derive two sets of averaged RRL spectra. If the signatures of two spectra are consistent, they are taken as a reliable detection. Otherwise, the inconsistency must be caused by the residual RFI after the mitigation and all RRL data must be re-processed.
2.4 Calibration and systematical uncertainties
In the calibration of the intensity scale from to Jy with respect to the standard flux calibrators of 3C 286 and 3C 138, we adopted the averaged gain curves from the real FAST observations. The relative uncertainties in principle are small, while we have to estimate the uncertainty of absolute scales.
Two methods of calibration have been involved in data processing. The first is using the periodically injected reference signal to convert the XX and YY polarization products to the intensity units of . The noise diode in the signal path of the FAST 19-beam system has temperature fluctuations on the order of 1% over several hours (Jiang et al., 2020). The gain fluctuations of the -band 19-beam system are typically on the order of a few percent over a timescale of a few minutes and less than about 4% over several hours (Jiang et al., 2020). The uncertainties induced by the injection of the reference signal as well as the long term fluctuations of the system gain curves, could cause an overall uncertainty for the absolute RRL intensity of less than 10%.
The H i data recorded by the FAST GPPS survey have also been processed by Hong et al. (2022). The H i results of the GPPS survey have been compared with those of the Effelsberg-Bonn H i Survey (Winkel et al., 2016). Despite the not-yet-corrected stray radiation, the systematical differences in intensity scales between different FAST snapshot observations and between different beams of the 19-beam receivers have been noticed. It is probably caused by different characteristics of the long term fluctuations of the system gain curves for different beams. The comparison of the FAST GPPS H i results with those of the Effelsberg-Bonn H i Survey (Winkel et al., 2016) gives the correction factors for different beams in different covers. After the corresponding scale factors are applied, the final results are compared again and found to be consistent within 3%. These correction factors are also adopted in this work to the data products of H RRLs.
3 Results
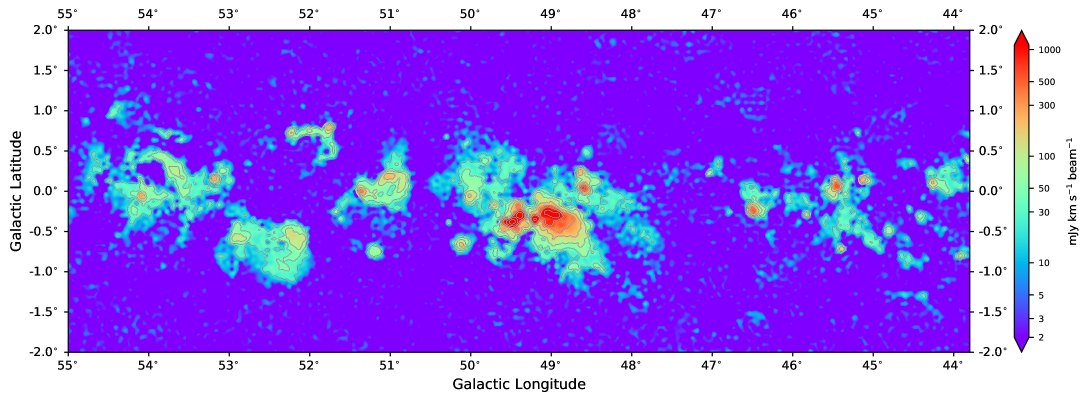
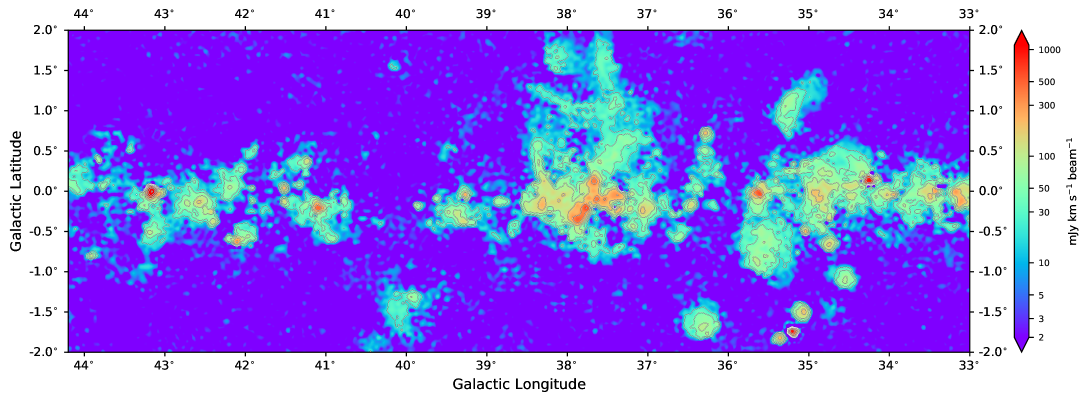
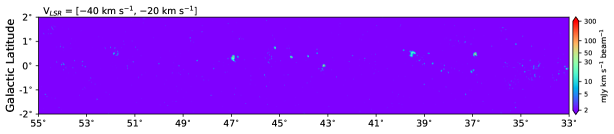
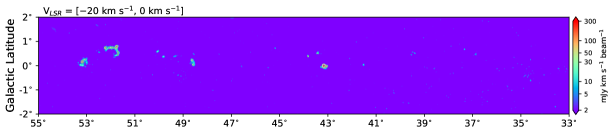
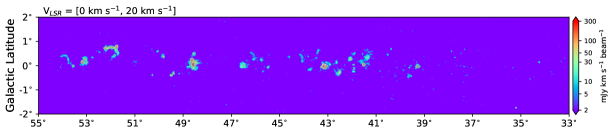
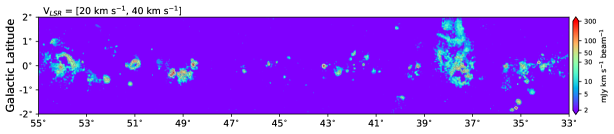
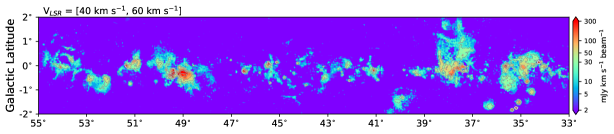
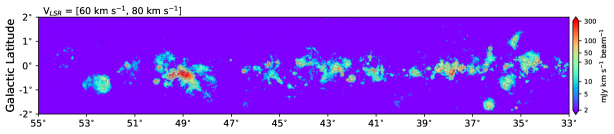
The GPPS survey piggyback line data in the area of Galactic longitude and latitude have been processed. More than 43 000 averaged spectra of H RRLs are obtained. The derived RRL spectra have been visually checked one by one to ensure the correctness of data processing. The velocity-integrated intensity map is shown in Figure 5, which is summed from km s-1 to 120 km s-1 of the H RRL spectra. More detailed channel maps are shown in Figure 6.
In the map there are complex structure features dominated by a number of H ii regions as well as diffuse ionized gas. Several well-known and large star-forming complexes are prominent in the map, for example, W 51 around () (, ), W 49 around () (, ) and W 47 around () (, ). Beside the discrete H ii regions, the diffuse component of ionized gas are widely distributed, for example, towards a higher latitude region of in the Galactic longitudes around .
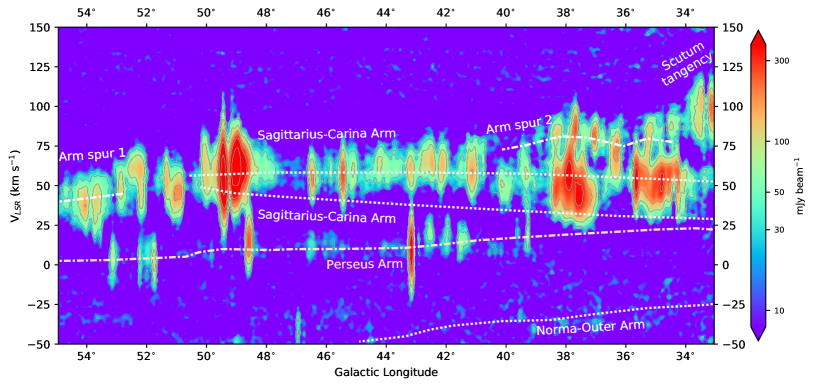
The global distribution and the dynamics of the Galactic ionized gas associated with star formation regions can be used to trace the spiral structure. The longitude–velocity diagram of the RRL data is shown in Figure 7, with indications of spiral arms in the model of Reid et al. (2019). The detected RRL features are primarily related to the Sagittarius-Carina Arm, the Perseus Arm, as well as two arm spurs. One arm spur is located between the Perseus Arm and the Sagittarius Arm, and the other is located between the Sagittarius Arm and the Scutum Arm. The RRL data also cover part of the Scutum tangency region. Some RRL clouds possess a negative velocity, indicating that they are located at very distant spiral arms in the outer Galaxy, i.e. with a Galactocentric distance larger than the solar orbit.
In the map shown in Figure 5, the noise level is generally uniform, except for some regions associated with relatively strong continuum emission in the bright H ii regions of G34.256+0.136 and G45.453+0.045, in the star-forming complexes of W 51 and W 49, and in supernova remnants of W 44 around () (, ), W 49b around () (, ), G39.200.3 (or 3C 396) and G49.20.7.
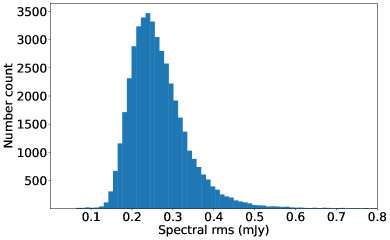
The rms values for the RRL spectra are calculated from the line-free channels approximately between the ranges of to km s-1 and to 200 km s-1 with a spectral resolution of 2.2 km s-1. The distribution of spectral rms values from all beams in the processed sky area is shown in Figure 8. The extension of the peak is partially caused by the RFI affected channels or other factors such as the stability of the focus cabin. The tail in the higher end is primarily caused by bright continuum radio sources. The typical spectral rms is about 0.25 mJy beam-1, estimated by a Gaussian fitting to the rms distribution. The rms value can be compared with other RRL surveys at band, which is about 26% of the rms level of the Arecibo SIGGMA survey (Liu et al., 2019), about 4.1% of that of the VLA THOR survey (Wang et al., 2020), and about 1.3% of the Parkes HIPASS survey (Alves et al., 2015), if these values are calculated in the same spectral resolution of 2.2 km s-1 (see Figure 1). In other words, the FAST RRL observation sensitivity is about 4 times better than the SIGGMA survey, and 20 times better than the THOR survey.
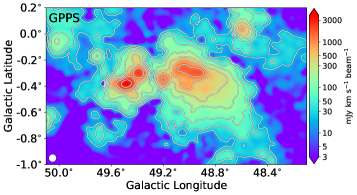
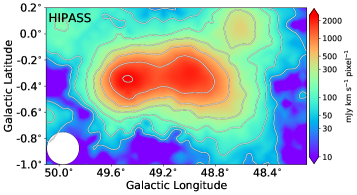
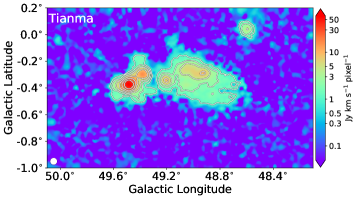
The sensitivity of the FAST GPPS RRL survey can also be expressed by the main-beam brightness temperature and the emission measure (EM). The brightness temperature is related to the flux density via . Here, is the wavelength at an averaged frequency of about 1.24 GHz for the FAST RRLs, is the flux density, is the Boltzmann constant, and is the beam solid angle. By assuming a Gaussian beam, the relation can be simplified as , where is the half-power beam width for the FAST RRL observations. We get mK for the main-beam brightness temperature for the GPPS H RRL sensitivity, as shown in Figure 1. The brightness temperature sensitivity for other RRL surveys are estimated through the same method with the adopted values of mean observation frequency and as being 1.40 GHz and for HIPASS, 1.37 GHz and for SIGGMA, 5.76 GHz and for GDIGS, and 5.92 GHz and for GLOSTAR-Eff, respectively. To estimate the physical units of emission measure, EM = , for the RRL surveys with single-dish telescopes, we follow the equations (A4) to (A7) given in the appendix of Anderson et al. (2021) and the procedures described in their Sect.2.6. Here, is the electron density, is the path length. The plot for versus EM of all surveys is given in Figure 1, including the GBT GDIGS project at band (Anderson et al., 2021) which has the lowest spectral rms in ( 3.6 mK) among the discussed RRL surveys. The RRL map from the piggyback data of the FAST GPPS project is currently the most sensitive at band, down to an emission measure of about cm-6 pc. Therefore it has the advantage to detect very low electron density regions, see an example region in Figure 9.
In the following, we discuss some details of the Galactic H ii regions and the distribution of diffuse ionized gas.
| H ii region | Radius | V | Ref. | Peak intensity | VLSR | FWHM | rms | S/N | ||
|---|---|---|---|---|---|---|---|---|---|---|
| (′′) | (km s-1) | (mJy beam-1) | (km s-1) | (km s-1) | (mJy beam-1) | |||||
| (1) | (2) | (3) | (4) | (5) | (6) | (7) | (8) | (9) | (10) | (11) |
| G33.0510.078 | 33.051 | 0.078 | 466 | 93.8 | 8 | 6.8 0.2 | 95.3 0.3 | 26.3 0.8 | 0.43 | 15.9 |
| G33.080+0.073 | 33.080 | 0.073 | 110 | 86.9 | 1 | 7.7 0.1 | 90.8 0.3 | 28.0 0.6 | 0.37 | 20.9 |
| G33.1760.015 | 33.176 | 0.015 | 185 | 105.8 | 12 | 20.1 0.2 | 100.2 0.2 | 28.6 0.4 | 0.59 | 34.0 |
| G33.2050.012 | 33.205 | 0.012 | 64 | 105.8 | 12 | 14.3 0.2 | 101.1 0.2 | 27.3 0.4 | 0.46 | 31.1 |
| G33.263+0.067 | 33.263 | 0.067 | 42 | 98.3 | 1 | 2.0 0.1 | 103.5 0.8 | 23.8 1.8 | 0.31 | 6.5 |
| G33.4190.004 | 33.419 | 0.004 | 60 | 76.5 | 8 | 8.9 0.2 | 73.6 0.9 | 36.3 1.9 | 0.56 | 16.1 |
| G33.6430.228 | 33.643 | 0.228 | 42 | 102.9 | 1 | 2.9 0.1 | 104.1 0.5 | 21.1 1.2 | 0.31 | 9.5 |
| G33.7150.415 | 33.715 | 0.415 | 89 | 53.3 | 1 | 3.5 0.2 | 53.0 0.5 | 17.5 1.1 | 0.37 | 9.4 |
| G33.7530.063 | 33.753 | 0.063 | 42 | 101.7 | 1 | 5.3 0.1 | 100.2 0.3 | 22.5 0.7 | 0.32 | 16.5 |
| … | … | … | … | … | … | … | … | … | … | … |
-
1
Notes. The entire version in a machine-readable format is available at the webpage: http://zmtt.bao.ac.cn/MilkyWayFAST/. Column 1 is the source name; Cols. 2, 3 and 4 are the Galactic longitude, Galactic latitude and radius given in the WISE catalogue of H ii regions and candidates (Anderson et al., 2014); Col. 5 is the VLSR velocity measured in the reference given in Col. 6. Ref.1 = Anderson et al. (2011); Ref.2 = Anderson et al. (2015a); Ref.3 = Anderson et al. (2015b); Ref.4 = Anderson et al. (2018b); Ref.5 = Araya et al. (2002); Ref.6 = Balser et al. (2011); Ref.7 = Bania et al. (2012); Ref.8 = Lockman (1989); Ref.9 = Lockman et al. (1996); Ref.10 = Quireza et al. (2006); Ref.11 = Sewilo et al. (2004); Ref.12 = Watson et al. (2003); Cols. 7, 8, and 9 are the fitted peak intensity, VLSR velocity and line width (full-width at half-maximum) by this work, together with their 1 uncertainties; Col. 10 is the rms value of the averaged RRL spectrum; Col. 11 is the signal-to-noise ratio of the spectrum.
3.1 RRL emission from known H ii regions
Up to now, more than 2 000 Galactic H ii regions have RRLs detected (e.g., Downes et al., 1980; Wink et al., 1983; Caswell & Haynes, 1987; Lockman, 1989; Lockman et al., 1996; Bania et al., 2010, 2012; Anderson et al., 2018a; Wenger et al., 2019, 2021; Armentrout et al., 2021). In the area of and , the properties of Galactic H ii regions have been compiled by Paladini et al. (2003), Hou & Han (2014), Anderson et al. (2014) and Gao et al. (2019). Among them, the WISE (Wide-Field Infrared Survey Explorer) catalog (Anderson et al., 2014) provides the largest data set of the Galactic H ii regions and candidates because all H ii regions exhibit a good mid-infrared morphology: the 12m emission of an H ii region originates primarily from polycyclic aromatic hydrocarbon (PAH) molecules surrounding the extended 22m emission from hot dust, which is coincident with the ionized gas traced by radio continuum emission (e.g., see Deharveng et al., 2010; Anderson et al., 2011) and RRLs. The WISE catalog has more than 8 400 entries of the Galactic H ii regions and candidates, and lists their parameters of coordinates, radius, RRL and/or molecular line velocity if available from literature. This catalog is still being updated, and the most recent version has been released in December 2020.
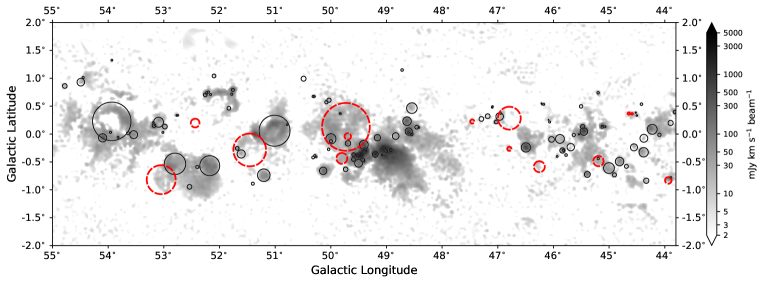
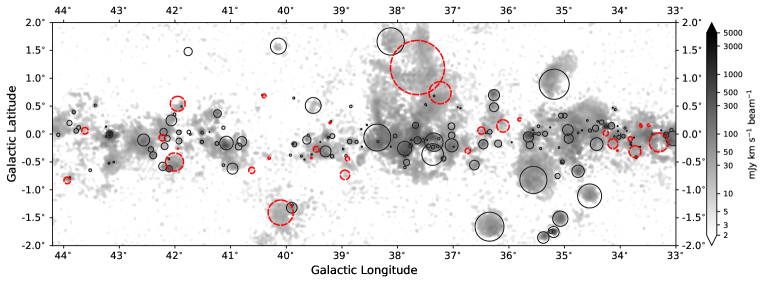
In the sky area of 95 and , excluding the edges of images shown in Figure 5, there are 1038 discrete sources in the WISE catalog for H ii regions and candidates. The velocities of 333 RRLs, VLSR, have been detected and reported for 322 H ii regions, since some H ii regions have two or three velocity components. Among them, 312 RRLs (94%) for 302 H ii regions have been detected from the piggyback spectral line data of the GPPS survey, as marked by solid line circles in Figure 10.
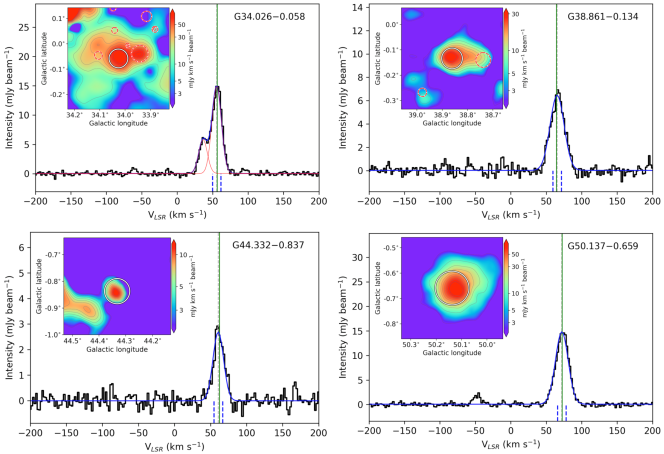
Examples of line profiles for 4 H ii regions are shown in Figure 11. In our RRL detection for some H ii regions, such as G34.0260.058 in Figure 11, some new RRL components are often detected from the piggyback spectral data of the GPPS survey but were not listed in the references. They are probably produced from foreground or background diffuse ionized gas along the line of sight towards an H ii region, and may be missed in the traditional “on-off” subtraction procedure. The line processing method for the FAST GPPS survey piggyback data has the advantage to detect weak and extended emission from the Galactic ionized gas.
Note, however, that 21 RRL components from known H ii regions reported in the references are not detected in this work: the ultracompact H ii region G33.1340.093, G33.1420.087 and G41.740+0.096 observed by Araya et al. (2002) with the Arecibo at 4.874 GHz (H); the H ii region G34.1970.593, G34.1980.591, G37.754+0.560, G37.820+0.414, G38.875+0.308, and G39.8830.346 measured by Anderson et al. (2011) with the GBT at band (9 GHz); the distant H ii region (VLSR 0.0 km s-1) G39.1831.422, G41.810+1.503, G42.058+1.002, G43.968+0.993, G44.000+0.979, G52.002+1.602, G54.094+1.748, and G54.491+1.579 detected by Anderson et al. (2015a) with the GBT at band (9 GHz); G41.6590.019 measured by Bania et al. (2012) with the Arecibo telescope at band (9 GHz); the ultracompact H ii region G43.7930.121 and G43.7940.129 observed by Watson et al. (2003) with the Arecibo at 4.874 GHz (H); the V km s-1 component of G45.8830.087, detected by Anderson et al. (2018a) with the GBT at band (48 GHz). These RRL components were mostly detected at a higher frequency and are probably too weak or too compact at band to be detected in the GPPS observations. It is also possible that the most compact H ii regions are optically thick at the observation frequencies of the FAST GPPS survey.
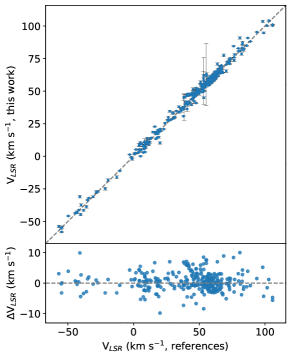
The line profiles are fitted with Gaussian component(s) to derive the VLSR velocities and other parameters, as listed in Table 3. We compare the FAST-obtained RRL velocities of the 312 line components with the corresponding values in the references, and they are very consistent as shown in Figure 12.
| H ii region | Peak intensity | VLSR | FWHM | rms | S/N | Mark | |||
|---|---|---|---|---|---|---|---|---|---|
| (mJy beam-1) | (km s-1) | (km s-1) | (mJy beam-1) | (kpc) | |||||
| (1) | (2) | (3) | (4) | (5) | (6) | (7) | (8) | (9) | (10) |
| G33.3070.150 | 33.307 | 0.150 | 3.7 0.4 | 54.5 0.7 | 14.7 1.7 | 0.57 | 6.6 | far | 10.5 |
| G33.487+0.159 | 33.487 | 0.159 | 1.9 0.2 | 27.7 1.1 | 18.3 2.6 | 0.53 | 3.6 | far | 11.9 |
| G33.626+0.143 | 33.626 | 0.143 | 2.2 0.6 | 27.8 1.3 | 9.1 3.1 | 0.61 | 3.6 | far | 11.9 |
| G33.636+0.174 | 33.636 | 0.174 | 3.0 0.2 | 31.0 0.7 | 16.9 1.6 | 0.32 | 9.6 | far | 11.7 |
| G33.7350.315 | 33.735 | 0.315 | 8.1 0.4 | 50.7 0.4 | 18.5 1.0 | 0.80 | 10.2 | far | 10.7 |
| G33.8180.086 | 33.818 | 0.086 | 1.4 0.5 | 31.2 0.9 | 4.9 2.1 | 0.31 | 4.6 | far | 11.7 |
| G34.0500.297 | 34.050 | 0.297 | 1.1 0.1 | 49.8 1.5 | 22.5 3.6 | 0.30 | 3.6 | far | 10.7 |
| G34.1310.173 | 34.131 | 0.173 | 11.7 0.4 | 48.3 0.6 | 15.7 1.2 | 0.71 | 16.5 | far | 10.7 |
| G34.259+0.015 | 34.259 | 0.015 | 2.2 0.6 | 33.8 0.9 | 6.9 2.1 | 0.48 | 4.5 | out | 16.5 |
| G35.809+0.262 | 35.809 | 0.262 | 1.0 0.1 | 61.5 1.1 | 18.4 2.7 | 0.22 | 4.5 | far | 9.7 |
| G36.106+0.146 | 36.106 | 0.146 | 9.9 1.2 | 92.8 0.7 | 11.6 1.7 | 2.62 | 3.8 | — | — |
| G36.495+0.062 | 36.495 | 0.062 | 7.8 0.3 | 69.9 0.4 | 23.5 1.0 | 0.54 | 14.4 | far | 9.1 |
| G36.7380.301 | 36.738 | 0.301 | 7.7 0.4 | 80.7 0.3 | 11.5 0.7 | 0.58 | 13.3 | near | 4.8 |
| G37.237+0.741 | 37.237 | 0.741 | 11.8 0.3 | 42.2 0.2 | 16.4 0.4 | 0.63 | 18.7 | far | 10.5 |
| G37.643+1.193 | 37.643 | 1.193 | 2.7 0.2 | 37.8 0.7 | 17.2 1.6 | 0.47 | 5.8 | near | 2.3 |
| G38.9010.443 | 38.901 | 0.443 | 1.2 0.3 | 46.7 1.7 | 15.8 4.0 | 0.33 | 3.7 | near | 2.9 |
| G38.9450.732 | 38.945 | 0.732 | 3.4 0.3 | 83.7 0.6 | 16.1 1.4 | 0.53 | 6.5 | — | — |
| G39.214+0.202 | 39.214 | 0.202 | 0.8 0.1 | 25.5 1.2 | 16.8 2.8 | 0.24 | 3.5 | out | 14.6 |
| G39.4620.273 | 39.462 | 0.273 | 17.9 0.2 | 63.8 0.2 | 25.0 0.4 | 0.50 | 35.7 | far | 8.8 |
| G39.5490.427 | 39.549 | 0.427 | 1.8 0.1 | 17.7 0.9 | 28.7 2.1 | 0.24 | 7.4 | far | 11.5 |
| G40.1001.409 | 40.100 | 1.409 | 9.5 0.5 | 48.3 0.4 | 16.4 1.0 | 1.07 | 8.8 | near | 3.0 |
| G40.3060.432 | 40.306 | 0.432 | 1.8 0.1 | 68.8 1.0 | 24.4 2.3 | 0.32 | 5.5 | near | 4.3 |
| G40.399+0.683 | 40.399 | 0.683 | 2.5 0.3 | 10.0 0.6 | 12.3 1.5 | 0.50 | 5.0 | near | 0.6 |
| G40.6200.650 | 40.620 | 0.650 | 2.4 0.2 | 70.2 0.8 | 20.0 1.9 | 0.36 | 6.8 | — | — |
| G41.9480.261 | 41.948 | 0.261 | 2.5 0.1 | 14.0 0.6 | 19.3 1.3 | 0.30 | 8.1 | far | 11.3 |
| G41.950+0.543 | 41.950 | 0.543 | 6.3 0.2 | 24.8 0.3 | 17.3 0.7 | 0.42 | 15.1 | far | 10.6 |
| G42.0070.500 | 42.007 | 0.500 | 11.6 0.4 | 67.4 0.4 | 19.3 0.9 | 1.09 | 10.6 | — | — |
| G42.2280.066 | 42.228 | 0.066 | 15.2 0.2 | 53.9 0.2 | 20.3 0.4 | 0.53 | 28.5 | near | 3.4 |
| G43.617+0.059 | 43.617 | 0.059 | 5.1 0.3 | 74.4 0.5 | 19.9 1.2 | 0.44 | 11.5 | tan | 6.0 |
| G43.9360.831 | 43.936 | 0.831 | 13.8 0.2 | 55.3 0.2 | 21.2 0.4 | 0.45 | 30.6 | near | 3.7 |
| G44.586+0.363 | 44.586 | 0.363 | 2.0 0.1 | 17.3 0.5 | 14.5 1.2 | 0.27 | 7.3 | far | 10.5 |
| G44.645+0.369 | 44.645 | 0.369 | 1.0 0.1 | 19.1 0.9 | 15.6 2.1 | 0.21 | 4.9 | far | 10.4 |
| G45.1910.485 | 45.191 | 0.485 | 6.5 0.2 | 67.2 0.4 | 26.3 1.0 | 0.55 | 11.8 | — | — |
| G46.2530.585 | 46.253 | 0.585 | 4.6 0.3 | 56.9 0.4 | 13.9 1.1 | 0.50 | 9.2 | — | — |
| G46.7920.264 | 46.792 | 0.264 | 4.7 0.3 | 50.5 0.6 | 19.2 1.5 | 0.73 | 6.4 | far | 7.7 |
| G46.792+0.285 | 46.792 | 0.285 | 7.5 0.5 | 52.8 0.7 | 23.0 1.7 | 1.33 | 5.6 | out | 15.5 |
| G47.459+0.225 | 47.459 | 0.225 | 2.8 0.2 | 56.4 0.6 | 17.6 1.5 | 0.42 | 6.6 | — | — |
| G49.6950.042 | 49.695 | 0.042 | 3.0 0.1 | 52.1 0.5 | 25.0 1.3 | 0.34 | 8.7 | — | — |
| G49.728+0.129 | 49.728 | 0.129 | 4.4 0.2 | 47.0 0.3 | 13.7 0.8 | 0.38 | 11.7 | near | 3.6 |
| G49.8010.436 | 49.801 | 0.436 | 6.8 0.2 | 61.6 0.3 | 24.2 0.8 | 0.46 | 14.6 | tan | 5.4 |
| G51.4570.285 | 51.457 | 0.285 | 6.9 0.6 | 57.7 0.6 | 14.9 1.5 | 1.38 | 5.0 | tan | 5.2 |
| G52.437+0.197 | 52.437 | 0.197 | 3.8 0.6 | 55.3 0.7 | 8.8 1.5 | 0.82 | 4.6 | tan | 5.1 |
| G53.0470.818 | 53.047 | 0.818 | 5.3 0.3 | 61.6 0.3 | 14.4 0.8 | 0.45 | 12.0 | tan | 5.0 |
-
1
Notes. Column 1 is the source name; Cols. 2 and 3 are the Galactic longitude and the Galactic latitude given by the WISE catalogue of H ii regions and candidates (Anderson et al., 2014); Cols. 4, 5, and 6 are the fitted peak intensity, VLSR velocity and line width (FWHM) by this work, together with their 1 uncertainties; Col. 7 is the rms noise of the RRL spectra for every object; Col. 8 is the signal-to-noise ratio of the RRL spectrum; Col. 9 is a mark for the kinematic distance ambiguity resolved by this work: near – the nearer kinematic distance is adopted; far – the farther kinematic distance is adopted; tan – the tracer is located at the tangential region and the distance to the tangent is adopted; out – the tracer is in the outer Galaxy outside the solar circle; Col. 10 lists the kinematic distance and its uncertainty calculated by using the program given by Reid et al. (2014).
3.2 New H ii regions and distant star-forming regions
In the concerned sky area of this paper, more than 710 candidates of H ii regions are listed in the WISE catalog (Anderson et al., 2014). We extract the H RRL spectra towards these candidates in order to verify their nature.
Considering the FAST beam of 3′, in order to obtain a reliable detection of RRL toward an H ii region candidate, we select relatively isolated targets, not contaminated by nearby H ii regions or candidates inside a FAST beam. In addition, to avoid the confusion of the RRLs from diffuse gas, the RRLs are obtained by spectra of the target subtracted by the mean reference spectrum towards some selected positions around the target. Then, the line profile is fitted. If the velocity-integrated intensity map within the 6 km s-1 around the fitted line center has an isolated feature, coincident with the position of the H ii region candidate inside the diameter, we take it as a good detection.
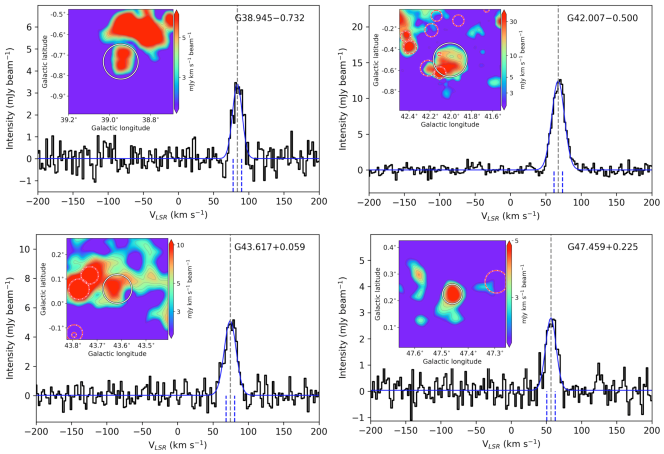
We get H RRLs of 43 H ii region candidates detected in the sensitive spectral data of the FAST GPPS survey, as marked in Figure 10. The line parameters for the 43 H ii regions are listed in Table 4, and all of them have a signal-to-noise ratio greater than 3.5 at the spectral resolution of 2.2 km s-1. Some examples of the line profiles with a velocity-integrated intensity map are shown in Figure 13.
The kinematic distances for 35 of the 43 H ii regions are estimated after resolving the kinematic distance ambiguity through a combination of the H i emission/absorption method and the H i self-absorption method (Hou & Gao, 2019). We adopt the program of Reid et al. (2014) to calculate the kinematic distances by using the Galactic dynamic model, taking the distance of the Sun to the Galactic center being 8.34 kpc, the circular orbital speed at the Sun being 240 km s-1, and the solar motion being km s-1 (radially inward towards the Galactic center), km s-1 (in the direction of Galactic rotation), and km s-1 (vertically upward towards the north Galactic pole) in J2000 (Reid et al., 2014). The distribution of these newly confirmed H ii regions is presented in Figure 14. They are primarily located in the Sagittarius-Carina Arm, the Perseus Arm, and the Norma-Outer Arm. A few of them seem to be related with the arm spur located between the Sagittarius Arm and the Scutum Arm.
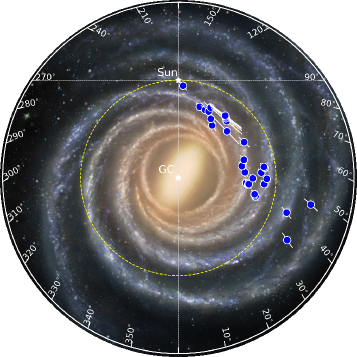
In the current survey area, at least seven extended RRL sources, e.g., G39.516+0.512 and G44.501+0.332, have been detected in the outer Galaxy, i.e. their Galactocentric distance larger than the solar circle in the first Galactic quadrant. At the kinematic distances greater than about 12 kpc from the Sun, their physical sizes are estimated to be 30100 pc, and are among the largest ones comparable to the star-forming complex W 51 in the inner Galaxy. Therefore, the piggyback spectral data of the FAST GPPS survey show its ability to detect such large H ii regions or star-forming complexes previously not known in the very distant outer Galaxy, the locations of which are valuable laboratories for studying the star formation process in a lower gas density and lower metallicity environment than in the inner Galaxy (e.g., Brand & Wouterloot, 2007; Shimonishi et al., 2021).
3.3 Diffuse ionized gas
The diffuse ionized gas is widely distributed in the Milky Way. It accounts for about 90% of the total mass of ionized gas in the Milky Way (Reynolds, 1991), playing an important role in the recycling of material in the Galactic ISM. The physical properties and origin of diffuse ionized gas have not been well understood (Anderson et al., 2021).
The existence of diffuse ionized gas in the Milky Way was first proposed by Hoyle & Ellis (1963). Though some diffuse ionized gas exists in the form of the low-density envelopes around individual H ii regions (e.g., Anderson et al., 2021; Anantharamaiah, 1985), most diffuse gas is far from well-defined H ii regions.
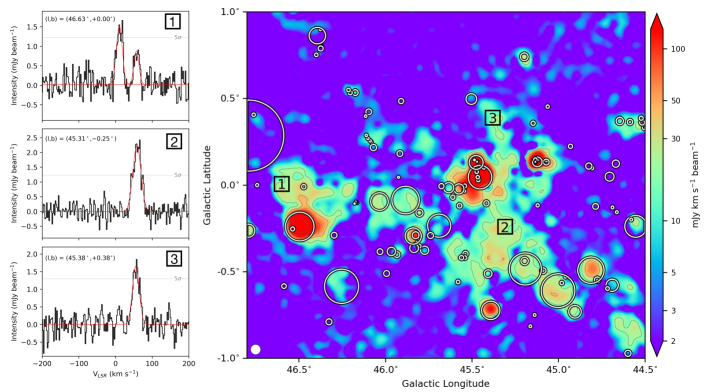
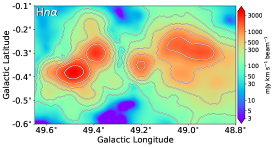
With the high sensitivity inherited in the snapshot observation mode, the piggyback spectral line data of the FAST GPPS survey provide the great advantage to detect the diffuse ionized gas in the Galactic plane. As discussed in Sect. 3, the H data products of the GPPS project are sensitive to emission measures down to 200 cm-6 pc if a 3 detection limit is required. As shown in Figure 15 for the Galactic longitude range of 8 and the Galactic latitude range of , we can detect the RRLs beyond the known H ii regions and H ii region candidates (Anderson et al., 2014). By using the WISE 12 m and 22 m survey images, the H ii region boundaries (e.g., Anderson et al., 2014; Deharveng et al., 2010) can be outlined. Most of the RRL emissions outside the known H ii regions and candidates, if not all, are from diffuse ionized gas. The emission measures for the four RRL components shown in the left panels of Figure 15 are about 1100, 700, 1800 and 1300 cm-6 pc, respectively. The features of diffuse ionized gas are prominent and even more complex in some other regions, such as around the star-forming complex W 51, W 49, and W 43.
4 Conclusions and discussions
The full FAST GPPS survey (Han et al., 2021) aims to hunter for faint pulsars in the Galactic plane with , , and that is visible to FAST. The piggyback spectral data recorded simultaneously during the survey observations are valuable resources for the RRL detection in the frequency range of 1000 1500 MHz for the Galactic H ii regions and diffuse ionized gas in the interstellar medium, which will improve our knowledge on the distribution, the origin and characteristics of the Galactic ionized gas, the star formation process and spiral structure.
We process the data and present the results for the H RRLs for a sky area of 88 square degrees in the inner Galaxy of and . The averaged H RRLs from the FAST snapshot mode observations with an integration time of 5-minute for each beam reach a great sensitivity of the typical rms noise of about 0.25 mJy beam-1 (or 6.3 mK ) at a spectral resolution of 2.2 km s-1, currently it is the most sensitive survey of RRLs at the band.
The RRL map of this sky region shows complex and abundant structural features for discrete H ii regions and diffuse ionized gas. Some large star-forming complexes in the inner Galaxy, such as W 51, W 49 and W 47 are prominent strong features in the map. The detected RRL emission are primarily related to two major spiral arms and two arm spurs. Among 322 known H ii regions, about 94% of them have been detected, and the measured line velocities of averaged RRLs are in good agreement with the values in literature. The undetected H ii regions are either too weak or too compact at band to be detected in the GPPS observations. We detected RRLs toward 43 H ii region candidates, confirming their nature as being H ii regions, increasing the sample by a factor of about 1/8. The spectral line data of the FAST GPPS survey have great advantage to detect and resolve large distant H ii regions or star-forming complexes even in the outer Galaxy, and can reveal diffuse ionized gas widely spread in the Galactic plane, which has not been well mapped previously.
As shown in Table 1, beside the H RRLs presented above, other kinds of RRLs have also been recorded in the observation band of the FAST GPPS survey, including 30 H, 34 H, 23 C and 23 He RRLs. The H, H and He RRLs are generally from the same sources as that of the H RRLs, but have much weaker line strengths. The FAST GPPS spectral line data can also provide a sensitive detection for the RRLs of H and H at band, which have seldom been studied previously.
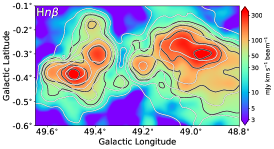
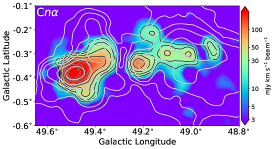
We processed the data for H and C RRLs for a small sample area around the star-forming complex W 51, and show the results in Figure 16. The H/H and/or H/H ratios will provide useful information about the physics of ionized gas, e.g., the situations of local thermodynamic equilibrium (LTE) or non-LTE. The Carbon RRLs are either from the photo-dissociation regions at the interface between H ii regions and their surrounded molecular clouds, the boundary between molecular clouds and the diffuse ISM, or from the regions within atomic H i clouds (e.g., Gordon & Sorochenko, 2002). Compared with the map of the H RRLs, the velocity-integrated intensity map of C RRLs in Figure 16 has peaks clearly offset from those of H RRLs, suggesting that the C and H RRLs originate from different regions inside the star formation complex. The data products of C RRLs as well as other kinds of RRLs are therefore also useful byproducts of the GPPS survey, which are under processing now and will be published in the future. The ionization energy for helium is 24.6 eV, much higher than that of hydrogen (13.6 eV). survey (Han et al., 2021) has the capability to detect the weak He RRLs from a number of Galactic sources, which is important for understanding the ionization sources by analyzing the He/H ratio and the He/H elemental abundance ratio (e.g., Shaver, 1980; Gordon & Sorochenko, 2002).
As the most sensitive survey for RRLs at band, together with good spatial resolution, spectral resolution and large sky coverage, the piggyback spectral data of the FAST GPPS survey will largely promote our understanding of the properties of Galactic ionized gas.
Data availability
Original FAST GPPS survey data, including the piggyback recorded spectral line data, are released one year after observations, according to the FAST data release policy. All processed RRL data as presented in this paper are available on the project web-page: http://zmtt.bao.ac.cn/MilkyWayFAST/.
This work is supported by the National Natural Science Foundation of China (NSFC) No. 11988101, 11933011, 11833009, 12133004, 12003044, the National Key R&D Program of China (Grant No. 2017YFA0402701), the Key Research Program of the Chinese Academy of Sciences (Grant No. QYZDJ-SSW-SLH021) and the National SKA program of China No. 2022SKA0120103. LGH and CW thank the support from the Youth Innovation Promotion Association CAS. XYG acknowledges the financial support by the CAS-NWO cooperation programme (Grant No. GJHZ1865) and by the NSFC No. U1831103. The work is based on the piggyback spectral data simultaneously recorded during the observations of the GPPS survey, which is one of the five key projects carried out by using the Five-hundred-meter Aperture Spherical radio Telescope (FAST). FAST is a Chinese national mega-science facility built and operated by the National Astronomical Observatories, Chinese Academy of Sciences.
References
- Alves et al. (2015) Alves, M. I. R., Calabretta, M., Davies, R. D., et al. 2015, MNRAS, 450, 2025
- Alves et al. (2010) Alves, M. I. R., Davies, R. D., Dickinson, C., et al. 2010, MNRAS, 405, 1654
- Anantharamaiah (1985) Anantharamaiah, K. R. 1985, Journal of Astrophysics and Astronomy, 6, 203
- Anderson et al. (2015a) Anderson, L. D., Armentrout, W. P., Johnstone, B. M., et al. 2015a, ApJS, 221, 26
- Anderson et al. (2018a) Anderson, L. D., Armentrout, W. P., Luisi, M., et al. 2018a, ApJS, 234, 33
- Anderson et al. (2018b) Anderson, L. D., Armentrout, W. P., Luisi, M., et al. 2018b, ApJS, 234, 33
- Anderson et al. (2014) Anderson, L. D., Bania, T. M., Balser, D. S., et al. 2014, ApJS, 212, 1
- Anderson et al. (2011) Anderson, L. D., Bania, T. M., Balser, D. S., & Rood, R. T. 2011, ApJS, 194, 32
- Anderson et al. (2015b) Anderson, L. D., Hough, L. A., Wenger, T. V., Bania, T. M., & Balser, D. S. 2015b, ApJ, 810, 42
- Anderson et al. (2021) Anderson, L. D., Luisi, M., Liu, B., et al. 2021, ApJS, 254, 28
- Araya et al. (2002) Araya, E., Hofner, P., Churchwell, E., & Kurtz, S. 2002, ApJS, 138, 63
- Arendt et al. (1998) Arendt, R. G., Odegard, N., Weiland, J. L., et al. 1998, ApJ, 508, 74
- Armentrout et al. (2021) Armentrout, W. P., Anderson, L. D., Wenger, T. V., Balser, D. S., & Bania, T. M. 2021, ApJS, 253, 23
- Azcárate et al. (1997) Azcárate, I. N., Cersosimo, J. C., Wilkes, L. M., & Cordero, Y. A. 1997, Ap&SS, 253, 313
- Baek et al. (2015) Baek, S.-J., Park, A., Ahn, Y.-J., & Choo, J. 2015, The Analyst, 140, 250
- Balser (2006) Balser, D. S. 2006, AJ, 132, 2326
- Balser et al. (2018) Balser, D. S., Anderson, L. D., Bania, T. M., et al. 2018, arXiv e-prints, arXiv:1810.06664
- Balser et al. (2011) Balser, D. S., Rood, R. T., Bania, T. M., & Anderson, L. D. 2011, ApJ, 738, 27
- Bania et al. (2012) Bania, T. M., Anderson, L. D., & Balser, D. S. 2012, ApJ, 759, 96
- Bania et al. (2010) Bania, T. M., Anderson, L. D., Balser, D. S., & Rood, R. T. 2010, ApJL, 718, L106
- Barnes et al. (2001) Barnes, D. G., Staveley-Smith, L., de Blok, W. J. G., et al. 2001, MNRAS, 322, 486
- Benedettini et al. (2021) Benedettini, M., Traficante, A., Olmi, L., et al. 2021, A&A, 654, A144
- Beuther et al. (2016) Beuther, H., Bihr, S., Rugel, M., et al. 2016, A&A, 595, A32
- Brand & Wouterloot (2007) Brand, J., & Wouterloot, J. G. A. 2007, A&A, 464, 909
- Brown et al. (2017) Brown, C., Jordan, C., Dickey, J. M., et al. 2017, AJ, 154, 23
- Brunthaler et al. (2021) Brunthaler, A., Menten, K. M., Dzib, S. A., et al. 2021, A&A, 651, A85
- Caswell & Haynes (1987) Caswell, J. L., & Haynes, R. F. 1987, A&A, 171, 261
- Cersosimo (1990) Cersosimo, J. C. 1990, ApJ, 349, 67
- Cersosimo et al. (1989) Cersosimo, J. C., Azcarate, I. N., Hart, L., & Colomb, F. R. 1989, A&A, 208, 239
- Chen et al. (2020) Chen, H.-Y., Chen, X., Wang, J.-Z., Shen, Z.-Q., & Yang, K. 2020, ApJS, 248, 3
- Cordes & Lazio (2002) Cordes, J. M., & Lazio, T. J. W. 2002, arXiv e-prints, astro
- Dame et al. (2001) Dame, T. M., Hartmann, D., & Thaddeus, P. 2001, ApJ, 547, 792
- Deharveng et al. (2010) Deharveng, L., Schuller, F., Anderson, L. D., et al. 2010, A&A, 523, A6
- Dempsey et al. (2013) Dempsey, J. T., Thomas, H. S., & Currie, M. J. 2013, ApJS, 209, 8
- Dieter (1967) Dieter, N. H. 1967, ApJ, 150, 435
- Downes et al. (1980) Downes, D., Wilson, T. L., Bieging, J., & Wink, J. 1980, A&AS, 40, 379
- Dravskikh & Dravskikh (1967) Dravskikh, A. F., & Dravskikh, Z. V. 1967, SvA, 11, 27
- Eden et al. (2020) Eden, D. J., Moore, T. J. T., Currie, M. J., et al. 2020, MNRAS, 498, 5936
- Felli & Churchwell (1972) Felli, M., & Churchwell, E. 1972, A&AS, 5, 369
- Ferrière (2001) Ferrière, K. M. 2001, Reviews of Modern Physics, 73, 1031
- Flagey et al. (2006) Flagey, N., Boulanger, F., Verstraete, L., et al. 2006, A&A, 453, 969
- Gao et al. (2019) Gao, X. Y., Reich, P., Hou, L. G., Reich, W., & Han, J. L. 2019, A&A, 623, A105
- Gao et al. (2022) Gao, X. Y., Reich, W., Sun, X. H., et al. 2022, SCPMA, 65, 129705
- Gaustad et al. (2001) Gaustad, J. E., McCullough, P. R., Rosing, W., & Van Buren, D. 2001, PASP, 113, 1326
- Georgelin & Georgelin (1976) Georgelin, Y. M., & Georgelin, Y. P. 1976, A&A, 49, 57
- Gold et al. (2011) Gold, B., Odegard, N., Weiland, J. L., et al. 2011, ApJS, 192, 15
- Gordon & Cato (1972) Gordon, M. A., & Cato, T. 1972, ApJ, 176, 587
- Gordon & Sorochenko (2002) Gordon, M. A., & Sorochenko, R. L. 2002, Radio Recombination Lines. Their Physics and Astronomical Applications, Vol. 282
- Gry et al. (1992) Gry, C., Lequeux, J., & Boulanger, F. 1992, A&A, 266, 457
- Haffner et al. (1999) Haffner, L. M., Reynolds, R. J., & Tufte, S. L. 1999, ApJ, 523, 223
- Haffner et al. (2003) Haffner, L. M., Reynolds, R. J., Tufte, S. L., et al. 2003, ApJS, 149, 405
- Han et al. (2021) Han, J. L., Wang, C., Wang, P. F., et al. 2021, Research in Astronomy and Astrophysics, 21, 107
- Hart & Pedlar (1976) Hart, L., & Pedlar, A. 1976, MNRAS, 176, 547
- Heiles et al. (1996a) Heiles, C., Koo, B.-C., Levenson, N. A., & Reach, W. T. 1996a, ApJ, 462, 326
- Heiles et al. (1996b) Heiles, C., Reach, W. T., & Koo, B.-C. 1996b, ApJ, 466, 191
- HI4PI Collaboration et al. (2016) HI4PI Collaboration, Ben Bekhti, N., Flöer, L., et al. 2016, A&A, 594, A116
- Hoglund & Mezger (1965) Hoglund, B., & Mezger, P. G. 1965, Science, 150, 339
- Hong et al. (2022) Hong, T., Han, J. L., Hou, L. G., et al. 2022, SCPMA, 65, 129702
- Hou et al. (2017) Hou, L.-G., Dong, J., Gao, X.-Y., & Han, J.-L. 2017, Research in Astronomy and Astrophysics, 17, 047
- Hou & Gao (2019) Hou, L. G., & Gao, X. Y. 2019, MNRAS, 489, 4862
- Hou & Han (2014) Hou, L. G., & Han, J. L. 2014, A&A, 569, A125
- Hou & Han (2015) Hou, L. G., & Han, J. L. 2015, MNRAS, 454, 626
- Hou et al. (2009) Hou, L. G., Han, J. L., & Shi, W. B. 2009, A&A, 499, 473
- Hoyle & Ellis (1963) Hoyle, F., & Ellis, G. R. A. 1963, Australian Journal of Physics, 16, 1
- Jiang et al. (2019) Jiang, P., Yue, Y., Gan, H., et al. 2019, Science China Physics, Mechanics, and Astronomy, 62, 959502
- Jiang et al. (2020) Jiang, P., Tang, N.-Y., Hou, L.-G., et al. 2020, Research in Astronomy and Astrophysics, 20, 064
- Kalberla et al. (2005) Kalberla, P. M. W., Burton, W. B., Hartmann, D., et al. 2005, A&A, 440, 775
- Kardashev (1959) Kardashev, N. S. 1959, AZh, 36, 838
- Kuchar & Clark (1997) Kuchar, T. A., & Clark, F. O. 1997, ApJ, 488, 224
- Lequeux (2005) Lequeux, J. 2005, The Interstellar Medium
- Liu et al. (2019) Liu, B., Anderson, L. D., McIntyre, T., et al. 2019, ApJS, 240, 14
- Liu et al. (2013) Liu, B., McIntyre, T., Terzian, Y., et al. 2013, AJ, 146, 80
- Lockman (1976) Lockman, F. J. 1976, ApJ, 209, 429
- Lockman (1989) Lockman, F. J. 1989, ApJS, 71, 469
- Lockman et al. (1996) Lockman, F. J., Pisano, D. J., & Howard, G. J. 1996, ApJ, 472, 173
- McClure-Griffiths et al. (2009) McClure-Griffiths, N. M., Pisano, D. J., Calabretta, M. R., et al. 2009, ApJS, 181, 398
- Mezger & Hoglund (1967) Mezger, P. G., & Hoglund, B. 1967, ApJ, 147, 490
- Nan et al. (2011) Nan, R., Li, D., Jin, C., et al. 2011, International Journal of Modern Physics D, 20, 989
- Pagani et al. (2020) Pagani, L., Frayer, D., Pagani, B., & Lefèvre, C. 2020, A&A, 643, A126
- Paladini et al. (2003) Paladini, R., Burigana, C., Davies, R. D., et al. 2003, A&A, 397, 213
- Paladini et al. (2004) Paladini, R., Davies, R. D., & De Zotti, G. 2004, MNRAS, 347, 237
- Planck Collaboration et al. (2014) Planck Collaboration, Abergel, A., Ade, P. A. R., et al. 2014, A&A, 571, A11
- Planck Collaboration et al. (2016) Planck Collaboration, Adam, R., Ade, P. A. R., et al. 2016, A&A, 594, A10
- Quireza et al. (2006) Quireza, C., Rood, R. T., Balser, D. S., & Bania, T. M. 2006, ApJS, 165, 338
- Reid et al. (2014) Reid, M. J., Menten, K. M., Brunthaler, A., et al. 2014, ApJ, 783, 130
- Reid et al. (2019) Reid, M. J., Menten, K. M., Brunthaler, A., et al. 2019, ApJ, 885, 131
- Reifenstein et al. (1970) Reifenstein, E. C., Wilson, T. L., Burke, B. F., Mezger, P. G., & Altenhoff, W. J. 1970, A&A, 4, 357
- Reynolds (1991) Reynolds, R. J. 1991, in The Interstellar Disk-Halo Connection in Galaxies, ed. H. Bloemen, Vol. 144, 67
- Rigby et al. (2016) Rigby, A. J., Moore, T. J. T., Plume, R., et al. 2016, MNRAS, 456, 2885
- Roshi & Anantharamaiah (2000) Roshi, D. A., & Anantharamaiah, K. R. 2000, ApJ, 535, 231
- Schuller et al. (2021) Schuller, F., Urquhart, J. S., Csengeri, T., et al. 2021, MNRAS, 500, 3064
- Sewilo et al. (2004) Sewilo, M., Watson, C., Araya, E., et al. 2004, ApJS, 154, 553
- Shaver (1980) Shaver, P. A., ed. 1980, Astrophysics and Space Science Library, Vol. 80, Radio recombination lines, ed. P. A. Shaver
- Shimonishi et al. (2021) Shimonishi, T., Izumi, N., Furuya, K., & Yasui, C. 2021, ApJ, 922, 206
- Su et al. (2018) Su, H., Macquart, J. P., Hurley-Walker, N., et al. 2018, MNRAS, 479, 4041
- Su et al. (2019) Su, Y., Yang, J., Zhang, S., et al. 2019, ApJS, 240, 9
- Taylor & Cordes (1993) Taylor, J. H., & Cordes, J. M. 1993, ApJ, 411, 674
- Thompson et al. (2015) Thompson, M., Beuther, H., Dickinson, C., et al. 2015, in Advancing Astrophysics with the Square Kilometre Array (AASKA14), 126
- Wang et al. (2020) Wang, Y., Beuther, H., Rugel, M. R., et al. 2020, A&A, 634, A83
- Watson et al. (2003) Watson, C., Araya, E., Sewilo, M., et al. 2003, ApJ, 587, 714
- Wenger et al. (2019) Wenger, T. V., Dickey, J. M., Jordan, C. H., et al. 2019, ApJS, 240, 24
- Wenger et al. (2021) Wenger, T. V., Dawson, J. R., Dickey, J. M., et al. 2021, ApJS, 254, 36
- Wink et al. (1983) Wink, J. E., Wilson, T. L., & Bieging, J. H. 1983, A&A, 127, 211
- Winkel et al. (2016) Winkel, B., Kerp, J., Flöer, L., et al. 2016, A&A, 585, A41
- Wright et al. (1991) Wright, E. L., Mather, J. C., Bennett, C. L., et al. 1991, ApJ, 381, 200
- Xu et al. (2022) Xu, J., Han, J. L., & Wang, P. F. 2022, SCPMA, 65, 129704
- Xu et al. (2013) Xu, W. F., Gao, X. Y., Han, J. L., & Liu, F. S. 2013, A&A, 559, A81
- Yao et al. (2017) Yao, J. M., Manchester, R. N., & Wang, N. 2017, ApJ, 835, 29
- Zeng et al. (2021) Zeng, Q., Chen, X., Li, X., et al. 2021, MNRAS, 500, 2969
- Zhang et al. (2022) Zhang, C.-P., Xu, J.-L., Wang, J., et al. 2022, Research in Astronomy and Astrophysics, 22, 025015