189 \jmlryear2022 \jmlrworkshopACML 2022
Evaluating the Perceived Safety of Urban City via Maximum Entropy Deep Inverse Reinforcement Learning
Abstract
Inspired by expert evaluation policy for urban perception, we proposed a novel inverse reinforcement learning (IRL) based framework for predicting urban safety and recovering the corresponding reward function. We also presented a scalable state representation method to model the prediction problem as a Markov decision process (MDP) and use reinforcement learning (RL) to solve the problem. Additionally, we built a dataset called SmallCity based on the crowdsourcing method to conduct the research. As far as we know, this is the first time the IRL approach has been introduced to the urban safety perception and planning field to help experts quantitatively analyze perceptual features. Our results showed that IRL has promising prospects in this field. We will later open-source the crowdsourcing data collection site and the model proposed in this paper.
keywords:
inverse reinforcement learning; urban perception; crowdsourcing1 Introduction
Urban vitality is receiving increasing attention. As the gathering place for residents to live, the street view profoundly affects the physical and mental health of residents in urban activities Cheng et al. (2017). In developed countries, the visual perception of streets receives considerable attention in the urban planning and construction field Ozkan (2014). More specifically, the residents’ perceptions about the safety of the urban scene will influence city layout, as it is a prerequisite for happiness, health, and high quality of life Troy et al. (2012). The visual perceptions of urban spaces affect the psychological states of their inhabitants and can induce adverse social outcomes Porzi et al. (2015).
With the development of street view technology Runge et al. (2016) and machine learning (ML), experts have started to use large-scale data for urban safety perception analysis Dubey et al. (2016); Keizer et al. (2008). Street view images have become essential supporting data for research Cheng et al. (2017). Salesses et al. (2013) first proposed that visual attributes of street view can affect safety perception. They also stated that online street view images could be used to create reproducible quantitative measures of urban perception and the inequality of different cities. Subsequent work has investigated urban safety perception using support vector regression Naik et al. (2014), deep convolutional neural networks Dubey et al. (2016), or multi-instance regression Liu et al. (2017). Cheng et al. (2017); Quercia et al. (2014) proposed visual features which affect safety perception.
Most of the current research on urban safety perception uses visual features and designs algorithms to obtain the safety level of the street view Dubey et al. (2016); Naik et al. (2014) and its impact on perception Zhou et al. (2021). However, most of these methods rely on large-scale data with annotations. In addition, they lack interpretability in quantifying the impact of features on urban safety perception Zhou et al. (2021). Still, no systematic and comprehensive model based on visual-semantic features Frome et al. (2013); Karpathy and Fei-Fei (2015) is available.
To solve the above problems, we introduce decision-making Mnih et al. (2015); You et al. (2019) to the field of urban perception for the first time. Specifically, we introduced the Markov decision process (MDP) to model the interaction between the “expert” and the street view images. Then, we use RL methods to solve the MDP problem and obtain the optimal policy. The agent is assumed to be a decision-maker who interacts with the environment. It receives a reward and a representation of the environment’s state at each time step and exerts an action, i.e., the safety evaluation on the environment You et al. (2019). The reward function is crucial for most RL applications as it can provide a guideline for optimization. However, current RL-based methods rely on manually-defined reward functions, which cannot adapt to dynamic and noisy environments. Besides, they generally use task-specific reward functions that sacrifice generalization ability Chen et al. (2021).
IRL algorithms can address these problems by learning to imitate the prediction policy produced by an “expert” Yang et al. (2020); Baee et al. (2021). IRL is an advanced form of imitation learning Wulfmeier et al. (2015) that enables a learning agent to acquire skills from expert demonstrations. This way, the reward function and optimal urban safety perception prediction policy can be obtained. In this paper, our framework obtains rich visual semantic information (environment) by perceptually resolving scenes and proposes a novel state representation method B-VCB. With the help of street view image input, objective safety annotations Liu et al. (2017), and B-VCB, this framework improves the accuracy and applicability of urban safety perception prediction. Besides, after obtaining the reward function, we can quantitatively analyze the effect of each visual feature.
Additionally, we introduce SmallCity, a new dataset used in our study. This dataset should be helpful for urban planners, economists, and social scientists looking to analyze urban perception’s social and economic consequences Naik et al. (2014).
Our contributions can be summarized as follows:
-
1)
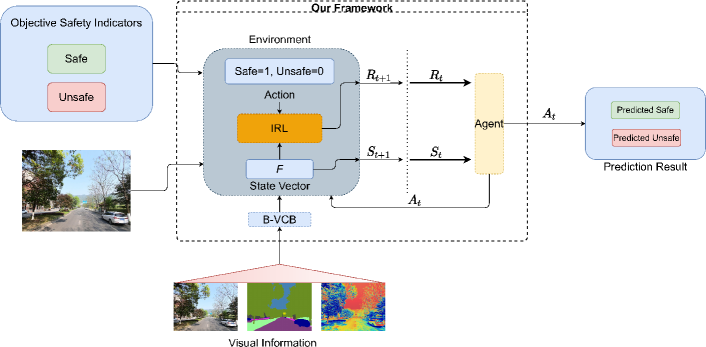
We propose a novel framework that applies maximum entropy deep inverse reinforcement learning (MEDIRL) for predicting urban safety perception and recovering the reward function (Fig. 1).
-
2)
We present a scalable state representation method to represent the visual features.
-
3)
We build the SmallCity dataset to investigate the factors influencing safety perception and their effects.
2 Related work
2.1 Urban Safety Prediction
With easy access to large-scale annotated street view datasets and advanced data-driven ML methods, the prediction of urban safety perception has received significant interest Porzi et al. (2015); Dubey et al. (2016); Liu et al. (2017); Zhou et al. (2021).
Previous studies Naik et al. (2014); Arietta et al. (2014) applied support vector regression to predict the safety of the street view based on selected features. Researchers also studied the use of CNN to predict the safety of the street view by analyzing image characteristics Dubey et al. (2016); Liu et al. (2017). Conversely, fewer works tried to propose a computational model for explaining visual patterns associated with safety perception. Porzi et al. (2015) presented an approach for predicting the safety of images using CNN. It could automatically discover mid-level visual features correlated with urban perception. More recently, some works explored the relationship between visual semantic features and the occurrence of criminal activities in the context of urban perception Jing et al. (2021); Zhou et al. (2021).
The above studies of urban safety perception are based on crowdsourcing annotations or data from the government’s criminal records. These methods require a large-scale dataset to obtain precise predictions, mainly rely on feature selection and lack semantic level interpretability Naik et al. (2014); Dubey et al. (2016). More importantly, the crowdsourcing annotations have unavoidable noise and cannot fully represent the actual perception.
We are interested in simulating the experts’ decision-making process using crucial visual semantic features to obtain a safe evaluation policy for street view images. A quantitative analysis of the impact of images’ visual features is possible based on the evaluation results.
2.2 Inverse Reinforcement Learning
Our IRL approach follows the methods in which problems are modeled as a sequential decision process to solve Yang et al. (2020); Baee et al. (2021). Classical IRL considers expert demonstrations, i.e., a finite set of trajectories and knowledge of the environment to find the expert’s potential reward function Arora and Doshi (2021). Some IRL algorithms Wulfmeier et al. (2015); Yang et al. (2020) learned an optimal policy and the corresponding reward function simultaneously. The research concentrated on the planning problem of autonomous vehicles in traffic You et al. (2019) is closest to our research as it proposed a Single-Step Joint MEDIRL. However, our method does not need to generate demonstrations through RL and learn the corresponding policy. Instead, we use crowdsourcing to collect the images and safety annotations as demonstrations and recover the intrinsic reward functions Zheng et al. (2018) induced by experts’ evaluation strategies. We used the MEDIRL method You et al. (2019) that can take the raw image as inputs and enables the model to handle experts’ sub-optimal policies and seemingly stochastic behaviors to achieve our goal.
2.3 Street View Dataset
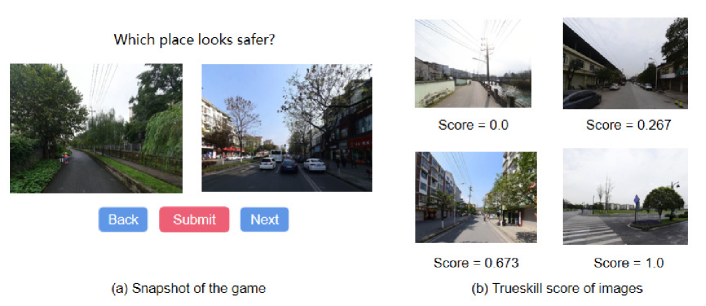
Crowdsourcing websites have been used to collect large-scale data Quercia et al. (2014). The website designed in Salesses et al. (2013) used questions (e.g., “Which place looks safer?”) and images from Google Street View to obtain comparison pairs. Furthermore, the safety score of each image will be calculated using TrueSkill Herbrich et al. (2006) or RSS-CNN Dubey et al. (2016).
We followed Salesses et al. (2013) to design our website (Fig. 2) and build the dataset used in research based on Dujiangyan City’s street view.
3 The SmallCity Dataset
We proposed the SmallCity dataset, which consists of 522 geographically averaged street view images of Dujiangyan City. Each of these images has corresponding semantic features (e.g., FOV), perceptual features (e.g., visual entropy), quantitative features (e.g., number of cars or pedestrians), and corresponding objective safety perception annotation. Our study considers the safety annotation as experts’ predictions.
3.1 Obtaining street view images
45,412 images and corresponding latitude-longitude data were initially obtained using the Baidu Map API. To reflect the overall appearance of Dujiangyan City, 522 geographically averaged images were used to build the SmallCity dataset.
3.2 Crowdsourcing Website
Following Salesses et al. (2013), we designed a website (Fig. 2) to collect pairwise comparisons. Our website presents two images randomly to obtain comparison pairs, which is more acceptable and accurate when getting safety scores Porzi et al. (2015); Stewart et al. (2005); Bijmolt and Wedel (1995). To be more specific, we showed users a randomly-chosen pair of images side by side and asked them to choose one in response to the question: “Which place can give you a safer impression?”. Information such as the user’s age, gender, and the location was also collected. It is worth noting that there is no significant cultural bias in individual preferences for urban appearance.
3.3 Image Feature Encoder
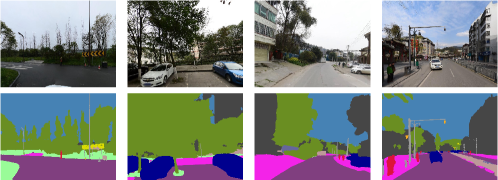
Unlike most previous studies that focused on the general image features Naik et al. (2014); Dubey et al. (2016), we addressed the semantic visual features Shen et al. (2017). We applied the SOTA semantic segmentation model SegFormer Xie et al. (2021) on the SmallCity dataset and obtained inference results, i.e., the semantic results, which show approximate contours of each object that appeared on the image. The cover ratio of each feature, i.e., FOV Cheng et al. (2017), can be calculated.
The definition of street view variables for state representation is shown in Table 1. Here we used greenery Cheng et al. (2017) to represent the vegetation and terrain. We selected variables that significantly impact perception to investigate urban safety perception based on previous qualitative studies Zhang et al. (2018). Considering Zhou et al. (2021) indicates that wire poles make notably significant and negative impacts on the occurrence of criminal activities, we used the binary value to represent the existence of wire poles. The definitions of our street view variables are shown in Table 1.
Additionally, using TrueSkill, we obtained the relative ranking of each image. Furthermore, we calculated the average of the ranking scores and used them as the threshold in combination with expert ratings to derive the objective safety annotations.
| street view Variables | Definitions |
|---|---|
| Greenery | The cover ratio of terrain and vegetation elements in the field of view |
| Sky | The cover ratio of sky element in the field of view |
| Wall | The cover ratio of wall element in the field of view |
| Fence | The cover ratio of fence element in the field of view |
| Sidewalk | The cover ratio of sidewalk element in the field of view |
| Electrical Wire | The value of this feature is “1” if the wire pole element is in the field of view and ”0” otherwise |
| Visual Entropy | Measure the amount of information within an image and the sensitivity of the human visual system to the image Cheng et al. (2017) |
| Car Number | The number of cars in the street view |
4 Method
We first modeled the urban safety perception prediction problem as an MDP process Bellman (1957). Then we proposed an IRL framework (Fig. 1) to model experts’ decision process of prediction to obtain the reward function and learn a prediction policy from demonstrated behaviors, i.e., the crowdsourcing annotations.
Targets performing the safety perception task can be considered goal-directed agents, with the predictions being a sequential decision process. At each time step, the agent attends to receive a random street view image and approximates the state based on the corresponding MDP process. The images were represented using B-VCB proposed in this paper (Sec. 4.1). Also, each agent’s action depends on the state at the specific time step during the decision process. The agent’s goal is to maximize the rewards obtained. While it is difficult to measure how much reward is received from these predictions behaviorally, with IRL, the reward can be assumed to be a function of the state and the action. This function can be jointly learned using the MEDIRL method (Sec. 4.2). We can also get the learned expert-like policy.
4.1 State Representation Modeling
To model the state of an agent, we propose a novel state representation method called Binary Visual-Contextual-Belief (B-VCB).
Contextual belief Yang et al. (2020). It represents a person’s gross “what” and “where” understanding of a scene. It means we can assume people have an internal scene parser that takes an image input and generates belief maps based on all the objects and background classes in that person’s knowledge structure when evaluating an image. Different from Yang et al. (2020), to capture more useful perceptual features and form better beliefs, we use SegFormer for image segmentation and select specific visual features, as mentioned in 3.3.
Binary representation Considering the impact of features on safety perception tends to be linear and monotonic Zhou et al. (2021), and the value ranges of different features are different, we use the threshold segmentation method to divide those greater than and those less than the threshold value into two different states, i.e., 0 or 1. The threshold value is the average of the current feature. Furthermore, ”1” and ”0” respectively mean the feature represents an unsafer or safer factor.
Following You et al. (2019), 256 states can be obtained through the MDP process, and each state is represented as a state vector of a binary set. It is worth mentioning that more corresponding classes can be obtained when needed besides the street view variables used in our research. For instance, other variables such as Salient Region Saturation Cheng et al. (2017), traffic lights Zhou et al. (2021), and the number of people can be considered.
4.2 Reward and Policy Learning
We use MEDIRL to learn the reward function and urban safety perception prediction policies in a small dataset. MEDIRL assumes the reward is a function of the state and the action, and this reward function can be jointly learned using the imitation policy Baee et al. (2021).
MDP Notations In our work, is a set of possible states; is a set of available actions, which is given by = {“safe”, “unsafe”}; is the set of the visual features for a state; is the set of images and corresponding demonstrations. Specifically, we use Single-Step Joint MEDIRL You et al. (2019) to recover the unknown reward function from the set of demonstrations , which is generated using the crowdsourcing method, and obtain the optimal policy. The element satisfies the following conditions: (1) starts at the state (2) The length of is constant for all (Here we have = 1), and (3) There exists a path such that . The corresponding path space for is denoted as . We then maximized the entropy of the joint distribution over all subject to the constraints from the demonstrations following You et al. (2019).
Reward Function To obtain the prediction policy, we need to reproduce the agent’s preference for specific actions when facing different states. Thus we chose the state-action-reward Levine and Koltun (2012), which takes the action into consideration.
A widely used approach to design the reward function is to represent it as a linear combination of some manually chosen features Ziebart et al. (2008); Levine and Koltun (2012); Yang et al. (2020); Baee et al. (2021).
| (1) |
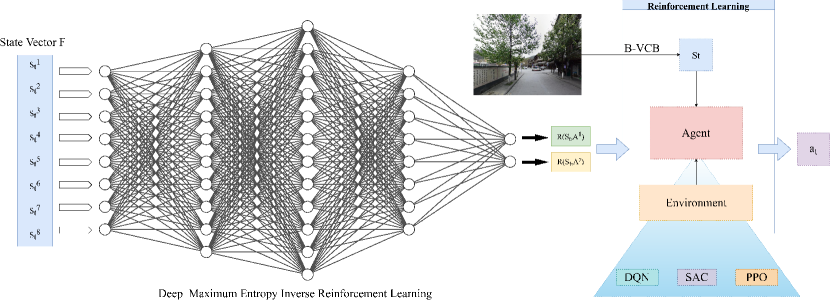
In our work, we use a deep neural network (DNN) that can approximate any function as a parameterized reward function Wulfmeier et al. (2015) (Fig. 4). These features only depend on the current state , which the feature vector can represent. Note that the weight vectors of and the parameter vector are both associated with the network, which is fine-tuned through training.
| (2) |
Policy Learning To learn the prediction policies, Single-Step Joint MEDIRL maximizes the joint posterior distribution of demonstrations , under a given reward structure and of the model parameter, and . It corresponds to maximizing the following objective function:
where the probability of a demonstration , is calculated following Theorem 4.1 in Ziebart et al. (2008). We can also obtain the loss gradient and maximum-entropy gradient You et al. (2019):
| (3) |
where can be obtained by backward propagation and is the maximum-entropy gradient:
| (4) |
where is the expected empirical state–action pair visitation counts over the demonstrations , and is the expected state–action pair visitation counts calculated over steps. In our work, we let = 1 and consider only the one-step action case, so we have:
| (5) |
where is the expected empirical policy and is the learned policy.
The IRL method aims to optimize 3 and get the weights , of the reward function. After obtaining the reward of an “expert,” we then use reinforcement learning techniques to solve our MDP problem to get the optimal policy .
5 Experiments
5.1 Implementation Details
Feature Encoding. To encode visual information (Sec. 3), we used several semantic segmentation models: PSPNet Zhao et al. (2017), DeepLab V3+ Chen et al. (2018), Segmenter Strudel et al. (2021) and SegFormer. After comparing the results of these methods, we applied SegFormer in our research (Fig. 3) and calculated the FOV of the selected features. Then we encode each image into a state vector .
Reward Representation We only used the state as the input of the DNN and provided the rewards for taking every action in action set . The state vector contains the visual information for urban safety perception. Hence, the DNN requires eight input channels to receive the eight-dimensional state . The DNN requires two output channels since there are two actions in . We define a DNN with the numbers of the neurons in each layer given by [8, 32, 16, 32, 2], which are hyperparameters. We used Tanh instead of Sigmoid because it is unbiased at origin and has a more extensive range.
Policy Learning We used OpenAI Gym to implement our environment and Ray RLlib to implement the RL algorithms: PPO Schulman et al. (2017), SAC Haarnoja et al. (2018), and D3QN Van Hasselt et al. (2016); Wang et al. (2016).
Evaluation Metrics We used learned behavior accuracy to evaluate the IRL module for reward function recovery Arora and Doshi (2021). To evaluate urban safety perception predictions, we used F1-Score and Area under the ROC curve (AUC) to measure the accuracy of the policy.
5.2 Results and Discussion
| Method | F1-Score (%) | AUC |
|---|---|---|
| SVM | 61.9% | 0.610 |
| FCN | 61.4% | 0.628 |
| ResNet-101 | 53.9% | 0.532 |
| ViT | 66.7% | 0.618 |
| Ours | 69.3% | 0.709 |
| Method | Learned Behavior Accuracy(%) |
|---|---|
| IRL + PPO | 63.6 |
| IRL + SAC | 70.5 |
| IRL + D3QN | 71.9 |
| Expert Reward + D3QN | 68.5 |
We compare the proposed framework with traditional ML and deep learning (DL) methods. For ML methods, we applied SVM Steinwart and Christmann (2008) by using the street view variables selected to evaluate the safety perception. While for the DL approach, we used fully connected neural networks (FCNNs) to obtain predictions based on variables. We also used ResNet-101 He et al. (2016) and ViT Dosovitskiy et al. (2020) for safety perception evaluation based on the street view images. Since these methods are typical algorithms for solving this problem and the models are accessible, they are used as experimental comparisons.
Table 2 provides the quantitative evaluation results of our framework and shows that our IRL+RL framework outperforms other methods on the SmallCity dataset in terms of the F1-Score and AUC. Most significantly, our approach can effectively predict urban safety perception. It demonstrates that our method is advantageous for accurately anticipating if a street view image is safe or not. ViT’s result being 3% lower than ours in terms of the F1-Score is the inherent problem of supervised learning, which lacks high-level interpretability. The poorer result of ResNet-101 is related to the overfitting problem. IRL+D3QN achieves the best performance in our study, as shown in Table 2. IRL+SAC and IRL+D3QN, which used IRL to recover reward functions, achieved higher learned behavior accuracy than the method using an expert-designed function. The results demonstrate the effectiveness of the IRL method.
Table 3 shows the comparison of different RL algorithms when solving the MDP problem. We also compared the IRL recovered reward function with the expert design reward function.
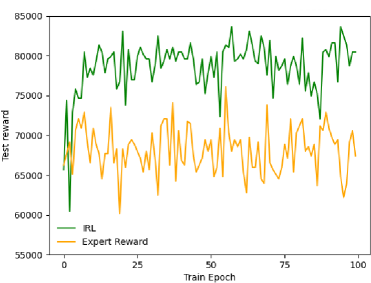
We calculated the “total expert rewards” encountered when traversing trajectories generated using policies under IRL learned reward or expert reward for evaluation, as shown in Fig.5 LABEL:sub@pica. That means we use IRL learned and expert rewards separately during training. In the evaluation, we only used the expert reward metric to address the problem of the value range. We carefully compared the results of IRL and expert reward functions on the same image. Different reward function assigns each feature a score. It shows that IRL recovered reward function can provide better training signals than supervised learning and achieve the increasing reward.
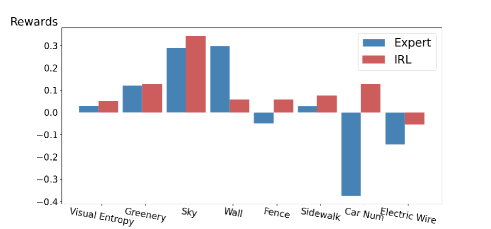
When designing the reward function, the experts analyzed the selected features and determined threshold values of “reward” or “penalty.” Each expert also gave each image a final prediction result, i.e., safe or unsafe. We obtained the expert reward by considering the experts’ evaluation strategy. Fig.5 LABEL:sub@picb shows reward values of each feature when the image’s predictions are consistent with the label, i.e., safe. The expert-designed reward function is based on empirical evidence, while the recovered reward function is more consistent with the crowdsourcing annotations. The former is a simple function, while the latter is a multilayer neural network. Therefore, the learned reward function gives some features a different interpretation from the expert reward.
5.3 Ablation Study
We use the IRL method to recover the reward function and mimic the human intrinsic perception patterns. More specifically, for a decision pair, we can obtain the reward function value of the decision behavior, demonstrating the degree of fitting the expert evaluation strategy. A more considerable reward value means making the judgment for one picture more constant with the expert’s evaluation strategies. By changing the value of each feature dimension (e.g., by setting the value of uninteresting features to 0), we can focus on certain street-level features and learn the relationship between the input features and the safety perception by the recovered reward function.
| B-VCB Settings | F1-Score (%) | AUC | Acc (%) |
|---|---|---|---|
| B-VCB full | 69.3% | 0.700 | 71.9% |
| B-VCB w/o Greenery | 61.6% | 0.632 | 63.3% |
| B-VCB w/o Car Number | 66.5% | 0.662 | 66.1% |
| B-VCB w/o Electrical Wire | 68.4% | 0.687 | 69.1% |
In Table 4, we report the results of ablation studies with the SmallCity dataset. The first row shows the complete B-VCB + IRL + D3QN method results. In the second row, we remove the visual feature Greenery in B-VCB and keep other conditions unchanged. Other rows have declined on the three evaluation metrics compared with our full model(the first row). It proves the effectiveness of our B-VCB method.
Our IRL method is more effective than conventional supervised learning because of the combination of B-VCB and IRL. The B-VCB method can simulate the evaluation pattern of experts and extract perceptual features, which are more robust and targeted. Also, the recovered reward function can provide more training signals in obtaining the optimal policy. Our framework can get a policy more similar to experts’ patterns.
6 Conclusions
We proposed a novel IRL-based framework for predicting the perceptual safety of street view images in urban perception situations. We also presented a new state representation method of street view images. Our framework effectively recovers the reward function and learns the optimal policies for safety perception; based on this, an urban planner can learn the impact of different semantic visual features on perceptual safety from the reward function. To facilitate our study, we built the SmallCity dataset. We investigate the effectiveness of our method through experimental evaluation of different methods based on the SmallCity. Results show that our method outperforms existing models and indicate that the IRL method has promising prospects in related fields.
This work was supported in part by the top-notched student program of Sichuan University.
References
- Arietta et al. (2014) Sean M Arietta, Alexei A Efros, Ravi Ramamoorthi, and Maneesh Agrawala. City forensics: Using visual elements to predict non-visual city attributes. IEEE transactions on visualization and computer graphics, 20(12):2624–2633, 2014.
- Arora and Doshi (2021) Saurabh Arora and Prashant Doshi. A survey of inverse reinforcement learning: Challenges, methods and progress. Artificial Intelligence, 297:103500, 2021.
- Baee et al. (2021) Sonia Baee, Erfan Pakdamanian, Inki Kim, Lu Feng, Vicente Ordonez, and Laura Barnes. Medirl: Predicting the visual attention of drivers via maximum entropy deep inverse reinforcement learning. In Proceedings of the IEEE/CVF international conference on computer vision, pages 13178–13188, 2021.
- Bellman (1957) Richard Bellman. A markovian decision process. Journal of mathematics and mechanics, pages 679–684, 1957.
- Bijmolt and Wedel (1995) Tammo HA Bijmolt and Michel Wedel. The effects of alternative methods of collecting similarity data for multidimensional scaling. International journal of research in marketing, 12(4):363–371, 1995.
- Chen et al. (2018) Liang-Chieh Chen, Yukun Zhu, George Papandreou, Florian Schroff, and Hartwig Adam. Encoder-decoder with atrous separable convolution for semantic image segmentation. In Proceedings of the European conference on computer vision (ECCV), pages 801–818, 2018.
- Chen et al. (2021) Xiaocong Chen, Lina Yao, Xianzhi Wang, Aixin Sun, Wenjie Zhang, and Quan Z Sheng. Generative adversarial reward learning for generalized behavior tendency inference. arXiv preprint arXiv:2105.00822, 2021.
- Cheng et al. (2017) Liang Cheng, Sensen Chu, Wenwen Zong, Shuyi Li, Jie Wu, and Manchun Li. Use of tencent street view imagery for visual perception of streets. ISPRS International Journal of Geo-Information, 6(9):265, 2017.
- Dosovitskiy et al. (2020) Alexey Dosovitskiy, Lucas Beyer, Alexander Kolesnikov, Dirk Weissenborn, Xiaohua Zhai, Thomas Unterthiner, Mostafa Dehghani, Matthias Minderer, Georg Heigold, Sylvain Gelly, et al. An image is worth 16x16 words: Transformers for image recognition at scale. arXiv preprint arXiv:2010.11929, 2020.
- Dubey et al. (2016) Abhimanyu Dubey, Nikhil Naik, Devi Parikh, Ramesh Raskar, and César A Hidalgo. Deep learning the city: Quantifying urban perception at a global scale. In European conference on computer vision, pages 196–212. Springer, 2016.
- Frome et al. (2013) Andrea Frome, Greg S Corrado, Jon Shlens, Samy Bengio, Jeff Dean, Marc’Aurelio Ranzato, and Tomas Mikolov. Devise: A deep visual-semantic embedding model. Advances in neural information processing systems, 26, 2013.
- Haarnoja et al. (2018) Tuomas Haarnoja, Aurick Zhou, Pieter Abbeel, and Sergey Levine. Soft actor-critic: Off-policy maximum entropy deep reinforcement learning with a stochastic actor. In International conference on machine learning, pages 1861–1870. PMLR, 2018.
- He et al. (2016) Kaiming He, Xiangyu Zhang, Shaoqing Ren, and Jian Sun. Deep residual learning for image recognition. In Proceedings of the IEEE conference on computer vision and pattern recognition, pages 770–778, 2016.
- Herbrich et al. (2006) Ralf Herbrich, Tom Minka, and Thore Graepel. Trueskill™: a bayesian skill rating system. Advances in neural information processing systems, 19, 2006.
- Jing et al. (2021) Fengrui Jing, Lin Liu, Suhong Zhou, Jiangyu Song, Linsen Wang, Hanlin Zhou, Yiwen Wang, and Ruofei Ma. Assessing the impact of street-view greenery on fear of neighborhood crime in guangzhou, china. International journal of environmental research and public health, 18(1):311, 2021.
- Karpathy and Fei-Fei (2015) Andrej Karpathy and Li Fei-Fei. Deep visual-semantic alignments for generating image descriptions. In Proceedings of the IEEE conference on computer vision and pattern recognition, pages 3128–3137, 2015.
- Keizer et al. (2008) Kees Keizer, Siegwart Lindenberg, and Linda Steg. The spreading of disorder. science, 322(5908):1681–1685, 2008.
- Levine and Koltun (2012) Sergey Levine and Vladlen Koltun. Continuous inverse optimal control with locally optimal examples. arXiv preprint arXiv:1206.4617, 2012.
- Liu et al. (2017) Xiaobai Liu, Qi Chen, Lei Zhu, Yuanlu Xu, and Liang Lin. Place-centric visual urban perception with deep multi-instance regression. In Proceedings of the 25th ACM international conference on Multimedia, pages 19–27, 2017.
- Mnih et al. (2015) Volodymyr Mnih, Koray Kavukcuoglu, David Silver, Andrei A Rusu, Joel Veness, Marc G Bellemare, Alex Graves, Martin Riedmiller, Andreas K Fidjeland, Georg Ostrovski, et al. Human-level control through deep reinforcement learning. nature, 518(7540):529–533, 2015.
- Naik et al. (2014) Nikhil Naik, Jade Philipoom, Ramesh Raskar, and César Hidalgo. Streetscore-predicting the perceived safety of one million streetscapes. In Proceedings of the IEEE conference on computer vision and pattern recognition workshops, pages 779–785, 2014.
- Ozkan (2014) Ulas Yunus Ozkan. Assessment of visual landscape quality using ikonos imagery. Environmental monitoring and assessment, 186(7):4067–4080, 2014.
- Porzi et al. (2015) Lorenzo Porzi, Samuel Rota Bulò, Bruno Lepri, and Elisa Ricci. Predicting and understanding urban perception with convolutional neural networks. In Proceedings of the 23rd ACM international conference on Multimedia, pages 139–148, 2015.
- Quercia et al. (2014) Daniele Quercia, Neil Keith O’Hare, and Henriette Cramer. Aesthetic capital: what makes london look beautiful, quiet, and happy? In Proceedings of the 17th ACM conference on Computer supported cooperative work & social computing, pages 945–955, 2014.
- Runge et al. (2016) Nina Runge, Pavel Samsonov, Donald Degraen, and Johannes Schöning. No more autobahn! scenic route generation using googles street view. In Proceedings of the 21st International Conference on Intelligent User Interfaces, pages 147–151, 2016.
- Salesses et al. (2013) Philip Salesses, Katja Schechtner, and César A Hidalgo. The collaborative image of the city: mapping the inequality of urban perception. PloS one, 8(7):e68400, 2013.
- Schulman et al. (2017) John Schulman, Filip Wolski, Prafulla Dhariwal, Alec Radford, and Oleg Klimov. Proximal policy optimization algorithms. arXiv preprint arXiv:1707.06347, 2017.
- Shen et al. (2017) Qiaomu Shen, Wei Zeng, Yu Ye, Stefan Müller Arisona, Simon Schubiger, Remo Burkhard, and Huamin Qu. Streetvizor: Visual exploration of human-scale urban forms based on street views. IEEE Transactions on Visualization and Computer Graphics, 24(1):1004–1013, 2017.
- Steinwart and Christmann (2008) Ingo Steinwart and Andreas Christmann. Support vector machines. Springer Science & Business Media, 2008.
- Stewart et al. (2005) Neil Stewart, Gordon DA Brown, and Nick Chater. Absolute identification by relative judgment. Psychological review, 112(4):881, 2005.
- Strudel et al. (2021) Robin Strudel, Ricardo Garcia, Ivan Laptev, and Cordelia Schmid. Segmenter: Transformer for semantic segmentation. In Proceedings of the IEEE/CVF International Conference on Computer Vision, pages 7262–7272, 2021.
- Troy et al. (2012) Austin Troy, J Morgan Grove, and Jarlath O’Neil-Dunne. The relationship between tree canopy and crime rates across an urban–rural gradient in the greater baltimore region. Landscape and urban planning, 106(3):262–270, 2012.
- Van Hasselt et al. (2016) Hado Van Hasselt, Arthur Guez, and David Silver. Deep reinforcement learning with double q-learning. In Proceedings of the AAAI conference on artificial intelligence, volume 30, 2016.
- Wang et al. (2016) Ziyu Wang, Tom Schaul, Matteo Hessel, Hado Hasselt, Marc Lanctot, and Nando Freitas. Dueling network architectures for deep reinforcement learning. In International conference on machine learning, pages 1995–2003. PMLR, 2016.
- Wulfmeier et al. (2015) Markus Wulfmeier, Peter Ondruska, and Ingmar Posner. Maximum entropy deep inverse reinforcement learning. arXiv preprint arXiv:1507.04888, 2015.
- Xie et al. (2021) Enze Xie, Wenhai Wang, Zhiding Yu, Anima Anandkumar, Jose M Alvarez, and Ping Luo. Segformer: Simple and efficient design for semantic segmentation with transformers. Advances in Neural Information Processing Systems, 34:12077–12090, 2021.
- Yang et al. (2020) Zhibo Yang, Lihan Huang, Yupei Chen, Zijun Wei, Seoyoung Ahn, Gregory Zelinsky, Dimitris Samaras, and Minh Hoai. Predicting goal-directed human attention using inverse reinforcement learning. In Proceedings of the IEEE/CVF conference on computer vision and pattern recognition, pages 193–202, 2020.
- You et al. (2019) Changxi You, Jianbo Lu, Dimitar Filev, and Panagiotis Tsiotras. Advanced planning for autonomous vehicles using reinforcement learning and deep inverse reinforcement learning. Robotics and Autonomous Systems, 114:1–18, 2019.
- Zhang et al. (2018) Fan Zhang, Ding Zhang, Yu Liu, and Hui Lin. Representing place locales using scene elements. Computers, Environment and Urban Systems, 71:153–164, 2018.
- Zhao et al. (2017) Hengshuang Zhao, Jianping Shi, Xiaojuan Qi, Xiaogang Wang, and Jiaya Jia. Pyramid scene parsing network. In Proceedings of the IEEE conference on computer vision and pattern recognition, pages 2881–2890, 2017.
- Zheng et al. (2018) Zeyu Zheng, Junhyuk Oh, and Satinder Singh. On learning intrinsic rewards for policy gradient methods. Advances in Neural Information Processing Systems, 31, 2018.
- Zhou et al. (2021) Hanlin Zhou, Lin Liu, Minxuan Lan, Weili Zhu, Guangwen Song, Fengrui Jing, Yanran Zhong, Zihan Su, and Xin Gu. Using google street view imagery to capture micro built environment characteristics in drug places, compared with street robbery. Computers, Environment and Urban Systems, 88:101631, 2021.
- Ziebart et al. (2008) Brian D Ziebart, Andrew L Maas, J Andrew Bagnell, Anind K Dey, et al. Maximum entropy inverse reinforcement learning. In Aaai, volume 8, pages 1433–1438. Chicago, IL, USA, 2008.