On the Multidimensional Augmentation of Fingerprint Data for Indoor Localization in A Large-Scale Building Complex Based on Multi-Output Gaussian Process
Abstract
Wi-Fi fingerprinting becomes a dominant solution for large-scale indoor localization due to its major advantage of not requiring new infrastructure and dedicated devices. The number and the distribution of Reference Points (RPs) for the measurement of localization fingerprints like Received Signal Strength Indicator (RSSI) during the offline phase, however, greatly affects the localization accuracy; for instance, the UJIIndoorLoc—i.e., the publicly-available multi-building and multi-floor indoor localization fingerprint database widely used in the literature—is known to have the issue of uneven spatial distribution of RPs over buildings and floors. Data augmentation has been proposed as a feasible solution to not only improve the smaller number and the uneven distribution of RPs in the existing fingerprint databases but also reduce the labor and time costs of constructing new fingerprint databases. In this paper, we propose the multidimensional augmentation of fingerprint data for indoor localization in a large-scale building complex based on Multi-Output Gaussian Process (MOGP) and systematically investigate the impact of augmentation ratio as well as MOGP kernel functions and models with their hyperparameters on the performance of indoor localization using the UJIIndoorLoc database and the state-of-the-art neural network indoor localization model based on a hierarchical Recursive Neural Network (RNN). The investigation based on experimental results suggests that we can generate synthetic RSSI fingerprint data up to ten times the original data—i.e., the augmentation ratio of 10—through the proposed multidimensional MOGP-based data augmentation without significantly affecting the indoor localization performance compared to that of the original data alone, which extends the spatial coverage of the combined RPs and thereby could improve the localization performance at the locations that are not part of the test dataset.
Index Terms:
Indoor localization, data augmentation, multi-output Gaussian process, regression, large-scale building complex.I Introduction
As the demand for location-based service (LBS) ever increases, localization based on various wireless technologies is under extensive research and development. Global Navigation Satellite System (GNSS) provides reliable, real-time kinematic positioning and navigation in an outdoor environment, where it takes only a few seconds to initialize and provide up to centimeter-level accuracy [1].
In an indoor environment, however, the response time and accuracy of GNSS are inadequate due to the blockage, attenuation, and scattering of satellite signals by the obstacles inside and outside buildings [2]. At present, indoor localization technologies are mainly based on infrared [3], ultrasonic [4], Ultra Wide Band (UWB) [5], ZigBee [6], Bluetooth [7] and Wi-Fi [8].
Note that, as modern buildings are already equipped with a large amount of Wi-Fi infrastructure, indoor localization based on Wi-Fi technology does not incur additional infrastructure overhead. Wi-Fi-based indoor localization methods can be grouped into two, i.e., those based on ranging and location fingerprinting. The ranging-based methods calculate the distance between a user and Access Points (APs) based on received signal measurements—e.g., angles in Angle of Arrival (AOA), and arrival times and their differences in Time of Arrival (TOA) and Time Difference of Arrival (TDoA) [9, 10]—to estimate a user’s location via multilateration, which requires the exact locations of APs in advance and, if time measurements are involved, puts strict requirements on time synchronization among all devices. The fingerprinting-based methods, on the other hand, estimate a user’s location by comparing the location fingerprint like Received Signal Strength (RSS) or Received Signal Strength Indicator (RSSI) measured at the user’s current, unknown location during the online phase with those pre-collected during the offline phase at known Reference Points (RPs) in a location fingerprint database based on localization algorithms such as Recursive Neural Network (RNN) [11] and -Nearest-Neighbor (kNN) [12], which, unlike the ranging-based methods, does not require the locations of APs and strict time synchronization among the devices. Their localization performance, however, could be significantly affected by the number and the coverage of the location fingerprints measured at the RPs in the database, especially for a large-scale building complex [13].
In fact, the uneven spatial distribution of RPs is a major issue among the publicly-available location fingerprint databases like UJIIndoorLoc [14], TUT [15], and WicLoc [16]; in the case of the UJIIndoorLoc, which is the mostly widely used multi-building and multi-floor RSSI database and becomes a benchmark in the literature, the numbers of RPs are significantly different for spaces with similar area, and many fingerprint samples have spatial coordinates nearly identical to one another, indicating repeated samplings at the same RPs. These problems result in an inadequate spatial representation of data points and incomplete radio maps, which will be discussed in detail in Section IV.
To address these issues in fingerprint databases for large-scale multi-building and multi-floor indoor localization, we propose the multidimensional augmentation of fingerprint data based on Multi-Output Gaussian Process (MOGP) in this paper. The proposed multidimensional fingerprint data augmentation can improve the spatial coverage of data points of existing databases by generating synthetic fingerprint data at additional RPs without loss of localization accuracy. It could also reduce the labor and time costs of constructing new databases using well-prepared but much reduced number of RPs, which could also address the issue of difficult measurements related with complex building structures.
The rest of the paper is organized as follows: In Section II, we first review the dominant methods in data augmentation in general and proceed to the review of methods specific to indoor localization. In Section III, we propose the fingerprint data augmentation for large-scale multi-building and multi-floor indoor localization based on MOGP and discuss the details of the proposed algorithm including the selection of the kernel function. Section IV presents the results of our investigation of the impact of MOGP kernel functions and models with their hyperparameters and augmentation ratio on the performance of indoor localization using the UJIIndoorLoc database and the state-of-the-art neural network indoor localization model based on a hierarchical RNN [11]. Section V concludes our work in this paper.
II Related Work
In this section we briefly review the basic ideas of data augmentation in different research areas and the implementation of data augmentation specific to indoor localization.
II-A Data Augmentation
The success of Machine Learning (ML) algorithms highly depends on the existence of a large amount of datasets, but the collection of datasets, especially labeled ones for supervised learning, could be a challenging task in applications such as large-scale invasive examinations in medical testing [17, 18] and multi-building and multi-floor indoor localization for a large-scale building complex [19] due to the issues of privacy and the high labor and time costs. Data augmentation has become a viable solution in this regard and applied widely to the categorization of images [20] and texts [21].
Image-based data augmentation algorithms can be grouped into two, i.e., image-processing-based and ML-based data augmentation: Image-processing-based data augmentation utilizes image processing techniques such as geometric transformations, flips, color transformations, cropping, noise and injection to augment the data [20]. In the case of ML-based data augmentation, advanced ML algorithms like deep neural networks are used; a notable example is Generative Adversarial Networks (GANs), which emerge as a representative approach to data augmentation using deep learning and have found a wide range of applications in areas such as medical imaging [17] and urban traffic control [22].
II-B Indoor Localization Data Augmentation
RSSI or RSS values can be converted into a grayscale map or plotted as a radio map, enabling the application of the image-processing-based or ML-based data augmentation techniques mentioned in Section II-A.
Rashmi Sharan Sinha et al. converted a file containing 256 RSSI values into a image as input to a Convolutional Neural Network (CNN) [23, 24]. Tian Lan et al. proposed a super-resolution-based fingerprint augmentation framework to achieve interconversion between fingerprint data and fingerprint images [19].
Direct augmentation of indoor localization data using ML algorithms such as GAN are popular nowadays. Wafa Njima et al. used a Selective-GAN to augment the UJIIndoorLoc database, and the localization prediction in the offline phase is demonstrated to significantly improve the localization accuracy [25]. Hilal et al. proposed DataLoc+, a room-level data augmentation technique inspired by the dropout technique to prevent overfitting [26]. Rizk et al. used deep learning to implement data augmentation in cellular-based localization [27]. In [28] and [29], the researchers used Single-Output Gaussian Process (SOGP) regression, also called Kriging in geostatistics, to augment the indoor localization data with single building and single floor.
Note that there was no prior work on the use of MOGP to explicitly exploit the correlation among observations from multiple APs in multi-building and multi-floor indoor localization and investigate an optimal way of RSSI data augmentation based on MOGP, which is the major contribution of our work in this paper.
III Multidimensional Fingerprint Data Augmentation Based on MOGP
Fig. 1 provides an overview of the proposed multidimensional fingerprint data augmentation based on MOGP. MOGP-based data augmentation algorithm, in the black box, has five steps and it belongs to the offline data collection and processing phase, and its output will be the input of the online localization estimation and prediction network, which is the RNN used in this study. It is first necessary to decide on the kernel function with its hyperparameters, then the system provides two different MOGP models, the augmentation ratio directly determines the amount of augmented data, and after adding Gaussian noise the output of MOGP will be obtained.

III-A From Single-Output to Multi-Output Gaussian Process
For multi-building, multi-floor indoor localization scenarios, we can define RSSI matrix for Wireless Access Points (WAPs) and RPs as follows:
| (1) |
where is a column vector with RSSI measurement of WAP. For the UJIIndoorLoc database, a total of 520 different WAPs measurements yielded 19938 RPs [14], and (1) includes the RSSI values of each RP. Another input matrix (2) includes the geographic information of RPs, and for longitude and latitude, respectively. denotes building number, denotes floor. The input of the model should be the concatenation of the matrices and , the latter of which is for the geographic information of RPs and defined as
| (2) |
where .
SOGP can be defined as follows:
| (3) |
where is a mean function normally set to , and is a kernel function also called a covariance function and defines the output space of SOGP. SOGP can be interpreted as the union of a series of random variables about a continuous domain, and for each spatial point the random variables obey a Gaussian distribution, and since the main purpose of the study is indoor localization the situation in space is discussed, ignoring the time dimension. Hence taking the UJIIndoorLoc database as an example, each RP corresponds to 520 identified SOGPs, as the database records 520 WAPs. For SOGP, the kernel function of the model only stores the RSSI value and geographic information of current WAP, hence the input matrix of the SOGP is
| (4) |
where . As for output, given the relationships between associated observations and the output,
| (5) |
For MOGP model, it can be defined as,
| (6) |
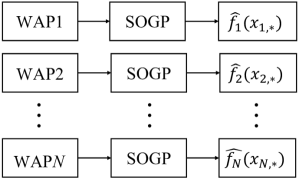
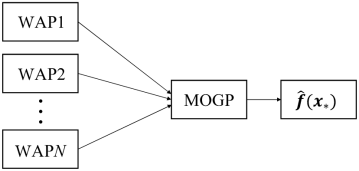
where related to the d-dimensional input space, in this research is , and is the output space of the [30]. The outputs obtained from MOGP can be used to classify the MOGP model according to whether the importance is equal or not, and this part will be discussed further in Section III-B. For indoor localization related studies, RSSI values measured by different WAPs at the same RP are correlated, so a multi-input multi-output Gaussian Process Regression model can be used to consider the correlation between different WAPs. It is worth noting that both the SOGP and MOGP models ignore their multi-input characteristics. The transition from SOGP to MOGP for indoor localization studies requires making the assumption that multi-outputs are correlated and of equal importance to each other. In this context, it is possible to map data from multi-sequences of multitasks into the same real-valued function space and to line them up, the multi-output scenario is made to satisfy the definition of a Gaussian Process which is the Gaussian measure is in the space where the real-valued stochastic process is located and this is also considered as symmetric MOGP [30]. The multi-task here can be interpreted as including regression of RSSI based on latitude and longitude, regression of RSSI based on floor coordinates, regression of RSSI based on building coordinates, and a joint task of the above three tasks. Please note that the floor and building coordinates here are not continuous values and cannot be used directly for MOGP regression, and the detailed experimental setup will be explained in Section IV. Fig. 2 image showing the difference between SOGP and MOGP in output and training.
(a)
(b)
III-B Different MOGP Models
The MOGP model can be simply divided into symmetric MOGP and asymmetric MOGP by determining the importance of maintaining the same weights among outputs [31]. Symmetric MOGP is characterized by the use of a symmetric structure to preserve correlations between outputs and to ensure that the outputs satisfy condition follows the regression observations with independent and identically distributed Gaussian measurement noise, shown in ( 5).
The correlation information is stored in an integrated kernel function and all outputs share the same training information. The kernel function of the MOGP can be defined as
| (7) |
The latent function in (8) is assumed to be a Gaussian Process satisfying zero mean function and kernel function as .
| (8) |
Thus for a determined kernel function can sample latent functions from its corresponding MOGP model. The latent functions obtained by simultaneous sampling all obey a GP, which is
| (9) |
For this series of latent functions , the purpose of the line transformation is to obtain outputs, , and the generic format of the output function can be written as,
| (10) |
The above form of sampling the output using one given kernel function is known as Intrinsic Coregionalization Model (ICM). If the number of kernel functions , large than one, so that the model is the Linear Model of Coregionalization (LMC). The LMC samples a total of kernel functions , each yielding latent functions, and obtains output functions by means of a linear combination. The number of kernel functions influences the expressiveness of the model to some extent. Therefore, (10) can be rewritten as follows:
| (11) |
Some researchers have suggested using [32] or [33] to improve the flexibility of the model and its ability to describe differences in the data.
III-C Kernel Function
Given that a GP model can be uniquely determined by a mean function, which is usually set to zero, and a kernel function, this section will focus on the characteristics of different kernel functions. The field of ML does not make a very clear distinction between kernel functions and covariance functions; both can be regarded as generalized descriptions of distances. Also, as kernel functions are linear in character, new kernel functions can be constructed by simple linear combinations, as
| (12) |
Thus there is challenging to exhaust all cases by enumeration for linear combinations of arbitrary kernel functions, and some researchers have attempted to discuss the performance of some simple combinations in indoor localization data augmentation, such as the use of compound kernel functions, linear combination of noise, constant and linear kernel [28]. Note that this is a SOGP regression forecast based on a single WAP. Therefore in this study we focus on the effectiveness of MOGP using a single kernel function in the augmentation of indoor localization databases in large scale multi-floor building complexes. The corresponding kernel function for MOGP can be constructed by extending the kernel function for SOGP so that it adds an additional discrete input dimension [34].
The most common kernel function is the Radial Basis Function (RBF) or what is known as the Gaussian kernel function, which is defined by
| (13) |
where is the variance describing the average distance from the mean and is the length-scale representing the spread of the covariance. In most cases the RBF kernel function fits well and the correlation between individual data points in the domain is generally considered to decay smoothly with increasing distance [35]. However, in some cases such a pre-determined data correlation satisfying such a smooth decay is not true; in the case of a unit step like signal, for example, the RBF kernel function does not capture the characteristics of the signal at the moment of the jump accurately and tends more to amplify the time of change of the signal.
| (14) |
where Rational Quadratic (RQ) kernel function is the mixture of the RBF kernel with different length-scale [36]. When , the RQ becomes the RBF kernel function [37]. However, it does not solve the problem of excessive smoothness very well.
The use of the Matern class of kernel functions goes some way to alleviating the problem of over-smoothing at signal jump moments [38]. The Matern family of kernel functions can be defined by
| (15) |
where is modified Bessel function, by changing the parameter , where is the order of a polynomial function, the problem of over-smoothing of the RBF kernel function in the signal mutations region can be mitigation. While , the Matern kernel function has the same structure as RBF kernel function. Hence, the general case takes the values or , and Matern32 will be coarser for Matern52. Another solution to the over-smoothing of the RBF kernel function is to replace the quadratic Euclidean distance with the absolute distance, which is the Ornstein-Uhlenbeck (OU) kernel function defined in (16). The OU kernel function is also essentially a Matern kernel function when takes the value [39].
| (16) |
The differences between several kernel functions are compared above mainly in terms of smoothness, with other aspects being ignored, and their impact and performance on the enhancement of indoor positioning data is compared in detail in Section IV.
IV Experimental Results
The publicly-available UJIIndoorLoc database is used for the experiments, which has one five-floor and two four-floor buildings [14]. As for the evaluation of the localization performance of the proposed multidimensional fingerprint data augmentation based on MOGP, which is presented in Section IV-A, we use the state-of-the-art neural network model based on the hierarchical RNN specifically designed for large-scale multi-building and multi-floor indoor localization [11]. We also provide the results of our investigation of the impact of MOGP kernel functions on RSSI radio maps in Section IV-B.
IV-A Online Evaluation
During the online evaluation, we investigate the impact of different MOGP kernel functions and models with their hyperparameters on the indoor localization performance of the proposed data augmentation. We also explore the ratio of data augmentation to have an insight in generating synthetic RSSI data without causing overfitting.
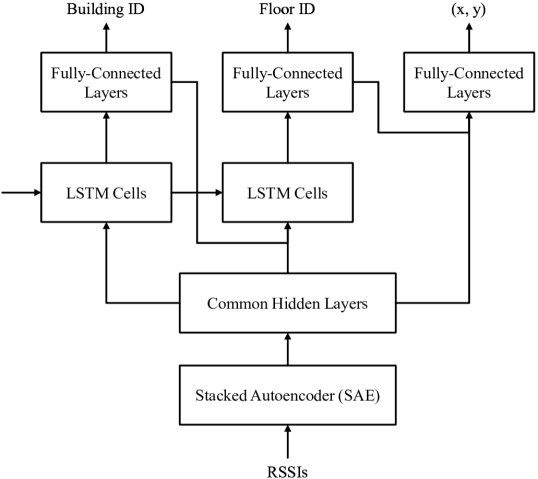
We select the RNN model in [11] with Long Short-Term Memory (LSTM) cells to investigate the effects of the MOGP-based augmentation on the localization performance. The MOGP regression is implemented based on GPy—i.e., a GP framework in Python developed at the Sheffield machine learning group [40]—following the steps outlined in Section III-A. As shown in Fig. 3, the Stacked AutoEncoder (SAE) of the RNN model consists of three hidden layers of 256, 128, and 64 nodes, which is followed by two common hidden layers with 128 and 128 nodes.
.
For building and floor classifiers, we have two stacked LSTM cells followed by two Fully-Connected (FC) layers of 32 nodes and 1 output node. The position estimator consists of three FC layers of 512 and 512 nodes and 2 output nodes for two-dimensional localization coordinates [11]. We apply early stopping with a patience of 20 for the coordinate estimation model and 40 with save best only functions activated for the building/floor classification model. Table I summarizes the key RNN parameter values for the experiments.
| Parameter | Value |
|---|---|
| SAE Hidden Layers | 256-128-64 |
| SAE Activation | ReLu |
| SAE Optimizer | Adam |
| SAE Loss | MSE |
| Common Hidden Layers | 128-128 |
| Common Activation | ReLu |
| Common Dropout | 0.2 |
| Common Loss | MSE |
| LSTM Cells | 256-512 |
| LSTM Activation | ReLu |
| LSTM Optimizer | Adam |
| LSTM Loss | MSE |
| Building/Floor Classifier Hidden Layers | 32-1 |
| Building/Floor Classifier Activation | MSE |
| Building/Floor Classifier Optimizer | Adam |
| Building/Floor Classifier Dropout | 0.2 |
| Building/Floor Classifier Loss | ReLu |
| Position Estimator Hidden Layers | 512-512-2 |
| Position Estimator Activation | MSE |
| Position Estimator Optimizer | Adam |
| Position Estimator Dropout | 0.1 |
| Position Estimator Loss | tanh |
As performance metrics for the localization performance, we use building hit rate and floor hit rate defined as a rate of correct identification of building Identifier (ID) and that of floor ID, respectively, and 3D error defined as the mean of three-dimensional Euclidean distances between estimated and correct locations [41].
Fig. 4 illustrates the spatial distribution of RPs over three buildings in normalized coordinates, which clearly shows the poor spatial coverage of RPs for building 1 and 2 indicated by blue and red dots, respectively.
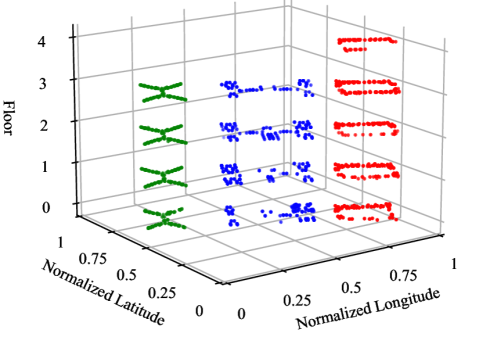
Table II summarizes the statistics of the number of RPs on different floors of different buildings.
| Building 0 | Building 1 | Building 2 | |
|---|---|---|---|
| Floor 0 | 1059 | 1368 | 1942 |
| Floor 1 | 1356 | 1484 | 2162 |
| Floor 2 | 1443 | 1396 | 1577 |
| Floor 3 | 1391 | 948 | 2709 |
| Floor 4 | None | None | 1102 |
| Total | 5249 | 5196 | 9492 |
Within the same building with similar building structure and spatial area, the difference in the numbers of RPs on different floors is obvious, especially for building 2 as shown in Fig. 4. Fig. 5 illustrates one possible way of sampling the latitude and longitude using a Gaussian distribution to determine the physical spatial coordinates of the augmented data taking the north-west corner of floor 4 of building 2 as an example.
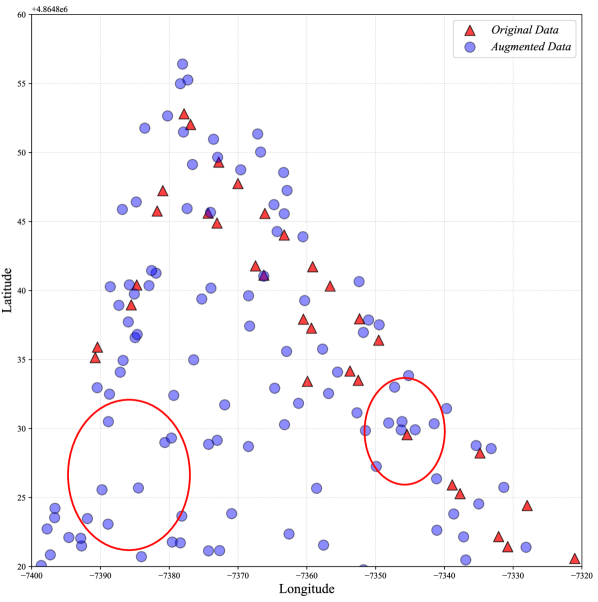
The triangles and the circles indicate the RPs in the original database and the augmented RPs, respectively. From the figure, we can clearly see the cavities caused by the absence of measurement data, which are highlighted by red circles; according to the original database, these RPs are distributed within the corridor, and the augmented data successfully fill the cavities in the original database.
IV-A1 Impact of Kernel Functions
The impact of different kernel functions in data augmentation on the localization performance is discussed in Section III-C, and the results of its experimental verification are summarized in Table III, where we use ICM and set the ratio of data augmentation to 1 with the variance of 1 and the length-scale of 10. Given the parameter settings, Matern52 provides optimal results for a single kernel function. Visualizing the results of the data augmentation (i.e., numerical RSSI values), we found that the MOGP model narrows the range of fluctuations of the original data regardless of the kernel function chosen. This excludes specific extreme value points, which could result in data dilution when mixed with the original database.
| Kernel Function | RBF | RQ | Matern32 | Matern52 | OU |
| 3D Error [m] | 9.04 | 9.26 | 8.88 | 8.70 | 8.93 |
IV-A2 Impact of the Hyperparameters of Kernel Functions
A kernel function consists of two hyperparameters of a variance (also called scale factor) and a length-scale . Table IV shows the impact of the variance on the localization performance. The variance scales the kernel function and controls the average distance from the mean function. A variance greater than one magnifies the change in kernel function to the mean, and this will amplify some of the small changes between the data. The intuitive application to indoor localization data augmentation is the ability to fit local extrema for a single WAP. To a certain extent, a larger variance can solve the problem of too smooth a kernel function for data augmentation, whose effect, however, is very limited; selecting appropriate kernel functions for data and application scenarios remains an open issue.
| Variance | 0.1 | 1 | 10 |
|---|---|---|---|
| 3D Error [m] | 8.96 | 8.70 | 8.82 |
In general, the length-scale controls the extrapolation capability of the model or defines the limiting distance to which the maximum predictable belongs. If is set to low, the model will place extra emphasis on areas with large data fluctuations. The large causes the model to lose its ability to capture subtle changes, so it is recommended to use a relatively small in indoor localization data augmentation. The result shown in Table V supports this conclusion.
| Length-scale | 1 | 10 | 100 |
|---|---|---|---|
| 3D Error [m] | 8.78 | 8.70 | 8.83 |
IV-A3 Impact of MOGP Models: LMC v.s. ICM
The differences between LMC and ICM and the impact of the number of kernel functions on the performance of the model have been discussed in Section III-A. Table VI shows the localization errors of different MOGP models using Matern52 kernel function with both variance and length-scale set to and augmentation ratio to 1. When , there was no statistically significant difference in the mean values after multiple independent calculations, especially given the fluctuations in the localization error estimates of the RNN. For the UJIIndoorLoc database only, the localization error reaches a minimum when the number of kernel functions is equal to the number of outputs of the MOGP . However, given the significant increase in computation time as increases for databases with a small number of APs, can be chosen to balance performance and efficiency when augmenting. This finding is also in line with other researchers’ suggestions for the number of latent processes [33, 32].
| MOGP Model | Numbers of Sample Q | 3D Error [m] |
| ICM | 1 | 8.70 |
| LMC | 2 | 8.60 |
| 3 | 8.58 | |
| 4 | 8.61 | |
| T | 8.42 |
IV-A4 Impact of Augmentation Ratio
Given the uneven spatial distribution of measurement points in the original database, and even the absence of measurements in some areas, it would be valuable to discuss the scale of data augmentation. The augmentation ratio is defined as
| (17) |
Excessive data augmentation significantly increases the amount of augmented data over the original data, which would cause overfitting the RNN and the ignorance of the features of the original data. Also a small augmentation ratio may leave the areas not covered by the original data still not covered by the augmented data as well, making the RNN unable to capture the fingerprint features in that areas during the localization estimation; it may also mark augmentation data as noise. Table VII shows the errors in the localization estimates for different augmentation ratios. Unlike the previous experiments, the results in Table VII use LMC, and latent variables. The localization error can therefore be taken to a minimum when the augmentation ratio is applied. Also in the quest for maximum spatial coverage, the amount of data can be expanded by a factor of 10 with a 95% confidence interval, using the unaugmented data as a benchmark.
| Ratio | 0.05 | 0.5 | 1 | 5 | 10 | Original [11] |
|---|---|---|---|---|---|---|
| 3D Error [m] | 9.44 | 8.93 | 8.59 | 8.68 | 8.74 | 8.62 |
The optimal parameters of the MOGP-based multidimensional indoor localization data augmentation algorithm for large-scale building complexes and its error performance are given in a comprehensive discussion of the above parameters. Table VIII summarizes the optimal results from [13].
| Parameter | Value |
| Kernel Function | Matern52 |
| Variance | 1 |
| Length-scale | 10 |
| Model | LMC |
| Number of Sample Q | T |
| Augmentation Ratio | 1 |
| 3D Error Mean [m] | 8.59 |
| 3D Error Minimum [m] | 8.42 |
IV-B Offline Evaluation
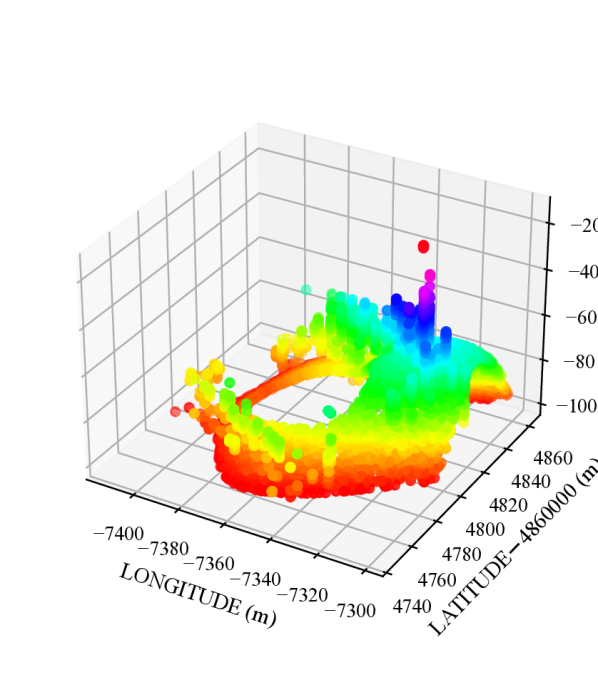
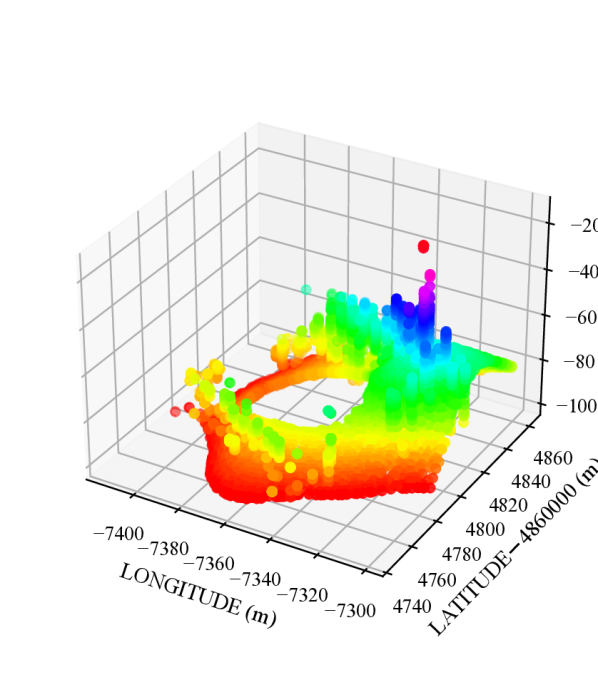
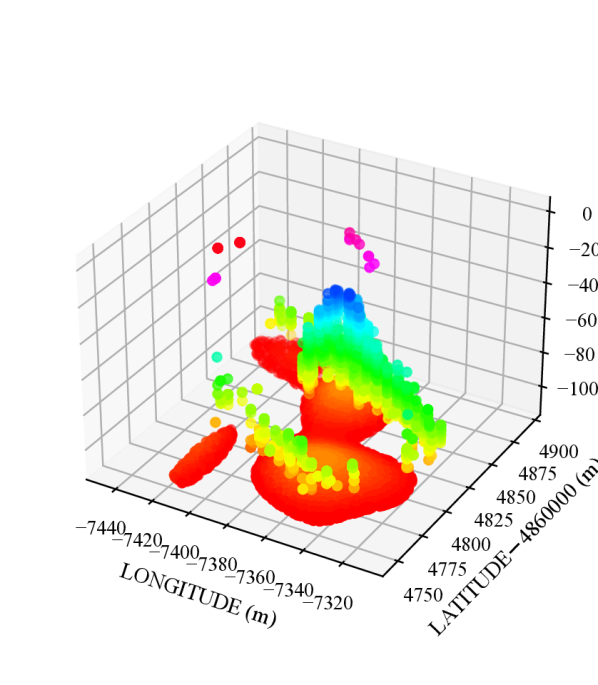
It is worth noting that since the UJIIndoorLoc database includes a total of 520 WAPs and the data augmentation using kernel functions with similar structures have limited changes on a single WAP data, usually the variance change of the data is less than one. Therefore, although we used MOGP to regress all the WAPs, we did not show all of them but selected some of the WAPs with significant and representative changes for visualization. The offline evaluation focuses on comparing the RSSI values of the same WAP under different kernel functions. More perspectives are mentioned in the online evaluation Section IV-A including kernel functions, hyperparameters, MOGP models, and the impact of the augmentation ratio on data augmentation. The principle of selecting WAP is to compare the variance of the augmented data with that of the original data. The variance of WAP can be defined as,
| (18) |
Fig. 6 shows the original RSSI value of WAP500 and augmented data with different kernel functions. Note that in order to highlight changes, data points with RSSI values less than or equal to -110 are not drawn, which results in a blank at the bottom of Fig. 6 and does not mean that the area lacks coverage by RPs. Fig. 6 (a) is original data which is distinctly different from Fig. 6 (b)–(f) because it is stored in a discrete form in the database. Fig. 6 and Fig. 7 show similar red bases since the augmentation results appear as a Gaussian hyperplane, and the smoothness of the kernel function causes the augmented data to be generated by gradually fitting the RSSI value of -110 dBm to the target value, which is more apparent in Fig. 7. The difference between the several kernel functions, therefore, lies mainly in their ability to describe the mutant data, reflected in Fig. 6, as the sharpness with which the cave region at the bottom is connected to the surrounding data. Fig. 6 (f) does not have such a cavity which can also correspond to the 3D localization error mentioned in Table III. Considering a total of 520 WAPs, we therefore consider Fig. 6 (b)–(e) having a similar profile to be insufficient visual evidence of reduced 3D localization error in Table III.
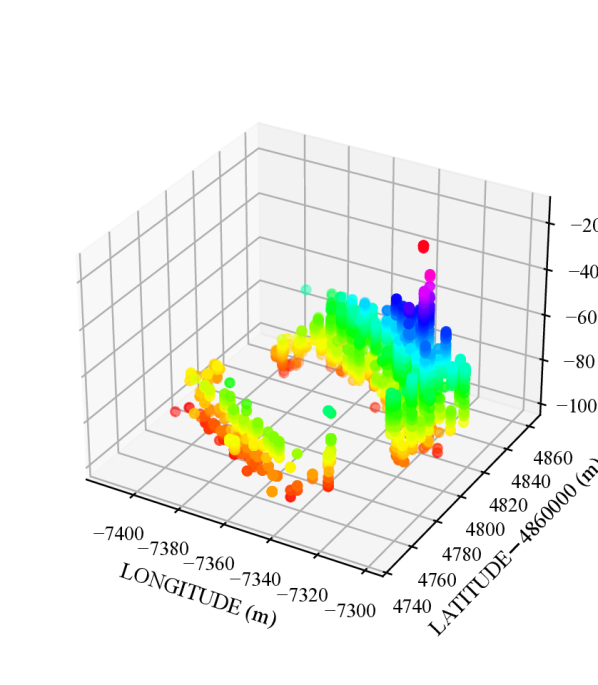
(a) Original
(b) RBF
(c) Matern32
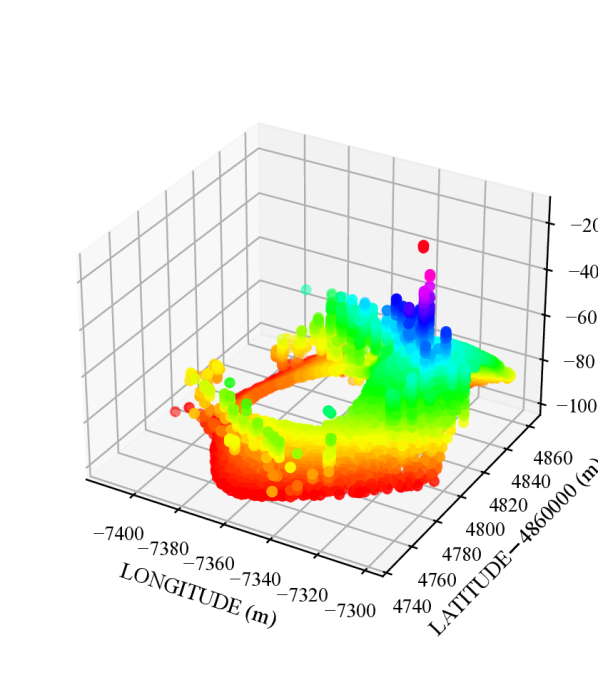
(d) Matern52
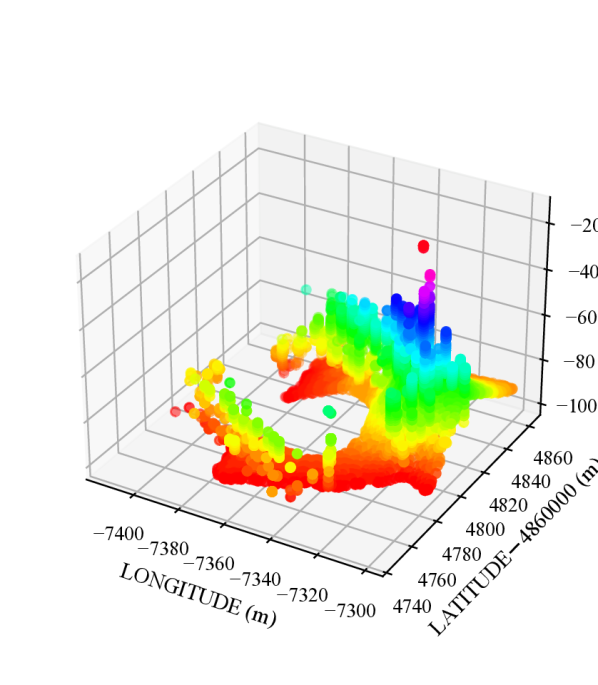
(e) OU
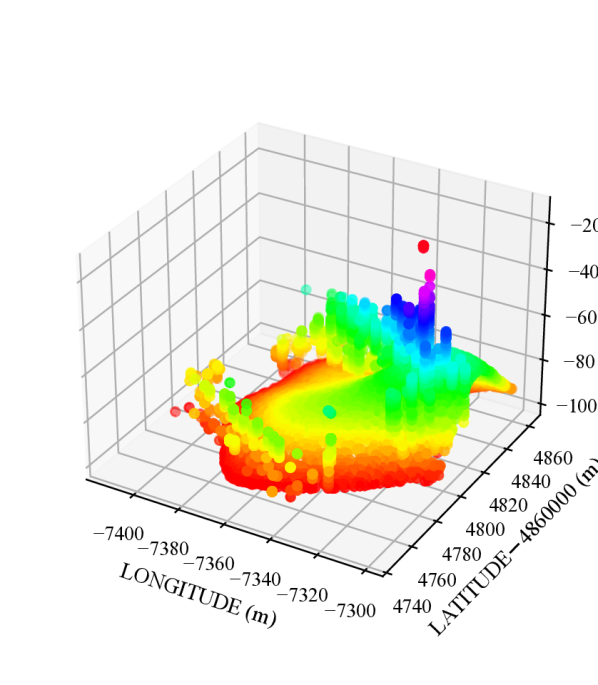
(f) RQ
Fig. 7 shows the RSSI values for WAP11 and combined with the Table III we believe that Fig. 7 (e)–(f) reflect that the OU and RQ kernel functions lack of ability to fit the tail data.
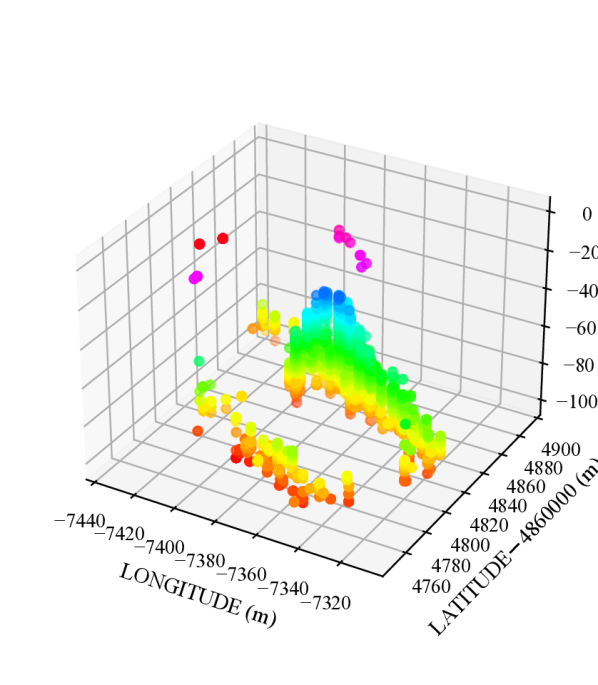
(a) Original

(b) RBF

(c) Matern32
(d) Matern52
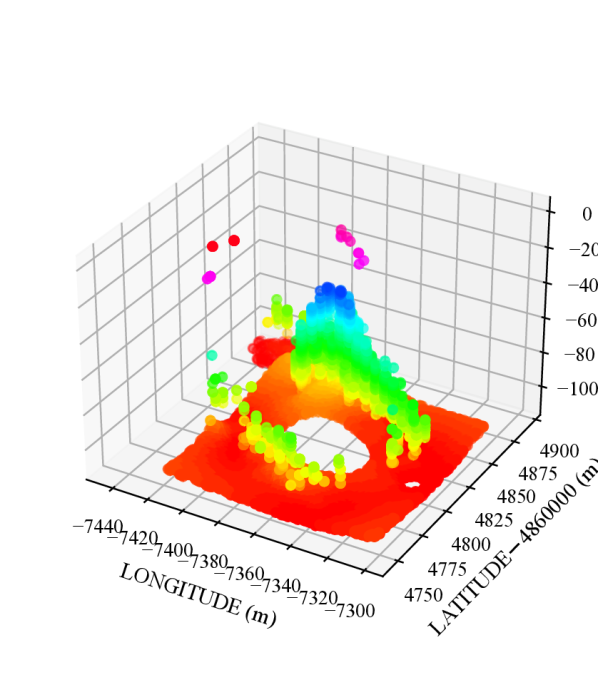
(e) OU
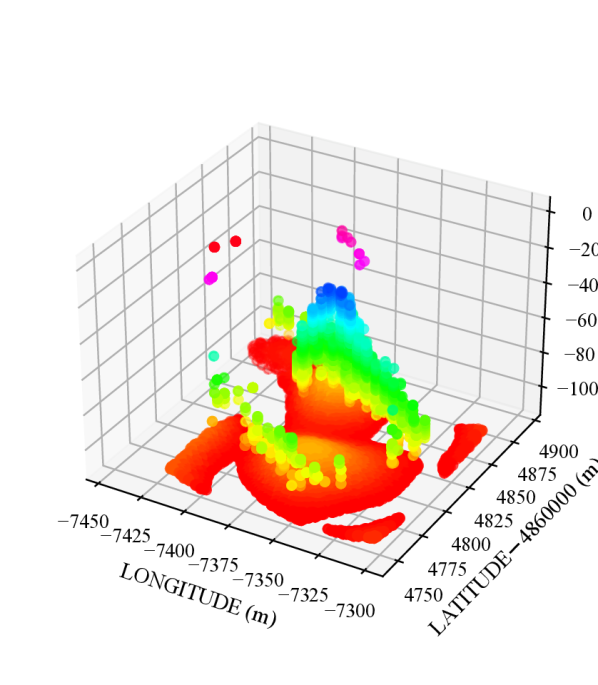
(f) RQ
V Conclusions
In this paper, we have proposed multidimensional fingerprint data augmentation for indoor localization in a large-scale building complex based on MOGP and systematically investigated the impact of the various aspects of MOGP-based augmentation on localization accuracy.
Through the extensive experiments using the UJIIndoorLoc database [14] and the-state-of-the-art neural network indoor localization model based on the hierarchical RNN [11], we first investigated the impact of MOGP kernel functions and their hyperparameters on the localization performance and found that Matern52 with the variance of 1 and the length-scale of 10 provides the best performance in the case of a single kernel function. As for MOGP models, we focused on the impact of the number of kernels of LMC (with ICM being the special case of LMC for ) and found that the localization error becomes minimum when is equal to the number of MOGP outputs for the UJIIndoorLoc database; we also found that can provide decent localization performance (i.e., second only to in Table VI) and hit the right balance between performance and efficiency as suggested in [33, 32].
The impact of data augmentation ratio was investigated, too, in order to explore the extent to which we can augment a fingerprint database with synthetically-generated fingerprints without diluting or losing the statistical characteristics of real ones. The experimental results suggests that we can generate synthetic RSSI fingerprint data up to ten times the original data—i.e., the augmentation ratio of 10—through the proposed multidimensional MOGP-based data augmentation without significantly affecting the indoor localization performance compared to that of the original data alone. The result of this investigation of data augmentation is especially important because this means that we can extend the spatial coverage of the combined RPs of a fingerprint database using the proposed MOGP-based data augmentation and thereby could improve the localization performance at the locations that are not part of the test dataset.
During our investigation of the impact of various aspects of MOGP-based data augmentation on localization accuracy, we focused our investigation of MOGP on the linear models of ICM and LMC and based the experiments only on the UJIIndoorLoc database. Our investigation in this paper, therefore, could be extended with other MOGP models and kernel functions better suited for indoor localization and multi-building and multi-floor databases.
One important issue of the existing fingerprint databases not considered in this paper is the inadequate consideration of interference factors, which are often time-varying: In large shopping malls and transport hubs, dense crowds of moving people are the main interference, while in underground car parks, a large number of temporary access points are the main interference. Fingerprint data augmentation taking into account those time-varying interference factors is another interesting topic for further research.
Acknowledgment
This work was supported in part by Postgraduate Research Scholarship (under Grant PGRS1912001) and Key Program Special Fund (under Grant KSF-E-25) of Xi’an Jiaotong-Liverpool University.
References
- [1] R. Leandro, H. Landau, M. Nitschke, M. Glocker, S. Seeger, X. Chen, A. Deking, M. BenTahar, F. Zhang, K. Ferguson et al., “RTX positioning: The next generation of cm-accurate real-time gnss positioning,” in Proceedings of the 24th international technical meeting of the satellite division of the Institute of Navigation (ION GNSS 2011), 2011, pp. 1460–1475.
- [2] F. van Diggelen, “Indoor GPS theory & implementation,” in 2002 IEEE Position Location and Navigation Symposium (IEEE Cat. No.02CH37284), 2002, pp. 240–247.
- [3] J. Kemper and H. Linde, “Challenges of passive infrared indoor localization,” in 2008 5th Workshop on Positioning, Navigation and Communication. IEEE, 2008, pp. 63–70.
- [4] H.-S. Kim and J.-S. Choi, “Advanced indoor localization using ultrasonic sensor and digital compass,” in 2008 International Conference on Control, Automation and Systems. IEEE, 2008, pp. 223–226.
- [5] A. Poulose and D. S. Han, “UWB indoor localization using deep learning LSTM networks,” Applied Sciences, vol. 10, no. 18, p. 6290, 2020.
- [6] M. Sugano, T. Kawazoe, Y. Ohta, and M. Murata, “Indoor Localization System using RSSI measurement of wireless sensor network based on ZigBee standard.” Wireless and Optical Communications, vol. 538, pp. 1–6, 2006.
- [7] M. Altini, D. Brunelli, E. Farella, and L. Benini, “Bluetooth indoor localization with multiple neural networks,” in IEEE 5th International Symposium on Wireless Pervasive Computing 2010. IEEE, 2010, pp. 295–300.
- [8] K. S. Kim, S. Lee, and K. Huang, “A scalable deep neural network architecture for multi-building and multi-floor indoor localization based on Wi-Fi fingerprinting,” Big Data Analytics, vol. 3, no. 1, Apr 2018. [Online]. Available: http://dx.doi.org/10.1186/s41044-018-0031-2
- [9] A. Yassin, Y. Nasser, M. Awad, A. Al-Dubai, R. Liu, C. Yuen, R. Raulefs, and E. Aboutanios, “Recent advances in indoor localization: A survey on theoretical approaches and applications,” IEEE Communications Surveys & Tutorials, vol. 19, no. 2, pp. 1327–1346, 2016.
- [10] F. Zafari, A. Gkelias, and K. K. Leung, “A survey of Indoor Localization Systems and Technologies,” IEEE Commun. Surveys Tuts., vol. 21, no. 3, pp. 2568–2599, 2019.
- [11] A. E. A. Elesawi and K. S. Kim, “Hierarchical multi-building and multi-floor indoor localization based on recurrent neural networks,” 2021.
- [12] Y. Xie, Y. Wang, A. Nallanathan, and L. Wang, “An improved K-Nearest-Neighbor indoor localization method based on spearman distance,” IEEE Signal Processing Letters, vol. 23, no. 3, pp. 351–355, 2016.
- [13] Z. Tang, S. Li, K. S. Kim, and J. Smith, “Multi-output Gaussian process-based data augmentation for multi-building and multi-floor indoor localization,” in 2022 IEEE International Conference on Communications Workshops (ICC Workshops), 2022, pp. 361–366.
- [14] J. Torres-Sospedra, R. Montoliu, A. Martínez-Usó, J. P. Avariento, T. J. Arnau, M. Benedito-Bordonau, and J. Huerta, “UJIIndoorLoc: A new multi-building and multi-floor database for WLAN fingerprint-based indoor localization problems,” in Proc. 2014 International Conference on Indoor Positioning and Indoor Navigation (IPIN), 2014, pp. 261–270.
- [15] E. S. Lohan, J. Torres-Sospedra, H. Leppäkoski, P. Richter, Z. Peng, and J. Huerta, “Wi-Fi crowdsourced fingerprinting dataset for indoor positioning,” Data, vol. 2, no. 4, p. 32, 2017.
- [16] J. Niu, B. Wang, L. Cheng, and J. J. P. C. Rodrigues, “WicLoc: An indoor localization system based on WiFi fingerprints and crowdsourcing,” in 2015 IEEE International Conference on Communications (ICC), 2015, pp. 3008–3013.
- [17] M. Frid-Adar, E. Klang, M. Amitai, J. Goldberger, and H. Greenspan, “Synthetic data augmentation using GAN for improved liver lesion classification,” in 2018 IEEE 15th International Symposium on Biomedical Imaging (ISBI 2018), 2018, pp. 289–293.
- [18] Z. Hussain, F. Gimenez, D. Yi, and D. Rubin, “Differential data augmentation techniques for medical imaging classification tasks,” in AMIA annual symposium proceedings, vol. 2017. American Medical Informatics Association, 2017, p. 979.
- [19] T. Lan, X. Wang, Z. Chen, J. Zhu, and S. Zhang, “Fingerprint augment based on super-resolution for WiFi fingerprint based indoor localization,” IEEE Sensors Journal, vol. 22, no. 12, pp. 12 152–12 162, 2022.
- [20] C. Shorten and T. M. Khoshgoftaar, “A survey on image data augmentation for deep learning,” Journal of big data, vol. 6, no. 1, pp. 1–48, 2019.
- [21] J. Wei and K. Zou, “Eda: Easy data augmentation techniques for boosting performance on text classification tasks,” arXiv preprint arXiv:1901.11196, 2019.
- [22] X. Li, P. Ye, J. Jin, F. Zhu, and F.-Y. Wang, “Data augmented deep behavioral cloning for urban traffic control operations under a parallel learning framework,” IEEE Transactions on Intelligent Transportation Systems, vol. 23, no. 6, pp. 5128–5137, 2022.
- [23] R. S. Sinha and S.-H. Hwang, “Improved RSSI-based data augmentation technique for fingerprint indoor localisation,” Electronics, vol. 9, no. 5, 2020. [Online]. Available: https://www.mdpi.com/2079-9292/9/5/851
- [24] R. S. Sinha, S.-M. Lee, M. Rim, and S.-H. Hwang, “Data augmentation schemes for deep learning in an indoor positioning application,” Electronics, vol. 8, no. 5, p. 554, 2019.
- [25] W. Njima, M. Chafii, A. Chorti, R. M. Shubair, and H. V. Poor, “Indoor localization using data augmentation via selective generative adversarial networks,” IEEE Access, vol. 9, pp. 98 337–98 347, 2021.
- [26] A. Hilal, I. Arai, and S. El-Tawab, “DataLoc+: A data augmentation technique for machine learning in room-level indoor localization,” in 2021 IEEE Wireless Communications and Networking Conference (WCNC), 2021, pp. 1–7.
- [27] H. Rizk, A. Shokry, and M. Youssef, “Effectiveness of data augmentation in cellular-based localization using deep learning,” in 2019 IEEE Wireless Communications and Networking Conference (WCNC), 2019, pp. 1–6.
- [28] W. Sun, M. Xue, H. Yu, H. Tang, and A. Lin, “Augmentation of fingerprints for indoor WiFi localization based on Gaussian Process Regression,” IEEE Transactions on Vehicular Technology, vol. 67, no. 11, pp. 10 896–10 905, 2018.
- [29] S.-S. Jan, S.-J. Yeh, and Y.-W. Liu, “Received signal strength database interpolation by Kriging for a Wi-Fi indoor positioning system,” Sensors, vol. 15, no. 9, pp. 21 377–21 393, 2015. [Online]. Available: https://www.mdpi.com/1424-8220/15/9/21377
- [30] Z. Chen, J. Fan, and K. Wang, “Remarks on multivariate Gaussian process,” arXiv preprint arXiv:2010.09830, 2020.
- [31] H. Liu, J. Cai, and Y.-S. Ong, “Remarks on multi-output Gaussian process regression,” Knowledge-Based Systems, vol. 144, pp. 102–121, 2018. [Online]. Available: https://www.sciencedirect.com/science/article/pii/S0950705117306123
- [32] T. V. Nguyen, E. V. Bonilla et al., “Collaborative multi-output Gaussian processes.” in UAI. Citeseer, 2014, pp. 643–652.
- [33] T. E. Fricker, J. E. Oakley, and N. M. Urban, “Multivariate Gaussian process emulators with nonseparable covariance structures,” Technometrics, vol. 55, no. 1, pp. 47–56, 2013.
- [34] D. Duvenaud, “Automatic model construction with Gaussian processes,” Ph.D. dissertation, Computational and Biological Learning Laboratory, University of Cambridge, 2014.
- [35] M. Kanagawa, P. Hennig, D. Sejdinovic, and B. K. Sriperumbudur, “Gaussian processes and kernel methods: A review on connections and equivalences,” 2018.
- [36] A. Wilson and R. Adams, “Gaussian process kernels for pattern discovery and extrapolation,” in International conference on machine learning. PMLR, 2013, pp. 1067–1075.
- [37] D. Duvenaud, “Automatic model construction with Gaussian processes,” Ph.D. dissertation, University of Cambridge, 2014.
- [38] M. L. Stein, Interpolation of spatial data: some theory for kriging. Springer Science & Business Media, 1999.
- [39] C. K. Williams and C. E. Rasmussen, Gaussian processes for machine learning. MIT press Cambridge, MA, 2006, vol. 2, no. 3.
- [40] GPy - a Gaussian Process (gp) framework in Python. [Online]. Available: https://gpy.readthedocs.io/en/deploy/
- [41] A. Moreira, M. J. a. Nicolau, F. Meneses, and A. Costa, “Wi-Fi fingerprinting in the real world - RTLSUM at the EvAAL competition,” in Proc. 2015 International Conference on Indoor Positioning and Indoor Navigation (IPIN), 2015, pp. 1–10.