Rethinking Batch Sample Relationships for Data Representation: A Batch-Graph Transformer based Approach
Abstract
Exploring sample relationships within each mini-batch has shown great potential for learning image representations. Existing works generally adopt the regular Transformer to model the visual content relationships, ignoring the cues of semantic/label correlations between samples. Also, they generally adopt the ‘full’ self-attention mechanism which are obviously redundant and also sensitive to the noisy samples. To overcome these issues, in this paper, we design a simple yet flexible Batch-Graph Transformer (BGFormer) for mini-batch sample representations by deeply capturing the relationships of image samples from both visual and semantic perspectives. BGFormer has three main aspects. (1) It employs a flexible graph model, termed Batch Graph to jointly encode the visual and semantic relationships of samples within each mini-batch. (2) It explores the neighborhood relationships of samples by borrowing the idea of sparse graph representation which thus performs robustly, w.r.t., noisy samples. (3) It devises a novel Transformer architecture that mainly adopts dual structure-constrained self-attention (SSA), together with graph normalization, FFN, etc, to carefully exploit the batch graph information for sample tokens (nodes) representations. As an application, we apply BGFormer to the metric learning tasks. Extensive experiments on four popular datasets demonstrate the effectiveness of the proposed model.
1 Introduction
Learning robust and discriminative image feature representation is a fundamental task in computer vision applications, such as image classification [17, 9], visual recognition [23, 18], object tracking [6, 12], metric learning [39, 11] and so on. With the development of deep learning, Convolutional Neural Networks (CNNs) have been widely used for image representation learning. However, CNNs just model the local information of images and thus fail to fully capture the global context information of images. It is well known that Transformers [44, 28] have achieved great successes in many visual representation and learning tasks due to their core self-attention mechanism to capture the long-range dependencies among visual units, e.g., patches, regions, etc. In recent years, various Transformer variants [16, 42, 4, 19] have been studied in computer vision task to facilitate the better image feature representation learning problem. For example, Dosovitskiy et al. [9] develop a Visual Transformer (ViT) architecture to model the contextual relationships of image regions and thus obtain the competitive image classification results. Liu et al. [28] propose a hierarchical vision Transformer with shifted windows, namely Swin Transformer, to produce the hierarchical feature representation by using hierarchical architecture. Rao et al. [35] propose a DynamicViT model to obtain the better classification results by dynamically pruning redundant image patches/regions. Chen et al. [6] introduce a Transformer Tracking (TransT) to combine template and search region features by using attention for object tracking task. Han et al. [16] develop a Vision GNN (ViG) architecture to generate graph-level feature by viewing the patches of image as nodes for visual tasks.
Beyond exploring local patch/region relationships for image representation, recent studies also propose to leverage Transformer to explore sample-level correlations for image representation learning [47, 19, 20]. One representative work is BatchFormer [19, 20] which aims to capture the interaction between all samples in each mini-batch to learn robust data representations. Wang et al. [47] recently propose QSFormer to deeply explore the interations between query and support samples for few-shot classification problem. However, existing models generally directly adopt the ideas of traditional Transformers [44, 9]. Also, they generally only focus on modeling the visual relationships among images, ignoring the important cues of semantic/label correlations among images. Moreover, existing BatchFormer generally adopts regular self-attention (SA) mechanism which learns each image by aggregating the information from all other samples. Obviously, this mechanism is redundant and also sensitive to the noisy samples.
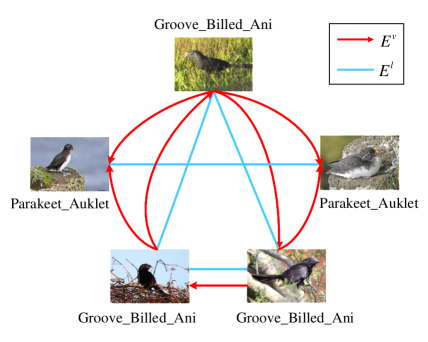
To overcome these limitations, in this paper, we rethink to explore sample relationships and propose a novel Batch-Graph Transformer (BGFormer) for robust data representation and learning. The key aspects of the BGFormer are twofold. First, it employs a flexible graph model, termed Batch Graph to deeply model the relationships of samples within each mini-batch. In particular, the proposed batch graph encodes both visual and semantic/label relationships of samples simultaneously in a unified model, as illustrated in Figure 1. Also, instead of utilizing the information of full relationships, our batch graph explores neighborhood relationships among samples by borrowing the idea of sparse graph representation [37, 55, 1] which thus perform robustly, w.r.t., noisy samples. Second, based on the built batch graph, we then develop a novel graph learning mechanism, termed Batch-Graph Transformer (BGFormer), which aims to learn contextual representations for samples in a mini-batch by conducting message passing on the batch graph, as illustrated in Figure 2. The core of BGFormer block is the dual Structure-constrained Self-attention (SSA) to simultaneously capture visual and semantic relationships for data representation.
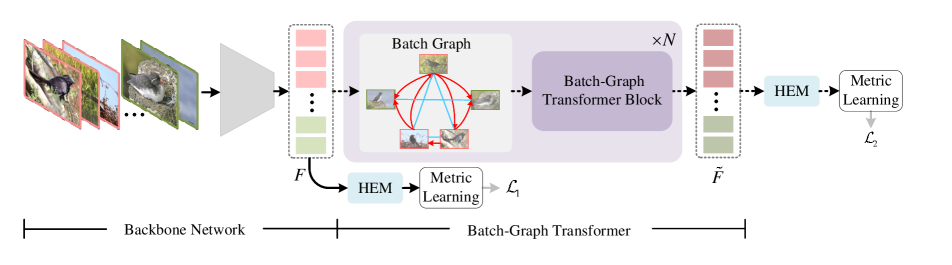
To validate the effectiveness of the proposed BGFormer, we apply it to the metric learning tasks and develop a new deep metric learning approach. As shown in Figure 3, our proposed metric learning framework is composed of backbone network, BGFormer module, hyperbolic embedding module and metric learning. We first utilize the backbone network to extract the initial features for data samples. Then, the proposed BGFormer is introduced to learn the more discriminative and richer representations by capturing the dependence of data samples. Finally, we utilize the hyperbolic embedding module with shared parameters to map the learned sample features into hyperbolic space for metric learning tasks, as used in work [19, 11].
Overall, the main contributions of this work are summarized as follows:
-
•
We rethink to deeply explore sample relationships and build a flexible batch graph model to encode both visual and label interactions among different samples in each mini-batch.
-
•
We design a novel BGFormer to explore sample relationships for robust and discriminative data representation in each mini-batch. The proposed BGFormer is simple and provides a general plug-and-play module for data representation and learning tasks.
-
•
We integrate BGFormer into a deep metric learning scheme and propose an effective end-to-end metric learning approach. Extensive experiments on four public popular datasets demonstrate the effectiveness and superiority of the proposed BGFormer.
2 Related Works
Vision Transformer. Since the Transformer architecture is proposed by Vaswani et al. [44] in 2017, it has been widely used in the field of computer vision (CV) due to its excellent modeling ability, including image classification [28, 35, 47], object re-identification [23, 18], object detection [3], object tracking [6, 12], etc. For example, Carion et al. [3] propose a Transformer encoder-decoder architecture, termed DEtection TRansformer (DETR for short), which drops multiple hand-designed components and builds the fully end-to-end object detector for object detection task. Liu et al. [28] design a hierarchical vision Transformer, which generates the feature representation with the shifted windows for image classification and other vision tasks. He et al. [18] introduce a pure Transformer-based object ReID framework, named TransReID, which splits each image as a sequence of patches and then feeds into TransReID to encode the feature representations for object ReID task. Zhang et al. [54] propose a Transformer-based backbone network based on dynamic graph message passing network for classification pretraining, object detection, instance and semantic segmentation. These works adopt the Transformer as enhanced feature extractor and get better performance.
On the other hand, some metric learning [10, 11] models are also developed based on the Transformer network. Specifically, El-Nouby et al. [10] directly introduce the Transformer architecture to obtain the image feature representation for metric learning task. Ermolov et al. [11] propose to combine the Transformer network and hyperbolic distance for obtaining the better results of metric learning. These works divide an image into a sequence of patches as the input of Transformer, but only model the contextual correlation of intra-image well. Seldom existing algorithms consider modeling relationships of inter-images using Transformer architecture. In this work, we propose a novel image-level Transformer network, termed Batch-Graph Transformer (BGFormer) which captures the visual and sematic/label relationship between all the input images in each mini-batch by constructing batch graph. Therefore, we can achieve better feature representation learning for high-performance classification.
Metric Learning. With the help of neural networks, the deep metric learning [50, 25, 36, 48, 41] achieves significant improvements compared with traditional methods. For example, Wu et al. [50] propose a distance weighted sampling strategy to uniformly extract samples according to the relative distance between samples for better embedding representation. Kim et al. [25] develop an attention-based ensemble based on multiple attention mask to improve the diverse of learners in feature embeddings for deep metric learning. Roth et al. [36] propose a model containing two encoder to explicitly learn the latent features shared between object classes in order to improve the performance of metric learning. Wang et al. [48] propose a cross-batch memory (XBM) mechanism to update the image features of recent mini-batches by memorizes the image embeddings of past mini-batches. Although good results can be obtained, however, these works adopt the CNN as their feature extractor which may obtain sub-optimal results only. In this work, we demonstrate the effectiveness of Transformer architecture by conducting experimental analysis and extend it to Batch-Graph Transformer to explore the sample relationship among all the input images in each mini-batch for more robust and discriminative feature representations.
Graph Representation Learning. The goal of graph representation learning [45, 55, 37, 52, 5] is to project the nodes of graph to vector representations and retain as much topological information as possible. In early years, local sparse and low-rank graph shallow learning models have been widely studied [37, 55, 1], such as, Jiang et al. [1] propose Graph Laplacian PCA by incorporate local -NN graph learning into PCA. In recent years, graph neural networks (GNNs) and graph Transformers have been studied. For example, Kipf et al. [26] propose Graph Convolutional Network (GCN), which applies convolution operation to graphs and models the local structure and node features of learning graphs through approximate analysis in the graph spectral domain. Veličković et al. [45] develop graph attention network (GAT), which computes the hidden representations of each node in the graph and follows a self-attention strategy to aggregate its neighbors. Jiang et al. [22] propose a Graph elastic Convolutional Network (GeCN) for local sparse graph data representation learning. Ying et al. [52] develop a Graphormer with centrality and spatial encodings to obtain the good results on graph representation learning. Chen et al. [5] propose a Structure-Aware Transformer to incorporate the structural information into the original self-attention.
In recent years, good performance has also been obtained by employing GCNs/GNNs on various computer vision tasks. For example, Qi et al. [33] propose a Graph Parsing Neural Network (GPNN) based on the message passing neural network to provide a HIO representation for spatial and spatial-temporal domains. Gao et al. [13] design a Graph Convolutional Tracking (GCT) to model structured representation of historical target exemplars for visual tracking. Chen et al. [7] propose a multi-label recognition model based on Graph Convolutional Networks to learn inter-dependent class-level representation. Xie et al. [51] develop a scale-aware graph neural network (SAGNN) to learn the cross-scale relations between support-query image pairs for few-shot semantic segmentation. Differently, in this work, we introduce batch graph to model both visual and semantic/label relationships between all the input images in each mini-batch and develop a Batch-Graph Transformer for image-level representation and learning.
3 Methodology
In this section, we propose a novel Batch-graph Transformer (BGFormer) model to deeply capture the relationships of samples in the mini-batch for data representation. BGFormer has two aspects, i.e., i) batch graph construction and ii) representation learning on batch graph, as introduced below in detail.
3.1 Building Batch Graph
To fully encode the relationships of samples in each mini-batch, we build a dual-relational graph which encodes both visual and label correlations among different data samples, as illustructed in Figure 1.
Nodes. Each node in the batch graph denotes each sample in the mini-batch. Let denotes the initial CNN feature descriptor for sample node . Let represents the collection of node’s initial features where is the total number of samples (i.e., batch size) in a mini-batch size. In our experiments, we empirically set the batch size to 900 and thus we have .
Edges. The edge set in our batch graph involves two types of edges, i.e., encodes the visual content relationships and represents the label relationships among samples. For visual-type edges , we adopt the neighboring connection strategy111Some more compact sparse graphs [55, 22] can also be adopted here.. To be specific, we first learn the affinities/similarities among data samples as as suggested in the simplified self-attention [15]. Then, each node connects to the node that are belong to its nearest neighborhood, i.e., , as shown in Figure 1. We can use the weight adjacency matrix to represent visual-type edge connections which is defined as follows,
| (1) |
where denotes the nearest neighborhoods of node .
In addition to visual correlations, we also represent the label correlations of data samples via label-type edge set . To be specific, each edge connects node and if they have the identical class label. We can use an adjacency matrix to encode the label edge connections which is defined as
| (2) |
where denotes the label of sample node .
3.2 Batch-Graph Transformer
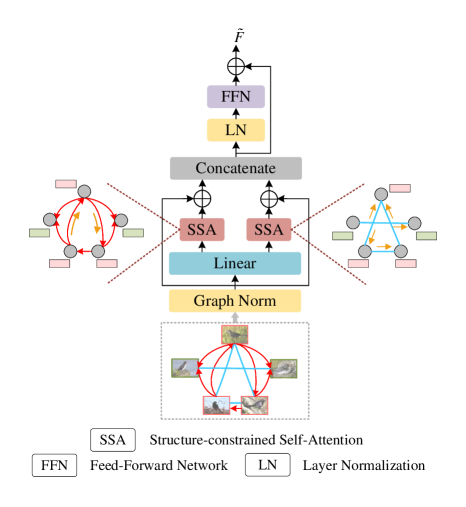
Overall, the proposed BGFormer module involves multiple BGFormer encoders and a layer-norm (LN) is used between different blocks, as shown in Figure 2. Different from regular Transformer encoder, our BGFormer encoder first leverages two structure-constrained self-attention blocks to propagate information across neighboring samples (tokens) and then fuses them together, followed by LN, FFN and residual operation to output the final data representations.
Specifically, based on the above batch graph representation , we first conduct Structure-constrained Self-attention (SSA) on batch graph as
| (3) | |||
| (4) |
where denotes the graph normalization operation, such as linear normalization, softmax and symmetric Laplacian normalization [26]. denotes the weight of linear projection which is shared on two SSA blocks to achieve information communication across two blocks. In this paper, for visual affinity , we use the linear normalization as follows,
| (5) |
For label affinity , we use the symmetric Laplacian normalization as
| (6) |
where denotes the identity matrix and is a diagonal matrix with .
After the above SSA module, we then fuse them together by simply combing them as
| (7) |
where denotes the balanced hyper-parameter. Finally, we introduce residual connection and feed-forward network (FFN) on to output the final data representation as follows,
| (8) |
where denote layer normalization and is composed of two fully-connected layers.
4 Application: Metric Learning
To verify the effectiveness of our proposed BGFormer, we apply it on the metric learning tasks. As shown in Figure 3, the BGFormer-based metric learning framework mainly consists of backbone network, BGFormer module, hyperbolic embedding module and metric learning.
Let be the inputs of backbone network, where is the corresponding label of image and denotes the number (i.e., batch size) of images in each mini-batch. The backbone network is a feature extraction network, which can be CNNs [17, 21] (e.g., ResNet-50) or Transformer [9, 42, 4] (e.g., ViT, DeiT and DINO). In this work, we employ ViT-S [9] with adding the global average pooling (GAP) layer as the backbone network to generate the initial image feature descriptors . Its parameters are initialized by using the pre-trained model on ImageNet-21K [8] for classification tasks. Then, we feed the initial image features into the proposed BGFormer module to fully explore the relationships of images in each mini-batch for learning the enhanced representations . After that, based on the image features and , we use the Hyperbolic Embedding module (HEM) involving fully-connected (FC) layer and hyperbolic mapping, which embeds them into the hyperbolic space to calculate the hyperbolic distances between pairs of samples [11]. Finally, we leverage the pairwise cross-entropy loss function which defined on pair-wise distance [11] to achieve the metric learning task.
Since the BGFormer module is not utilized in the testing stage, to transfer the knowledge of training process to the test stage, we derive two Hyperbolic Embedding (HEM) and metric learning branches for the outputs and respectively, as suggested in work [19]. Both learning branches share the same parameters to achieve the knowledge communication. Let and denote the pairwise cross-entropy loss for these two branches. Then, the total loss of our method is formulated as
| (9) |
where is a balanced hyper-parameter.
| Method | dim | CUB-200-2011 (K) | Cars-196 (K) | SOP (K) | In-Shop (K) | ||||||||||||
|---|---|---|---|---|---|---|---|---|---|---|---|---|---|---|---|---|---|
| 1 | 2 | 4 | 8 | 1 | 2 | 4 | 8 | 1 | 10 | 100 | 1000 | 1 | 10 | 20 | 30 | ||
| SM [39] | 512 | 56.0 | 68.3 | 78.2 | 86.3 | 83.4 | 89.9 | 93.9 | 96.5 | 75.3 | 87.5 | 93.7 | 97.4 | 90.7 | 97.8 | 98.5 | 98.8 |
| HTL [14] | 512 | 57.1 | 68.8 | 78.7 | 86.5 | 81.4 | 88.0 | 92.7 | 95.7 | 74.8 | 88.3 | 94.8 | 98.4 | 80.9 | 94.3 | 95.8 | 97.2 |
| A-BIER [32] | 512 | 57.5 | 68.7 | 78.3 | 86.2 | 82.0 | 89.0 | 93.2 | 96.1 | 74.2 | 86.9 | 94.0 | 97.8 | 83.1 | 95.1 | 96.9 | 97.5 |
| ABE [25] | 512 | 60.6 | 71.5 | 79.8 | 87.4 | 85.2 | 90.5 | 94.0 | 96.1 | 76.3 | 88.4 | 94.8 | 98.2 | 87.3 | 96.7 | 97.9 | 98.2 |
| NSoftmax [53] | 512 | 61.3 | 73.9 | 83.5 | 90.0 | 84.2 | 90.4 | 94.4 | 96.9 | 78.2 | 90.6 | 96.2 | - | 86.6 | 97.5 | 98.4 | 98.8 |
| SoftTriple [34] | 512 | 65.4 | 76.4 | 84.5 | 90.4 | 84.5 | 90.7 | 94.5 | 96.9 | 78.6 | 86.6 | 91.8 | 95.4 | - | - | - | - |
| MS [46] | 512 | 65.7 | 77.0 | 86.3 | 91.2 | 84.1 | 90.4 | 94.0 | 96.5 | 78.2 | 90.5 | 96.0 | 98.7 | 89.7 | 97.9 | 98.5 | 98.8 |
| XBM [48] | 512 | 65.8 | 75.9 | 84.0 | 89.9 | 82.0 | 88.7 | 93.1 | 96.1 | 79.5 | 90.8 | 96.1 | 98.7 | 89.9 | 97.6 | 98.4 | 98.6 |
| Proxy-Anchor [24] | 512 | 68.4 | 79.2 | 86.8 | 91.6 | 86.1 | 91.7 | 95.0 | 97.3 | 79.1 | 90.8 | 96.2 | 98.7 | 91.5 | 98.1 | 98.8 | 99.1 |
| IRTR [10] | 384 | 76.6 | 85.0 | 91.1 | 94.3 | - | - | - | - | 84.2 | 93.7 | 97.3 | 99.1 | 91.9 | 98.1 | 98.7 | 98.9 |
| Margin [50] | 128 | 63.9 | 75.3 | 84.4 | 90.6 | 79.6 | 86.5 | 91.9 | 95.1 | 72.7 | 86.2 | 93.8 | 98.0 | - | - | - | - |
| FastAP [2] | 128 | - | - | - | - | - | - | - | - | 73.8 | 88.0 | 94.9 | 98.3 | - | - | - | - |
| MIC [36] | 128 | 66.1 | 76.8 | 85.6 | - | 82.6 | 89.1 | 93.2 | - | 77.2 | 89.4 | 94.6 | - | 88.2 | 97.0 | - | 98.0 |
| Hyp-ViT [11]∗ | 128 | 84.0 | 90.2 | 94.2 | 96.4 | 82.7 | 89.7 | 93.9 | 96.2 | 85.5 | 94.9 | 98.1 | 99.4 | 92.7 | 98.4 | 98.9 | 99.1 |
| BGFormer∗ | 128 | 86.6 | 92.0 | 94.9 | 96.7 | 86.0 | 91.9 | 95.2 | 97.3 | 86.4 | 95.4 | 98.4 | 99.5 | 92.8 | 98.5 | 99.0 | 99.1 |
5 Experiments
5.1 Datasets and Evaluation Metrics
Datasets. We evaluate the proposed BGFormer based metric learning method on four public datasets, including CUB-200-2011 (CUB) [49] (200 classes, 11788 images), Cars-196 (Cars) [27] (196 classes, 16185 images), Stanford Online Product (SOP) [31] (22634 classes, 120053 images) and In-shop Clothes Retrieval (In-Shop) [29] (7986 classes, 52712 images), which are all splited into training set and testing set. Concretely, by following works [10, 11], we select 100 classes (5864 images), 98 classes (8054 images) and 11318 classes (59551 images) from CUB, Cars and SOP respectively for training and the rest classes are used for testing. For the In-Shop dataset, we select the first 3997 classes (25882 images) for training and split the remaining 3985 classes into a query set (14218 images) and a gallery set (12612 images) for testing.
Evaluation Metrics. In this work, we utilize the widely adopted Recall@K evaluation metric to compare the proposed method with previous metric learning methods. The Recall@K represents the ratio of the number of positive samples retrieved in the top-K results to the number of all positive samples in the testing set. For a fair comparison, following these works [53, 2, 48, 10, 11], for CUB and Cars, we set to 1, 2, 4 and 8. For SOP, we set to 1, 10, 100 and 1000. For In-Shop, we set to 1, 10, 20 and 30.
5.2 Implementation Details
In this work, we employ ViT-S [9] network pre-trained on the large-scale ImageNet-21k [8] as the backbone network for extracting the initial image feature representations. We execute our proposed model with Python and train the whole network in an end-to-end way.
The resolution of all images in the CUB dataset is set as . Following the work [11], other datasets are set as . In the training phase, we randomly select 100 classes and 9 samples per class in each mini-batch, i.e., batch size . Different learning rates are set for the backbone network and proposed BGFormer module, i.e., 3e-5 and 7.5e-4 respectively. The AdamW [30] is adopted as optimizer, with the weight decay 5e-5 to optimize the whole network. Our model can be trained well with a total number of 400 epochs, and we test the checkpoint every 5 epochs. The checkpoint with the best results is saved as the final model.
5.3 Comparison with State-of-the-Art Methods
The comparison results on CUB-200-2011 (CUB) [49], Cars-196 (Cars) [27], Stanford Online Product (SOP) [31] and In-shop Clothes Retrieval (In-Shop) [29] datasets are summarized in Table 1. We can clearly see that our proposed model outperforms all current state-of-the-art methods including CNN-based methods [50, 14, 32, 25, 53, 39, 34, 46, 2, 36, 48, 24] and Transformer methods [10, 11]. Note that our proposed approach achieves the best scores on all four settings on the CUB dataset. Specifically, our model improves the Hyp-ViT [11] based on Transformer architecture and hyperbolic distance by +2.6% in Recall@1 and +1.8% in Recall@2. The IRTR [10] is also developed based on Transformer architecture, however, we exceed this approach by a large margin, i.e., +10.0% in Recall@1 and +7.0% in Recall@2. Compared with the Proxy-Anchor [24] with the SOTA performance based on CNN architecture, we still obtain +18.2% and +12.8% improvements in Recall@1 and Recall@2 respectively.
From the experimental results on the Cars dataset, we can find that our model achieves the best performance on most of the evaluation metrics and the second best results on Recall@1. It beats the recent strong Hyp-ViT [11] which is developed based on Transformer architecture and hyperbolic space, by +3.3% in Recall@1 and +2.2% in Recall@2. Similar findings and conclusions can be found in the SOP and InShop datasets. In addition, it is worth noting that our proposed model with more minor or the same low-dimension embeddings achieves the SOTA performance for all datasets.
Overall, our proposed model obtains the best performance on both more challenging fine-grained datasets like Cars and CUB, and large-scale datasets with enormous classes like SOP and InShop. These experimental results fully demonstrate the effectiveness of the proposed model on learning more discriminative feature representations.
| Parameter | Recall @ K | |||
|---|---|---|---|---|
| 1 | 2 | 4 | 8 | |
| Default | 86.6 | 92.0 | 94.9 | 96.7 |
| d=384 | 86.6 | 91.9 | 94.8 | 96.5 |
| d=64 | 85.5 | 91.4 | 94.2 | 96.4 |
| d=16 | 85.0 | 90.9 | 94.5 | 96.5 |
| B=1200 | 86.4 | 91.8 | 94.8 | 96.7 |
| B=800 | 86.3 | 91.6 | 94.5 | 96.6 |
| B=400 | 85.7 | 91.4 | 94.5 | 96.2 |
| B=200 | 85.6 | 91.6 | 94.4 | 96.2 |
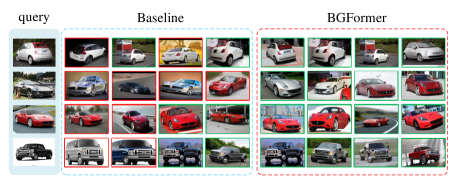
Qualitative Visualization. As shown in Figure 5, we give more visualizations of the top-4 ranking results on the Cars [27] dataset. The image with green boundary represents true positive samples and the red boundary denotes false positive samples. We can find that: 1). more true positives can be found in the proposed BGFormer. 2). the proposed BGFormer can accurately identify the same type of car with different colors, such as the 2-th and 4-th rows, which fully demonstrated the ability of BGFormer to close the intra-class gap. 3). the proposed BGFormer can well distinguish samples between different classes with little change, such as two types of cars in 2-th and 3-th rows. In summary, we can obtain higher accuracy using the proposed BGFormer for the metric learning task.
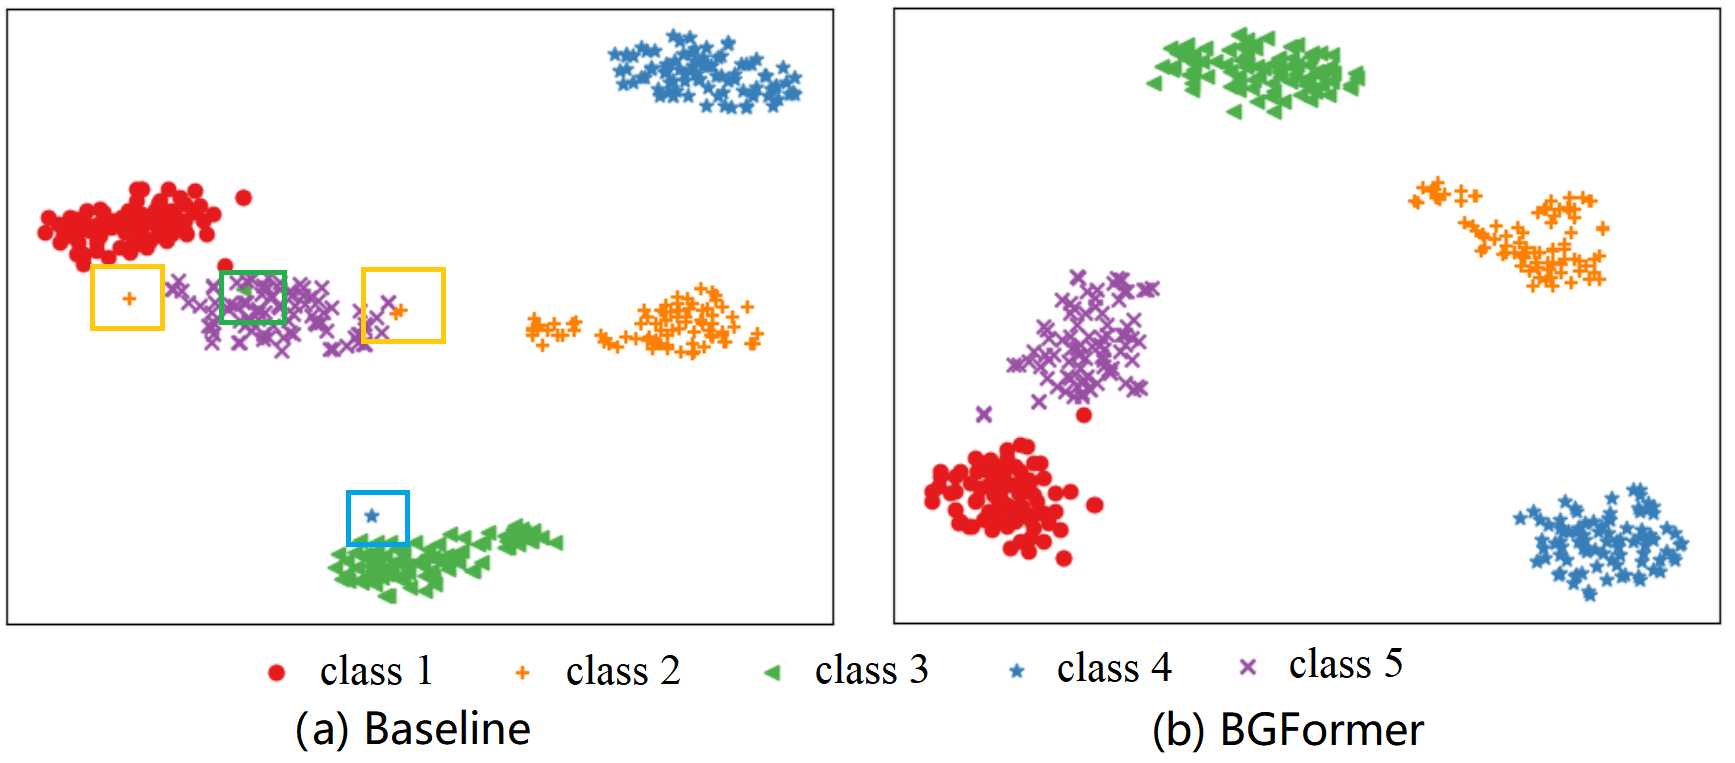
Representation Visualization. As shown in Figure 4, we show the 2D visualizations of the final image representations learned by the Baseline model [11] and the proposed BGFormer on Cars [27] dataset, respectively. Different colors indicate different classes. Intuitively, we can find that the Baseline model can learn the discriminative image feature representation. It is because of the utilization of powerful ViT-S [9] as the backbone network which is pre-trained on the large-scale ImageNet-21k dataset. However, the ‘outliers’ are common to see from Figure 4 (a) due to the baseline model only models the contextual correlation of intra-image but ignores the importance of the correlation of inter-images. In contrast, our proposed BGFormer significantly alleviates the issues of ‘outliers’ and obtains more discriminative feature representations (the distribution of images is also clearer than our Baseline). This visualization further proves the effectiveness of the proposed BGFormer for learning more discriminative and robust image representations.
| Methods | Backbone | CUB-200-2011 (K) | Cars-196 (K) | SOP (K) | In-Shop (K) | ||||||||||||
|---|---|---|---|---|---|---|---|---|---|---|---|---|---|---|---|---|---|
| 1 | 2 | 4 | 8 | 1 | 2 | 4 | 8 | 1 | 10 | 100 | 1000 | 1 | 10 | 20 | 30 | ||
| Baseline | ViT-S∗ | 84.7 | 90.9 | 94.2 | 96.5 | 83.9 | 90.2 | 94.3 | 96.9 | 83.1 | 93.5 | 97.6 | 99.3 | 90.8 | 97.9 | 98.6 | 98.8 |
| BGFormer | ResNet50 | 45.2 | 58.8 | 71.6 | 81.6 | 45.6 | 57.7 | 69.8 | 80.0 | 73.1 | 86.9 | 94.4 | 98.2 | 76.0 | 92.9 | 95.0 | 96.0 |
| DeiT-S | 78.2 | 86.6 | 91.8 | 95.2 | 85.3 | 91.6 | 95.2 | 97.5 | 84.2 | 94.0 | 97.8 | 99.3 | 91.4 | 98.1 | 98.7 | 98.9 | |
| DINO | 80.1 | 87.9 | 92.8 | 95.4 | 87.7 | 93.1 | 96.0 | 97.5 | 84.5 | 94.2 | 97.8 | 99.3 | 91.7 | 98.1 | 98.8 | 99.0 | |
| ViT-S∗ | 86.6 | 92.0 | 94.9 | 96.7 | 86.0 | 91.9 | 95.2 | 97.3 | 86.4 | 95.4 | 98.4 | 99.5 | 92.8 | 98.5 | 99.0 | 99.1 | |
| Model | Method | CUB-200-2011(K) | Cars-196(K) | SOP(K) | In-Shop(K) | ||||||||||||
|---|---|---|---|---|---|---|---|---|---|---|---|---|---|---|---|---|---|
| 1 | 2 | 4 | 8 | 1 | 2 | 4 | 8 | 1 | 10 | 100 | 1000 | 1 | 10 | 20 | 30 | ||
| 1 | Baseline | 84.7 | 90.9 | 94.2 | 96.5 | 83.9 | 90.2 | 94.3 | 96.9 | 83.1 | 93.5 | 97.6 | 99.3 | 90.8 | 97.9 | 98.6 | 98.8 |
| 2 | +BatchFormer | 85.2 | 91.1 | 94.5 | 96.6 | 84.1 | 90.4 | 94.5 | 96.9 | 83.8 | 93.9 | 97.9 | 99.4 | 91.6 | 98.2 | 98.8 | 99.0 |
| 3 | +BGFormer(w/o LCG) | 86.1 | 92.2 | 94.9 | 96.6 | 85.1 | 91.1 | 94.8 | 97.2 | 85.3 | 94.7 | 98.1 | 99.4 | 92.2 | 98.4 | 99.0 | 99.1 |
| 4 | +BGFormer | 86.6 | 92.0 | 94.9 | 96.7 | 86.0 | 91.9 | 95.2 | 97.3 | 86.4 | 95.4 | 98.4 | 99.5 | 92.8 | 98.5 | 99.0 | 99.1 |
5.4 Ablation Study
In this section, we conduct extensive ablation studies to further investigate the influence of different modules or sets, such as embedding size, batch size, neighbor number, different backbone networks, etc.
Analysis of Embedding Size. As we all know, the dimension of feature embedding affects the running speed and the overall accuracy. The larger scale of output dimension may carry more information and brings us better performance, but also leads to inefficiency issue and require more computation cost. In this part, we test different embedding dimensions to investigate their influence on our final performance, including , and . As shown in Table 2, we can find that the performance decreases significantly when and is slightly improved when . Therefore, the embedding dimension is chosen as our default value in other experiments in this work.
Effect of Batch Size. Different from the standard Transformer [9, 42, 4] which extracts the patch-level features, in this work, we propose the BGFormer (Batch-Graph Transformer) to learn the image-level visual representations. Therefore, the batch size may be a key factor for the final performance. As shown in Table 2, we analyze this parameter on the CUB [49] dataset. It is easy to find that the overall performance benefits from the larger batch size , and will be relatively stable when the batch size . When the batch size , the performance will drop slightly. In our experiments, we set to achieve a good balance between the performance and the hardware limitation.
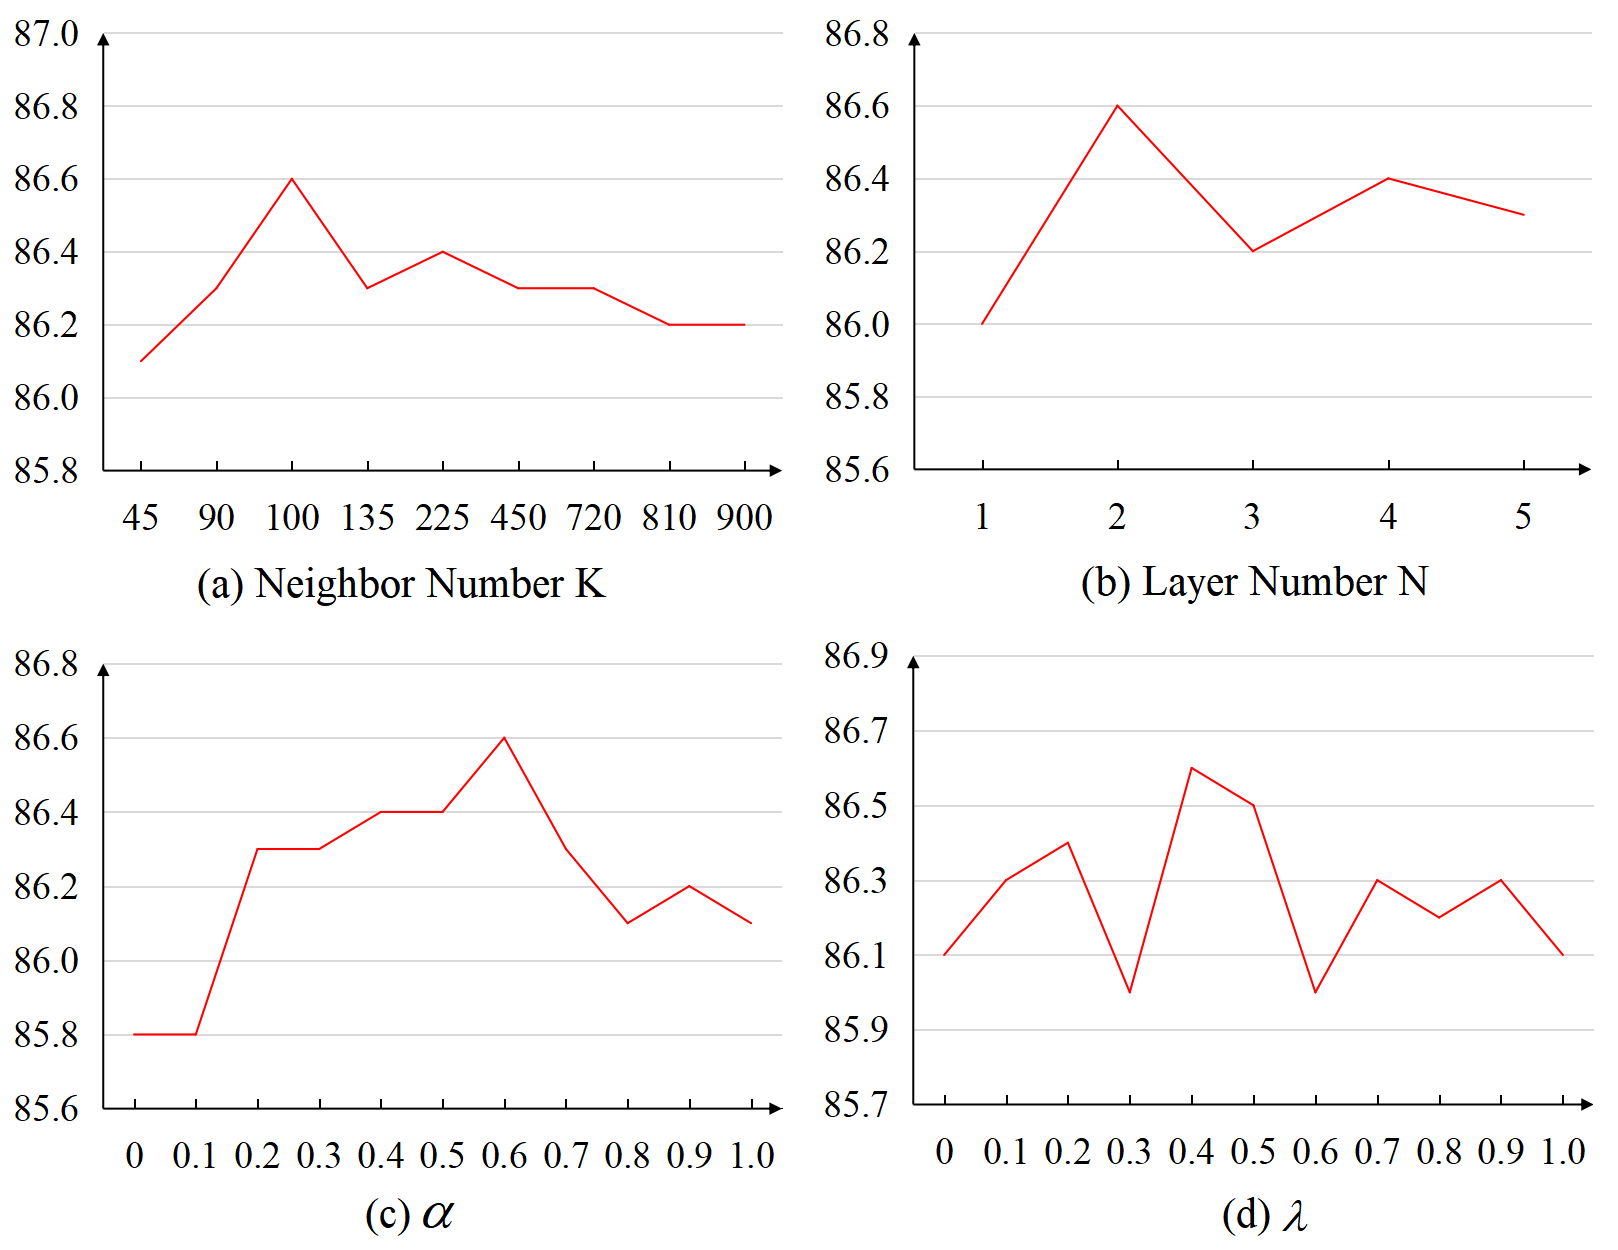
Effect of Neighbor Number. The neighbor number controls the computational complexity of structure-constrained self-attention based on visual graph in the proposed BGFormer module. The sparse operation can reduce the computational complexity of feature aggregation from to , where is a constant and . To this end, we study the influence of different number of neighbors, as shown in Figure 6 (a). We can see that the model performance increases with the decrease of neighbor number until . We speculate that the fewer irrelevant image samples are considered in feature aggregation, which reduces the impact of negative samples and makes the image features learned from the proposed model more discriminative. Therefore, we default set in all our experiments.
Analysis of Backbone Network. As shown in Table 3, we report the performance of four public datasets that extract initial image features based on different backbones, including ResNet50 [17, 21], DeiT-S [42], DINO [4], and ViT-S [9]. We can find that 1). the performance of Transformer architecture is obviously better than the ResNet50 network. 2). when equipping our proposed BGFormer with different backbones, i.e., DeiT-S and DINO, and ViT-S, most of our results are also better than the baseline method. 3). Our proposed BGFormer achieves the best performance when ViT-S is employed as the backbone network, except for the Cars [27] dataset. However, it achieves sub-optimal performance on the Cars dataset. As a result, ViT-S is adopted as the default backbone of our model in all our experiments.
Analysis of Different Components. To verify the effectiveness of each module in our proposed model, we conduct extensive ablation analysis as shown in Table 4. To be specific, the baseline (Model 1) adopts the standard ViT-S [9] model for deep metric learning as suggested in [11]. Based on this model, we directly add BatchFormer (Model 2) to model the relationships among samples in each mini-batch by following [19]. Instead of using full relations, we develop BGFormer (w/o LCG) by adding sparse graph representation to avoid the impact of negative samples (Model 3). In addition, we add structure-constrained self-attention based on semantic/label graph, terme Model 4.
The following observations can be clearly found from Table 4: 1) Compared with Model 1 (baseline), the performance of Model 2 is improved on four datasets, which indicates the effectiveness of modeling the sample correlation. 2) Compared with Model 2, Model 3 significantly improves the performance of baseline (Model 1) on four datasets, showing the effectiveness of our proposed BGFormer (w/o LCG) by reducing the impact of negative samples. 3) Compared with Model 3, Model 4 further improves the performance of BGFormer (w/o LCG), which indicates the effectiveness of dual structure-constrained self-attention (SSA). In summary, the effectiveness and superiority of each component in our proposed model can be fully verified with the experimental results.
5.5 Parameter Analysis
The following three parameters are very important for our model, i.e., number of BGFormer layers , in Equ.(9) and in Equ.(7). Several experiments are conducted on the CUB [49] dataset to check their influence. As shown in Figure 6 (b), when increasing the number of BGFormer layers , we can find that the model performance increases until . For parameter , as shown in Figure 6 (c), the model performance is continuously improved until . For parameter , the performance is continuously improved until , as illustrated in Figure 6 (d). As a result, we set , , and in our experiments to obtain better results.
6 Conclusion
In this paper, we rethink to explore sample relationships within each mini-batch for discriminative and robust data representation and learning. To this end, we first introduce a novel batch graph to jointly encode the visual and label relationships of samples via a unified model. Then, we develop a novel BGFormer to learn sample-level representation. BGFormer adopts the dual SSA mechanism to conduct message passing on the batch graph and fuses both visual and label cues together, followed by some FFN, LN operations, to obtain the enrichment data representations. To validate the effectiveness of the proposed BGFormer, we apply it to metric learning tasks and obtain better performance on four benchmark datasets.
References
- [1] Jiang Bo, Chris Ding, Bin Luo, and Jing Tang. Graph-laplacian pca: Closed-form solution and robustness. In Proceedings of the IEEE Conference on Computer Vision and Pattern Recognition, pages 3492–3498, 2013.
- [2] Fatih Cakir, Kun He, Xide Xia, Brian Kulis, and Stan Sclaroff. Deep metric learning to rank. In Proceedings of the IEEE/CVF conference on computer vision and pattern recognition, pages 1861–1870, 2019.
- [3] Nicolas Carion, Francisco Massa, Gabriel Synnaeve, Nicolas Usunier, Alexander Kirillov, and Sergey Zagoruyko. End-to-end object detection with transformers. In Proceedings of European Conference on Computer Vision, pages 213–229, 2020.
- [4] Mathilde Caron, Hugo Touvron, Ishan Misra, Hervé Jégou, Julien Mairal, Piotr Bojanowski, and Armand Joulin. Emerging properties in self-supervised vision transformers. In Proceedings of the IEEE/CVF International Conference on Computer Vision, pages 9650–9660, 2021.
- [5] Dexiong Chen, Leslie O’Bray, and Katsten Borgwardt. Structure-aware transformer for graph representation learning. In Proceedings of the International Conference on Machine LearningInternational Conference on Machine Learning, pages 3469–3489, 2022.
- [6] Xin Chen, Bin Yan, Jiawen Zhu, Dong Wang, Xiaoyun Yang, and Huchuan Lu. Transformer tracking. In Proceedings of the IEEE/CVF Conference on Computer Vision and Pattern Recognition, pages 8126–8135, 2021.
- [7] Zhaomin Chen, Xiu-Shen Wei, Peng Wang, and Yanwen Guo. Learning graph convolutional networks for multi-label recognition and applications. IEEE Transactions on Pattern Analysis and Machine Intelligence, pages 1–1, 2021.
- [8] Jia Deng, Wei Dong, Richard Socher, Li-Jia Li, Kai Li, and Li Fei-Fei. Imagenet: A large-scale hierarchical image database. In 2009 IEEE conference on computer vision and pattern recognition, pages 248–255. Ieee, 2009.
- [9] Alexey Dosovitskiy, Lucas Beyer, Alexander Kolesnikov, Dirk Weissenborn, Xiaohua Zhai, Thomas Unterthiner, Mostafa Dehghani, Matthias Minderer, Georg Heigold, Sylvain Gelly, et al. An image is worth 16x16 words: Transformers for image recognition at scale. In International Conference on Learning Representations, 2020.
- [10] Alaaeldin El-Nouby, Natalia Neverova, Ivan Laptev, and Hervé Jégou. Training vision transformers for image retrieval. arXiv preprint arXiv:2102.05644, 2021.
- [11] Aleksandr Ermolov, Leyla Mirvakhabova, Valentin Khrulkov, Nicu Sebe, and Ivan Oseledets. Hyperbolic vision transformers: Combining improvements in metric learning. In Proceedings of the IEEE/CVF Conference on Computer Vision and Pattern Recognition, pages 7409–7419, 2022.
- [12] Zhihong Fu, Zehua Fu, Qingjie Liu, Wenrui Cai, and Yunhong Wang. Sparsett: Visual tracking with sparse transformers. 2022.
- [13] Junyu Gao, Tianzhu Zhang, and Changsheng Xu. Graph convolutional tracking. In Proceedings of the IEEE Conference on Computer Vision and Pattern Recognition, pages 4649–4659, 2019.
- [14] Weifeng Ge. Deep metric learning with hierarchical triplet loss. In Proceedings of the European Conference on Computer Vision (ECCV), pages 269–285, 2018.
- [15] Meng-Hao Guo, Zheng-Ning Liu, Tai-Jiang Mu, and Shi-Min Hu. Beyond self-attention: External attention using two linear layers for visual tasks. IEEE Transactions on Pattern Analysis and Machine Intelligence, 2022.
- [16] Kai Han, Yunhe Wang, Jianyuan Guo, Yehui Tang, and Enhua Wu. Vision gnn: An image is worth graph of nodes. arXiv preprint arXiv:2206.00272, 2022.
- [17] Kaiming He, Xiangyu Zhang, Shaoqing Ren, and Jian Sun. Deep residual learning for image recognition. In Proceedings of the IEEE conference on computer vision and pattern recognition, pages 770–778, 2016.
- [18] Shuting He, Hao Luo, Pichao Wang, Fan Wang, Hao Li, and Wei Jiang. Transreid: Transformer-based object re-identification. In Proceedings of the IEEE/CVF international conference on computer vision, pages 15013–15022, 2021.
- [19] Zhi Hou, Baosheng Yu, and Dacheng Tao. Batchformer: Learning to explore sample relationships for robust representation learning. In Proceedings of the IEEE/CVF Conference on Computer Vision and Pattern Recognition, pages 7256–7266, 2022.
- [20] Zhi Hou, Baosheng Yu, Chaoyue Wang, Yibing Zhan, and Dacheng Tao. Batchformerv2: Exploring sample relationships for dense representation learning. arXiv preprint arXiv:2204.01254, 2022.
- [21] Sergey Ioffe and Christian Szegedy. Batch normalization: Accelerating deep network training by reducing internal covariate shift. In International conference on machine learning, pages 448–456. PMLR, 2015.
- [22] Bo Jiang, Beibei Wang, Jin Tang, and Bin Luo. Gecns: Graph elastic convolutional networks for data representation. IEEE Transactions on Pattern Analysis and Machine Intelligence, PP:1–1, 04 2021.
- [23] Bo Jiang, Xixi Wang, Aihua Zheng, Jin Tang, and Bin Luo. Ph-gcn: Person retrieval with part-based hierarchical graph convolutional network. IEEE Transactions on Multimedia, 2021.
- [24] Sungyeon Kim, Dongwon Kim, Minsu Cho, and Suha Kwak. Proxy anchor loss for deep metric learning. In Proceedings of the IEEE/CVF Conference on Computer Vision and Pattern Recognition, pages 3238–3247, 2020.
- [25] Wonsik Kim, Bhavya Goyal, Kunal Chawla, Jungmin Lee, and Keunjoo Kwon. Attention-based ensemble for deep metric learning. In Proceedings of the European conference on computer vision (ECCV), pages 736–751, 2018.
- [26] Thomas N Kipf and Max Welling. Semi-supervised classification with graph convolutional networks. arXiv preprint arXiv:1609.02907, 2016.
- [27] Jonathan Krause, Michael Stark, Jia Deng, and Li Fei-Fei. 3d object representations for fine-grained categorization. In Proceedings of the IEEE international conference on computer vision workshops, pages 554–561, 2013.
- [28] Ze Liu, Yutong Lin, Yue Cao, Han Hu, Yixuan Wei, Zheng Zhang, Stephen Lin, and Baining Guo. Swin transformer: Hierarchical vision transformer using shifted windows. In Proceedings of the IEEE/CVF International Conference on Computer Vision, pages 10012–10022, 2021.
- [29] Ziwei Liu, Ping Luo, Shi Qiu, Xiaogang Wang, and Xiaoou Tang. Deepfashion: Powering robust clothes recognition and retrieval with rich annotations. In Proceedings of the IEEE conference on computer vision and pattern recognition, pages 1096–1104, 2016.
- [30] Ilya Loshchilov and Frank Hutter. Decoupled weight decay regularization. arXiv preprint arXiv:1711.05101, 2017.
- [31] Hyun Oh Song, Yu Xiang, Stefanie Jegelka, and Silvio Savarese. Deep metric learning via lifted structured feature embedding. In Proceedings of the IEEE conference on computer vision and pattern recognition, pages 4004–4012, 2016.
- [32] Michael Opitz, Georg Waltner, Horst Possegger, and Horst Bischof. Deep metric learning with bier: Boosting independent embeddings robustly. IEEE transactions on pattern analysis and machine intelligence, 42(2):276–290, 2018.
- [33] Siyuan Qi, Wenguan Wang, Baoxiong Jia, Jianbing Shen, and Song-Chun Zhu. Learning human-object interactions by graph parsing neural networks. In Proceedings of the European Conference on Computer Vision, pages 401–417, 2018.
- [34] Qi Qian, Lei Shang, Baigui Sun, Juhua Hu, Hao Li, and Rong Jin. Softtriple loss: Deep metric learning without triplet sampling. In Proceedings of the IEEE/CVF International Conference on Computer Vision, pages 6450–6458, 2019.
- [35] Yongming Rao, Wenliang Zhao, Benlin Liu, Jiwen Lu, Jie Zhou, and Cho-Jui Hsieh. Dynamicvit: Efficient vision transformers with dynamic token sparsification. Advances in neural information processing systems, 34:13937–13949, 2021.
- [36] Karsten Roth, Biagio Brattoli, and Bjorn Ommer. Mic: Mining interclass characteristics for improved metric learning. In Proceedings of the IEEE/CVF International Conference on Computer Vision, pages 8000–8009, 2019.
- [37] Sam T Roweis and Lawrence K Saul. Nonlinear dimensionality reduction by locally linear embedding. Science, 290(5500):2323–2326, 2000.
- [38] Olga Russakovsky, Jia Deng, Hao Su, Jonathan Krause, Sanjeev Satheesh, Sean Ma, Zhiheng Huang, Andrej Karpathy, Aditya Khosla, Michael Bernstein, et al. Imagenet large scale visual recognition challenge. International journal of computer vision, 115(3):211–252, 2015.
- [39] Yumin Suh, Bohyung Han, Wonsik Kim, and Kyoung Mu Lee. Stochastic class-based hard example mining for deep metric learning. In Proceedings of the IEEE/CVF Conference on Computer Vision and Pattern Recognition, pages 7251–7259, 2019.
- [40] Christian Szegedy, Wei Liu, Yangqing Jia, Pierre Sermanet, Scott Reed, Dragomir Anguelov, Dumitru Erhan, Vincent Vanhoucke, and Andrew Rabinovich. Going deeper with convolutions. In Proceedings of the IEEE conference on computer vision and pattern recognition, pages 1–9, 2015.
- [41] Eu Wern Teh, Terrance DeVries, and Graham W Taylor. Proxynca++: Revisiting and revitalizing proxy neighborhood component analysis. In European Conference on Computer Vision, pages 448–464. Springer, 2020.
- [42] Hugo Touvron, Matthieu Cord, Matthijs Douze, Francisco Massa, Alexandre Sablayrolles, and Hervé Jégou. Training data-efficient image transformers & distillation through attention. In International Conference on Machine Learning, pages 10347–10357. PMLR, 2021.
- [43] Laurens Van der Maaten and Geoffrey Hinton. Visualizing data using t-sne. Journal of machine learning research, 9(11), 2008.
- [44] Ashish Vaswani, Noam Shazeer, Niki Parmar, Jakob Uszkoreit, Llion Jones, Aidan N Gomez, Łukasz Kaiser, and Illia Polosukhin. Attention is all you need. Advances in neural information processing systems, 30, 2017.
- [45] Petar Veličković, Guillem Cucurull, Arantxa Casanova, Adriana Romero, Pietro Lio, and Yoshua Bengio. Graph attention networks. In International Conference on Learning Representations, 2018.
- [46] Xun Wang, Xintong Han, Weilin Huang, Dengke Dong, and Matthew R Scott. Multi-similarity loss with general pair weighting for deep metric learning. In Proceedings of the IEEE/CVF Conference on Computer Vision and Pattern Recognition, pages 5022–5030, 2019.
- [47] Xixi Wang, Xiao Wang, Bo Jiang, and Bin Luo. Few-shot learning meets transformer: Unified query-support transformers for few-shot classification. arXiv preprint arXiv:2208.12398, 2022.
- [48] Xun Wang, Haozhi Zhang, Weilin Huang, and Matthew R Scott. Cross-batch memory for embedding learning. In Proceedings of the IEEE/CVF Conference on Computer Vision and Pattern Recognition, pages 6388–6397, 2020.
- [49] Peter Welinder, Steve Branson, Takeshi Mita, Catherine Wah, Florian Schroff, Serge Belongie, and Pietro Perona. Caltech-ucsd birds 200. 2010.
- [50] Chao-Yuan Wu, R Manmatha, Alexander J Smola, and Philipp Krahenbuhl. Sampling matters in deep embedding learning. In Proceedings of the IEEE international conference on computer vision, pages 2840–2848, 2017.
- [51] Guo-Sen Xie, Jie Liu, Huan Xiong, and Ling Shao. Scale-aware graph neural network for few-shot semantic segmentation. In Proceedings of the IEEE/CVF Conference on Computer Vision and Pattern Recognition, pages 5475–5484, 2021.
- [52] Chengxuan Ying, Tianle Cai, Shengjie Luo, Shuxin Zheng, Guolin Ke, Di He, Yanming Shen, and Tieyan Liu. Do transformers really perform bad for graph representation? In Advances in Neural Information Processing Systems (NIPS), 2021.
- [53] Andrew Zhai and Hao-Yu Wu. Classification is a strong baseline for deep metric learning. arXiv preprint arXiv:1811.12649, 2018.
- [54] Li Zhang, Mohan Chen, Anurag Arnab, Xiangyang Xue, and Philip HS Torr. Dynamic graph message passing networks for visual recognition. IEEE Transactions on Pattern Analysis and Machine Intelligence, pages 1–17, 2022.
- [55] Liansheng Zhuang, Haoyuan Gao, Zhouchen Lin, Yi Ma, Xi Zhang, and Nenghai Yu. Non-negative low rank and sparse graph for semi-supervised learning. In Proceedings of the IEEE Conference on Computer Vision and Pattern Recognition, pages 2338–2335, 2012.