Effects of Active Galactic Nucleus Feedback on Cold Gas Depletion and Quenching of Central Galaxies
Abstract
We investigate the influence of active galactic nucleus (AGN) feedback on the galaxy cold gas content and its connection to galaxy quenching in three hydrodynamical simulations of Illustris, IllustrisTNG and SIMBA. By comparing to the observed atomic and molecular neutral hydrogen measurements for central galaxies, we find that Illustris over-predicts the cold gas masses in star-forming galaxies and significantly under-predicts them for quenched galaxies. IllustrisTNG performs better in this comparison than Illustris, but quenched galaxies retain too much cold gas compared with observations. SIMBA shows good agreement with observations, by depleting the global cold gas reservoir for quenched galaxies. We find that the discrepancies in IllustrisTNG are caused by its weak kinetic AGN feedback that only redistributes the cold gas from the inner disks to the outer regions and reduces the inner cold gas densities. It agrees with observations much better when only the cold gas within the stellar disk is considered to infer the star formation rates. From dependences of cold gas reservoir on the black hole mass and Eddington ratio, we find that the cumulative energy release during the black hole growth is the dominant reason for the cold gas depletion and thus the galaxy quenching. We further measure the central stellar surface density within 1 kpc () for the high-resolution run of IllustrisTNG and find a tight correlation between and black hole mass. It suggests that the observed decreasing trend of cold gas mass with is also a reflection of the black hole growth.
1 Introduction
How massive galaxies quench their star formation is one of the key questions in the study of galaxy evolution. Various physical mechanisms have been proposed to understand the quenching process (see e.g., Birnboim & Dekel, 2003; Dekel & Birnboim, 2006; Bower et al., 2006; Croton et al., 2006; Martig et al., 2009; Ishibashi & Fabian, 2012; Zolotov et al., 2015). Among them, the feedback from active galactic nuclei (AGNs) is thought to be one of the most effective channels to shut down star formation (see Heckman & Best, 2014, and references therein). In fact, studies using hydrodynamical simulations and semi-analytic models have shown that the observed galaxy properties, such as the stellar mass function, quenched fraction and morphology, can be reasonably reproduced only when AGN feedback is included in the galaxy formation models (see e.g., Di Matteo et al., 2005; McCarthy et al., 2011; Dubois et al., 2016; Beckmann et al., 2017; Kaviraj et al., 2017; Donnari et al., 2021).
Galaxy star formation is fueled by the cold gas supply, as indicated in the empirical relation between the star formation rate (SFR) surface density and the cold gas surface density, well known as the Kennicutt-Schmidt law (Schmidt, 1959; Kennicutt, 1998). It is generally agreed that the atomic neutral hydrogen (H i) gas needs to be converted to the molecular hydrogen (H2) to form stars (Wong & Blitz, 2002; Kennicutt et al., 2007; Bigiel et al., 2008; Leroy et al., 2008). Thus, star formation quenching could be due to the depletion of the H i gas reservoir, the prevention of conversion from H i to H2 or the low star formation efficiency () (Man & Belli, 2018) . The influence of AGN feedback in all these processes is of special importance for the galaxy formation models.
With the implementation of reasonable subgrid physics of star formation and feedback mechanisms, the modern hydrodynamical simulations generally agree well with the observed properties of galaxy stellar components (e.g., Vogelsberger et al., 2014; Schaye et al., 2015; Pillepich et al., 2018; Davé et al., 2019). However, it is becoming more challenging for them to reproduce the observations of neutral hydrogen gas (Crain et al., 2015; Guo et al., 2017, 2020; Diemer et al., 2019; Davé et al., 2020), including the cold gas mass functions (e.g., Keres et al., 2003; Zwaan et al., 2005; Martin et al., 2010; Jones et al., 2018; Fletcher et al., 2021) and the cold gas scaling relations (see Saintonge & Catinella, 2022, for a review).
The cold gas content in galaxies can also provide important clues to the causes of galaxy quenching (e.g., Appleby et al., 2020; Davé et al., 2020; Davies et al., 2020; Piotrowska et al., 2022; Ward et al., 2022). However, a key limitation of the current cold gas observations is the lack of large and homogeneous catalogs that fairly sample the star-forming and quenched galaxies. The less cold gas content in the quenched galaxies makes their H i or H2 signals typically below the detection limits of the relevant surveys. The spectra stacking technique can be adopted to bypass this limitation to obtain the average cold gas masses for different populations (see e.g., Fabello et al., 2011; Saintonge et al., 2016; Ellison et al., 2019; Guo et al., 2020).
By spectra stacking the H i signals of star-forming and quenched galaxies, Guo et al. (2021) (hereafter G21) found that star formation in the local universe is directly regulated by the available H i gas reservoir, extending the previous results based on much smaller samples (Saintonge et al., 2016). Therefore, measuring the H i and H2 gas in AGN and non-AGN host galaxies is helpful for understanding the influence of AGN feedback. However, direct observational probes of the gas content reveal no strong differences between AGN and non-AGN hosts, for H i (Fabello et al., 2011; Geréb et al., 2015; Ellison et al., 2019) and H2 gas (Saintonge et al., 2017; Shangguan et al., 2020). Indirect probes of the total cold gas mass based on the gas-to-dust ratio have reported similar or even higher gas masses of AGN hosts (Vito et al., 2014; Shangguan et al., 2018; Shangguan & Ho, 2019). It has been suggested that AGN feedback might only directly affect the cold gas in the central regions of galaxies, and is ineffective at clearing out gas at larger radii and thus has little effect on the total gas mass (Fluetsch et al., 2019; Ellison et al., 2021). While the short timescale of AGN activity may play a role in the observed gas properties of AGN and non-AGN hosts, the self-regulating black hole growth (Heckman & Best, 2014) would also suggest that galaxies with higher cold gas content tend to have stronger AGN feedback, as shown in some recent works (Koss et al., 2021; Guo et al., 2022).
In order to better understand the role of AGN in star formation quenching, in this paper, we make use of three state-of-the-art hydrodynamical simulations, Illustris (Vogelsberger et al., 2014), IllustrisTNG (Marinacci et al., 2018; Naiman et al., 2018; Nelson et al., 2018; Pillepich et al., 2018; Springel et al., 2018) and SIMBA (Davé et al., 2019). By comparing their simulated H i gas masses in star-forming and quenched galaxies with the observed values of G21, we are able to investigate the potential observational effects of AGN feedback in different galaxy formation models. Since the gas content of satellite galaxies suffers from severe environmental effects, like ram-pressure and tidal stripping (Brown et al., 2017; Cortese et al., 2021; Wang et al., 2021, 2022), we focus on studies of central galaxies (i.e. locating at the centers of their host dark matter halos) as in G21.
The organization of this paper is as follows. In Section 2, we introduce the simulations and observational data we used. We show the results in Section 3. Discussions and conclusions are presented in Section 4 and Section 5, respectively. Throughout the paper, the stellar and H i masses are all in units of . We assume a flat CDM cosmology of , , and , consistent with the H i observations.
2 Data and Method
2.1 Observational Measurements
We adopt the observational measurements of average H i masses for star-forming galaxies (hereafter SFGs) and quenched galaxies (hereafter QGs) from G21 for central galaxies only. They were obtained from stacking the H i spectra (Guo et al., 2020) in the overlap regions between the H i data of Arecibo Fast Legacy ALFA Survey (ALFALFA; Giovanelli et al., 2005; Haynes et al., 2011, 2018) and the optical main galaxy sample of the Sloan Digital Sky Survey (SDSS; York et al., 2000) DR7 (Abazajian et al., 2009). The central galaxies are identified using the galaxy group catalog of Lim et al. (2017). Due to the H i flux limit of the ALFALFA survey, their measurements are only in the redshift range of , which can be directly compared with the simulation outputs at . The accuracy of such an H i stacking method has been verified using mock galaxy catalogs (Chauhan et al., 2021).
The H i mass measurements in G21 are in fact , as the average is obtained by co-adding the H i fluxes of stacked galaxies. We refer readers to G21 for the details of H i spectra stacking. For fair comparisons, we will also measure the same quantity in the following simulations. The galaxy stellar mass and star formation rate in G21 are adopted from the GSWLC-2 catalog (Salim et al., 2018) using the UV/optical spectral energy distribution (SED) fitting to the photometry of SDSS galaxies.
2.2 Illustris simulation
In this paper, we use the highest-resolution simulation of the Illustris suite, Illustris-1 (Nelson et al., 2015), which was run using the AREPO code (Springel, 2010), with a volume of . The dark matter and baryon mass resolutions are and , respectively (Vogelsberger et al., 2014). The AGN feedback model in Illustris is comprised of three different modes, i.e. quasar, radio and radiative modes (Sijacki et al., 2015). In the high-accretion quasar mode, a small fraction of the AGN bolometric luminosity is thermally and isotropically coupled to the surrounding gas with an efficiency of 0.05, which would lead to effective energy-driven outflows.
The most important feature of the Illustris AGN model is in the low-accretion radio mode, where hot bubbles are randomly injected into the circumgalactic medium (CGM) within a sphere around each black hole (Sijacki et al., 2007). The sphere radius is twice the bubble radius and the injected thermal energy is determined by,
| (1) |
where is the efficiency of mechanical heating by bubbles, the radiative efficiency is set as 0.2 (Sijacki et al., 2015), is the increased black hole mass, and is the speed of light. The bubble radius is calculated from both and the density of surrounding CGM.
The transition from quasar to radio mode in Illustris happens when the Eddington ratio drops below a threshold of 0.05. The Eddington ratio is defined as,
| (2) |
with being the Eddington accretion rate. The radiative AGN feedback in Illustris is added by modifying the net gas cooling rate in the vicinity of the black hole particle.
Though Illustris can explain observations well in many aspects, it is found that its gas fractions of galaxy groups and clusters are too low (Genel et al., 2014). This may be ascribed to the excessive gas removal by the thermal bubbles injected in the radio mode, as also found in this work.
2.3 IllustrisTNG simulation
The IllustrisTNG (hereafter TNG) simulation (Nelson et al., 2019a) is improved upon Illustris in both the numerical techniques of the AREPO code (Pakmor et al., 2016) and the galaxy formation model (Weinberger et al., 2017; Pillepich et al., 2018). The most significant difference is that the radio bubble feedback in Illustris is replaced with the kinetic wind feedback in TNG. As in Illustris, the thermal energy is injected in a small volume around each black hole for the high-accretion state in the thermal mode. But in the low-accretion state, once the black holes accumulate enough energy above a certain threshold, the kinetic energy will be released as a momentum boost to the gas cells in the feedback region. The feedback energy is formulated as
| (3) |
where the coupling efficiency is proportional to the surrounding gas density and has a maximum of (more details are presented in Weinberger et al., 2017).
The threshold of for the transition from thermal mode to kinetic mode is determined by,
| (4) |
As shown in Terrazas et al. (2020), the AGN feedback will be gradually dominated by the kinetic mode when exceeds .
In this paper, we focus on the TNG100-1 simulation, with a box size of on a side. The dark matter particle and gas cell masses are slightly larger than those in Illustris due to the use of Planck2015 cosmology instead of WMAP-9. For both Illustris and TNG, the stellar mass for each galaxy is defined as the total mass of stellar particles within twice the stellar half mass radius (i.e. ) (Nelson et al., 2019a). To ensure robust measurements of galaxy properties, we have required the lower limit of galaxy stellar mass to be for our final sample. The final galaxy sample sizes for Illustris and TNG100-1 are 20742 and 10942, respectively.
Star formation in Illustris and TNG is regulated by a modified two-phase interstellar medium (ISM) model of Springel & Hernquist (2003), where stochastic star formation occurs in gas cells exceeding a given density threshold of . To obtain the H i gas mass in both Illustris and TNG, we use the post-processing framework presented in Diemer et al. (2018), where five different models have been applied for the atomic-to-molecular transition. The H i and H2 masses are measured within the whole subhalo containing the corresponding galaxy. We explore the effects of different atomic-to-molecular transition models in Appendix A. The results of different H i models are quite consistent with each other, as also confirmed in Diemer et al. (2019). While there are slightly larger differences for the H2 measurements, our conclusions are not affected by the model variations.
We only use the output of ‘K13’ model with the projected quantities (Krumholz, 2013) in Diemer et al. (2018). Krumholz (2013) took the varying interstellar radiation field and cold gas density within interstellar medium (ISM) into consideration, as they will affect the molecular fraction of the neutral hydrogen () and SFR. In this prescription, is determined from the UV background () and cold phase column density of ISM (), as follows
| (5) |
where
| (6) |
and
| (7) |
with being the optical depth of a cloud. Since the UV field is estimated from the input SFR, the post-processed cold gas mass in TNG will not be self-consistent at different redshift outputs. We will further discuss this at Section 4. We refer the readers to Diemer et al. (2018) for more details.
To investigate the small-scale structural differences between star-forming and quenched populations, we also use the TNG50-1 simulation (Nelson et al., 2019b; Pillepich et al., 2019), the highest mass resolution of the TNG suite, for calculating the central stellar surface density within 1 kpc (referred to as the parameter) in Section 3.5. Its box size is on a side and the mass resolution is about , 16.5 times higher than that of TNG100-1, allowing to resolve internal details of galaxies. We will further make use of , SFR, , H i and H2 masses (as well as their density profiles) from the public release of TNG50-1 in Section 3.5. These parameters are measured in the same way as in TNG100-1. The final sample size for TNG50-1 is 1618.
2.4 SIMBA simulation
The SIMBA simulations (Davé et al., 2019) are based on the MUFASA suite of cosmological hydrodynamic simulations (Davé et al., 2016), running with the GIZMO code (Hopkins, 2015). We adopt the simulation run of m100n1024, with a box size of on a side. The dark matter and the initial baryon mass resolutions are and , respectively. These mass resolutions are about 13 times poorer than TNG100-1. The galaxies in SIMBA is identified on the fly using a 6D friends-of-friends algorithm with a linking length times the mean particle separation. Each gas particle in a halo is assigned to the galaxy that has the largest value of , with being the total baryonic mass and the distance to galaxy center. The final sample includes 23759 galaxies with , which corresponds to about 55 star particles.
Different from Illustris and TNG, where the black hole accretion is parametrized in terms of Eddington limited Bondi-Hoyle-Lyttleton accretion (Di Matteo et al., 2005), SIMBA uses a two-mode black hole accretion model, i.e. torque-limited accretion for cold gas () and Bondi accretion for hot gas (). In the former mode, the gas inflow rate is driven by disk gravitational instabilities following Hopkins & Quataert (2011) (see also Anglés-Alcázar et al., 2013, 2015, 2017) and multiplied by an efficiency of 0.1 to match the local – relation, while in the latter mode, the standard Bondi accretion rate is suppressed by the same efficiency of as in .
The black hole feedback mechanism in SIMBA consists of a kinetic feedback and an X-ray energy feedback. The kinetic subgrid model in SIMBA is designed to mimic the observed two-mode AGN feedback, with the high-accretion and low-accretion modes divided by the Eddington ratio of . In the high-accretion mode, a -dependent outflow velocity is applied to gas surrounding the black hole, with a typical velocity less than , mimicking radiative AGN winds. In the low-accretion mode (jet mode) with and , the outflow velocity significantly increases with decreasing , with the full-speed jets () achieved at . When the full-speed jet is activated and the gas fraction is lower than 0.2, the X-ray feedback will be introduced by injecting additional energy into the surrounding gas. We refer the readers to Davé et al. (2019) for more details.
The star formation in SIMBA is directly modeled with the Kennicutt-Schmidt law by calculating the molecular gas fraction of the total gas, , following the subgrid model of Krumholz & Gnedin (2011), similarly as in Equations (5)–(7) (Davé et al., 2020). We emphasize that here is the molecular fraction for any given gas (including helium and metals), rather than just neutral hydrogen as in TNG. But the parameter of Equation (6) in SIMBA is a function of local metallicity in the gas cell, rather than estimated post-processingly from SFR as in Illustris and TNG. Moreover, the SFR for a given gas element in SIMBA is calculated as
| (8) |
where is the gas density and is the local dynamical time. The H i fraction of a given gas element is computed using the prescription of Rahmati et al. (2013), accounting for the self-shielding effect. Adding the H i and H2 fractions gives the total neutral gas fraction. In this way, the galaxy cold gas mass can be self-consistently computed on the fly during the simulation run of SIMBA (Davé et al., 2020).
2.5 Star Formation Main Sequence
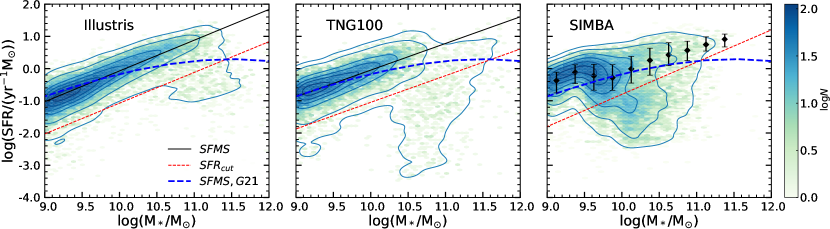
To compare with the observational H i mass measurements for SFGs and QGs, we similarly divide the galaxy samples in the simulations into two populations. For each simulation, we only select central galaxies with at , which are fully resolved for the different simulation resolutions. We show the distributions of galaxy samples in the SFR– plane in Figure 1 for Illustris (left panel), TNG (middle panel) and SIMBA (right panel), respectively. As is common practice, we define the star formation main sequence (SFMS) by fitting the number density peaks for galaxies with specific SFR (sSFR) larger than using a simple power law for Illustris and TNG. The best-fitting relations for the SFMS are shown as the solid black lines in the left and middle panels. Since the SFMS for SIMBA is apparently curved for , we only use the median values of SFR in each bin for galaxies with as the SFMS and use interpolation for the relevant calculations, rather than fitting it with a functional form. The best-fitting SFMS relations for Illustris and TNG are,
| (9) | |||||
| (10) |
Our fitting parameters for SFMS are consistent with previous studies (Weinberger et al., 2018; Donnari et al., 2019, 2021; Hahn et al., 2019). For example, Hahn et al. (2019) used for galaxies in Illustris and Donnari et al. (2019) adopted a similar definition of for TNG.
The observational definition of SFMS in G21 (shown as dashed blue lines) is to fit the average SFR for SFGs with a third-order polynomial as,
| (11) | |||||
where the slope of SFMS is gradually becoming flatter for more massive galaxies. Their cut to separate SFGs and QGs is
| (12) |
To be consistent with literature, for Illustris and TNG, the cuts between SFGs and QGs are simply 1 dex below the SFMS,
| (13) | |||||
| (14) |
For SIMBA, we follow the definition of Davé et al. (2019) as
| (15) |
The conclusions of our study are not significantly affected by the definitions of the cuts, as they are all around 3 below the SFMS in each simulation. We note that all galaxies below these cuts are regarded as QGs, including those without SFR measurements (i.e., SFR) due to the simulation resolution limits.
The distributions of central galaxies in the SFR- plane for the three simulations are quite different from each other. But QGs are well separated from SFGs with the cuts applied. We expect that the low-mass QGs of are more likely the low-SFR tail of SFGs. We will focus on the massive galaxies of in this study.
3 Results
3.1 H I–Stellar Mass Relation
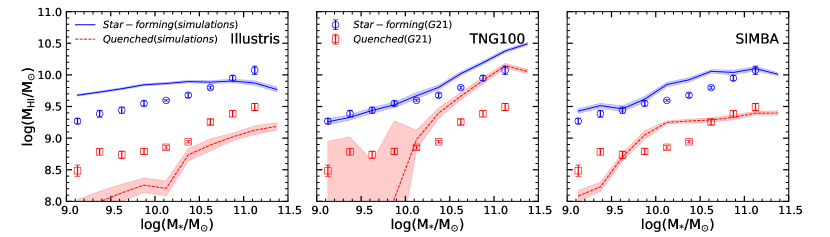
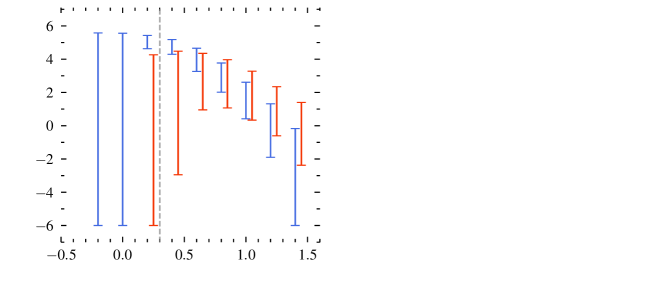
In Figure 2, we show comparisons of H i-stellar mass relations between observational measurements of G21 (circles and squares) and simulation predictions for SFGs (blue solid lines) and QGs (red dotted lines). From left to right, we present simulation results of Illustris, TNG, and SIMBA, respectively. The H i spectra stacking in G21 works by adding the H i fluxes of all stacked galaxies. Even for those galaxies with H i fluxes below the individual detection limit of the telescope, their contribution to the total signal is still counted in the stacking. This is especially important for QGs with typically low H i fluxes (Saintonge et al., 2016). For fair comparisons with G21, we calculate by , where is the H i mass for the -th galaxy in a given stellar mass bin, including those with (i.e. their H i mass is below the simulation resolution). is the total number of galaxies in this bin.
It is consistently shown in all simulations that QGs have much less H i gas content than SFGs, i.e. the quenched state of galaxies is associated with the loss of H i reservoir, confirming the finding of G21.
For Illustris simulation, there is almost no dependence of on for SFGs, with significantly higher H i mass for compared to G21. However, the H i mass of QGs are on average 0.4 dex lower than observed values, which is consistent with the findings of Genel et al. (2014).
The physical origin of discrepancies in Illustris is that quasar-mode feedback in low-mass galaxies is less effective while radio-mode is too strong for massive ones. In TNG, the coupling efficiency in the high-accretion state has been increased to 0.1 (Weinberger et al., 2017), compared with 0.05 in Illustris. This reduces the H i mass for SFGs with low stellar masses, i.e. , producing better agreement with observation. But the H i mass of QGs in this range is further decreased, leading to larger discrepancies. For massive galaxies of , energy released from the kinetic feedback, which is in the form of momentum injection, significantly increases in TNG (Weinberger et al., 2018). This effectively reduces the gas density surrounding the central black hole, but the remaining total H i gas still seems to be overabundant compared to G21. It is surprising that the differences between SFGs and QGs are decreasing for massive galaxies, with QGs possessing far too much H i, but not triggering star formation.
SIMBA generally agrees with observations well for both SFGs and QGs, with the difference in remaining roughly constant at around 0.6 dex as in G21. There is a trend in SIMBA that the dependence of on becomes much weaker for , which is especially clear for QGs with the abrupt change of slope occurring at around . It is mainly caused by the mode changes in the AGN feedback models of SIMBA, as this mass scale corresponds to a black hole mass around where the jet mode feedback is starting to take effect and the black hole growth is becoming slower (Habouzit et al., 2021).
Due to the large discrepancy between Illustris and observation, we will only analyze the TNG and SIMBA simulations in the following and focus on galaxies with .
3.2 Star Formation and the Cold Gas Reservoir
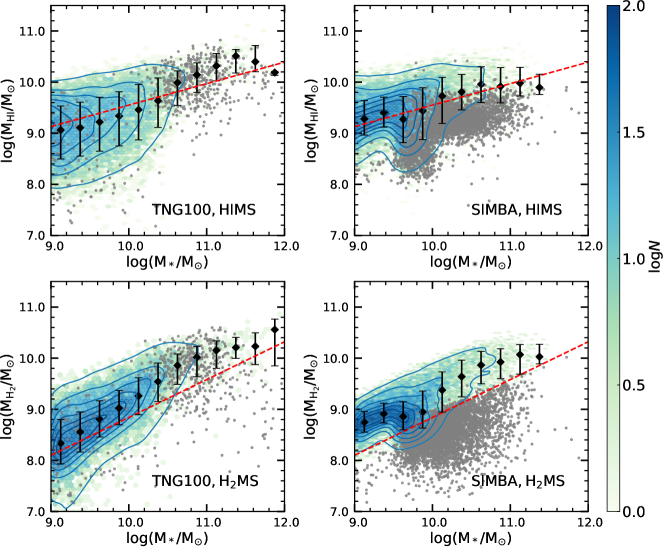
Following G21, we similarly define the H i main sequence (HIMS) as the median values of in each bin for SFGs, shown as the black points in the top panels of Figure 3. The distribution of QGs is represented by the gray dots in each panel. QGs in TNG have comparable amounts of H i gas to SFGs, as seen in Figure 2. But there is an apparent offset between the H i masses of SFGs and QGs in SIMBA, which is also consistent with right panel in Figure 2. We also define the H2 main sequence (H2MS) in the same way as the HIMS in the bottom panels of Figure 3, where the distributions of SFGs and QGs are similar to the top panels. For comparison, we also show the observational HIMS from G21, as well as the H2MS from Janowiecki et al. (2020) as red dotted lines in Figure 3, which are defined as,
| (16) | |||||
| (17) |
Because the HIMS and H2MS in simulations cannot be simply described by power-law relations, we will use interpolation in the following calculations. The HIMS relations in both TNG and SIMBA agree with that of G21 reasonably well. But is over-predicted in TNG for massive galaxies with , as in Figure 2. The discrepancies are relatively smaller here as the black dots shown are the median values rather than in Figure 2.
However, both TNG and SIMBA over-predict the H2MS by around 0.5 dex, as also seen in Davé et al. (2020). In this sense, it is more meaningful and practical to compare the distances from corresponding main sequence values for SFR, and , as follows,
| (18) | |||||
| (19) | |||||
| (20) |
The advantage of using these scaled measurements is the removal of stellar mass dependence. The traditional measurements of sSFR and the gas fraction are decreasing with stellar mass, even when galaxies are still on the SFMS (Saintonge et al., 2016; Catinella et al., 2018). Therefore, the trends of decreasing sSFR and gas fractions with other physical parameters would potentially be complicated by the stellar mass dependence.
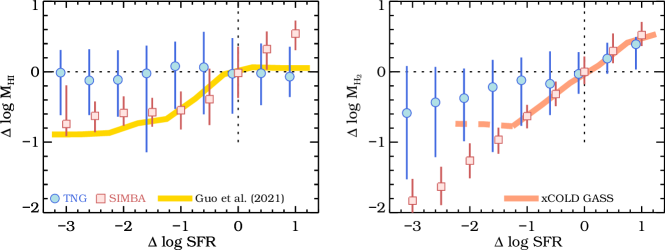
In the left panel of Figure 4, we quantitatively compare the relations between and . The predictions from TNG and SIMBA are compared with the observational measurements of G21. For fair comparisons, we only include galaxies with in both observations and simulations. As expected, when the SFR decreases, galaxies in SIMBA behave similarly to the observational measurements, with smoothly reduced by dex during quenching. But it seems to over-predict for galaxies above the SFMS, which are dominated by low-mass galaxies of . However, the H i mass distribution in TNG has a much larger scatter and the median only marginally decreases by less than 0.2 dex, even though the SFR decreases by more than 2 dex from the SFMS.
The trend is very similar if we instead compare the relation between SFR and H2 for the two simulations, shown in the right panel of Figure 4. Obtaining H2 measurements for a large number of galaxies (as for the HI measurements from G21) is very challenging in technique, especially for QGs. Because of the low line transition probability of H2, the CO emission lines are commonly considered as the tracers of H2. But the lower abundance of CO in galaxies makes it also harder to detect, compared to the abundant H i. We show the H2 measurements from the xCOLD GASS sample (Saintonge et al., 2017) of 532 galaxies (199 are non-detections) for comparison, and adopt the SFMS and H2MS definitions for xCOLD GASS galaxies from Janowiecki et al. (2020). We note that the H2 measurements for are mostly upper limits due to the non-detections (shown as the peach dashed line in the right panel). Therefore, QGs have decreased by at least 0.7 dex from the main sequence values, which is consistent with the H i observations of G21.
The agreement between SIMBA and xCOLD GASS is remarkably good for the available measurements of . TNG shows a similar agreement for SFGs of . For lower SFRs, the median values in TNG are slightly higher than the xCOLD GASS measurements, but they are still consistent within the estimated errors. We will further discuss the effect of different aperture sizes when comparing the measurements from simulations with those from observations in Section 3.5.
3.3 Cold Gas Density Profile
In addition to the total cold gas content for SFGs and QGs, it is useful to compare the spatial distribution of H i in the two populations. In Figure 5, we show the 3D density profiles of H i for galaxies with in TNG (left) and SIMBA (right). The median 3D H i mass densities for SFGs and QGs are represented by blue circles and red squares, respectively. We show the median values along with the – percentile ranges. There are 4716 (10729) SFGs and 1638 (5593) QGs with in TNG (SIMBA). is obtained from the median H i densities of all SFGs (or QGs) in equally spaced bins, where the distance to galaxy center is scaled by the corresponding stellar half mass radius .
We note that there are still many galaxies with below the simulation resolutions (i.e. ) in each bin (especially for QGs), and we have manually set the lower limit as to properly show these galaxies in the figure. The percentile range is selected to avoid including too many galaxies at the lower limit. For the QGs in TNG, the fraction of galaxies with in the two innermost bins are 75.82% and 56.96%, respectively. Thus, we do not show the median values for these two bins in the left panel of Figure 5.
There are stark differences in the H i density distributions of SFGs and QGs in TNG and SIMBA. QGs in TNG have significantly lower within , but there is much more H i gas in the outer regions compared to their star-forming counterparts. However, QGs in SIMBA have consistently lower H i mass than the corresponding SFGs. In the inner region of , QGs seem to have close H i distributions to SFGs. This is very different from the trend in TNG, where QGs have significantly lower H i densities in the inner, but much higher in the outer.
We also check the profile of H2 density in TNG and find a very similar trend as in the case of H i, shown as blue solid and red dashed lines for SFGs and QGs, respectively. But most of the median values of in each bin in SIMBA is below the simulation resolution, which might be caused by the discrete distributions of H2 clumps in SIMBA as they are calculated on-the-fly at each time-step (Davé et al., 2020), rather than the post-processing treatment in TNG. Therefore, we do not show the for SIMBA. But if we calculate the average in each bin, the trends in both simulations will be quite similar as in the case of .
3.4 Black Hole Growth and AGN feedback
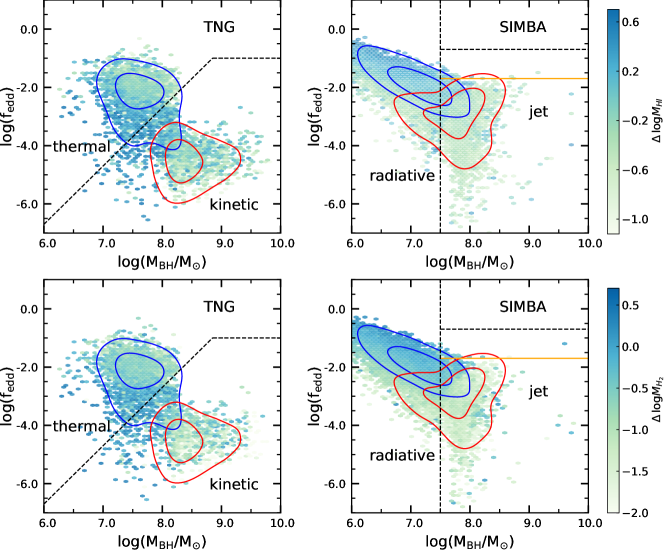
While in both TNG and SIMBA, AGN feedback is set as the primary mechanism to quench massive galaxies, it has been suggested that the cumulative energy release from AGN, rather than the instantaneous feedback, determines whether or not a galaxies would be quenched (Terrazas et al., 2020; Zinger et al., 2020; Piotrowska et al., 2022). It is thus important to check the effects of both cumulative and instantaneous AGN feedback on the cold gas content. Figure 6 shows the distributions of galaxies in the – plane for TNG (left) and SIMBA (right). The galaxy distributions are color coded by (top panels) and (bottom panels). The distributions of central SFGs and QGs are represented by blue and red contours, respectively. The demarcation lines for different AGN feedback modes (detailed in Sections 2.3 and 2.4) in both simulations are shown as dotted lines.
QGs in TNG can be well-separated from SFGs with a black hole mass threshold of . However, SFGs and QGs in SIMBA are more overlapped in the – plane. But the cut of can still reasonably separate the two populations, as well as the two AGN feedback modes. They can also be distinguished with the Eddington ratio cut of (Thomas et al., 2019). The orange solid line in the right panel shows the position of , where the maximal ejection velocity is achieved in SIMBA. It is clear that QGs in SIMBA mostly have . The values of and are also gradually decreasing from SFGs to QGs, consistent with the results of Figure 4.
Unlike SIMBA, gas-rich galaxies in TNG tend to distribute more in the transition area between the thermal and kinetic modes. It is likely caused by the fact that both strong thermal and kinetic feedback will significantly reduce the cold gas reservoir. But the distribution of gas-rich galaxies is still wide-spread in TNG, resulting in the weak dependence on SFR in Figure 4.
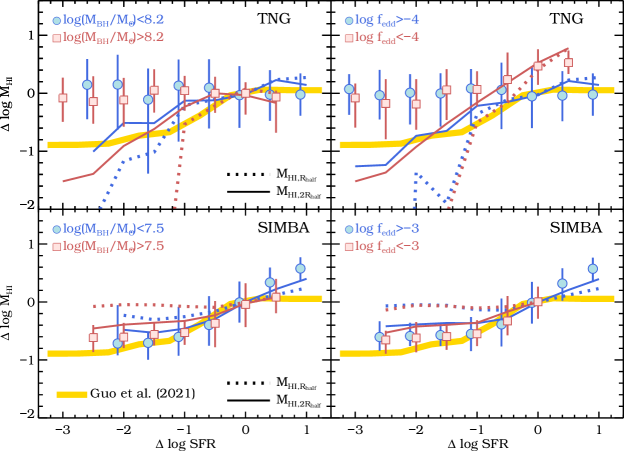
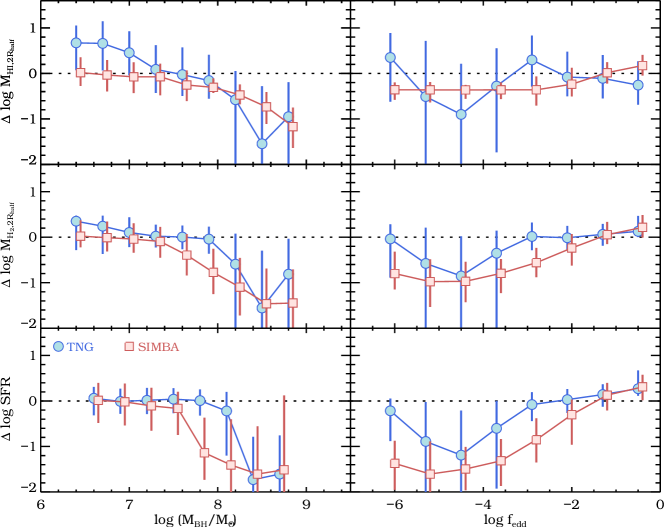
In Figure 7, we show a similar relation between and as in Figure 4 for TNG (upper panels) and SIMBA (bottom panels). The galaxy samples are further separated into two (left) and (right) bins, shown as different colors. The filled circles and squares are for the total H i mass as in Figure 4, while the solid and dotted lines represent the corresponding H i mass measurements within and , denoted as and , respectively.
The measurements of , and represent the H i gas within the galactic center, the whole galaxy and the whole subhalo (or circumgalactic medium), respectively. The three are measured as the distances to their own HIMS. It demonstrates that the depletion of H i gas with larger in TNG is increasingly stronger when approaching the galaxy center. The overall trend of agrees much better with the observation. Because does not reduce strongly with the decreasing SFR, it means that the kinetic AGN feedback in TNG mainly works as redistributing the inner gas to the outer that prevents the star formation in the galactic center.
The effect of is very weak for . But for SFGs (i.e. ), galaxies with high will have somewhat less H i gas, by a maximal amount of dex, which is related to the thermal energy release in the high-accretion model AGN feedback (Weinberger et al., 2017). It is also clear that the influence of does not change with the distance to galactic center.
The measurements of within different radii are all consistent with each other for SFGs in cases of different and . We further check that the density profiles of SFGs with different and have similar shapes. It means that the feedback from high- AGNs affects the inner and outer regions equivalently. The thermal energy released in the inner region might be quickly balanced by the H i inflow from outer, causing the overall reduction of .
In SIMBA, the trend of with the distance to galactic center is contrary to that of TNG. The H i gas in inner region is less changed with SFR, which is also seen in the H i density profiles of Figure 5. For a given distance to galactic center, there is a trend that galaxies with more massive show slightly weaker dependence of on SFR. It is likely related to the smaller mass loading factor of outflows in the jet-mode kinetic feedback (Davé et al., 2019). Similar to TNG, the effect of is also very weak for QGs in SIMBA. Even for the SFGs, there is no strong differences between high and low , because the high-accretion mode feedback is also expressed as kinetic energy release.
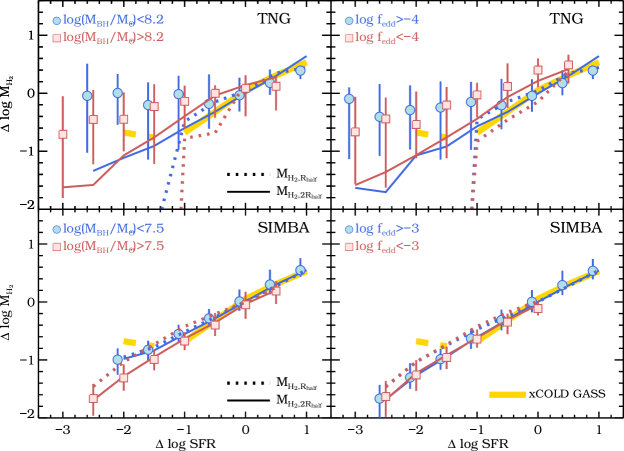
The behavior of H2 gas is very similar to H i in TNG, as shown in the top panels of Figure 8. The dependence of on is slightly stronger. It is related to the fact that H2 gas distribution is more concentrated than H i (as it is formed at higher-density regions) and thus more affected by AGN feedback. However, in SIMBA, there is no any strong dependence of the – relation on , , or the aperture size of calculating , since the SFR in SIMBA is directly measured from H2 gas as SFR. In this sense, the H i gas is less correlated with SFR, as they should be converted to H2 before forming stars, mimicking the observations (Bigiel et al., 2008; Leroy et al., 2008). While the H i/H2 modeling methods in TNG is different. The star formation in TNG is based on the total neutral hydrogen gas density () and is derived from post-processing.
As the gas masses within are more reasonable quantities to reflect the effect of AGN feedback, we will focus on the corresponding values in the following. In Figure 9, we show the dependence of (top panels), (middle panels) and (bottom panels) on (left columns) and (right columns), for both TNG and SIMBA. The SFR starts to drop below the main sequence when increases above the input threshold values for jet or kinetic mode AGN feedback. The transition from radiative to jet modes is accompanied with the smaller , along with the decreasing of and . For QGs with , there is only weak dependence of and on , while they both continue to decrease with increasing . We also note that both and in TNG decrease with even before the kinetic-mode feedback kicks in, when galaxies are still on the SFMS. It supports the idea that cumulative, rather than instantaneous, AGN feedback drives the quenching.
The complex correlation among , and SFR makes it not straightforward to use correlation coefficients for investigating the dominant driver of gas depletion and quenching. Piotrowska et al. (2022) applied the random forest analysis in SDSS galaxies and several hydrodynamical simulations (including Illustris and TNG). They concluded that black hole mass is the most predictive parameter for the change of SFR. The dependence of SFR on becomes much weaker when accounting for its correlation with . It complements our analysis here that the cold gas depletion is also driven by the black hole growth. The three parameters of (or ), SFR, and would evolve altogether to form the results shown in Figures 7 and 8 (Cui et al., 2021).
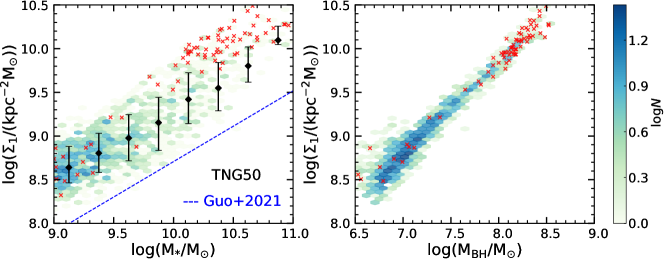
3.5 Connection to the Central Stellar Surface Density
It has been found in G21 that the H i reservoir will decrease with the central stellar surface density within 1kpc (denoted as ), as when galaxies start to quench. It is explained as a signature of quenching driven by the compaction events (Dekel & Burkert, 2014; Zolotov et al., 2015) in G21. In this scenario, violent disc instability caused by the intense cold gas inflow would result in the creation of dense cores, which then give rises to a phase of high SFRs (Dekel & Burkert, 2014). The rapid consumption of cold gas into stars, along with the gas outflow due to efficient stellar feedback, could cause the dramatic decrease of the cold gas reservoir. In the meantime, the gas inflow also promotes the growth of central black hole, which would lead to the cold gas depletion with energetic AGN feedback. The decrease of the cold gas surface density also help stabilize the disk that potentially prevents the gas from forming stars. When the host halos of galaxies grow beyond a typical mass of , the virial shock heating will further take effect to shut down the cold gas supply, causing the starvation (see more discussions in G21). Chen et al. (2020) proposed a phenomenological model that the black hole growth in star-forming galaxies scales with , as . It predicts that majority of the black hole mass assembly happen when galaxies are in the compact star-forming phase, which would then drive the quenching. It is not yet clear which mechanism plays the dominant role in the galaxy quenching, but agreement has been reached that compactness is a necessary, though not sufficient, condition for the quenching to happen (Cheung et al., 2012; Fang et al., 2013; Zolotov et al., 2015; Barro et al., 2017).
We employ the TNG50-1 (hereafter TNG50) simulation to investigate the correlation between and H i gas, since its gravitational softening length is only 288 pc, compared to 738 pc in TNG100-1 (Pillepich et al., 2019). We directly calculate in TNG50 by rotating the axes of galaxies to the face-on direction according to the moment of stellar inertia tensor within and summing up all stellar particles within the projected distance of 1 kpc. We show the dependence of on (left) and (right) in Figure 10. The black symbols with errors indicate the median for SFGs, which is defined as the main sequence, . The blue dashed line represents the best-fitting observational measurements of in G21 (). The measurements in TNG50 are consistent with the observation that is generally increasing with , and those massive QGs (represented by crosses) typically have higher than their star-forming counterparts.
Although in TNG50 is systematically higher than the observation of G21 by about 0.6 dex (as also seen similarly in Varma et al. 2022), they have a very similar slope of 0.81. It makes the simulation and observation more comparable when we define the relative difference to as
| (21) |
similar to the definition of above.
Compared to the scattered – distribution, the relation between and is much tighter, with . The average scatter in is only 0.08 dex for , which means that is an excellent indicator of for massive galaxies in TNG50, supporting the model of Chen et al. (2020). However, the slope predicted by the theoretical model of Chen et al. (2020) is around , and the scatter there is also much larger. It indicates that the black hole mass growth with the stellar density is much slower in TNG50.
In the – relation, the scatter is largely caused by the additional dependence of on SFR, with QGs having higher (see e.g., Fang et al., 2013; Barro et al., 2017). Therefore, the tight correlation between and implies that the dependence of on SFR stems from the black hole growth.
Similar to Figure 9, we show in Figure 11 the dependences of , and on . The measurements in TNG50 (filled circles) are compared with the observations of xGASS (Catinella et al., 2018) for , xCOLD GASS (Saintonge et al., 2017) for and G21 for SFR. We obtain the measurements for galaxies in xGASS and xCOLD GASS by matching with the galaxy sample of G21. We use the H i measurements of xGASS instead of G21, as the H i stacking in G21 is not made explicitly for the bins. We also note that the observational measurements of xGASS and xCOLD GASS are for the total and .
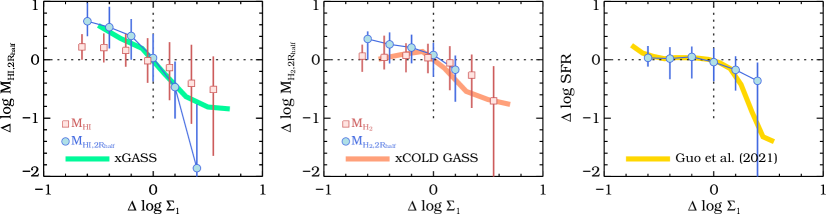
The H i line fluxes in xGASS were observed using the Arecibo telescope with a beam size of 3.5′(Catinella et al., 2010, 2018), while the H2 measurements in xCOLD GASS were inferred from the CO(1-0) line luminosity using the IRAM 30m telescope with a beam size of 22″(Saintonge et al., 2017). The H2 gas is primarily located in the ISM, but the distribution of H i gas can be more extended in the galactic halo. Integrated measurements of and are thus evaluated at different aperture sizes, which might not correspond to relevant scales in the simulations. Given that both the total H i and H2 mass functions, as well as their density profiles, in simulations are in reasonable agreement with observations (Diemer et al., 2019; Davé et al., 2020), fair comparisons should be made between observations and the overall measurements of H i and H2. However, as shown in the previous figures, the trends using the measurements within agree much better with observations, which would then better reflect the inherent physics. Similar comparisons based on the H i estimates within optical disks have been presented in Wang et al. (2020).
These measurements in TNG50 are in good agreement with observations, except that the decreasing trend of SFR with is much shallower in TNG50, which is likely caused by resolution effects and the less sampling of massive galaxies (Donnari et al., 2021). These dependences on are very similar to those on presented in Fig. 9, which further suggests that the observed decreasing of , and SFR with increasing is a reflection of the black hole growth. However, if we instead use and in TNG50 (shown as the squares), the dependences on would become much weaker, similar to the results shown in Figs. 7 and 8.
We also compare galaxy distributions in the – plane and find very weak correlation between the two, which is as a result of the tight correlation between and , as well as the weak correlation between and , as expected from Figure 6. Combining all the results above, it suggests that the cumulative energy release from the black hole growth is the dominant reason driving the cold gas depletion and galaxy quenching. The observations of cold gas content can then be used to constrain the AGN feedback mechanisms.
4 Discussion
4.1 Post-processing versus On-the-fly Methods
As the decomposition of total neutral hydrogen into H i and H2 is very different in TNG and SIMBA, caution should be taken when interpreting the cause of quenching. More specifically, is post-processed in TNG from multiplying the neutral hydrogen mass in each gas cell by the molecular fraction in Equation (5) using the input SFR, which is also determined from the neutral hydrogen density (). In this sense, neither H i nor H2 is directly responsible for the change of SFR. The density distributions of H i and H2 in TNG are quite similar, as shown in Figure 5. All other measurements of H i and H2 for TNG galaxies in Figures 7–9 have similar trends as well.
However, the H i and H2 masses are independently modeled in SIMBA and calculated on the fly with the simulation run. The decrease of SFR is simply caused by the reduction of molecular gas content (Equation 8), as manifested in the bottom panels of Figure 8 for the H2 masses measured in different aperture sizes. It is then possible that the star formation could be quenched while there is still relatively abundant H i gas, by reducing the conversion efficiency from H i to H2. It is the case in inner regions (within ) of QGs in SIMBA, where QGs with very low SFRs can have similar as the SFGs, as seen in Figures 5, 7 and 8.
To conclude, for a given gas cell in TNG, its low SFR is caused by the low , which indicates both low H i and H2 masses. However, in SIMBA, it only infers a low H2 mass of the gas cell, which not necessarily has a low H i mass. Such differences in the modeling methods of H i and H2 gas can sometimes cause misinterpretation of the results and should be treated with care.
4.2 AGN Feedback Mechanisms
Despite the different models of black hole growth and feedback in TNG and SIMBA, the shapes of their H i gas density profiles for SFGs are quite similar, as seen in Figure 5. The apparent differences in the density profiles of QGs are mainly caused by the kinetic feedback mechanisms.
In the kinetic mode of TNG, the feedback energy is injected as a momentum boost to the gas cells within kpc at (Zinger et al., 2020). However, as shown in Weinberger et al. (2017), each energy injection event has a random direction. The injection events occur when the accumulated kinetic feedback energy exceeds a given threshold, thus the gas within feedback region can be accelerated to several tens of thousands of . But a coherent gas outflow cannot be built up with the frequent change of energy injection direction. As a result, the kinetic energy is quickly dissipated into thermal energy and heats up the inner gas through shocks within Myr (Weinberger et al., 2017). The H i density is then significantly lower approaching the centers of quenched galaxies as in Figure 5. The trend with H2 is also quite similar.
Unlike TNG, SIMBA adopts bipolar injection of the kinetic feedback, i.e. the gas elements surrounding the black holes are ejected parallel to the angular momentum of the inner disks ( nearest gas elements). Although the full jet speed can reach , the collimated wind outflow only affect a small region of kpc (Davé et al., 2019), which then reduces a small fraction of cold gas in the galactic centre. Since the injection direction is typically stable over the galaxy dynamical timescale of tens to hundreds of Myrs, the consistent jet energy input will sphericalize at large scales via the hydrodynamical interactions with the CGM gas and keep the halo gas hot. It thus explains the different behaviors of the H i density profiles in SIMBA, with respect to TNG. The QGs in SIMBA still have similar H i densities as the SFGs in the inner regions, while their H i densities are significantly reduced at the outer. As shown in Appleby et al. (2020), if we set a cold gas density threshold for efficient star formation, SFGs in SIMBA would apparently have more spatially-extended star formation than QGs.
When we consider the role that AGN feedback plays in the relation between SFR and H i gas, the weak dependence of the SFR– relation on and in Figures 7 and 8 does not necessarily mean that AGN feedback is not driving galaxy quenching in TNG and SIMBA. It just reflects that the global star formation law, i.e. the dependence of SFR on H i reservoir, is not significantly affected by AGN feedback. The quenching from AGN feedback is working by depleting the H i, which thereby reduces the star formation. The effect of AGN feedback will then not show up in the SFR- relation, as long as the instantaneous energy release is not very high and the AGN activity time-scale is much smaller than that of star formation (Guo et al., 2022). It explains the lack of strong evidence in the H i and H2 masses of AGN and non-AGN hosts in observations (Fabello et al., 2011; Geréb et al., 2015; Ellison et al., 2019; Saintonge et al., 2017; Shangguan et al., 2020).
In both simulations, SFGs are dominated by the thermal or radiative AGN modes, while QGs are mostly in the kinetic or jet modes. The kinetic mode is operating with high and low , i.e. low . Thus, the Eddington ratio is an indicator for the instantaneous AGN luminosity at a given , since is proportional to . The black hole mass represents the cumulative energy release into the surrounding gas, as it is the time integral of . Our results confirm that the cumulative energy released from AGN activities rather than the instantaneous feedback would reduce the cold gas reservoir and quench the galaxies. It is consistent with the previous finding that quenched massive galaxies are associated with higher integrated energy output from the black holes, while the star-forming and gas-rich galaxies more likely host high- AGNs (Ward et al., 2022).
5 Conclusions
In this paper, we investigate the cold gas content of star-forming and quenched central galaxies at in three hydrodynamical simulations, Illustris, TNG and SIMBA. By comparing simulations with the observed stacked H i masses of G21 and H2 masses from xCOLD GASS, we find that the observed cold gas properties can be used to effectively constrain the AGN feedback models in simulations, with SIMBA showing the best agreement with observations. We conclude that the cumulative AGN feedback (as traced by black hole mass) is the main force driving the cold gas depletion and thus causes galaxy quenching, but the detailed quenching mechanisms vary for different simulations. Our results are summarized as follows.
(i) Illustris generally does not agree with the observational – relation. It predicts a weak dependence of on for SFGs and significantly under-predicts for QGs, which is caused by its less effective quasar-mode AGN feedback and too efficient radio-mode feedback.
(ii) TNG improves upon Illustris by increasing the coupling efficiency in the quasar mode and replacing the radio mode with the kinetic feedback, thus showing better agreement with the H i observations. However, it still over-predicts for both the massive star-forming and quenched galaxies. This is clearly shown in the SFR– relation (Fig. 4), where the total only marginally decreases by less than 0.2 dex as the SFR decreases. But as seen from the H i density distributions (Fig. 5), the overall effect of kinetic feedback in TNG is to redistribute the cold gas from the inner regions to the outer.
(iii) SIMBA agrees best with the H i and H2 observations, by using a two-mode black hole accretion model and a combined kinetic and X-ray feedback mechanism. Unlike the case in TNG, the H i density distribution smoothly increases toward the galaxy centers for both SFGs and QGs, with QGs having significantly reduced cold gas masses in the CGM.
(iv) When we only consider the cold gas masses within the stellar radii (i.e. and ), both TNG and SIMBA have very similar decreasing trends of cold gas masses with reduced SFRs (Figs. 7 and 8), also in good agreement with observations. More importantly, the global star formation law of – (or ) is not significantly affected by AGN feedback. By comparing the effects of and , we find that the galaxy quenching is generally achieved by the gradual depletion of cold gas (in the centers for TNG and CGM for SIMBA) due to the cumulative energy release from the AGN activities. But there is an apparent feature of instantaneous cold gas depletion for SFGs in the high-accretion state (i.e. high ) in the TNG model, likely caused by the efficient quasar-mode feedback.
(v) We measure in the high-resolution TNG50-1 simulation, and find a very tight correlation between and , with an average scatter of 0.08 dex for . We also find that the relations of – and – from TNG50 are in very good agreement with those from observations. It suggests that the observed decreasing trend of the cold gas masses with increasing (G21) is very likely driven by the growth of central black holes.
In conclusion, the masses of cold gas, as well as its distribution in galaxies, provide strong constraints on AGN feedback models in the current hydrodynamical simulations. In the three simulation models investigated in this paper, galaxy quenching is caused by the combined effects of cumulative AGN feedback from the central black hole growth and the subgrid models of star formation.
The kinetic feedback mechanism in TNG is too weak to repel enough cold gas far away from the central galaxies, causing large discrepancies with the cold gas observations. But the feedback models in SIMBA are not necessarily correct, as seen from some discrepancies with other observations (Davé et al., 2020). Future H i and H2 surveys, e.g. WALLABY (Koribalski et al., 2020), Apertif (Verheijen et al., 2008) and CRAFTS (Li et al., 2018), at higher redshifts and over larger volumes will provide an excellent data set to examine these AGN feedback models.
Appendix A H I transition models in TNG
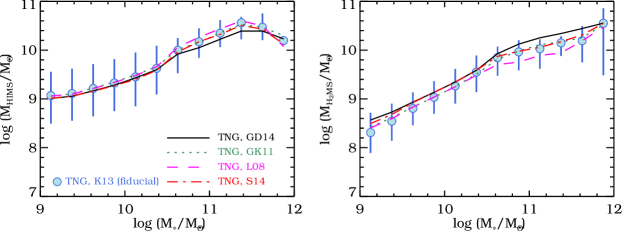
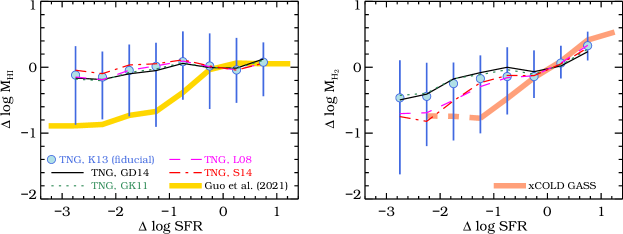
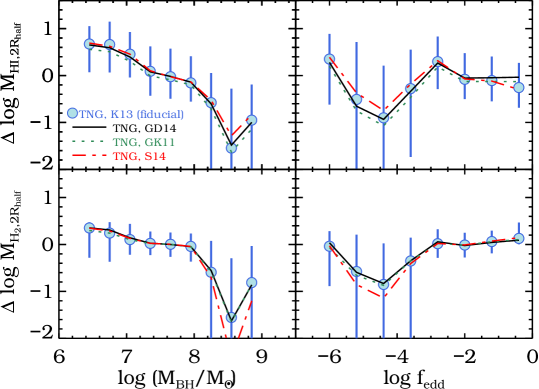
TNG and Illustris adopt five different H i to transition models, i.e. Leroy et al. (2008, L08), Gnedin & Kravtsov (2011, GK11), Krumholz (2013, K13), Gnedin & Draine (2014, GD14) and Sternberg et al. (2014, S14). To investigate the effects of different models on our results, we show the comparisons on definitions of HIMS and H2MS (Figure 12), relation between and (Figure 13) and dependences of H i and H2 gas within on and (Figure 14). The L08 model is not shown in Figure 14 due to the lack of H i and H2 density profiles in the public release of TNG.
As we see, there is no strong effect of different transition models on our results, especially for the H i gas. The influence of different models is slightly stronger for H2 shown in Figure 13, with L08 and S14 models predicting slightly lower for QGs. Thus, our conclusion of the quenching mechanisms in TNG is not affected by the different transition models. It is consistent with our previous discussion that neither H i or H2 is directly related to the change of SFR in TNG, but rather the total neutral hydrogen density.
References
- Abazajian et al. (2009) Abazajian, K. N., Adelman-McCarthy, J. K., Agüeros, M. A., et al. 2009, ApJS, 182, 543, doi: 10.1088/0067-0049/182/2/543
- Anglés-Alcázar et al. (2017) Anglés-Alcázar, D., Davé, R., Faucher-Giguère, C.-A., Özel, F., & Hopkins, P. F. 2017, MNRAS, 464, 2840, doi: 10.1093/mnras/stw2565
- Anglés-Alcázar et al. (2013) Anglés-Alcázar, D., Özel, F., & Davé, R. 2013, ApJ, 770, 5, doi: 10.1088/0004-637X/770/1/5
- Anglés-Alcázar et al. (2015) Anglés-Alcázar, D., Özel, F., Davé, R., et al. 2015, ApJ, 800, 127, doi: 10.1088/0004-637X/800/2/127
- Appleby et al. (2020) Appleby, S., Davé, R., Kraljic, K., Anglés-Alcázar, D., & Narayanan, D. 2020, MNRAS, 494, 6053, doi: 10.1093/mnras/staa1169
- Barro et al. (2017) Barro, G., Faber, S. M., Koo, D. C., et al. 2017, ApJ, 840, 47, doi: 10.3847/1538-4357/aa6b05
- Beckmann et al. (2017) Beckmann, R. S., Devriendt, J., Slyz, A., et al. 2017, MNRAS, 472, 949, doi: 10.1093/mnras/stx1831
- Bigiel et al. (2008) Bigiel, F., Leroy, A., Walter, F., et al. 2008, AJ, 136, 2846, doi: 10.1088/0004-6256/136/6/2846
- Birnboim & Dekel (2003) Birnboim, Y., & Dekel, A. 2003, MNRAS, 345, 349, doi: 10.1046/j.1365-8711.2003.06955.x
- Bower et al. (2006) Bower, R. G., Benson, A. J., Malbon, R., et al. 2006, MNRAS, 370, 645, doi: 10.1111/j.1365-2966.2006.10519.x
- Brown et al. (2017) Brown, T., Catinella, B., Cortese, L., et al. 2017, MNRAS, 466, 1275, doi: 10.1093/mnras/stw2991
- Catinella et al. (2010) Catinella, B., Schiminovich, D., Kauffmann, G., et al. 2010, MNRAS, 403, 683, doi: 10.1111/j.1365-2966.2009.16180.x
- Catinella et al. (2018) Catinella, B., Saintonge, A., Janowiecki, S., et al. 2018, MNRAS, 476, 875, doi: 10.1093/mnras/sty089
- Chauhan et al. (2021) Chauhan, G., Lagos, C. d. P., Stevens, A. R. H., et al. 2021, MNRAS, 506, 4893, doi: 10.1093/mnras/stab1925
- Chen et al. (2020) Chen, Z., Faber, S. M., Koo, D. C., et al. 2020, ApJ, 897, 102, doi: 10.3847/1538-4357/ab9633
- Cheung et al. (2012) Cheung, E., Faber, S. M., Koo, D. C., et al. 2012, ApJ, 760, 131, doi: 10.1088/0004-637X/760/2/131
- Cortese et al. (2021) Cortese, L., Catinella, B., & Smith, R. 2021, PASA, 38, e035, doi: 10.1017/pasa.2021.18
- Crain et al. (2015) Crain, R. A., Schaye, J., Bower, R. G., et al. 2015, MNRAS, 450, 1937, doi: 10.1093/mnras/stv725
- Croton et al. (2006) Croton, D. J., Springel, V., White, S. D. M., et al. 2006, MNRAS, 365, 11, doi: 10.1111/j.1365-2966.2005.09675.x
- Cui et al. (2021) Cui, W., Davé, R., Peacock, J. A., Anglés-Alcázar, D., & Yang, X. 2021, Nature Astronomy, 5, 1069, doi: 10.1038/s41550-021-01404-1
- Davé et al. (2019) Davé, R., Anglés-Alcázar, D., Narayanan, D., et al. 2019, MNRAS, 486, 2827, doi: 10.1093/mnras/stz937
- Davé et al. (2020) Davé, R., Crain, R. A., Stevens, A. R. H., et al. 2020, MNRAS, 497, 146, doi: 10.1093/mnras/staa1894
- Davé et al. (2016) Davé, R., Thompson, R., & Hopkins, P. F. 2016, MNRAS, 462, 3265, doi: 10.1093/mnras/stw1862
- Davies et al. (2020) Davies, J. J., Crain, R. A., Oppenheimer, B. D., & Schaye, J. 2020, MNRAS, 491, 4462, doi: 10.1093/mnras/stz3201
- Dekel & Birnboim (2006) Dekel, A., & Birnboim, Y. 2006, MNRAS, 368, 2, doi: 10.1111/j.1365-2966.2006.10145.x
- Dekel & Burkert (2014) Dekel, A., & Burkert, A. 2014, MNRAS, 438, 1870, doi: 10.1093/mnras/stt2331
- Di Matteo et al. (2005) Di Matteo, T., Springel, V., & Hernquist, L. 2005, Nature, 433, 604, doi: 10.1038/nature03335
- Diemer et al. (2018) Diemer, B., Stevens, A. R. H., Forbes, J. C., et al. 2018, ApJS, 238, 33, doi: 10.3847/1538-4365/aae387
- Diemer et al. (2019) Diemer, B., Stevens, A. R. H., Lagos, C. d. P., et al. 2019, MNRAS, 487, 1529, doi: 10.1093/mnras/stz1323
- Donnari et al. (2021) Donnari, M., Pillepich, A., Nelson, D., et al. 2021, MNRAS, 506, 4760, doi: 10.1093/mnras/stab1950
- Donnari et al. (2019) —. 2019, MNRAS, 485, 4817, doi: 10.1093/mnras/stz712
- Dubois et al. (2016) Dubois, Y., Peirani, S., Pichon, C., et al. 2016, MNRAS, 463, 3948, doi: 10.1093/mnras/stw2265
- Ellison et al. (2019) Ellison, S. L., Brown, T., Catinella, B., & Cortese, L. 2019, MNRAS, 482, 5694, doi: 10.1093/mnras/sty3139
- Ellison et al. (2021) Ellison, S. L., Wong, T., Sánchez, S. F., et al. 2021, MNRAS, 505, L46, doi: 10.1093/mnrasl/slab047
- Fabello et al. (2011) Fabello, S., Kauffmann, G., Catinella, B., et al. 2011, MNRAS, 416, 1739, doi: 10.1111/j.1365-2966.2011.18825.x
- Fang et al. (2013) Fang, J. J., Faber, S. M., Koo, D. C., & Dekel, A. 2013, ApJ, 776, 63, doi: 10.1088/0004-637X/776/1/63
- Fletcher et al. (2021) Fletcher, T. J., Saintonge, A., Soares, P. S., & Pontzen, A. 2021, MNRAS, 501, 411, doi: 10.1093/mnras/staa3025
- Fluetsch et al. (2019) Fluetsch, A., Maiolino, R., Carniani, S., et al. 2019, MNRAS, 483, 4586, doi: 10.1093/mnras/sty3449
- Genel et al. (2014) Genel, S., Vogelsberger, M., Springel, V., et al. 2014, MNRAS, 445, 175, doi: 10.1093/mnras/stu1654
- Geréb et al. (2015) Geréb, K., Morganti, R., Oosterloo, T. A., Hoppmann, L., & Staveley-Smith, L. 2015, A&A, 580, A43, doi: 10.1051/0004-6361/201424810
- Giovanelli et al. (2005) Giovanelli, R., Haynes, M. P., Kent, B. R., et al. 2005, AJ, 130, 2598, doi: 10.1086/497431
- Gnedin & Draine (2014) Gnedin, N. Y., & Draine, B. T. 2014, ApJ, 795, 37, doi: 10.1088/0004-637X/795/1/37
- Gnedin & Kravtsov (2011) Gnedin, N. Y., & Kravtsov, A. V. 2011, ApJ, 728, 88, doi: 10.1088/0004-637X/728/2/88
- Guo et al. (2020) Guo, H., Jones, M. G., Haynes, M. P., & Fu, J. 2020, ApJ, 894, 92, doi: 10.3847/1538-4357/ab886f
- Guo et al. (2022) Guo, H., Jones, M. G., & Wang, J. 2022, ApJ, 933, L12, doi: 10.3847/2041-8213/ac794f
- Guo et al. (2021) Guo, H., Jones, M. G., Wang, J., & Lin, L. 2021, ApJ, 918, 53, doi: 10.3847/1538-4357/ac062e
- Guo et al. (2017) Guo, H., Li, C., Zheng, Z., et al. 2017, ApJ, 846, 61, doi: 10.3847/1538-4357/aa85e7
- Habouzit et al. (2021) Habouzit, M., Li, Y., Somerville, R. S., et al. 2021, MNRAS, 503, 1940, doi: 10.1093/mnras/stab496
- Hahn et al. (2019) Hahn, C., Starkenburg, T. K., Choi, E., et al. 2019, ApJ, 872, 160, doi: 10.3847/1538-4357/aafedd
- Haynes et al. (2011) Haynes, M. P., Giovanelli, R., Martin, A. M., et al. 2011, AJ, 142, 170, doi: 10.1088/0004-6256/142/5/170
- Haynes et al. (2018) Haynes, M. P., Giovanelli, R., Kent, B. R., et al. 2018, ApJ, 861, 49, doi: 10.3847/1538-4357/aac956
- Heckman & Best (2014) Heckman, T. M., & Best, P. N. 2014, ARA&A, 52, 589, doi: 10.1146/annurev-astro-081913-035722
- Hopkins (2015) Hopkins, P. F. 2015, MNRAS, 450, 53, doi: 10.1093/mnras/stv195
- Hopkins & Quataert (2011) Hopkins, P. F., & Quataert, E. 2011, MNRAS, 415, 1027, doi: 10.1111/j.1365-2966.2011.18542.x
- Ishibashi & Fabian (2012) Ishibashi, W., & Fabian, A. C. 2012, MNRAS, 427, 2998, doi: 10.1111/j.1365-2966.2012.22074.x
- Janowiecki et al. (2020) Janowiecki, S., Catinella, B., Cortese, L., Saintonge, A., & Wang, J. 2020, MNRAS, 493, 1982, doi: 10.1093/mnras/staa178
- Jones et al. (2018) Jones, M. G., Haynes, M. P., Giovanelli, R., & Moorman, C. 2018, MNRAS, 477, 2, doi: 10.1093/mnras/sty521
- Kaviraj et al. (2017) Kaviraj, S., Laigle, C., Kimm, T., et al. 2017, MNRAS, 467, 4739, doi: 10.1093/mnras/stx126
- Kennicutt (1998) Kennicutt, Robert C., J. 1998, ApJ, 498, 541, doi: 10.1086/305588
- Kennicutt et al. (2007) Kennicutt, Robert C., J., Calzetti, D., Walter, F., et al. 2007, ApJ, 671, 333, doi: 10.1086/522300
- Keres et al. (2003) Keres, D., Yun, M. S., & Young, J. S. 2003, ApJ, 582, 659, doi: 10.1086/344820
- Koribalski et al. (2020) Koribalski, B. S., Staveley-Smith, L., Westmeier, T., et al. 2020, Ap&SS, 365, 118, doi: 10.1007/s10509-020-03831-4
- Koss et al. (2021) Koss, M. J., Strittmatter, B., Lamperti, I., et al. 2021, ApJS, 252, 29, doi: 10.3847/1538-4365/abcbfe
- Krumholz (2013) Krumholz, M. R. 2013, MNRAS, 436, 2747, doi: 10.1093/mnras/stt1780
- Krumholz & Gnedin (2011) Krumholz, M. R., & Gnedin, N. Y. 2011, ApJ, 729, 36, doi: 10.1088/0004-637X/729/1/36
- Leroy et al. (2008) Leroy, A. K., Walter, F., Brinks, E., et al. 2008, AJ, 136, 2782, doi: 10.1088/0004-6256/136/6/2782
- Li et al. (2018) Li, D., Wang, P., Qian, L., et al. 2018, IEEE Microwave Magazine, 19, 112, doi: 10.1109/MMM.2018.2802178
- Lim et al. (2017) Lim, S. H., Mo, H. J., Lu, Y., Wang, H., & Yang, X. 2017, MNRAS, 470, 2982, doi: 10.1093/mnras/stx1462
- Man & Belli (2018) Man, A., & Belli, S. 2018, Nature Astronomy, 2, 695, doi: 10.1038/s41550-018-0558-1
- Marinacci et al. (2018) Marinacci, F., Vogelsberger, M., Pakmor, R., et al. 2018, MNRAS, 480, 5113, doi: 10.1093/mnras/sty2206
- Martig et al. (2009) Martig, M., Bournaud, F., Teyssier, R., & Dekel, A. 2009, ApJ, 707, 250, doi: 10.1088/0004-637X/707/1/250
- Martin et al. (2010) Martin, A. M., Papastergis, E., Giovanelli, R., et al. 2010, ApJ, 723, 1359, doi: 10.1088/0004-637X/723/2/1359
- McCarthy et al. (2011) McCarthy, I. G., Schaye, J., Bower, R. G., et al. 2011, MNRAS, 412, 1965, doi: 10.1111/j.1365-2966.2010.18033.x
- Naiman et al. (2018) Naiman, J. P., Pillepich, A., Springel, V., et al. 2018, MNRAS, 477, 1206, doi: 10.1093/mnras/sty618
- Nelson et al. (2015) Nelson, D., Pillepich, A., Genel, S., et al. 2015, Astronomy and Computing, 13, 12, doi: 10.1016/j.ascom.2015.09.003
- Nelson et al. (2018) Nelson, D., Pillepich, A., Springel, V., et al. 2018, MNRAS, 475, 624, doi: 10.1093/mnras/stx3040
- Nelson et al. (2019a) Nelson, D., Springel, V., Pillepich, A., et al. 2019a, Computational Astrophysics and Cosmology, 6, 2, doi: 10.1186/s40668-019-0028-x
- Nelson et al. (2019b) Nelson, D., Pillepich, A., Springel, V., et al. 2019b, MNRAS, 490, 3234, doi: 10.1093/mnras/stz2306
- Pakmor et al. (2016) Pakmor, R., Springel, V., Bauer, A., et al. 2016, MNRAS, 455, 1134, doi: 10.1093/mnras/stv2380
- Pillepich et al. (2018) Pillepich, A., Springel, V., Nelson, D., et al. 2018, MNRAS, 473, 4077, doi: 10.1093/mnras/stx2656
- Pillepich et al. (2019) Pillepich, A., Nelson, D., Springel, V., et al. 2019, MNRAS, 490, 3196, doi: 10.1093/mnras/stz2338
- Piotrowska et al. (2022) Piotrowska, J. M., Bluck, A. F. L., Maiolino, R., & Peng, Y. 2022, MNRAS, 512, 1052, doi: 10.1093/mnras/stab3673
- Rahmati et al. (2013) Rahmati, A., Pawlik, A. H., Raičević, M., & Schaye, J. 2013, MNRAS, 430, 2427, doi: 10.1093/mnras/stt066
- Saintonge & Catinella (2022) Saintonge, A., & Catinella, B. 2022, ARA&A, 60, 319, doi: 10.1146/annurev-astro-021022-043545
- Saintonge et al. (2016) Saintonge, A., Catinella, B., Cortese, L., et al. 2016, MNRAS, 462, 1749, doi: 10.1093/mnras/stw1715
- Saintonge et al. (2017) Saintonge, A., Catinella, B., Tacconi, L. J., et al. 2017, ApJS, 233, 22, doi: 10.3847/1538-4365/aa97e0
- Salim et al. (2018) Salim, S., Boquien, M., & Lee, J. C. 2018, ApJ, 859, 11, doi: 10.3847/1538-4357/aabf3c
- Schaye et al. (2015) Schaye, J., Crain, R. A., Bower, R. G., et al. 2015, MNRAS, 446, 521, doi: 10.1093/mnras/stu2058
- Schmidt (1959) Schmidt, M. 1959, ApJ, 129, 243, doi: 10.1086/146614
- Shangguan & Ho (2019) Shangguan, J., & Ho, L. C. 2019, ApJ, 873, 90, doi: 10.3847/1538-4357/ab0555
- Shangguan et al. (2020) Shangguan, J., Ho, L. C., Bauer, F. E., Wang, R., & Treister, E. 2020, ApJ, 899, 112, doi: 10.3847/1538-4357/aba8a1
- Shangguan et al. (2018) Shangguan, J., Ho, L. C., & Xie, Y. 2018, ApJ, 854, 158, doi: 10.3847/1538-4357/aaa9be
- Sijacki et al. (2007) Sijacki, D., Springel, V., Di Matteo, T., & Hernquist, L. 2007, MNRAS, 380, 877, doi: 10.1111/j.1365-2966.2007.12153.x
- Sijacki et al. (2015) Sijacki, D., Vogelsberger, M., Genel, S., et al. 2015, MNRAS, 452, 575, doi: 10.1093/mnras/stv1340
- Springel (2010) Springel, V. 2010, MNRAS, 401, 791, doi: 10.1111/j.1365-2966.2009.15715.x
- Springel & Hernquist (2003) Springel, V., & Hernquist, L. 2003, MNRAS, 339, 289, doi: 10.1046/j.1365-8711.2003.06206.x
- Springel et al. (2018) Springel, V., Pakmor, R., Pillepich, A., et al. 2018, MNRAS, 475, 676, doi: 10.1093/mnras/stx3304
- Sternberg et al. (2014) Sternberg, A., Le Petit, F., Roueff, E., & Le Bourlot, J. 2014, ApJ, 790, 10, doi: 10.1088/0004-637X/790/1/10
- Terrazas et al. (2020) Terrazas, B. A., Bell, E. F., Pillepich, A., et al. 2020, MNRAS, 493, 1888, doi: 10.1093/mnras/staa374
- Thomas et al. (2019) Thomas, N., Davé, R., Anglés-Alcázar, D., & Jarvis, M. 2019, MNRAS, 487, 5764, doi: 10.1093/mnras/stz1703
- Varma et al. (2022) Varma, S., Huertas-Company, M., Pillepich, A., et al. 2022, MNRAS, 509, 2654, doi: 10.1093/mnras/stab3149
- Verheijen et al. (2008) Verheijen, M. A. W., Oosterloo, T. A., van Cappellen, W. A., et al. 2008, in American Institute of Physics Conference Series, Vol. 1035, The Evolution of Galaxies Through the Neutral Hydrogen Window, ed. R. Minchin & E. Momjian, 265–271, doi: 10.1063/1.2973599
- Vito et al. (2014) Vito, F., Maiolino, R., Santini, P., et al. 2014, MNRAS, 441, 1059, doi: 10.1093/mnras/stu637
- Vogelsberger et al. (2014) Vogelsberger, M., Genel, S., Springel, V., et al. 2014, MNRAS, 444, 1518, doi: 10.1093/mnras/stu1536
- Wang et al. (2020) Wang, J., Catinella, B., Saintonge, A., et al. 2020, ApJ, 890, 63, doi: 10.3847/1538-4357/ab68dd
- Wang et al. (2021) Wang, J., Staveley-Smith, L., Westmeier, T., et al. 2021, ApJ, 915, 70, doi: 10.3847/1538-4357/abfc52
- Wang et al. (2022) Wang, S., Wang, J., For, B.-Q., et al. 2022, ApJ, 927, 66, doi: 10.3847/1538-4357/ac4270
- Ward et al. (2022) Ward, S. R., Harrison, C. M., Costa, T., & Mainieri, V. 2022, MNRAS, 514, 2936, doi: 10.1093/mnras/stac1219
- Weinberger et al. (2017) Weinberger, R., Springel, V., Hernquist, L., et al. 2017, MNRAS, 465, 3291, doi: 10.1093/mnras/stw2944
- Weinberger et al. (2018) Weinberger, R., Springel, V., Pakmor, R., et al. 2018, MNRAS, 479, 4056, doi: 10.1093/mnras/sty1733
- Wong & Blitz (2002) Wong, T., & Blitz, L. 2002, ApJ, 569, 157, doi: 10.1086/339287
- York et al. (2000) York, D. G., Adelman, J., Anderson, John E., J., et al. 2000, AJ, 120, 1579, doi: 10.1086/301513
- Zinger et al. (2020) Zinger, E., Pillepich, A., Nelson, D., et al. 2020, MNRAS, 499, 768, doi: 10.1093/mnras/staa2607
- Zolotov et al. (2015) Zolotov, A., Dekel, A., Mandelker, N., et al. 2015, MNRAS, 450, 2327, doi: 10.1093/mnras/stv740
- Zwaan et al. (2005) Zwaan, M. A., Meyer, M. J., Staveley-Smith, L., & Webster, R. L. 2005, MNRAS, 359, L30, doi: 10.1111/j.1745-3933.2005.00029.x