FairMILE: Towards an Efficient Framework for Fair Graph Representation Learning
Appendix A Full Theoretical Analysis
Corollary 0.
Algorithm 1 coarsens a graph into a smaller graph such that and .
Proof.
In the optimal case, all nodes in get matched and therefore . The worst case is that all nodes are isolated so the number of nodes does not decrease.
Our coarsening algorithm adds an edge in if and only if there exists at least one edge in that connects one of ’s child nodes and one of ’s child nodes. Therefore . ∎
Lemma 0.
In the phase of graph coarsening, FairMILE consumes time.
Proof.
Without loss of generality, we assume the input graph is (). For each edge, Algorithm 1 computes the fairness-aware edge weight in time. Hence it takes time to match and merge nodes. The time of creating a coarsened graph after node matching is also , which is mainly used for computing the attribute distribution of new nodes and the weights of new edges in the coarsened graph. Summing up the coarsen levels, the total time complexity of graph coarsening is . ∎
Corollary 0.
FairMILE can reduce the time of graph embedding exponentially in the optimal case since .
Proof.
In Corollary 1, we analyze that the number of nodes can be reduced by up to half at each coarsen level. Thus the time complexity of base embedding can also be reduced exponentially when increases. ∎
Lemma 0.
If the refinement model has layers, the time complexity of refinement is .
Proof.
We again assume the input graph is () without loss of generality. Before applying the model, FairMILE projects the embeddings from the supernodes to the child nodes of in time. In each layer of the model, FairMILE needs to concatenate the input with the sensitive attributes. The following message passing process and the matrix multiplication take and time, respectively. Therefore the time complexity of each layer is . Finally, the total time complexity of applying the refinement model is . ∎
Theorem 1. When is minimized, the 2-norm of the difference between the mean embeddings of any two demographic groups regarding a given sensitive attribute is bounded by
| (1) |
where are any two different values of the given sensitive attribute (e.g., gender or race). For , denotes the mean embedding values of nodes from group , and denotes the ratio of nodes from group that have at least one inter-group edge.
Proof.
Our fairness loss in Equation (6) is the average negative cosine similarity of embeddings of all connected node pairs with diverse sensitive attributes, which means . To reach the global minimum of , the parameters are optimized to completely focus on sensitive attributes and generate identical embeddings for the nodes, i.e., the similarity is 1. In general, using a smaller will have more edges impacted by the fairness objective. is the strictest value that always leads to all nodes with inter-group connections having the same representations (denoted as ). A special case is when , holds for any such that . Therefore any enforces fairness in the same strength.
Recall that are any two different values of the given sensitive attribute (e.g., gender). For , let be the set of nodes with attribute value (e.g., all nodes in share the same gender ), Then let be the subset of in which the nodes are only connected to nodes in . Note that . The learned embedding of node is denoted as . When is minimized with , we have
Note that the output embeddings of our refinement model are L2-normalized, hence we finally have
Therefore Equation (8) holds when is minimized. ∎
Appendix B Dataset Description
In German (agarwal2021towards), each node is a client in a German bank, and two nodes are linked if their attributes are similar. The task is to classify a client’s credit risk as good or bad, and the sensitive attribute is the client’s gender.
Recidivism (agarwal2021towards) is a graph created from a set of bail outcomes from US state courts between 1990-2009, where nodes are defendants and edges connect two nodes if they have similar past criminal records and demographic attributes. The task is to predict if a defendant will commit a violent crime or not, while the sensitive attribute is race.
Credit (agarwal2021towards) consists of credit card applicants with their demographic features and payment patterns. Each node is an individual, and two nodes are connected based on feature similarity. In this dataset, age is used as the sensitive attribute, and the predicted label is whether the applicant will default on an upcoming payment.
Pokec-n (takac2012data) is collected from a Slovakia social network. We use both region and gender as the sensitive attributes, and choose each user’s field of work as the predicted label. Note that Pokec-n has multiple sensitive attributes and a multi-class target, which FairMILE can handle by design. However, existing research (dai2021say; dong2022edits; franco2022deep) has only evaluated the use of this data with one sensitive attribute at-a-time with the target label binarized - a key limitation. We discuss how FairMILE can redress this limitation in Section 5.3.
The remaining three datasets (namely, Cora (sen2008collective), Citeseer (sen2008collective), and Pubmed (namata2012query)) are citation networks widely evaluated in the graph representation learning literature (li2020dyadic; spinelli2021fairdrop; current2022fairmod). In these data, each node denotes a paper, and each edge links two nodes if one paper cites the other. As in prior work (li2020dyadic; spinelli2021fairdrop; current2022fairmod), we treat the category of a paper as its sensitive attribute. The task is to predict whether a paper is cited by the other (or vice versa).
| Dataset | Method | AUROC () | F1 () | Time | ||
| Recidivism | NetMF | 94.63 0.17 | 85.46 0.29 | 3.41 0.21 | 1.62 0.78 | 141.90 |
| FairMILE-NetMF | 89.52 0.50 | 77.65 0.47 | 2.81 0.50 | 0.75 0.55 | 29.66 | |
| DeepWalk | 93.33 0.35 | 83.62 0.42 | 3.47 0.37 | 1.28 0.60 | 303.68 | |
| FairMILE-DeepWalk | 86.93 0.74 | 73.50 0.99 | 2.71 0.58 | 1.08 0.77 | 45.93 | |
| Node2vec | 92.56 0.26 | 83.31 0.36 | 3.61 0.56 | 1.57 0.97 | 136.33 | |
| Fairwalk | 92.43 0.43 | 82.99 0.51 | 3.32 0.24 | 1.48 0.66 | 133.62 | |
| FairMILE-Node2vec | 87.00 0.50 | 71.34 0.86 | 2.75 0.35 | 1.15 0.65 | 38.67 | |
| Vanilla GCN | 88.16 1.72 | 77.68 1.63 | 3.83 0.59 | 1.46 0.71 | 474.57 | |
| FairGNN | 67.26 7.80 | 44.63 14.87 | 0.67 0.45 | 1.24 0.40 | 1071.39 | |
| NIFTY | 77.89 4.21 | 64.44 6.11 | 1.34 1.01 | 0.63 0.42 | 1651.09 | |
| EDITS | 79.48 13.26 | 69.66 13.28 | 4.39 2.10 | 2.52 2.04 | 1311.42 | |
| CFGE | 60.92 1.88 | 25.58 6.45 | 0.81 0.58 | 1.45 0.88 | 2498.52 |
Appendix C Node Classification on Recidivism
We conduct the experiments of node classification on another dataset Recidivism and revisit the questions in Section 5.2. Results are shown in Table 1.
A1) Fairness: FairMILE improves the fairness of all unsupervised graph embedding approaches. In Recidivism, FairMILE decreases the scores of NetMF and DeepWalk by and , respectively. In terms of , FairMILE improves the fairness of NetMF and DeepWalk by and . On top of Node2vec, FairMILE outperforms FairWalk in terms of both and . Among the specialized methods, FairGNN has the lowest score and NIFTY has the best score which is slightly better than FairMILE-NetMF ( v.s. ). However, this is because these models trade too much utility for fairness (For example, in terms of AUROC, NIFTY v.s. FairMILE-NetMF ).
A2) Efficiency: FairMILE is more efficient than other baselines. While GNN-based approaches take up to seconds, FairMILE on top of NetMF finishes in only seconds, which is faster. Compared with the unsupervised graph embedding approaches, FairMILE still improves the efficiency of graph embedding.
A3) Utility: Compared with the base embedding methods, the utility scores of FairMILE slightly drop which is fairly remarkable given that FairMILE significantly improves fairness and efficiency. Among the specialized approaches, all approaches except the vanilla GCN are outperformed by FairMILE in terms of AUROC and F1. This demonstrates that FairMILE achieves a better tradeoff between utility and fairness than these GNN-based approaches.
In summary, FairMILE on top of graph embedding approaches can compete or improve on fairness and utility with various specialized methods while outperforming them significantly in terms of efficiency.
Appendix D Full Ablation Study
D.1. Tuning the Coarsen Level

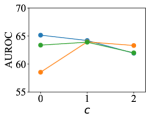
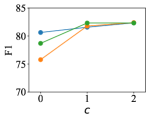
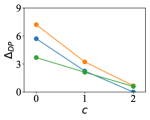
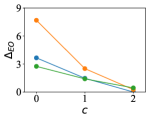
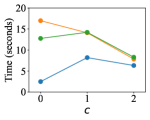
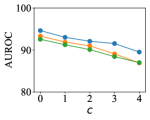
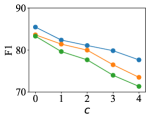
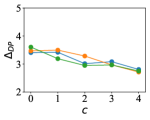
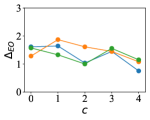
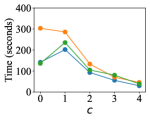
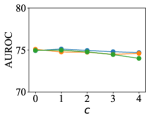
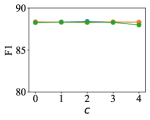
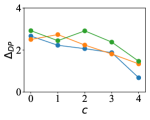
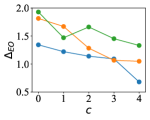
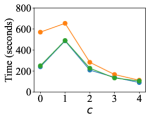
[Impact of coarsen level.]The impact of coarsen level on utility, fairness, and efficiency.
We vary the coarsen level to observe its impact on utility, fairness, and efficiency. Results are shown in Figure 1. Note that when , FairMILE is performing the base embedding method on the original graph. Generally, increasing leads to a slight decrease in AUROC and F1 scores. For example, the AUROC score of DeepWalk only decreases by after FairMILE coarsens the graph 4 times. In some cases, FairMILE achieves a better utility than the base embedding method (e.g., FairMILE-Node2vec with on German). While the decrease of utility is negligible, increasing can visibly improve the fairness of representations. For example, vanilla DeepWalk has and on German, which is improved to and by FairMILE (). Last of all, increasing the coarsen level significantly improves the efficiency. Using a small may make FairMILE slower because the time of coarsening and refinement outweighs the saved time of learning embedding when the coarsened graph is not small enough. Examples include on Credit. Given the little cost of utility, we suggest using a large for the sake of fairness and efficiency.
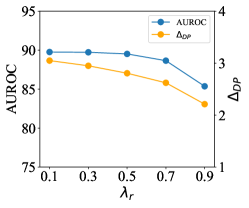
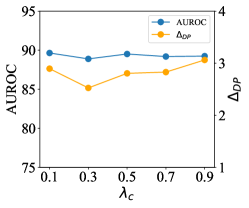
[Impact of hyperparameters.]Impact of varying lambdas on utility and fairness on Recidivism dataset.
D.2. Trade-off between Utility and Fairness
To further explore the trade-off of FairMILE between utility and fairness, we choose the values of and from respectively to observe the impact on performance. Figure 2 shows the results of FairMILE-NetMF on Recidivism with (We only report these results for one dataset since results on other datasets are similar). We use AUROC and as the metrics for utility and fairness. It is clear that there is a trade-off between the utility scores and the fairness of learned embeddings on this dataset. Increasing fairness (represented by lower ) often causes a decrease in utility scores. We also observe that has a larger impact on this tradeoff than . We also find in general that our choice of = achieves a reasonable trade-off (applies to this dataset and the other datasets and tasks in our study). We do note of course that for different scenarios the designer may prefer to choose these parameters appropriately.
| Dataset | Method | AUROC () | AP () | Accuracy () | Time | ||
| Pubmed | VGAE | 95.03 0.18 | 94.96 0.19 | 87.48 0.21 | 39.37 0.88 | 10.28 1.58 | 347.80 |
| FairAdjT2=2 | 94.29 0.17 | 94.07 0.14 | 86.63 0.27 | 37.12 0.89 | 7.57 1.56 | 2218.41 | |
| FairAdjT2=5 | 93.57 0.19 | 93.21 0.13 | 85.69 0.16 | 35.06 1.01 | 5.60 1.55 | 2480.66 | |
| FairAdjT2=20 | 91.78 0.12 | 91.27 0.24 | 83.20 0.22 | 30.41 0.89 | 2.41 1.28 | 4532.99 | |
| CFGE | 91.25 5.32 | 92.08 5.22 | 82.78 5.79 | 33.03 6.19 | 9.55 2.35 | 4237.43 | |
| NetMF | 98.43 0.07 | 98.26 0.05 | 93.86 0.19 | 38.59 0.14 | 2.04 0.15 | 281.35 | |
| FairMILE-NetMF | 98.11 0.12 | 97.29 0.20 | 94.84 0.31 | 31.97 0.68 | 2.70 0.22 | 126.17 | |
| DeepWalk | 98.35 0.14 | 98.05 0.17 | 91.77 0.29 | 35.02 0.43 | 0.40 0.12 | 354.27 | |
| FairMILE-DeepWalk | 99.57 0.04 | 99.32 0.08 | 97.61 0.06 | 27.30 0.23 | 0.37 0.11 | 201.03 | |
| Node2vec | 99.52 0.04 | 99.44 0.04 | 93.11 0.21 | 40.28 0.41 | 0.21 0.13 | 249.52 | |
| Fairwalk | 99.50 0.05 | 99.43 0.05 | 92.86 0.24 | 38.58 0.35 | 0.65 0.12 | 225.99 | |
| FairMILE-Node2vec | 99.23 0.07 | 98.68 0.14 | 96.43 0.06 | 26.51 0.35 | 0.59 0.05 | 143.01 |
Appendix E Full Results for Link Predictions
We evaluate FairMILE in the context of link prediction on three datasets. For FairMILE, we set on smaller datasets (Cora and Citeseer) and on Pubmed. Table 2 shows the results on Pubmed. For the results on other datasets, please refer to Table 7 in Section 5.5. First, FairMILE makes fair predictions on all datasets. Our framework has an improvement of up to on compared with the base embedding approaches. In terms of , while the performance of FairMILE declines on Pubmed very slightly ( v.s. in NetMF), it greatly reduces the unfair predictions on Cora and Citeseer. Combining the observations on both metrics, FairMILE successfully enforces fairness in the task of link prediction. When compared with FairWalk, FairMILE-Node2vec always has a better fairness score (e.g., v.s. on Citeseer). In addition, we notice that FairAdj is less biased than VGAE, which demonstrates its effectiveness in debiasing. However, its best performance with is still outperformed by FairMILE on all datasets. For example, the score of FairMILE-Node2vec on Citeseer is lower than that of FairAdj (). Compared with CFGE, FairMILE on top of Node2vec has a better performance in terms of fairness.
On the other hand, FairMILE also performs well in terms of utility. In comparison to the standard embedding approaches, FairMILE achieves a similar or better utility performance. For example, FairMILE actually enhances the accuracy of DeepWalk from to on Pubmed. Similar results can also be observed on the other metrics and datasets. Compared with VGAE-based methods, FairMILE outperforms them again on utility. Examples include that AUROC scores of VGAE and FairMILE-DeepWalk on Pubmed are v.s. , respectively.
Finally, FairMILE is more efficient than other baselines. For example, on the largest dataset Pubmed, FairMILE-NetMF takes around 2 minutes, while NetMF needs around 5 minutes, and FairAdj with even requires more than one hour to finish. In summary, FairMILE can flexibly generalize to the link prediction task improving over the state of the art on both counts of fairness and efficiency at a marginal cost to utility.