Machine Learning-Assisted Recurrence Prediction for Early-Stage Non-Small-Cell Lung Cancer Patients
Abstract
Background: Stratifying cancer patients according to risk of relapse can personalize their care. In this work, we provide an answer to the following research question: How to utilize machine learning to estimate probability of relapse in early-stage non-small-cell lung cancer patients?
Methods: For predicting relapse in 1,387 early-stage (I-II), non-small-cell lung cancer (NSCLC) patients from the Spanish Lung Cancer Group data (65.7 average age, 24.8% females, 75.2% males) we train tabular and graph machine learning models. We generate automatic explanations for the predictions of such models. For models trained on tabular data, we adopt SHAP local explanations to gauge how each patient feature contributes to the predicted outcome. We explain graph machine learning predictions with an example-based method that highlights influential past patients.
Results: Machine learning models trained on tabular data exhibit a 76% accuracy for the Random Forest model at predicting relapse evaluated with a 10-fold cross-validation (model was trained 10 times with different independent sets of patients in test, train and validation sets, the reported metrics are averaged over these 10 test sets). Graph machine learning reaches 68% accuracy over a 200-patient, held-out test set, calibrated on a held-out set of 100 patients.
Conclusions: Our results show that machine learning models trained on tabular and graph data can enable objective, personalised and reproducible prediction of relapse and therefore, disease outcome in patients with early-stage NSCLC. With further prospective and multisite validation, and additional radiological and molecular data, this prognostic model could potentially serve as a predictive decision support tool for deciding the use of adjuvant treatments in early-stage lung cancer.
Keywords Non-Small-Cell Lung Cancer, Tumor Recurrence Prediction, Machine Learning
1 Introduction
Lung cancer is the world’s leading cause of cancer-related death with an estimated 1.8 million deaths equating to 18 of all cancer deaths in 2020 [1]. It is the leading cause of cancer-related deaths for men and second for women after breast cancer [1]. Mortality and incidence occur roughly twice as much in men than in women [1]. Five years relative survival after being diagnosed with lung and bronchus cancer in US population was 22 as reported in Cancer Statistics 2022 by ACS for years 2011–2017 [2].
The resection of early-stage NSCLC offers patients the best hope of a cure, however, relapse rates post-resection remain high and even for patients with disease at the same stage incidences of relapse after curative surgery vary significantly. 30 to 55 of patients with NSCLC develop relapse and eventually die of their disease despite curative resection. Therefore, accurately predicting the individual patient cases in which the disease is likely to recur after surgery can facilitate early, personalised detection and treatment [3].
This work targets machine-aided prediction of lung cancer relapse within the scope of the European project CLARIFY111 https://www.clarify2020.eu/, an effort focused on monitoring health status and quality of life after cancer treatment. It is a follow-up of [4] in which we explored baseline models for NSCLC patients elapse prediction. Since the capacity of baseline models for making complex inferences based on individual patients’ data is rather limited, in this work we model clinical data as a knowledge graph [5]. Compared to modelling data as tables, a knowledge graph favours extensions with heterogenous data sources [6]. Graph datasets are well suited to be used by various reasoners: logical, machine learning-based, or hybrid and, allow inference over long-range dependencies between concepts (e.g., patients, diseases, biomarkers, genes, drugs). Graphs also ease integrating core clinical data with population-level genetics, drugs, diseases [7, 8, 9], and information extracted from relevant scientific literature. Graph machine learning adopted in this work leverages dependencies and patterns between patients and other concepts in the graph and delivers more powerful predictions over traditional approaches. We complement existing approaches in survival analysis applied to relapse prediction (e.g. machine learning used to estimate Time-To-Relapse (TTR) for malignant pleural mesothelioma [10], or studies that analyze prognostic features for NSCLC relapse tumor tissue image analysis [11, 12, 13]). Unlike the previous work [14] that used time-binned deep neural networks, we also propose a novel method to explain each machine learning prediction by retrieving influential patients from the training set.
2 Materials and Methods
Patients. We carried out a retrospective study looking at 1,387 I-II early-stage NSCLC patients selected according to the criteria in Table 1 from the Spanish Lung Cancer Group’s Thoracic Tumor Registry (TTR) containing at the time of writing 12,981 NSCLC patients. The 1,387 patients come from two cases filtered according to treatment type received. Case 1 (n1,711) tumor stage I and II with stage T: T1a/T1b/T1c/T2a/T2b/T0/Tx/Tis; stage N: N0/N1; and M: M0. Case 2 (n375) tumor stage of IIB; TNM stage: T3, N0, M0. Apart from tumor characteristics, we filtered patients who underwent one of the following chemotherapy types: Adjuvant chemotherapy/intravenous CHT/Adjuvant CHT-RT/Neoadjuvant chemotherapy/Neoadjuvant CHT-RT/none; and/or Adjuvant radiotherapy.
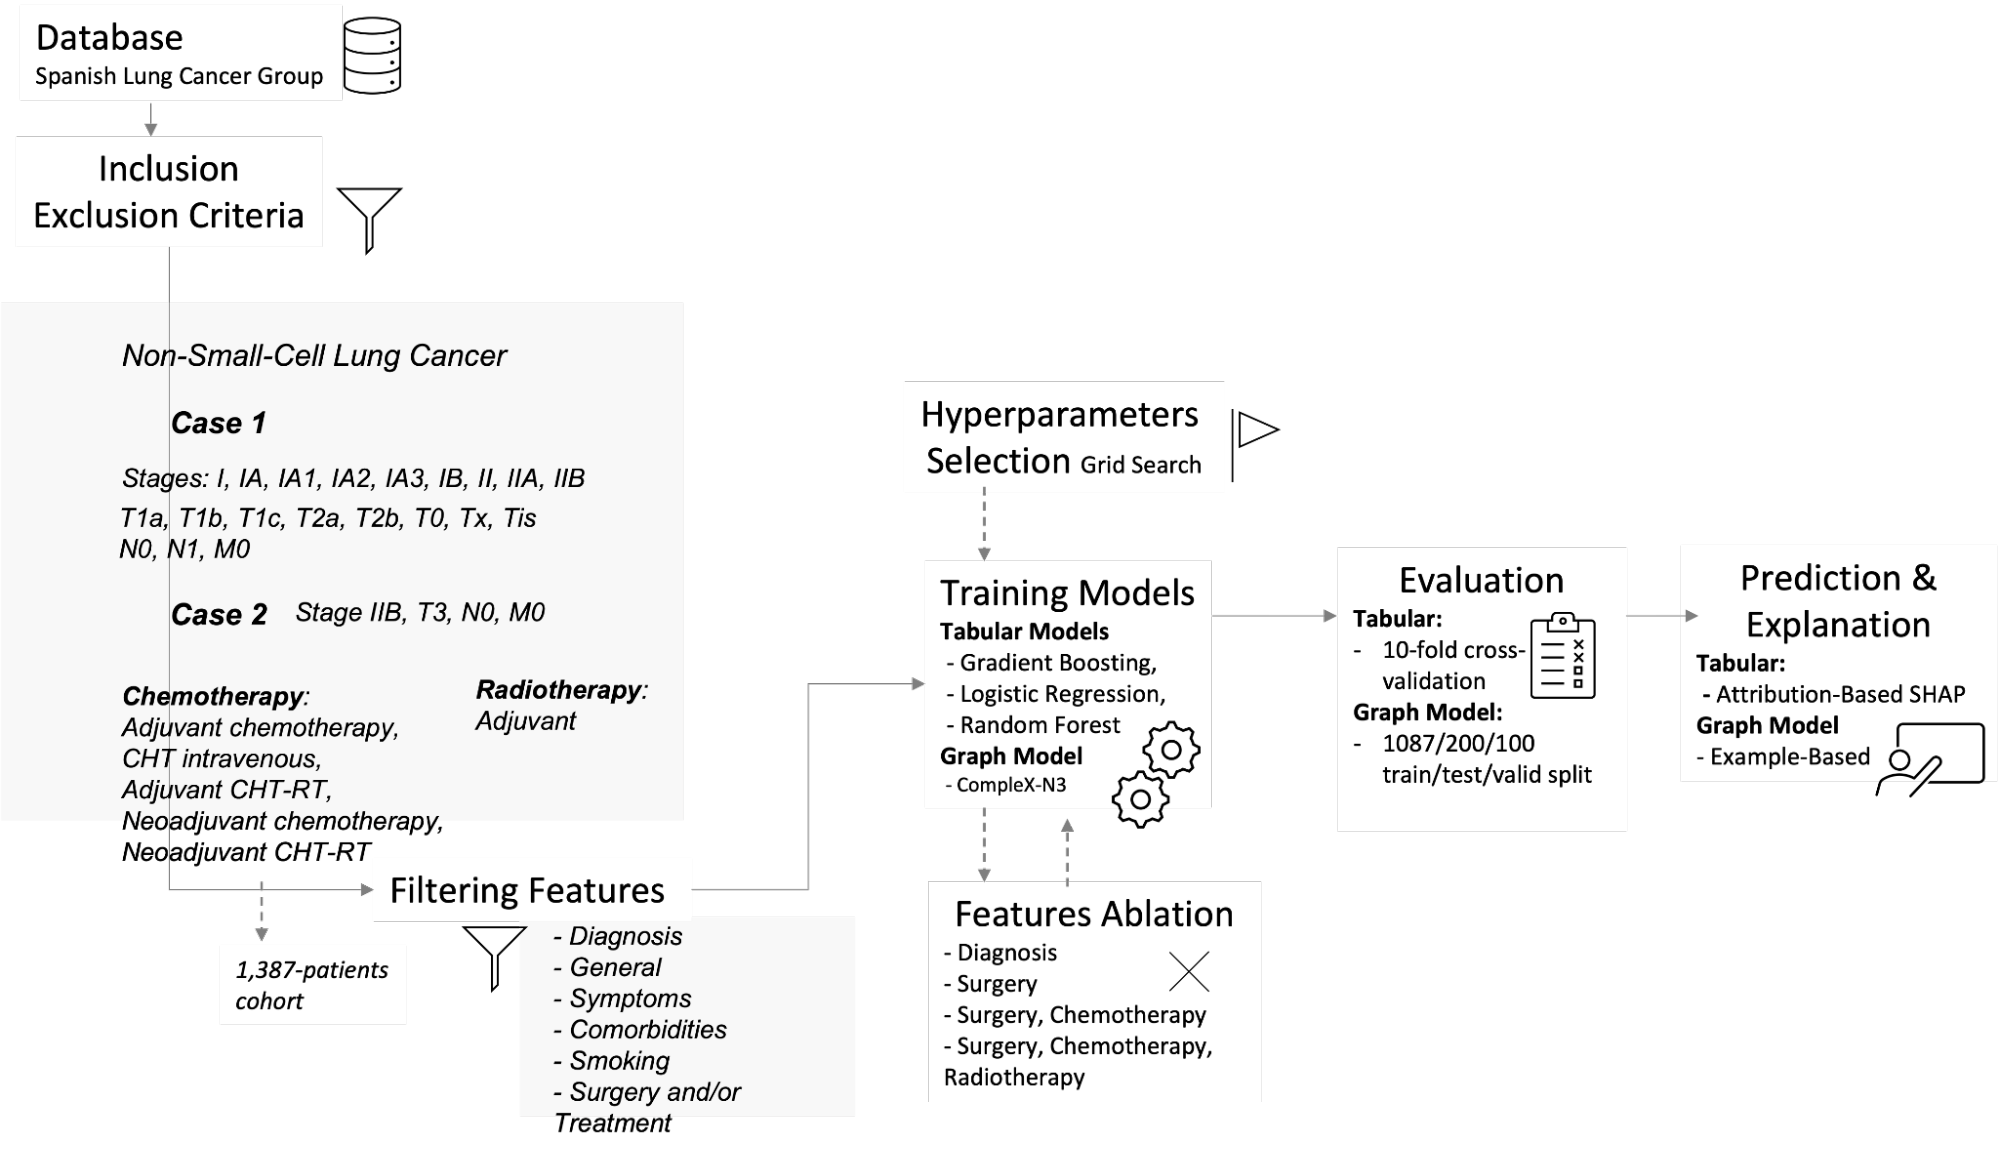
Study design We treat predicting risk of relapse as a binary classification task and further cast it as a tabular model classification and graph-based link prediction tasks as depicted in Figure 1. These two approaches differ in the data representation aspect (see Introduction). We train two sets of models on the same input data, in a table-like andgraph forms. We evaluate models using binary classification metrics, adopting a 10-fold cross-validation protocol for tabular models and train/valid/test splits for graph model.
Labels. We label patients as positives if they either i) have a progression record with status "Progression"/"Relapse" or ii) their follow-up records include the status "Alive with disease"/"Dead" (with cause of death "Lung cancer") similarily to [4]. The rest are considered negatives. There were 37.3 (n517) relapsed patients in any time of their life after initial surgery and/or treatment and 62.7 (n870) patients who did not.
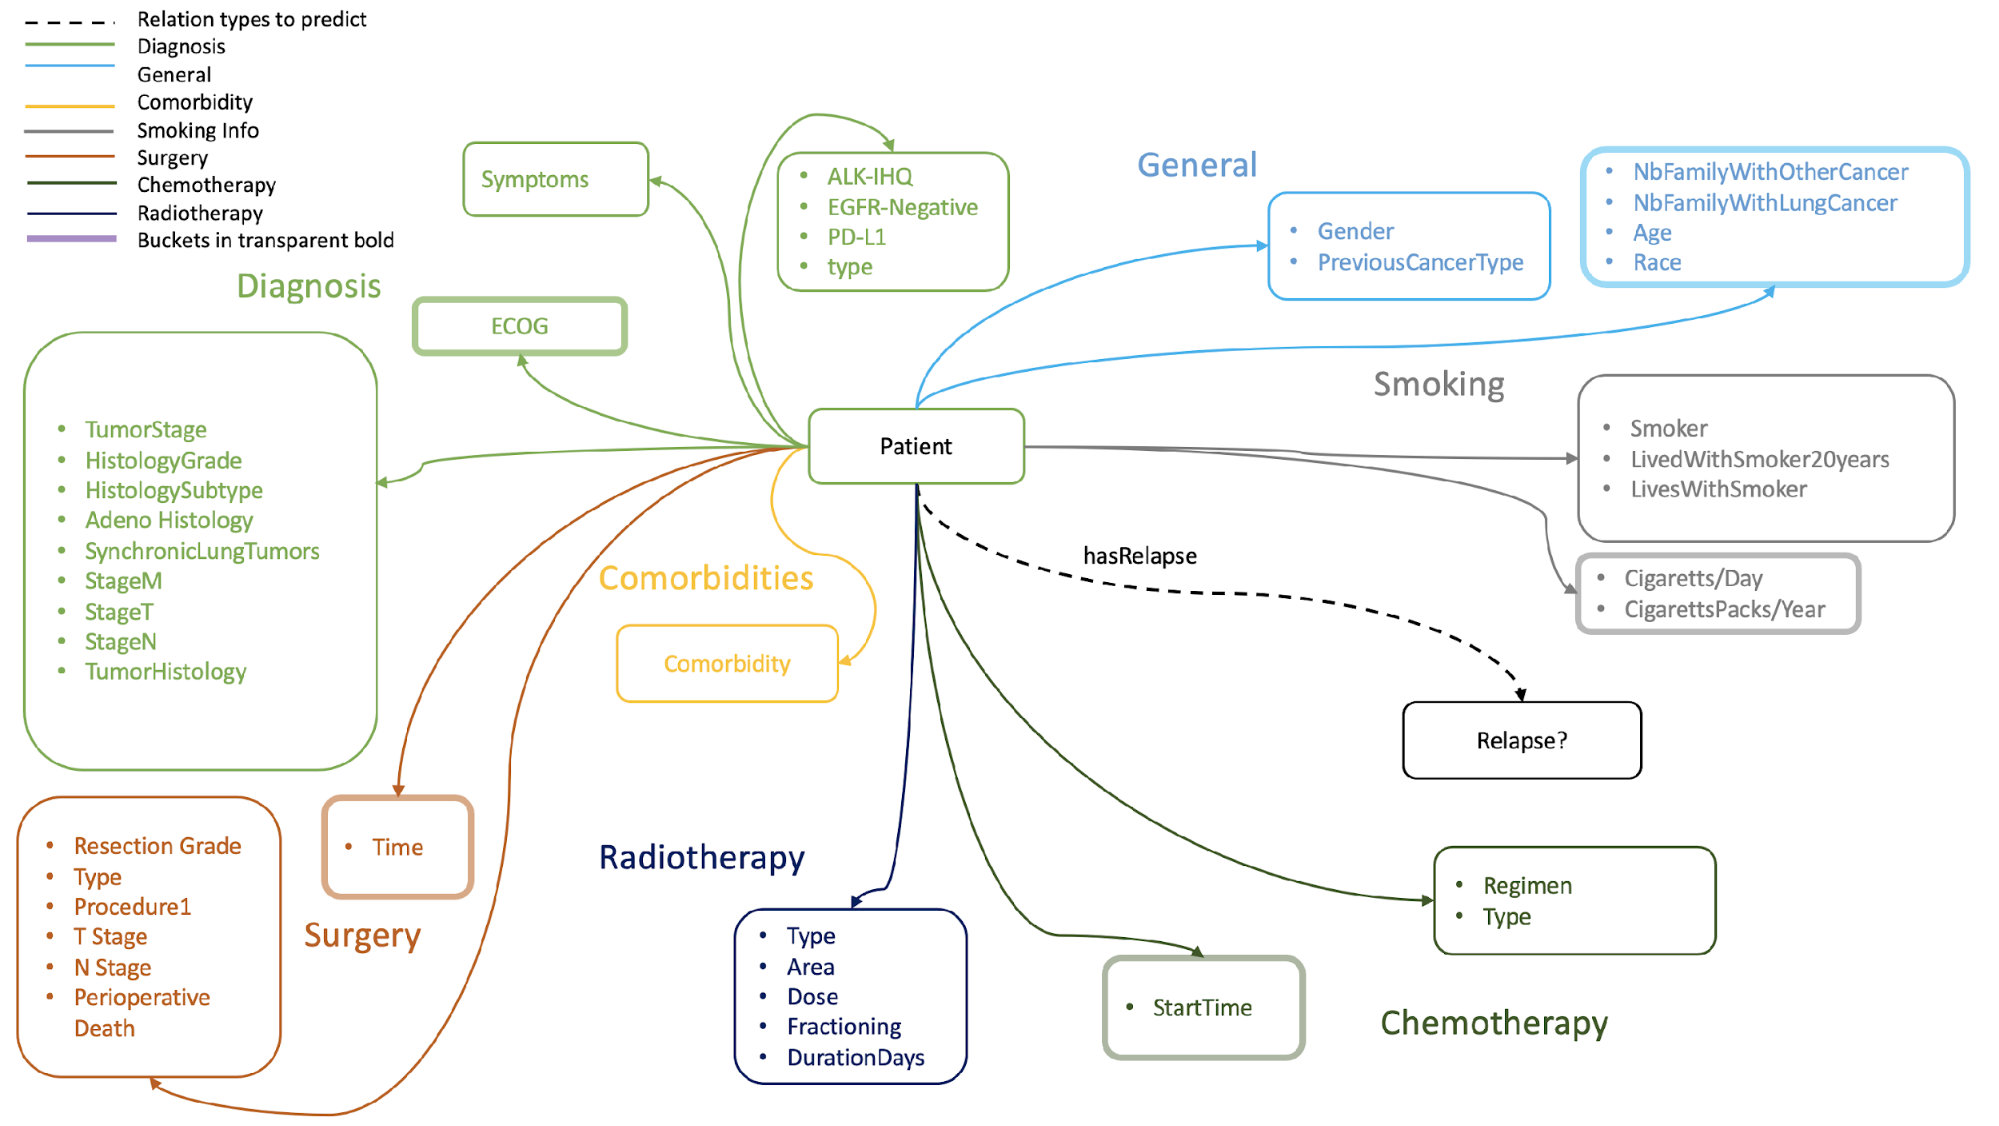
Patients’ features. We identify feature as both patient and treatment characteristics. For full list of features with descriptions see supplement-section:D. We trained models on the group of features: tumor characteristics (stage, TNM, histology,grade, and subtype details), general (age, race, gender, previous cancer type, family cancer history, ECOG, synchronous tumors, biomarkers: ALK IHQ, PD-L1, EGFR negative), comorbidities, smoking information, symptoms, radiotherapy (type, area, dose, fractioning, duration), chemotherapy (type, start time, regimen), surgery (procedure, time, type, resection grade, TN stages).
Data Preprocessing. The original dataset includes several dates which we turn into months-elapsed-since-the-diagnosis-date. If the diagnosis date is not present, we choose one month before the first recorded treatment as the estimated date. Each time-stamped feature is derived by subtracting its date from the above timestamp. This applies to chemotherapy start time, surgery time. Radiotherapy duration is in days. Patient age is derived based on the heuristic estimating age-at-diagnosis, when the diagnosis date is missing, it estimates it based on the first available date (e.g., oncological consultation). Additional condition cuts dates more recent than 1990. For the graph machine learning model, we group numerical features into range bins (the graph machine learning model adopted in this work does not support continuous numerical features). Table 2 presents patientscharacteristics.
Machine Learning Models Training Both models tabular and graph-based share a similar pipeline depicted in Figure 1. We found the best hyperparameters using grid search over predefined values and used the best combinations for training models on different subsets of features in ablation studies (results reported in Table 3). The first model was trained only on diagnosis and general features and then two models were trained with addition of the following groups of features:
-
•
Surgery: type, time-since-diagnosis (months), procedure, resection grade, T,Nstages.
-
•
Surgery (as above) Chemotherapy: type, start-time-since-diagnosis (months), regimen Radiotherapy: type, duration (in days), dose, fractioning, area.
Relapse Prediction with Tabular Machine Learning
To predict relapse, we first represent patients features in a table-like form and adopt machine learning classifiers:logistic regression, random forest, and gradient boosting222 We exclude the multi-layer perceptron and support vector classifier (present in[4]) due to their lack of interpretability, lower predictive power, and higher training time.. We trained these three models on the patient data. Each model was trained for three different sets of features as described above. Models predict whether a patient is going to relapse or not. Preprocessing applied to the data includes imputation of missing values with constant value333 -1 for non-time related features and 5000 months for time-related features. for numerical features and a special code for categorical features. The latter were then one-hot-encoded. Because of the imbalanced nature of the data, we randomly over-sampled.
The hyperparameters of the models are chosen using a grid search procedure over the predefined set of parameters grid for each type of model. Models were trained using stratified 10-fold cross-validation where each set contains approximately the same percentage of each target class. We choose hyperparameters corresponding to the best performing configuration for each of the examined models. The best hyperparameters are reported in the supplementary material.
Relapse Prediction with Graph Machine Learning
Dataset. We model the lung cancer clinical data as a knowledge graph [5] that includes 34,351 statements that connect nodes in the graph (42 links types, 1524 nodes). The graph covers 1,387 early-stage NSCLC patients and their clinical data, see Figure 2.
Test and validation patients are selected randomly, enforcing a balanced distribution of classes in the test and validation sets. The number of patients is pre-set to 200 in the test set (14.8) and 100 in the validation set (7,4). Respectively, there are 100 and 50 relapsed patients in the test and validation sets and the same number non-relapsed.
Model Selection, Hyperparameter values. We adopt the ComplEx-N3 model (achieving state-of-the-art results [15]). We select hyperparameter values of the KGE model with a grid search across the following values: embedding size (50/100/200), number of negatives generated at runtime during training for each positive (5/25), and initializer (Xavier/uniform). For each parameter configuration (12), we select the best model according to accuracy score on the validation set. The best hyperparameter: Adam optimizer, learning rate1e-3, multiclass-NLL loss, L3-regularizer with weight lambda1e-3 training epochs4000 with batches count5, early-stopping. Embedding dimension is k100, synthetic negatives ratio eta25 and uniform initializer. Random seed set to default value.
Implementation. All experiments are implemented using Python3.7 with the Knowledge Graph Embedding library AmpliGraph [16] v1.4.0, using TensorFlow1.15.2. We used Ubuntu 16.04 on an Intel Xeon Gold 6142, 64 GB, equipped with a Tesla V100 16GB.
Evaluation Protocol:
Binary Classification. To compare with the tabular machine learning models, we evaluate graph models with binary classification metrics. For the best model, we choose the threshold for binary classification on the validation set using a value that maximizes difference between true positive (TPR) and false positive (FPR) rates. We adopted this method over other approaches as it gives better validation results444 Other method include: selecting a threshold that maximizes the f1 score or selecting a label by assessment of which prediction was stronger (“does not recur” or “recur”).Both methods lead to worse results..
Ranking-based. We sanity-check the graph machine learning approach by evaluating using the learning-to-rank-based protocol and metrics commonly adopted in literature for these family of models. We use the following metrics: Hits@N, Mean Reciprocal Rank (MRR)555 For details see: Costabello, Luca et al. Knowledge Graph Embeddings Tutorial: From Theory to Practice, https://kge-tutorial-ecai2020.github.io/, ECAI’20. .
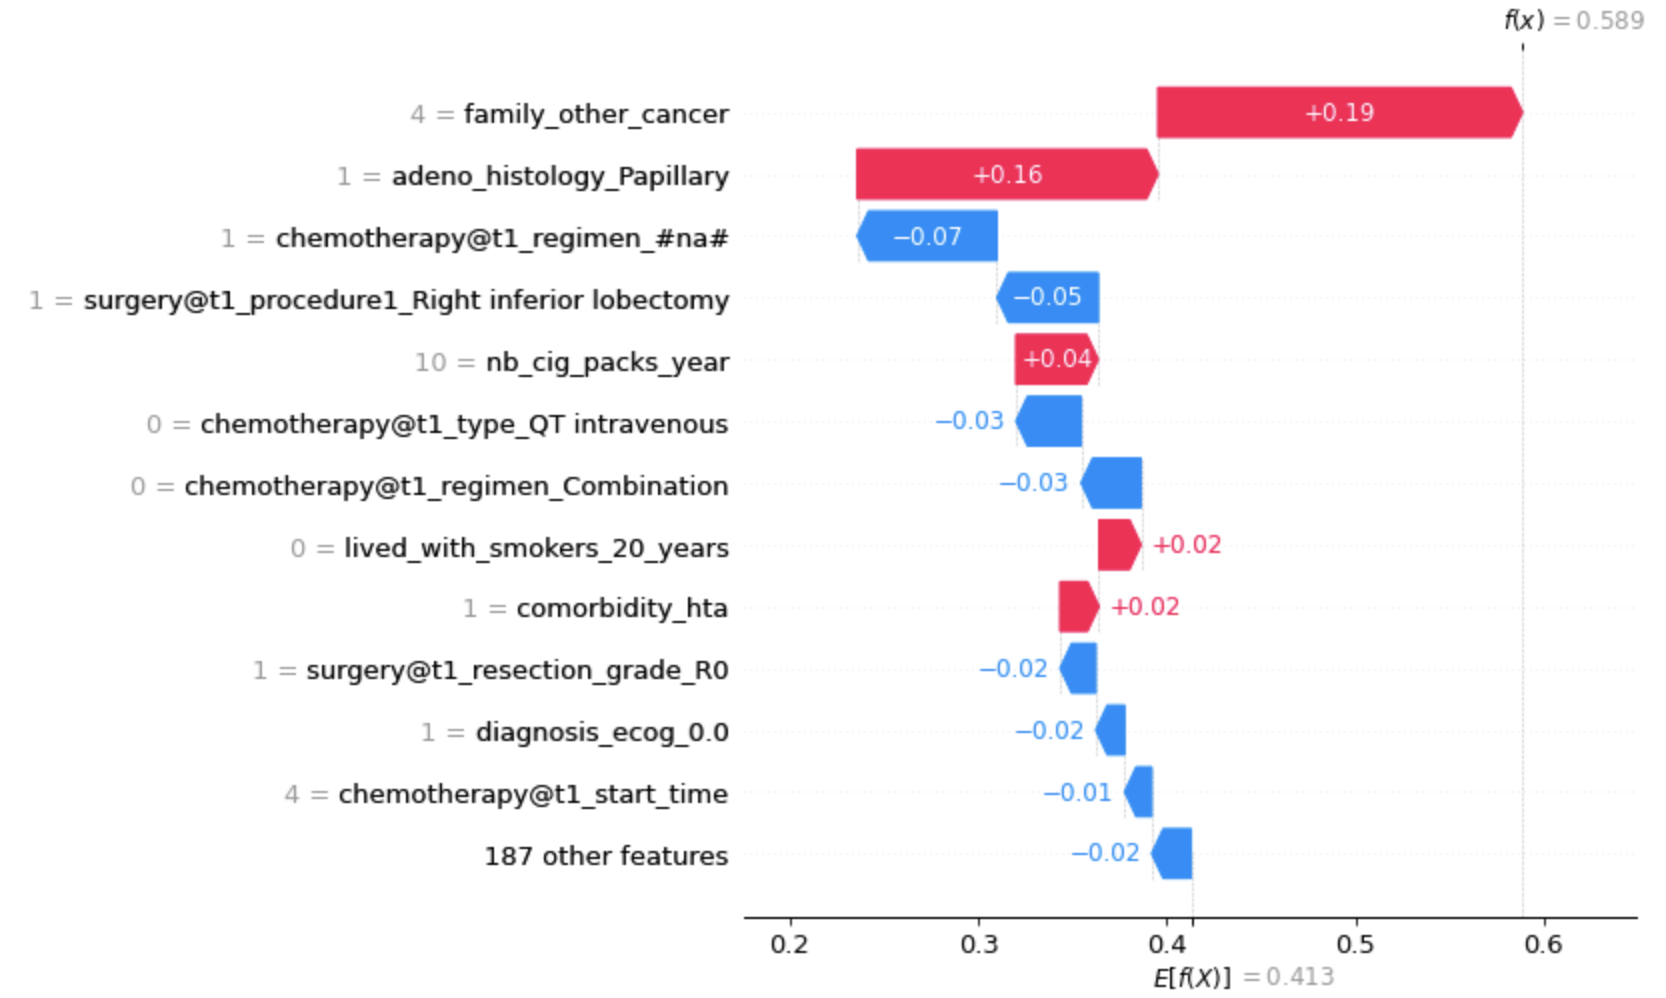
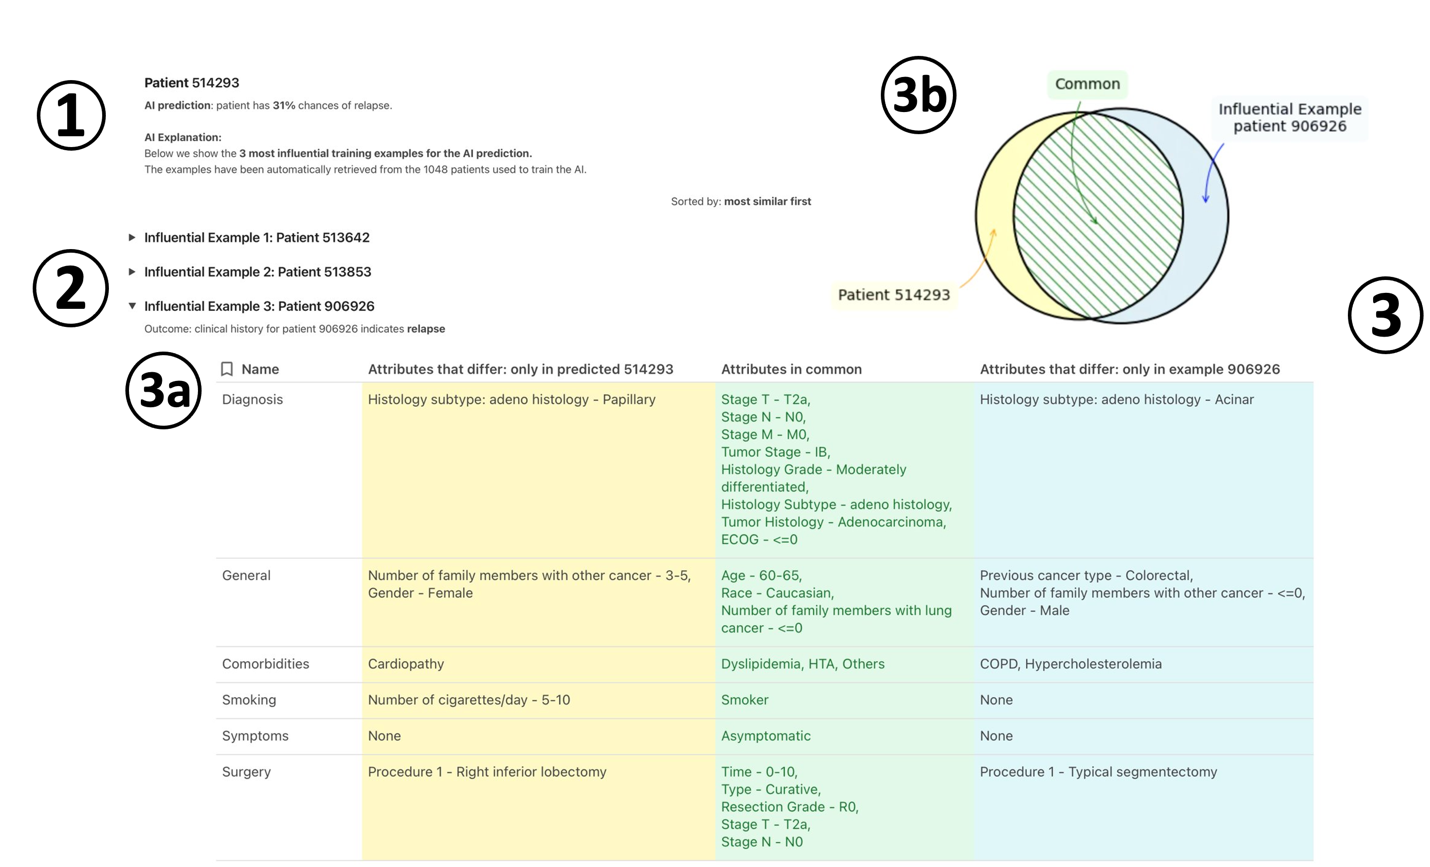
Explanations. For both tabular and graph machine learning, we adopt explainable AI approaches to provide context for the predictions. We adopt SHapley Additive exPlanations SHAP [17] for tabular models, and an example-based approach for graph machine learning. Along with the prediction score for relapse, models also return an accompanying chart or textual description supporting such prediction (Figure 3). Tabular models’ explanation is a waterfall chart with patient’s features contributing to the prediction (positively/negatively). For the graph machine learning model, we highlight similar past patients in the model space to the one being predicted (i.e. “example-based" explanation).
3 Results
We report a patient’s characteristics of the selected 1,387 early-stage NSCLC patient cohort in Table 2.
3.1 Patients’ Inclusion/Exclusion Criteria
Feature Name:
Case 1
Include a patient if the listed feature’s value is among one listed in this column.
Case 2
Include a patient if the listed feature’s value is among one listed in this column.
Exclude
Reference of which patients were excluded, because of feature’s values not being listed in Case 1 and/or Case 2.
Cancer Type
Non-Small-Cell Lung Cancer (NSCLC)
Small cell lung cancer, Carcinoid tumor, Epithelial thymoma, Mesothelioma, NA
Tumor Stage
I, IA, IA1, IA2, IA3, IB, II, IIA, IIB
IIB
IIIA, IIIB, IIIC, Otros, IV, IVA, IVB, Limited, Extended, NA
Stage T
T1a, T1b, T1c, T2a, T2b, T0, Tx, Tis
T3
T3 (except Case 2), T4, NA
Stage N
N0, N1
N0
N2, N3, Nx, NA
Stage M
M0
M1a, M1b, M1c, Mx, NA
Total number of patients
per case:
1711
375
-
Total number of patients
(Cases 1 2):
2086
Chemotherapy Type
In the case when a patient had chemotherapy.
Adjuvant chemotherapy,
CHT intravenous,
Adjuvant CHT and RT,
Neoadjuvant chemotherapy,
Neoadjuvant CHT-RT
Oral targeted therapy, Oral and intravenous chemotherapy, Others, Immunotherapy, Concomitant CHT-RT, Sequential CHT-RT, Oral chemotherapy, Intravenous chemotherapy + immunotherapy, Hormonal, NA
Include patients who did not undergo chemotherapy.
Include patients without chemotherapy that fit other criteria.
-
Radiotherapy Intention
In the case when a patient had radiotherapy.
Adjuvant
Palliative, Radical, Prophylactic, Neoadjuvant, NA
Include patients who did not undergo radiotherapy.
Include patients without radiotherapy that fit other criteria.
-
Full Cohort Size:
1387
NA - Not Available meaning there is entry about a patient, but value is either NULL or - or NA.
3.2 Patients’ Characteristics
Characteristic Relapse No relapse Total 517 (37.3) 870 (62.7) 1387 (100.0) Age Mean (range) 65.7 (33-88) 65.6 (31-118) 65.7 (31-118) Gender Male 407 (39.0) 636 (61.0) 1043 (75.2) Female 110 (32.0) 234 (68.0) 344 (24.8) Smoking history Current/Previous 460 (38.0) 750 (62.0) 1210 (87.2) Non-Smoker 57 (32.2) 120 (68.8) 177 (12.8) Cancer stage I 1 (100.0) 0 (0.0) 1 (0.0721) IA1 8 (32.0) 17 (68.0) 25 (1.8) IA3 8 (17.4) 38 (82.6) 46 (3.32) IA2 9 (13.6) 57 (86.4) 66 (4.76) IIA 112 (46.7) 128 (53.3) 240 (17.3) IA 74 (29.0) 181 (71.0) 255 (18.4) IIB 148 (41.9) 205 (58.1) 353 (25.5) IB 157 (39.2) 244 (60.8) 401 (28.9) T stage T2a 210 (41.1) 301 (58.9) 511 (36.8) T1b 56 (26.0) 159 (74.0) 215 (15.5) T3 94 (42.0) 130 (68.0) 224 (16.1) T2b 76 (42.5) 103 (57.5) 179 (12.9) T1a 55 (32.7) 113 (67.3) 168 (12.1) T1c 14 (20.0) 56 (80.0) 70 (5.05) Tx 12 (60.0) 8 (40.0) 20 (1.44) N stage N0 406 (35.2) 747 (64.8) 1153 (83.1) N1 111 (47.4) 123 (52.6) 234 (16.9) M stage M0 517 (37.3) 870 (62.7) 1387 (100.0) ECOG status 0 259 (30.3) 597 (69.7) 856 (61.7) 1 225 (47.3) 251 (52.7) 476 (34.3) 2 26 (60.5) 17 (39.5) 43 (3.1) 3 6 (75.0) 2 (25.0) 8 (0.577) 4 1 (100.0) 0 (0.0) 1 (0.0721) Tumor Differentiation Non specified 146 (40.3) 216 (69.7) 362 (26.1) Moderately differentiated 56 (27.1) 151 (72.9) 207 (14.9) Poorly differentiated 45 (43.3) 59 (56.7) 104 (7.5) Well differentiated 56 (43.3) 74 (56.9) 130 (9.37) Undifferentiated 3 (50.0) 3 (50.0) 6 (0.433) Surgery 459 (33.1) 848 (61.1) 1307 (94.2) Chemotherapy 379 (27.3) 318 (22.9) 697 (50.3) Radiotherapy 42 (3.03) 22 (1.59) 64 (4.61)
3.3 Predictive Power Assessment
The goal is to categorize patients into individuals likely to relapse or not (regardless of when the relapse occurs). The problem is cast as a binary classification task to predict the probability of relapse and support it with explanations. We cannot directly compare against baseline models from our previous work [4] due to different inclusion criteria for patients, resulting in smaller training dataset; we report a random baseline instead. For both types of models tabular (Logistic Regression, Random Forest, Gradient Boosting) and graph model (ComplEx-N3) we run hyperparameter search experiments to pick best parameters on the validation set and then we run the ablation study with different group of features 1) diagnosis only features, 2) diagnosis and surgery and 3) diagnosis, surgery, and treatment, presented in Table 3. To evaluate the task, we use a set of binary metrics for two types of models, reported in Tables 3. See supplementary materials for metrics details.
Machine Learning Predictive Performance Results
Model Accuracy Precision Recall F1 AUC-PR666 Also known as average precision/ AP/ area under precision-recall curve, to not confuse with the mean value of precision (Precision column). AUC-ROC Diagnosis Features Tabular Random Baseline 0.5050.040 0.3780.041 0.5110.061 0.4340.047 0.3730.002 0.5000.000 Gradient Boosting 0.6360.040 0.5110.051 0.5400.083 0.5230.062 0.5730.069 0.6740.045 Logistic Regression 0.6130.026 0.4850.027 0.5770.052 0.5260.030 0.5750.053 0.6750.037 Random Forest 0.6630.031 0.5670.057 0.4180.060 0.4800.053 0.5760.050 0.6700.031 Graph ComplEx-N3 0.44 0.4362 0.41 0.4227 0.4738 0.44 Diag. Feat. + Surgery Tabular Random Baseline 0.4810.032 0.3490.038 0.4580.080 0.3950.052 0.3730.002 0.5000.000 Gradient Boosting 0.6870.025 0.5890.042 0.5490.020 0.5670.020 0.6370.046 0.7210.030 Logistic Regression 0.6630.027 0.5460.035 0.5820.031 0.5630.027 0.6160.057 0.7110.035 Random Forest 0.7070.038 0.6470.073 0.4820.056 0.5500.053 0.6450.060 0.7280.033 Graph ComplEx-N3 0.68 0.6607 0.74 0.6981 0.6189 0.68 Diag. Feat. + Surg. + Treatment Tabular Random Baseline 0.5120.031 0.3840.028 0.5070.043 0.4360.030 0.3730.002 0.5000.000 Gradient Boosting 0.7460.026 0.6670.052 0.6490.088 0.6530.044 0.7650.032 0.8070.035 Logistic Regression 0.7350.039 0.6320.049 0.6920.074 0.6600.054 0.7080.052 0.7870.041 Random Forest 0.7610.030 0.7010.049 0.6320.074 0.6620.049 0.7620.035 0.8130.031 Graph ML ComplEx-N3 0.685 0.7176 0.61 0.6594 0.6327 0.685
3.4 Explanations, Examples
We predict the probability of relapse of a patient using tabular and graph machine learning and report AI-generated explanations for each approach.
Tabular model: we adopt SHAP, a method based on Shapley Values to estimate the marginal contribution of each dimension on the predicted result. Shapley values is a game theory method that allocates the “dividend" of the prediction to each dimension. The idea underneath SHAP is that dimensions of the target data point being predicted by the model compete against each other to contribute to the prediction. It uses a sample of training examples, to compute the expected output of the model. With waterfall plots present contribution of each feature towards the output. In the example below, we have in red positive and in blue negative contributions. Gradient Boosting Classifier predicts that the patient has 0.589 chances of relapsing. Having four family members with other cancer is the highest contributing factor, which increases the prediction by 0.19 . Missing information on the regimen of the chemotherapy or not having it done at all (chemotherapy@t1_regimen_nan) decreases the prediction by 0.07. This method has its limitations being it explains model prediction and not causal factors that may be at the root of the relapse. E.g., not providing information about the type of chemotherapy regimen does not increase the risk of relapse.
Graph Machine Learning model: we adopt an example-based approach that provides influential examples the model is trained on. Figure 3 A) shows prediction for a patient of 0.31 probability of relapse. Three influential patients are returned as a result based on the learned latent space of the model. For one influential example (906926) common and differing characteristics are listed. In common are stage Ib, and TNM of:T2a, N0, M0, adenocarcinoma histology, and grade being moderately differentiated andECOG0. Both patients are in the same age group: 60-65 and do not have family members with lung cancer. They Have Dyslipidemia, HTA and other comorbidities and are both smokers with one smoking roughly 5-10 cigarettes/day, both are asymptomatic. They went through the curative surgery in the first 10 months from diagnosis with resection grade R0 and the same TN stages as at the time of diagnosis. Despite these common traits they differ in the following characteristics: one has histology subtype Papillary and the other Acinar, they are of different genders, and one has family history of other cancer (3-5) while the other has none. Influential patients had Colorectal cancer, COPD and Hypercholesterolemia in the past while predicted patients had cardiopathy. In terms of the surgery both patients went through different procedures right inferior lobectomy and typical segmentectomy respectively. This method limitation is that it does not rank the features, instead it brings historical cases that display similarity to the predicted patient according to trained model space. We can see that the method brings to attention past cases of patients similar to the predicted patient, which depends on the definition of similarity. We can augment methods to list more relevant cases by incorporating doctor-defined constraints e.g. both patients should have the same TNM stages and same procedure.
A) Tabular model
B) Graph Machine Learning Model
4 DISCUSSION
Regardless of the progress in cancer treatment in the past 10 years, 5-year survival remains at the level of 50 for resected NSCLC patients [19]. Even in stage I, 20 of patients recurred within 5 year time [19].
Predicting NSCLC relapse after surgery is essential for bespoke monitoring plans and adjuvant therapies [13]. TNM-staging system is currently the only validated prognostic indicator for survival [20]. Nevertheless, adoption of Machine Learning for other cancers substantially improves prediction accuracy [21]. There exist no clinical, pathological, or molecular markers that predict risk of relapse with high accuracy other than the AJCC/International Staging System for lung cancer, which is i) focused on the nodal state affected and ii) highly dependent on the quality of the resection surgery and the number of resected nodes. Ideally, risk stratification among early-stage patients would be based on clinical and pathologic factors. This to administer adjuvant chemotherapy to stage I, high-risk-of-relapse patients and spare low-risk individuals from treatment toxicity [22] (except stage IB with > 4cm diameter). Current standard practices offer adjuvant chemotherapy to patients with resected Stage IB to III NSCLC who have a good performance status (adjuvant chemotherapy improves overall survival in such patients [23]). A meta-analysis on 4,584 patients with completely resected NSCLC from five studies (ALPI, IALT, BLT, JBR10 and ANITA) shows that survival benefit of adjuvant treatment is limited to cisplatin-based chemotherapy in completely resected fit stage II-III patients (5 at 5 years) [24].
Machine learning’s impact on improving treatment outcomes requires real-world validation. An analysis of 1,194 patients with NSCLC evaluates the prognostic signatures of quantitative imaging features, extracted with deep learning [25]. In our work, we trained machine learning methods on 1,387 early-stage resected NSCLC patients’ features for prediction with the best model reaching 76 accuracy.
We leverage factors associated with disease relapse, not on those associated only with overall survival. Because relapse analysis censors patients at the time of death without cancer relapse, the impact of non-cancer-related factors is minimized. Unlike survival analysis, we do not predict when relapse occurs, but whether it will happen or not. Our machine learning decision-support system does not rely on patients’ self-assessments.
Our study is limited to a cohort of patients diagnosed and treated in Spain. Such demographic bias may affect applicability in hospitals with different practices. Our models are time-unaware: future work will address time support. It is worth mentioning we had no control on the data collection process and on input data inconsistencies.
Our previous work [4] discussed baseline models that show clear promise for accurate lung cancer recurrence predictions, that are based not on population statistics but on individual features of the patients. We now add graph machine learning and explainable artificial intelligence methods to make sure clinicians make informed decisions when adopting the system in patient follow-ups [1, 2].
Our work would benefit from patient-level molecular data and medical imaging tumour assessment results. Mounting evidence shows that CT image features have high diagnostic and predictive values in clinical pathologic staging of diseases and clinical outcomes [26, 27, 28]. Additionally, previous studies have described the development of gene-expression, protein, and messenger RNA profiles that are associated in some cases with the outcome of lung cancer [29, 30].
5 CONCLUSIONS
We use tabular and graph machine learning for objective and reproducible early-stage NSCLC recurrence. This enables new lung cancer stratification methods based on a personalised relapse risk score.
With further prospective and multi-site validation and the addition of radiological and genomic features to the patient´s profile, this prognostic model can serve as a predictive decision support tool for deciding the use of adjuvant treatments in early-stage lung cancer.
References
- [1] H. Sung, J. Ferlay, R. L. Siegel, M. Laversanne, I. Soerjomataram, A. Jemal, and F. Bray, “Global cancer statistics 2020: GLOBOCAN estimates of incidence and mortality worldwide for 36 cancers in 185 countries,” vol. 71, no. 3, pp. 209–249. [Online]. Available: https://onlinelibrary.wiley.com/doi/10.3322/caac.21660
- [2] “Cancer of the lung and bronchus - cancer stat facts,” accessed on Sep. 29, 2022. [Online]. Available: https://seer.cancer.gov/statfacts/html/lungb.html
- [3] H. Uramoto and F. Tanaka, “Recurrence after surgery in patients with NSCLC,” vol. 3, no. 4, publisher: AME Publishing Company. [Online]. Available: https://tlcr.amegroups.com/article/view/2053
- [4] S. K. M. et al., “On predicting recurrence in early stage non-small cell lung cancer.” [Online]. Available: https://s4.goeshow.com/amia/annual/2021/schedule_at_a_glance.cfm?session_key=CD7CF3B5-38D0-EB11-80EF-D1E7CDE2D2B0&session_date=Tuesday,%20Oct%2026,%202021
- [5] A. Hogan, E. Blomqvist, M. Cochez, C. D’amato, G. D. Melo, C. Gutierrez, S. Kirrane, J. E. L. Gayo, R. Navigli, S. Neumaier, A.-C. N. Ngomo, A. Polleres, S. M. Rashid, A. Rula, L. Schmelzeisen, J. Sequeda, S. Staab, and A. Zimmermann, “Knowledge graphs,” vol. 54, no. 4, pp. 1–37. [Online]. Available: https://dl.acm.org/doi/10.1145/3447772
- [6] X. Wilcke, P. Bloem, and V. de Boer, “The knowledge graph as the default data model for learning on heterogeneous knowledge,” vol. 1, no. 1, pp. 39–57. [Online]. Available: https://www.medra.org/servlet/aliasResolver?alias=iospress&doi=10.3233/DS-170007
- [7] J. Piñero, J. M. Ramírez-Anguita, J. Saüch-Pitarch, F. Ronzano, E. Centeno, F. Sanz, and L. I. Furlong, “The DisGeNET knowledge platform for disease genomics: 2019 update,” p. gkz1021. [Online]. Available: https://academic.oup.com/nar/advance-article/doi/10.1093/nar/gkz1021/5611674
- [8] A. Fabregat, F. Korninger, G. Viteri, K. Sidiropoulos, P. Marin-Garcia, P. Ping, G. Wu, L. Stein, P. D’Eustachio, and H. Hermjakob, “Reactome graph database: Efficient access to complex pathway data,” vol. 14, no. 1, p. e1005968. [Online]. Available: https://dx.plos.org/10.1371/journal.pcbi.1005968
- [9] D. Mendez, A. Gaulton, A. P. Bento, J. Chambers, M. De Veij, E. Félix, M. Magariños, J. Mosquera, P. Mutowo, M. Nowotka, M. Gordillo-Marañón, F. Hunter, L. Junco, G. Mugumbate, M. Rodriguez-Lopez, F. Atkinson, N. Bosc, C. Radoux, A. Segura-Cabrera, A. Hersey, and A. Leach, “ChEMBL: towards direct deposition of bioassay data,” vol. 47, pp. D930–D940. [Online]. Available: https://academic.oup.com/nar/article/47/D1/D930/5162468
- [10] M. G. Zauderer, A. Martin, J. Egger, H. Rizvi, M. Offin, A. Rimner, P. S. Adusumilli, V. W. Rusch, M. G. Kris, J. L. Sauter, M. Ladanyi, and R. Shen, “The use of a next-generation sequencing-derived machine-learning risk-prediction model (OncoCast-MPM) for malignant pleural mesothelioma: a retrospective study,” vol. 3, no. 9, pp. e565–e576. [Online]. Available: https://linkinghub.elsevier.com/retrieve/pii/S2589750021001047
- [11] G. Corredor, X. Wang, Y. Zhou, C. Lu, P. Fu, K. Syrigos, D. L. Rimm, M. Yang, E. Romero, K. A. Schalper, V. Velcheti, and A. Madabhushi, “Spatial architecture and arrangement of tumor-infiltrating lymphocytes for predicting likelihood of recurrence in early-stage non–small cell lung cancer,” vol. 25, no. 5, pp. 1526–1534. [Online]. Available: https://aacrjournals.org/clincancerres/article/25/5/1526/82264/Spatial-Architecture-and-Arrangement-of-Tumor
- [12] E. Huynh, T. P. Coroller, V. Narayan, V. Agrawal, J. Romano, I. Franco, C. Parmar, Y. Hou, R. H. Mak, and H. J. W. L. Aerts, “Associations of radiomic data extracted from static and respiratory-gated CT scans with disease recurrence in lung cancer patients treated with SBRT,” vol. 12, no. 1, p. e0169172. [Online]. Available: https://dx.plos.org/10.1371/journal.pone.0169172
- [13] X. Wang, A. Janowczyk, Y. Zhou, R. Thawani, P. Fu, K. Schalper, V. Velcheti, and A. Madabhushi, “Prediction of recurrence in early stage non-small cell lung cancer using computer extracted nuclear features from digital h&e images,” vol. 7, no. 1, p. 13543. [Online]. Available: http://www.nature.com/articles/s41598-017-13773-7
- [14] B. Lee, S. H. Chun, J. H. Hong, I. S. Woo, S. Kim, J. W. Jeong, J. J. Kim, H. W. Lee, S. J. Na, K. S. Beck, B. Gil, S. Park, H. J. An, and Y. H. Ko, “DeepBTS: Prediction of recurrence-free survival of non-small cell lung cancer using a time-binned deep neural network,” vol. 10, p. 1952. [Online]. Available: https://www.ncbi.nlm.nih.gov/pmc/articles/PMC7005286/
- [15] T. Lacroix, N. Usunier, and G. Obozinski, “Canonical tensor decomposition for knowledge base completion,” in Proceedings of the 35th International Conference on Machine Learning. PMLR, pp. 2863–2872, ISSN: 2640-3498. [Online]. Available: https://proceedings.mlr.press/v80/lacroix18a.html
- [16] L. Costabello, N. McCarthy, P. Tabacof, R. McGrath, C. L. Van, A. Janik, C. Clauss, and A. Alto, “Accenture/AmpliGraph: AmpliGraph 1.4.0.” [Online]. Available: https://zenodo.org/record/2595043
- [17] S. M. Lundberg and S.-I. Lee, “A unified approach to interpreting model predictions,” in Proceedings of the 31st International Conference on Neural Information Processing Systems, ser. NIPS’17. Curran Associates Inc., pp. 4768–4777.
- [18] M. Provencio, E. Carcereny, D. Rodríguez-Abreu, R. López-Castro, M. Guirado, C. Camps, J. Bosch-Barrera, R. García-Campelo, A. L. Ortega-Granados, J. L. González-Larriba, J. Casal-Rubio, M. Domine, B. Massutí, M. A. Sala, R. Bernabé, J. Oramas, and E. del Barco, “Lung cancer in spain: information from the thoracic tumors registry (TTR study),” vol. 8, no. 4, pp. 461–475. [Online]. Available: http://tlcr.amegroups.com/article/view/31045/22129
- [19] D. H. Harpole, J. E. Herndon, W. G. Wolfe, J. D. Iglehart, and J. R. Marks, “A prognostic model of recurrence and death in stage i non-small cell lung cancer utilizing presentation, histopathology, and oncoprotein expression,” vol. 55, no. 1, pp. 51–56.
- [20] S. B. Edge and C. C. Compton, “The american joint committee on cancer: the 7th edition of the AJCC cancer staging manual and the future of TNM,” vol. 17, no. 6, pp. 1471–1474.
- [21] Y. Xie, W.-Y. Meng, R.-Z. Li, Y.-W. Wang, X. Qian, C. Chan, Z.-F. Yu, X.-X. Fan, H.-D. Pan, C. Xie, Q.-B. Wu, P.-Y. Yan, L. Liu, Y.-J. Tang, X.-J. Yao, M.-F. Wang, and E. L.-H. Leung, “Early lung cancer diagnostic biomarker discovery by machine learning methods,” vol. 14, no. 1, p. 100907. [Online]. Available: https://linkinghub.elsevier.com/retrieve/pii/S1936523320303995
- [22] C.-F. Wu, J.-Y. Fu, C.-J. Yeh, Y.-H. Liu, M.-J. Hsieh, Y.-C. Wu, C.-Y. Wu, Y.-H. Tsai, and W.-C. Chou, “Recurrence risk factors analysis for stage i non-small cell lung cancer,” vol. 94, no. 32, p. e1337. [Online]. Available: https://journals.lww.com/00005792-201508020-00041
- [23] B. Goodgame, A. Viswanathan, C. R. Miller, F. Gao, B. Meyers, R. J. Battafarano, A. Patterson, J. Cooper, T. J. Guthrie, J. Bradley, G. Pillot, and R. Govindan, “A clinical model to estimate recurrence risk in resected stage i non-small cell lung cancer,” vol. 31, no. 1, pp. 22–28. [Online]. Available: https://journals.lww.com/00000421-200802000-00004
- [24] J.-P. Pignon, H. Tribodet, G. V. Scagliotti, J.-Y. Douillard, F. A. Shepherd, R. J. Stephens, A. Dunant, V. Torri, R. Rosell, L. Seymour, S. G. Spiro, E. Rolland, R. Fossati, D. Aubert, K. Ding, D. Waller, and T. Le Chevalier, “Lung adjuvant cisplatin evaluation: A pooled analysis by the LACE collaborative group,” vol. 26, no. 21, pp. 3552–3559. [Online]. Available: https://ascopubs.org/doi/10.1200/JCO.2007.13.9030
- [25] A. Hosny, C. Parmar, T. P. Coroller, P. Grossmann, R. Zeleznik, A. Kumar, J. Bussink, R. J. Gillies, R. H. Mak, and H. J. W. L. Aerts, “Deep learning for lung cancer prognostication: A retrospective multi-cohort radiomics study,” vol. 15, no. 11, p. e1002711. [Online]. Available: https://dx.plos.org/10.1371/journal.pmed.1002711
- [26] W. Yu, C. Tang, B. P. Hobbs, X. Li, E. J. Koay, I. I. Wistuba, B. Sepesi, C. Behrens, J. Rodriguez Canales, E. R. Parra Cuentas, J. J. Erasmus, L. E. Court, and J. Y. Chang, “Development and validation of a predictive radiomics model for clinical outcomes in stage i non-small cell lung cancer,” vol. 102, no. 4, pp. 1090–1097.
- [27] R. Thawani, M. McLane, N. Beig, S. Ghose, P. Prasanna, V. Velcheti, and A. Madabhushi, “Radiomics and radiogenomics in lung cancer: A review for the clinician,” vol. 115, pp. 34–41.
- [28] W. Yu, C. Tang, B. P. Hobbs, X. Li, E. J. Koay, I. I. Wistuba, B. Sepesi, C. Behrens, J. Rodriguez Canales, E. R. Parra Cuentas, J. J. Erasmus, L. E. Court, and J. Y. Chang, “Development and validation of a predictive radiomics model for clinical outcomes in stage i non-small cell lung cancer,” vol. 102, no. 4, pp. 1090–1097.
- [29] A. Aramburu, I. Zudaire, M. J. Pajares, J. Agorreta, A. Orta, M. D. Lozano, A. Gúrpide, J. Gómez-Román, J. A. Martinez-Climent, J. Jassem, M. Skrzypski, M. Suraokar, C. Behrens, I. I. Wistuba, R. Pio, A. Rubio, and L. M. Montuenga, “Combined clinical and genomic signatures for the prognosis of early stage non-small cell lung cancer based on gene copy number alterations,” vol. 16, p. 752.
- [30] D. Berrar, B. Sturgeon, I. Bradbury, C. S. Downes, and W. Dubitzky, “Survival trees for analyzing clinical outcome in lung adenocarcinomas based on gene expression profiles: identification of neogenin and diacylglycerol kinase alpha expression as critical factors,” vol. 12, no. 5, pp. 534–544.