An investigation of open clusters Berkeley 68 and Stock 20 using CCD UBV and Gaia DR3 data
Abstract
We performed detailed photometric and astrometric analyses of the open star clusters Berkeley 68 and Stock 20. This was based on ground based CCD UBV photometric data complemented by space-based Gaia Data Release 3 (DR3) photometry and astrometry. 198 stars were identified as likely cluster members for Berkeley 68 and 51 for Stock 20. Two-color diagrams were used to derive the reddening and photometric metallicity for each cluster. The reddening for Berkeley 68 is and mag for Stock 20. Photometric metallicity [Fe/H] is dex for Berkeley 68, and dex for Stock 20. Keeping as constant reddening and metallicity, we determined the distance moduli and ages of the clusters through fitting isochrones to the UBV and Gaia based color-magnitude diagrams. Photometric distances are pc for Berkeley 69 and pc for Stock 20. The cluster ages are Gyr and Myr for Berkeley 68 and Stock 20, respectively. Present day mass function slopes were found to be and for Berkeley 68 and Stock 20, respectively. These values are compatible with the value of Salpeter (1955). The relaxation times were estimated as 32.55 Myr and 23.17 Myr for Berkeley 68 and Stock 20, respectively. These times are less than the estimated cluster ages, indicating that both clusters are dynamically relaxed. Orbit integration was carried out only for Berkeley 68 since radial velocity data was not available for Stock 20. Analysis indicated that Berkeley 68 was born outside the solar circle and belongs to the thin-disc component of the Milky Way.
1 Introduction
Compared to globular clusters, open clusters (OCs) are relatively more young and more metal-rich stellar systems which are located toward the Galactic plane. OCs are groupings of stars with similar physical properties. The number of member stars in OCs ranges from a dozen to thousands. These stars form at the same time through the collapse of a molecular cloud (McKee & Ostriker, 2007). Initially these stars are gravitationally bound into the cluster, and hence share common positional and kinematic characteristics. The ages, distances, and chemical compositions of cluster member stars are similar, however the stellar masses are different (Maurya & Joshi, 2020). The study of OC stars through astrometric and photometric observations allows determination of astrometric and astrophysical parameters unavailable to the study of single stars (Dias et al., 2021), partially explaining the interest in these systems. Such analysis helps in understanding the formation, evolution, and dynamics of stars (Lada & Lada, 2003; Portegies Zwart, McMillan, & Gieles, 2010). Moreover, utilizing astrophysical parameters (such as distance, metallicity, and age) together with kinematic properties makes OCs good tracers for investigating formation and evolution of the Galactic disc (Cantat-Gaudin et al., 2020; He, Xu, & Hou, 2021; Hou, 2021).
Identification of cluster member stars is negatively affected by the presence of field stars. Precise determination of cluster parameters requires the accurate separation of cluster members from such field stars. Gaia data releases (Gaia collaboration et al., 2016, 2018, 2021, 2022) have made available astrometric data of unprecedented accuracy111The uncertainties in Gaia DR3 are 0.01-0.02 mas for mag, and reach about 1 mas at mag. The uncertainties of trigonometric parallax () are 0.02-0.07 mas for mag, 0.5 mas for , and reach 1.3 mas for at mag. For sources with mag the proper motion uncertainties are 0.02 – 0.07 mas yr-1, reaching 0.5 mas yr-1 at , and 1.4 mas yr-1 at mag. For sources within mag the -band photometric uncertainties are 0.3 – 1 mmag, increasing to 6 mmag at mag., allowing such separations to be made more accurately (Monteiro & Dias, 2019; Cantat-Gaudin et al., 2018). Many recent studies have made use of Gaia data in membership analyses of stars in the direction of open clusters and to investigate cluster properties (Cantat-Gaudin et al., 2018, 2019; Castro-Ginard et al., 2018, 2019; Bisht et al., 2019, 2020; Liu & Pang, 2019). The third Gaia data release (DR3) was made public on 2022 June 13rd. It contains data on more than 1.5 billion sources, and provides both Gaia early data release 3 (EDR3) and full Gaia DR3 data that span a period of 34 months (between 25 July 2014 and 28 May 2017). The database provides combined radial velocities for about 33.8 million objects down to mag which is two magnitudes fainter than the second Gaia data release (DR2) (Gaia collaboration et al., 2018). The median formal precision of the radial velocities are 1.3 km s-1 at and 6.4 km s-1 at mag (Katz et al., 2022).
In this paper we investigate two open clusters, Berkeley 68 and Stock 20, which are located in the second Galactic quadrant. Since the locations of both clusters are very close to the Galactic plane, they are strongly affected by field stars. Statistical removal of such field contamination is an important part of the project. This study is a continuation of an ongoing research project investigating previously poorly analyzed open clusters in our Galaxy (Yontan et al., 2015, 2019, 2021, 2022; Ak et al., 2016; Banks et al., 2020; Akbulut et al., 2021; Koç et al., 2022). It aims to determine the main parameters of Berkeley 68 and Stock 20 using CCD UBV data together with the most recent database of the Gaia mission.
Berkeley 68 (, , , ) was classified by Ruprecht (1966) as Trumpler type IV2p with a low central stellar concentration. Analysing 2MASS and PPMXL data, Kharchenko et al. (2012) obtained color excesses, age, and proper motion components for the cluster as mag, yr, and (, )=(-5.860, 0.300) mas yr-1 respectively. Cantat-Gaudin et al. (2018) listed member stars for 1,229 open clusters and derived their physical parameters considering Gaia DR2 photometric and astrometric data. For Berkeley 68 they identified 247 members with a membership probability greater than 0.5. The cluster distance was estimated as pc and the proper motion components as (, ) mas yr-1. Liu & Pang (2019) employed Gaia DR2 data within an automatic isochrone fitting scheme, estimating the cluster distance, age, and the proper motion as pc, Gyr, and (, ) mas yr-1. The first detailed CCD photometric study was performed by Maurya & Joshi (2020). They combined these observations with the 2MASS near-IR data (Cutri et al., 2003) and Gaia DR2 astrometry (Gaia collaboration et al., 2018). Maurya & Joshi (2020) estimated the core radius of Berkeley 68 to be arcmin through fitting the radial density profile of King (1962). They also identified 264 member stars based on Gaia DR2 proper motions. Maurya & Joshi (2020) fitted the zero-age main sequence isochrone from Schmidt-Kaler (1982) to the two-color diagram (TCD), deriving values for the and color excesses. The reddening vector was estimated as and the color excess as mag. The cluster age and distance moduli were estimated via joint consideration of the and color-magnitude diagrams (CMDs). Fitting the theoretical isochrones of solar metallicity presented by Marigo et al. (2017) to the CMDs led to the age being calculated as yr and the de-reddened distance modulus as mag. This corresponds to the isochrone distance of the cluster being pc. Cantat-Gaudin et al. (2020) found the age, isochrone distance, and interstellar reddening of Berkeley 68 as Gyr, pc, and mag (which corresponds to a color excess of mag) respectively.
Stock 20 (, , , ) was classified by Ruprecht (1966) as a Trumpler type II2p with medium richness. Kharchenko et al. (2012) presented a catalogue of astrophysical data for 642 galactic open clusters including Stock 20. They considered 2MASS and PPMXL data, applying homogeneous methods and algorithms to obtain the color excess, distance, age, and mean proper motion components of Stock 20 as mag, pc, and yr, and (, )=(-2.56, -3.24) mas yr-1 respectively. Buckner & Froebrich (2013) employed a decontamination procedure to photometry of 378 known OCs (including Stock 20) so as to estimate the density of stars across the cluster bodies, together with a galactic model to determine distances without the use of isochrone fitting. Using this method Buckner & Froebrich (2013) found the distance of the Stock 20 as pc. Cantat-Gaudin et al. (2018) identified 50 stars in the direction of Stock 20 as cluster members, assuming a membership probability estimated as being greater than 0.5, and subsequently calculated the cluster distance as pc together with the proper motion components as (, )=() mas yr-1. Liu & Pang (2019) estimated the distance, age, and proper motion of the cluster as pc, Myr, and (, )=() mas yr-1, respectively. Cantat-Gaudin et al. (2020) found the age, isochrone distance, and interstellar reddening of Stock 20 to be Myr, pc and mag (which corresponds to a color excess of mag), respectively. Also, the fundamental parameters given in the literature are listed in Table 1 for both clusters.
In the current study we determined the membership probability of cluster stars, mean proper motions, and distances of the OCs Berkeley 68 and Stock 20 using with ground-based UBV photometric observations combined with high-precision astrometry and photometry taken from the Gaia DR3 database. We present fundamental parameters, luminosity and mass functions, the dynamical state of mass segregation, and kinematic and galactic orbital parameters of the two clusters.
| Berkeley 68 | ||||||||
|---|---|---|---|---|---|---|---|---|
| [Fe/H] | Ref | |||||||
| (mag) | (mag) | (pc) | (dex) | (Myr) | (mas yr-1) | (mas yr-1) | (km s | |
| 0.67 | 11.492 | 1800 | — | 1300 | -5.860 | +0.300 | — | (1) |
| — | — | — | — | +2.3100.012 | -1.3120.008 | — | (2) | |
| — | — | 3223 | — | — | +2.3100.012 | -1.3120.008 | -20.31 | (3) |
| — | — | 3559608 | — | 145090 | +2.3210.227 | -1.3220.203 | — | (4) |
| 0.445 | 12.65 | 3383 | — | 2100 | +2.3100.012 | -1.3120.008 | — | (5) |
| — | — | 3223 | -0.1830.168 | — | +2.3100.166 | -1.3120.135 | -29.09 | (6) |
| 0.520.04 | 13.70.2 | 2554387 | — | 1800200 | +2.290.37 | -1.290.24 | — | (7) |
| — | — | 3261 | — | 2140 | +2.3100.012 | -1.3120.008 | -63.64 | (8) |
| — | — | 3356225 | — | 1300 | +2.1880.056 | -1.3530.048 | -18.61 | (9) |
| — | 12.65 | 3425540 | — | 2100 | +2.2420.079 | -1.3930.053 | — | (10) |
| 0.670.06 | — | 3027118 | -0.2860.155 | 1900370 | +2.3570.194 | -1.2900.133 | -21.540.99 | (11) |
| 0.5200.032 | 14.000.12 | 3003165 | -0.130.08 | 2400200 | +2.2370.007 | -1.4010.005 | -20.311.86 | (12) |
| Stock 20 | ||||||||
| [Fe/H] | Ref | |||||||
| (mag) | (mag) | (pc) | (dex) | (Myr) | (mas yr-1) | (mas yr-1) | (km s-1) | |
| 0.20 | 10.271 | 1100 | — | 220 | -2.560 | -3.240 | — | (1) |
| — | — | — | — | -3.2370.010 | -1.1240.011 | — | (2) | |
| — | — | 2890309 | — | 81 | -3.1640.258 | -0.9500.308 | — | (4) |
| 0.352 | 12.07 | 2598 | — | 19 | -3.2370.010 | -1.1240.011 | — | (5) |
| — | — | 2674157 | — | 220 | -2.5230.162 | -0.9320.078 | — | (9) |
| — | 12.07 | 2786109 | — | 19 | -3.2090.042 | -1.2170.066 | — | (10) |
| 0.480.01 | — | 2566230 | -0.1000.117 | 133 | -3.2350.072 | -1.1290.083 | — | (11) |
| 0.4000.048 | 13.560.16 | 2911216 | -0.01 0.06 | 5010 | -3.2150.004 | -1.1720.004 | — | (12) |
(1) Kharchenko et al. (2012), (2) Cantat-Gaudin et al. (2018), (3) Soubiran et al. (2018), (4) Liu & Pang (2019), (5) Cantat-Gaudin et al. (2020), (6) Zhong et al. (2020), (7) Maurya & Joshi (2020), (8) Tarricq et al. (2021), (9) Hao et al. (2021), (10) Poggio et al. (2021), (11) Dias et al. (2021), (12) This study
| Filter/Exp, Time (s) | ||||
|---|---|---|---|---|
| Cluster | Obs. Date | |||
| Berkeley 68 | 06-11-2018 | 603 | 66 | 35 |
| 18002 | 6003 | 3603 | ||
| Stock 20 | 08-10-2016 | 902 | 84 | 45 |
| 18002 | 6002 | 3003 | ||
2 Observations
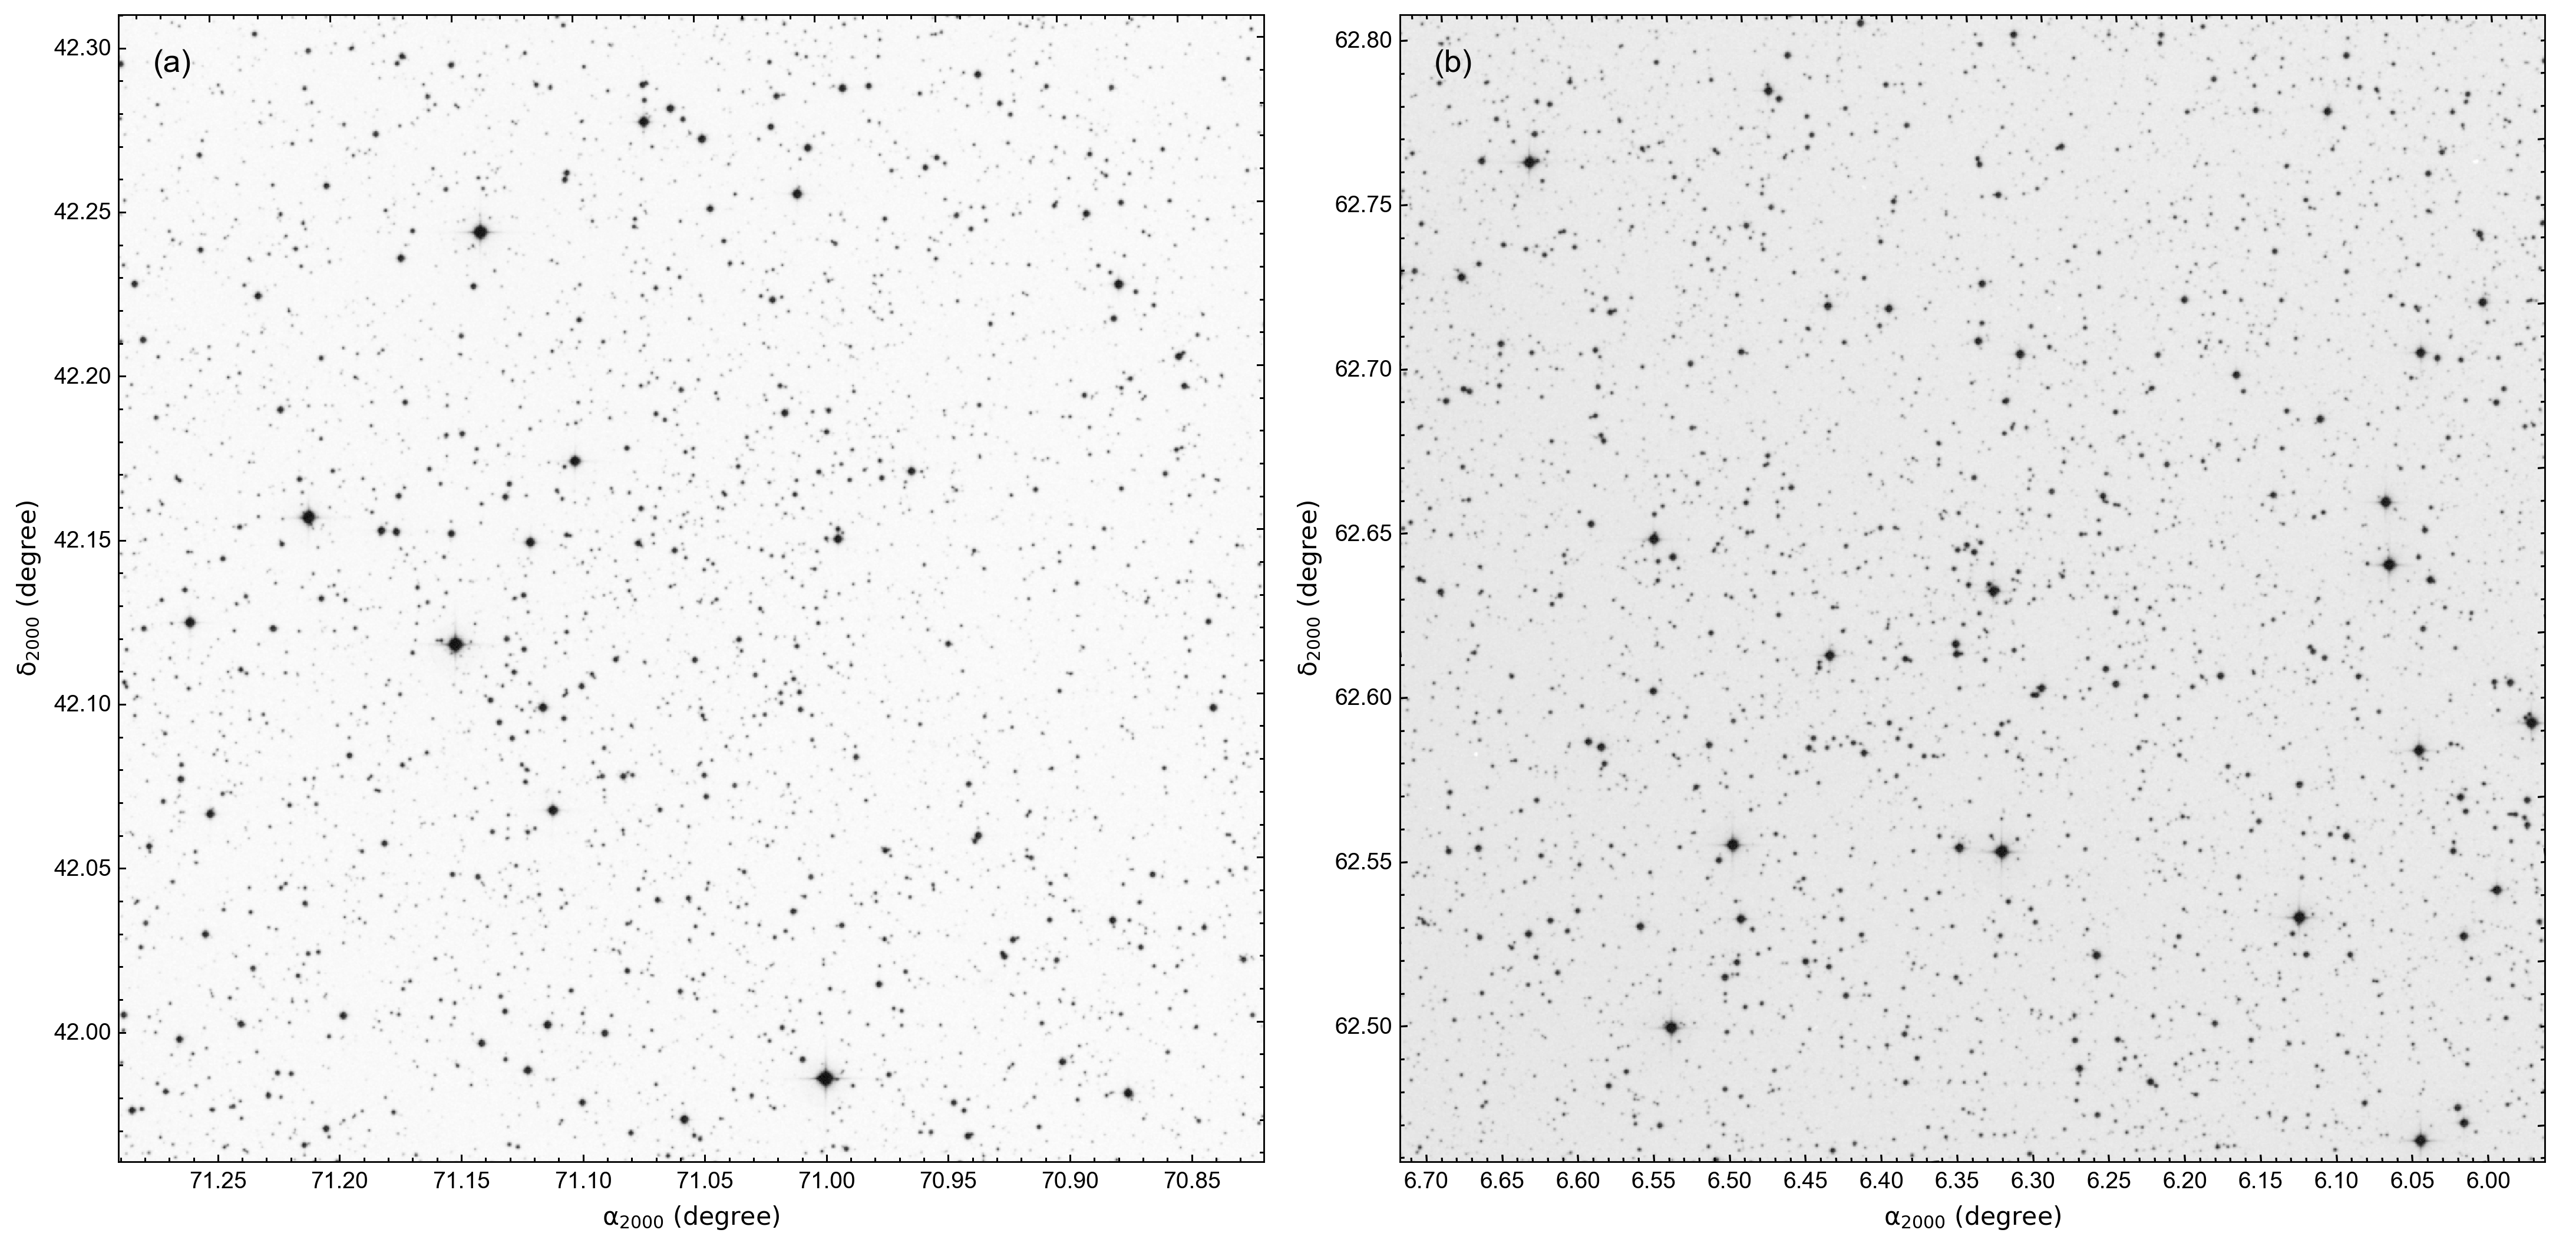
CCD UBV observations of stars located through the cluster regions of Berkeley 68 were made on 2018 November 06 and on 2016 October 08 for Stock 20. We used the T100 100-cm Ritchey-Chrétien telescope at the TÜBİTAK National Observatory (TUG)222www.tug.tubitak.gov.tr in Turkey. Images were taken with a back illuminated 4k4k pixel CCD. The image scale is pixel-1 with a total field of view of . The CCD gain was 0.55 e-/ADU, while readout noise was 4.19 e- (100 KHz). Identification charts are shown in Figure 1 and a log of observations is listed in Table 2. The shorter exposures were to obtain unsaturated images of the brighter stars, while the longer exposures were aimed at collecting good photometry of the fainter stars. Standard stars of Landolt (2009) were observed on the same nights as the two clusters and used for photometric calibration. 16 Landolt regions were observed over an airmass range between 1.23 and 1.90, providing a total of 111 standard stars (see Table 3). Standard bias subtraction and flat fielding procedures inside IRAF333IRAF is distributed by the National Optical Astronomy Observatories were applied to all the raw science images. The instrumental magnitudes of the Landolt (2009) stars were calculated using IRAF’s aperture photometry packages. Applying multiple linear regression fits to these magnitudes led to estimates of the photometric extinction and transformation coefficients for the two observing nights. Derived values were listed in Table 4. For the cluster images, we performed astrometric corrections via PyRAF444PyRAF is a product of the Space Telescope Science Institute, which is operated by AURA for NASA and astrometry.net555http://astrometry.net. Then we measured the instrumental magnitudes of the objects detected in cluster areas using Source Extractor (SExTractor) and PSF Extractor (PSFEx) routines (Bertin & Arnouts, 1996). Aperture corrections were applied to these magnitudes. After this step, we transformed instrumental magnitudes to standard magnitudes considering transformation equations of Janes & Hoq (2011):
| Date | Star Field | |||
|---|---|---|---|---|
| SA92SF3 | 6 | 2 | ||
| SA93 | 4 | 1 | ||
| SA95SF2 | 9 | 1 | ||
| SA97SF1 | 8 | 1 | ||
| 08-10-2016 | SA98 | 19 | 1 | 1.24 – 1.90 |
| SA111 | 5 | 1 | ||
| SA112 | 6 | 2 | ||
| SA113 | 15 | 2 | ||
| SA114 | 5 | 2 | ||
| SA92 | 6 | 1 | ||
| SA93 | 4 | 1 | ||
| SA94 | 2 | 1 | ||
| SA95 | 9 | 1 | ||
| 06-11-2018 | SA96 | 2 | 2 | |
| SA97 | 2 | 2 | ||
| SA98 | 19 | 1 | 1.23 – 1.87 | |
| SA99 | 3 | 1 | ||
| SA110 | 10 | 1 | ||
| SA111 | 5 | 1 | ||
| SA112 | 6 | 1 | ||
| SA114 | 5 | 1 |
| Filter/color index | Obs. Date | ||||
|---|---|---|---|---|---|
| 08.10.2016 | 0.3080.061 | +0.0910.110 | — | — | |
| 0.1510.041 | -0.0030.048 | 0.9000.073 | 1.4440.063 | ||
| 0.1040.018 | — | — | — | ||
| — | — | 0.7540.158 | 3.8070.089 | ||
| — | — | 0.0680.009 | 1.3910.027 | ||
| 06.11.2018 | 0.5210.062 | -0.1220.069 | — | — | |
| 0.2270.046 | -0.0210.052 | 0.9320.077 | 1.5120.068 | ||
| 0.1240.018 | — | — | — | ||
| — | — | 0.9870.102 | 3.7180.093 | ||
| — | — | 0.0730.007 | 1.5700.028 |
| (1) |
| (2) |
| (3) |
In equations (1-3) , , and are the magnitudes in the standard photometric system. , , and indicate the instrumental magnitudes. is the airmass. and represent primary and secondary extinction coefficients. and are transformation coefficients to the standard system.
3 Data Analysis
3.1 Photometric data
We constructed UBV photometric, Gaia DR3 photometric, and astrometric catalogues for the detected stars in the direction of Berkeley 68 (3,548 stars) and Stock 20 (2,866 stars). Both of catalogues are available electronically666The complete tables can be obtained from VizieR electronically and contain the following information for the detected stars: IDs, positions (), -based apparent magnitudes and color indices (, ), Gaia DR3-based apparent magnitudes and color index (), proper motion components () along with trigonometric parallaxes (), and membership probabilities () as calculated in this study (Table 5). Inaccuracies for the , , , , magnitudes and color indices were adopted as internal errors. The mean internal photometric errors per magnitude bin in the Johnson and Gaia DR3 filters are listed in Table 6 (on page 6). This table shows that the UBV errors are smaller than 0.2 mag for Berkeley 68, while the errors reach up 0.4 mag in Stock 20 for stars fainter than mag. The Gaia DR3 photometric mean errors are smaller than 0.2 mag for stars down to mag for both clusters.
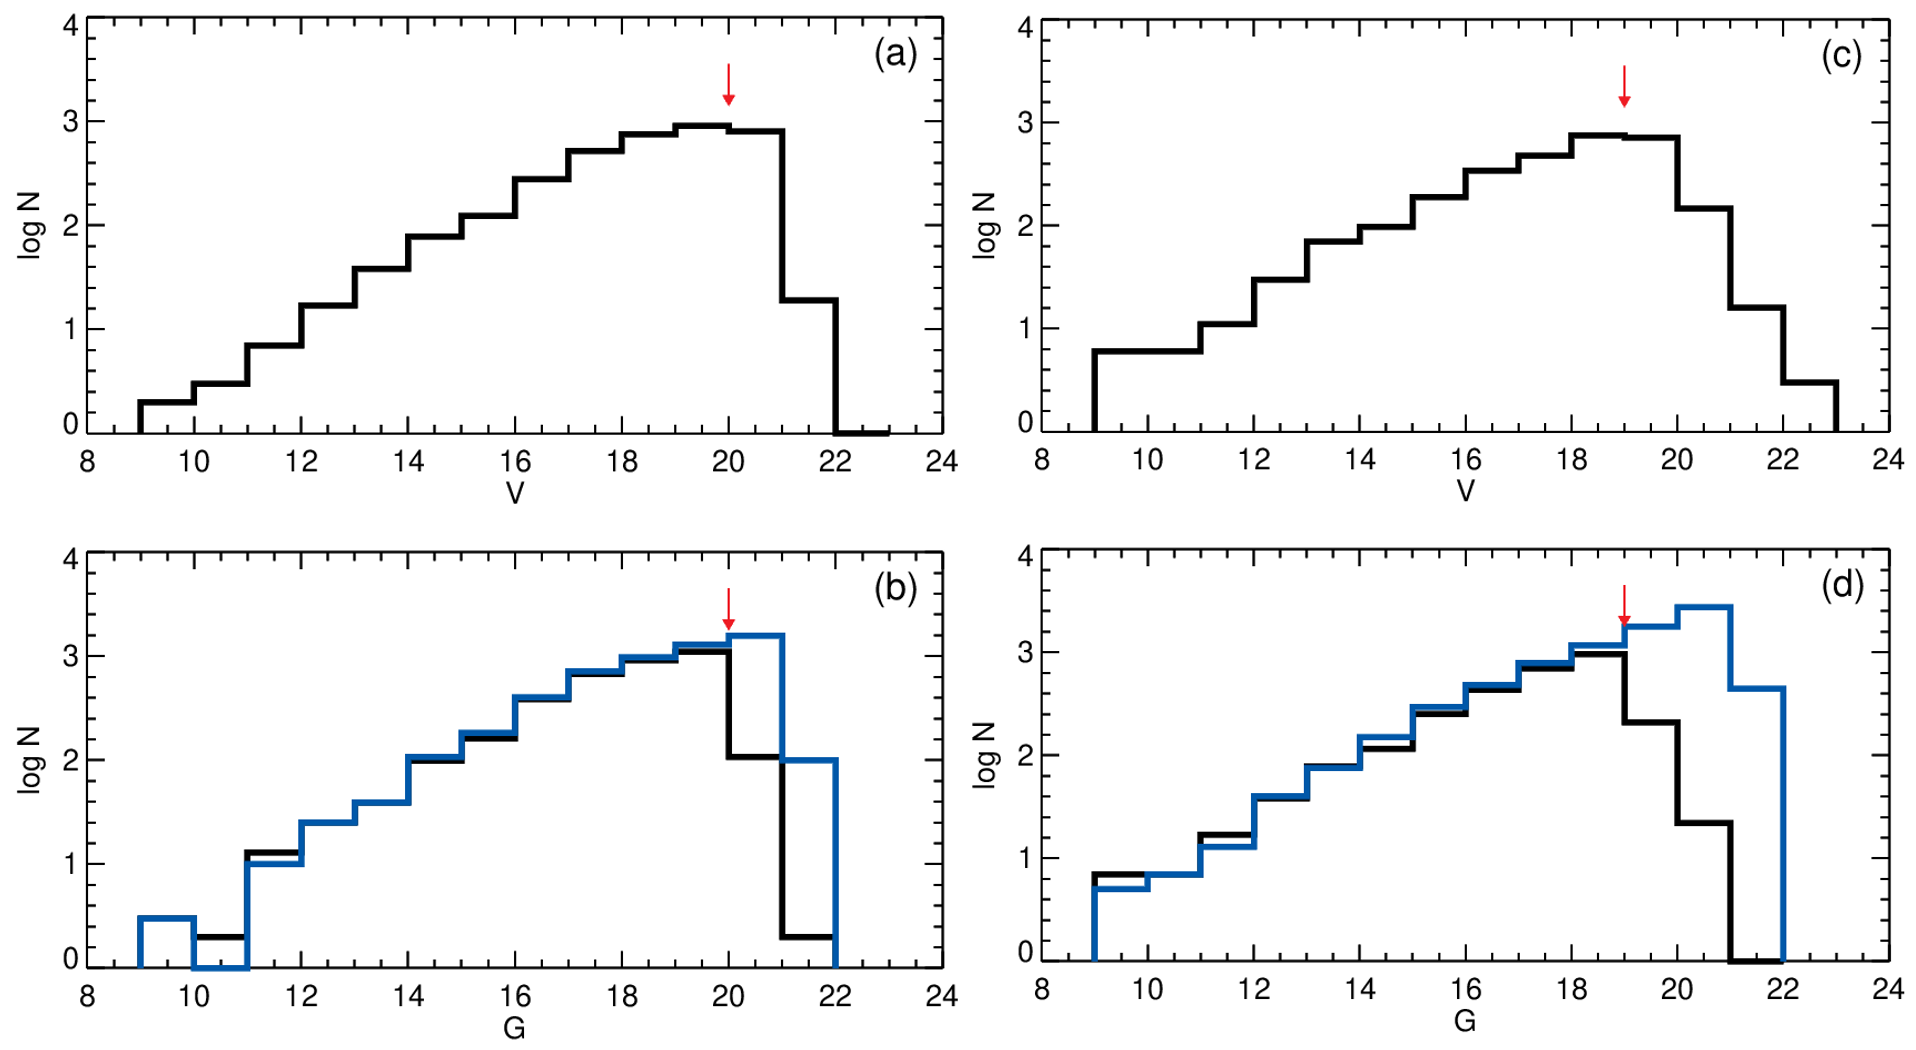
Increasingly faint stars are not always able to be reliably detected in CCD frames. This is described as decreasing completeness of the stellar counts as magnitude increases. The photometric completeness limit is necessary for further analyses investigating a cluster’s luminosity function, mass function, stellar density distribution, etc. To investigate photometric completeness for both clusters, we constructed and magnitude histograms which we then compared with those based on the Gaia DR3 data for the same regions on the sky as the CCD images. In preparing the Gaia DR3 data, we considered central equatorial coordinates presented by Cantat-Gaudin et al. (2020) and limited stellar magnitudes to the range mag. Distributions of all the stellar counts are shown in Fig. 2: the black solid lines indicate the observational stellar distributions by magnitude bin in and , while the blue solid lines (see in Fig. 2b and 2d) show the counts based on Gaia DR3. Figures 2b and 2d demonstrate that the number of stars detected in the study are well aligned with the stellar counts from Gaia DR3 data up to fainter magnitudes adopted as being the completeness limits (the red vertical arrows in Figures 2b and 2d). These limits are mag for Berkeley 68 and mag for Stock 20, which corresponds to mag and mag, respectively. From Figures 2b and 2d, one can see that for magnitudes fainter than the adopted completeness limits, stellar counts decrease the due to the increased crowding of low-mass stars. Different telescope-detector combinations and telescope properties of the ground and space based observations affect the detected stars particularly at fainter magnitudes. This could explain the greater number of detected stars fainter than mag in the Gaia space-based observations.
| Berkeley 68 | |||||||||||
|---|---|---|---|---|---|---|---|---|---|---|---|
| ID | RA | DEC | |||||||||
| (hh:mm:ss.ss) | (dd:mm:ss.ss) | (mag) | (mag) | (mag) | (mag) | (mag) | (mas yr-1) | (mas yr-1) | (mas) | ||
| 0001 | 04:43:31.37 | +42:10:45.82 | 19.531(0.022) | — | 1.013(0.031) | 19.078(0.004) | 1.370(0.067) | 0.895(0.451) | -0.600(0.294) | 0.561(0.343) | 0.00 |
| 0002 | 04:43:31.48 | +42:07:57.25 | 20.536(0.054) | — | 1.526(0.097) | 19.381(0.004) | 2.048(0.088) | -1.624(0.617) | -5.824(0.391) | 1.114(0.472) | 0.00 |
| 0003 | 04:43:31.50 | +42:00:22.73 | 19.561(0.024) | — | 1.072(0.035) | 18.880(0.004) | 1.642(0.047) | -0.140(0.328) | 1.851(0.227) | 0.162(0.255) | 0.00 |
| 0004 | 04:43:31.50 | +42:12:49.47 | 18.189(0.008) | 0.572(0.041) | 1.108(0.012) | 17.887(0.003) | 1.465(0.025) | 0.880(0.163) | 0.414(0.124) | 0.523(0.118) | 0.04 |
| … | … | … | … | … | … | … | … | … | … | … | … |
| … | … | … | … | … | … | … | … | … | … | … | … |
| … | … | … | … | … | … | … | … | … | … | … | … |
| 3545 | 04:45:23.12 | +42:08:49.52 | 19.181(0.016) | — | 1.181(0.024) | 18.558(0.003) | 1.658(0.042) | 1.117(0.208) | -1.758(0.173) | 0.257(0.177) | 0.00 |
| 3546 | 04:45:23.17 | +42:04:39.92 | 19.362(0.018) | — | 1.442(0.030) | 18.718(0.003 | 1.732(0.048) | 0.734(0.313) | -3.046(0.222) | 0.720(0.222) | 0.00 |
| 3547 | 04:45:23.27 | +42:03:11.99 | 20.438(0.046) | — | 1.267(0.071) | 19.767(0.005) | 1.543(0.080) | 1.602(0.553) | -1.178(0.451) | 0.337(0.476) | 0.00 |
| 3548 | 04:45:23.32 | +42:11:02.03 | 19.068(0.014) | 0.591(0.081) | 1.092(0.021) | 18.651(0.003) | 1.475(0.040) | 0.701(0.212) | -1.410(0.184) | 0.537(0.185) | 0.00 |
| Stock 20 | |||||||||||
| ID | RA | DEC | |||||||||
| (hh:mm:ss.ss) | (dd:mm:ss.ss) | (mag) | (mag) | (mag) | (mag) | (mag) | (mas yr-1) | (mas yr-1) | (mas) | ||
| 0001 | 00:23:44.36 | +62:39:25.57 | 18.724(0.015) | 0.666(0.069) | 1.185(0.025) | 18.086(0.003) | 1.768(0.019) | -1.646(0.090) | -0.562(0.099) | 0.237(0.099) | 0.01 |
| 0002 | 00:23:44.65 | +62:42:56.70 | 17.956(0.008) | 0.796(0.041) | 1.212(0.014) | 17.213(0.003) | 1.956(0.017) | -1.380(0.060) | -0.673(0.068) | 0.233(0.061) | 0.00 |
| 0003 | 00:23:44.71 | +62:44:58.57 | 15.917(0.002) | 0.396(0.006) | 0.914(0.003) | 16.340(0.003) | 1.258(0.035) | -5.383(0.080) | -3.671(0.080) | 0.603(0.080) | 0.00 |
| 0004 | 00:23:45.14 | +62:28:14.77 | 22.509(0.436) | — | 0.122(0.505) | 20.623(0.008) | 2.485(0.124) | 3.072(0.882) | -2.728(0.802) | 0.108(0.789) | 0.00 |
| … | … | … | … | … | … | … | … | … | … | … | … |
| … | … | … | … | … | … | … | … | … | … | … | … |
| … | … | … | … | … | … | … | … | … | … | … | … |
| 2863 | 00:26:43.22 | +62:44:26.22 | 20.068(0.047) | — | 0.601(0.061) | 18.890(0.003) | 1.750(0.068) | -1.349(0.151) | -0.258(0.178) | -0.064(0.172) | 0.00 |
| 2864 | 00:26:43.34 | +62:44:48.44 | 18.878(0.017) | 0.596(0.073) | 1.158(0.028) | 18.281(0.003) | 1.593(0.033) | -2.915(0.101) | 0.304(0.112) | 0.223(0.112) | 0.00 |
| 2865 | 00:26:43.57 | +62:38:22.89 | 19.851(0.038) | — | 1.335(0.068) | 19.154(0.004) | 1.728(0.053) | -2.490(0.173) | -1.053(0.211) | 0.087(0.191) | 0.01 |
| 2866 | 00:26:43.67 | +62:46:03.67 | 20.590(0.088) | — | 1.710(0.180) | 19.774(0.004) | 2.155(0.098) | 0.796(0.296) | 0.725(0.308) | -0.105(0.308) | 0.00 |
| Berkeley 68 | Stock 20 | ||||||||||||
|---|---|---|---|---|---|---|---|---|---|---|---|---|---|
| (08, 12] | 12 | 0.002 | 0.002 | 0.002 | 0.004 | 0.005 | (08, 12] | 23 | 0.001 | 0.002 | 0.002 | 0.003 | 0.005 |
| (12, 13] | 17 | 0.003 | 0.004 | 0.004 | 0.003 | 0.005 | (12, 13] | 30 | 0.002 | 0.003 | 0.003 | 0.003 | 0.005 |
| (13, 14] | 38 | 0.005 | 0.005 | 0.006 | 0.003 | 0.006 | (13, 14] | 70 | 0.004 | 0.003 | 0.005 | 0.003 | 0.005 |
| (14, 15] | 78 | 0.002 | 0.005 | 0.002 | 0.003 | 0.005 | (14, 15] | 98 | 0.001 | 0.003 | 0.001 | 0.003 | 0.006 |
| (15, 16] | 124 | 0.002 | 0.006 | 0.002 | 0.003 | 0.006 | (15, 16] | 189 | 0.002 | 0.006 | 0.003 | 0.003 | 0.006 |
| (16, 17] | 277 | 0.002 | 0.010 | 0.004 | 0.003 | 0.007 | (16, 17] | 342 | 0.003 | 0.011 | 0.005 | 0.003 | 0.007 |
| (17, 18] | 518 | 0.005 | 0.021 | 0.007 | 0.003 | 0.012 | (17, 18] | 481 | 0.006 | 0.025 | 0.010 | 0.003 | 0.011 |
| (18, 19] | 753 | 0.009 | 0.045 | 0.014 | 0.003 | 0.026 | (18, 19] | 757 | 0.012 | 0.054 | 0.022 | 0.003 | 0.020 |
| (19, 20] | 909 | 0.020 | 0.068 | 0.033 | 0.004 | 0.054 | (19, 20] | 711 | 0.028 | 0.080 | 0.054 | 0.003 | 0.037 |
| (20, 21] | 802 | 0.042 | 0.080 | 0.071 | 0.005 | 0.099 | (20, 21] | 146 | 0.055 | 0.395 | 0.110 | 0.004 | 0.058 |
| (21, 23] | 20 | 0.090 | — | 0.168 | 0.008 | 0.181 | (21, 23] | 19 | 0.201 | — | 0.353 | 0.012 | 0.189 |
3.2 The Radial Density Profile
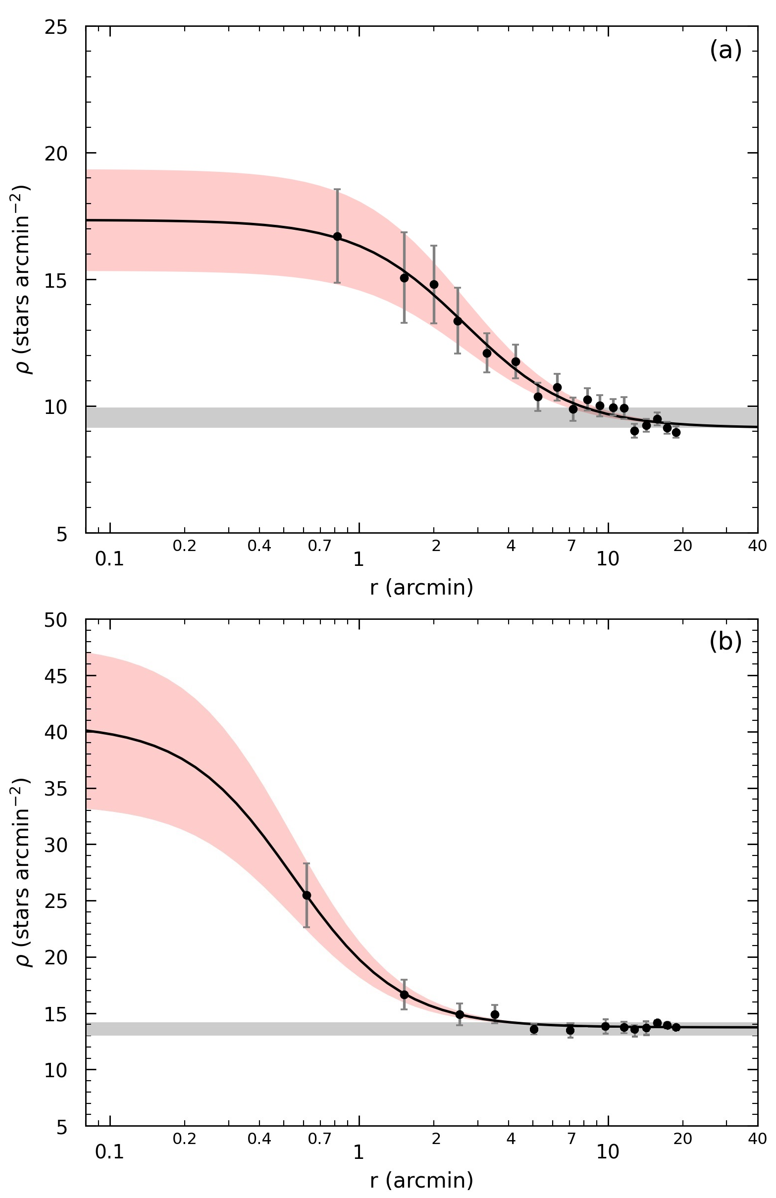
Varying stellar distributions at different magnitudes can affect the spatial analysis of a cluster. We adopted central coordinates as given by Cantat-Gaudin et al. (2020) for both clusters. To construct a radial density profile (RDP) we considered the stars brighter than the photometric completeness limits ( mag for Berkeley 68 and for Stock 20) and estimated the stellar density in a series of concentric rings centered on the cluster centers within equal incremental steps of 1 arcmin. To calculate stellar densities (), we divided star counts in each ring by that ring’s area. The stellar density uncertainties were derived considering Poisson statistics (, where represents the number of stars used in the density estimation). We applied the empirical RDP of King (1962) . Variables , , , and are the radius from the cluster centre, the central density, core radius, and background density. The fitting procedure utilized minimization. Figure 3 shows the stellar density distribution by radius from the cluster centre based on the best fit model to the RDP. The values of the central stellar density and core radius of the clusters, together with the background stellar density, were found to be stars arcmin-2, arcmin, and stars arcmin-2 for Berkeley 68 and stars arcmin-2, arcmin, and stars arcmin-2 for Stock 20. It can be seen in Fig. 3 that the background density (shown by the horizontal grey band) crosses the RDP model at the limiting radius for both clusters. These limiting radii are adopted as ( pc) for Berkeley 68 and ( pc) for Stock 20. For subsequent analyses, we considered only the stars inside these limiting radii.
3.3 CMDs and Cluster Membership
It is important to remove the field star contamination so that subsequent analysis is on likely cluster member stars only. Due to their formation from the same source, open cluster stars share common vectoral movements in the sky. For this reason, study of stellar proper motion components is an important tool to assess cluster membership for these stars (Yadav, Sariya & Sagar, 2013; Bisht et al., 2020). In order to specify membership probabilities of stars, various researchers have set up mathematical models and statistical methods that depend on analyses of stellar proper motion components (Vasilevskis, Klemola, & Preston, 1958; Stetson, 1980; Zhao & He, 1990; Balaguer-Nunez et al., 1998).
In the study, we applied the Unsupervised Photometric Membership Assignment in Stellar Clusters (UPMASK; Krone-Martins & Moitinho, 2014) method and used Gaia DR3 astrometric data to calculate membership probabilities () of stars in the regions of Berkeley 68 and Stock 20. This method was successfully applied in various earlier studies to identify open cluster members (Cantat-Gaudin et al., 2018, 2020; Castro-Ginard et al., 2018, 2019, 2020; Banks et al., 2020; Akbulut et al., 2021; Wang et al., 2022). UPMASK is based on the -means clustering method (where is the number of data clusters) which considers an open stellar cluster as a group of stars which share a similar space in proper motion components and parallaxes. The -means algorithm allows detection of spatially concentrated groups, and hence membership groupings of stars are identified. Best results are typically reached when the -means value is within the range 6 to 25 inclusive. In order to identify likely members of the Berkeley and Stock 20, we utilized UPMASK taking into account five-dimensional astrometric data (, , , , ) and associated uncertainties for each detected star. We ran 100 iterations for both of the clusters to evaluate membership probabilities. We obtained 298 likely member stars for Berkeley 68 and 107 for Stock 20 when we applied the membership probability and the completeness magnitude limit derived above for both clusters (see Section 3.)
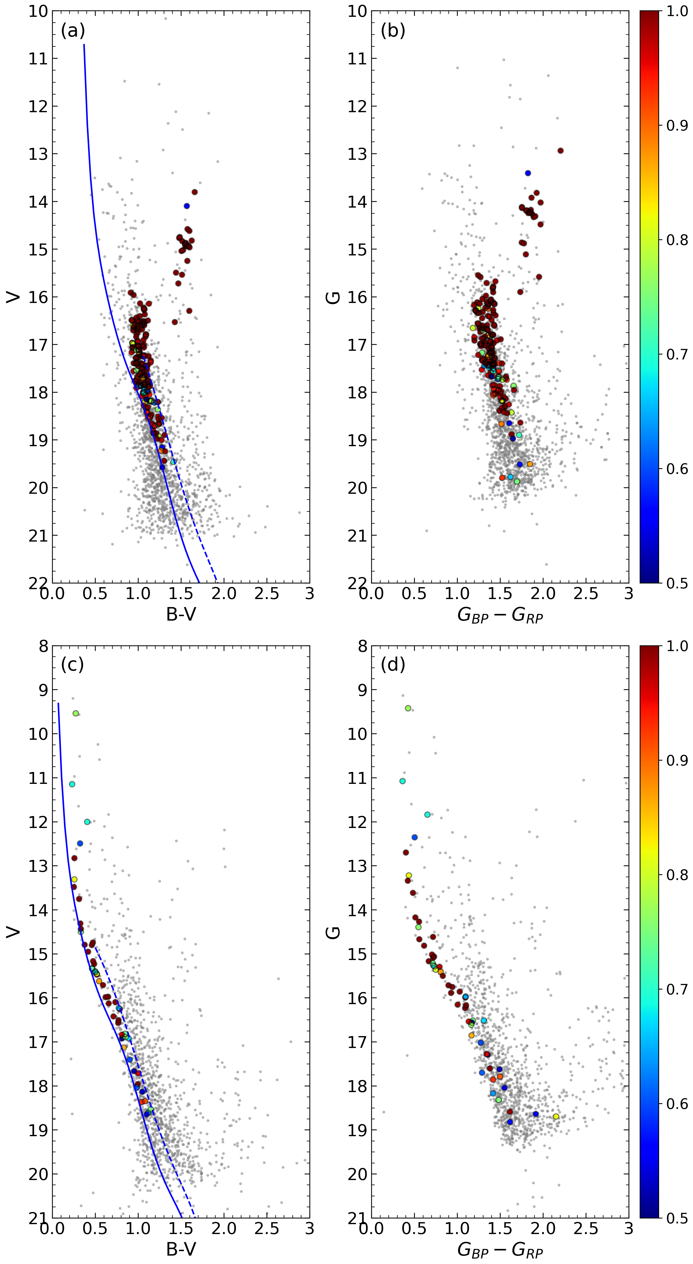
The CMDs of stellar clusters are effective tools for estimating fundamental parameters such as age, distance, reddening etc. They are also helpful for the separation of cluster members from field stars, along with exploring binary-star contamination in cluster main-sequences. Therefore, to eliminate possible ‘contamination’ of the observed main sequence by binary stars in Berkeley 68 and Stock 20, we constructed CMDs from the stars located inside the limiting radii (). Marking most probable cluster members () on the diagrams we fitted a Zero Age Main-Sequence (ZAMS) curve based on Sung et al. (2013) to the CMDs by eye. Reference was made to probable members that are located at the fainter end of the observed cluster main-sequences. To account for main-sequence binary star contamination, we shifted the ZAMS by 0.75 mag towards brighter magnitudes to ensure that we selected the most probable main-sequence, turn-off and giant members of each cluster. Hence, considering the completeness-derived magnitude limits, cluster radii, and ZAMS fitting we derived 198 and 51 ‘physical’ members with the probability for Berkeley 68 and Stock 20, respectively. Only these stars were analysed in the subsequent estimation of astrophysical parameters by the current paper. Using the UPMASK method, Cantat-Gaudin et al. (2020) obtained 200 and 38 member stars with the cluster membership probability greater than and magnitudes brighter than mag for Berkeley 68 and Stock 20, respectively. There is a general sense of agreement between the two studies. In the current study we limited the number of member stars considering both cluster radius and also restricting the MS to stars with a cluster membership probability . These differences are the likely cause for the different stellar counts between the two studies. Figs. 4a (for Berkeley 68) and 4c (for Stock 20) are the diagrams that show the distribution of field stars and the most probable members for each cluster along with the fitted ZAMS. Figs. 4b (for Berkeley 68) and 4d (for Stock 20) show the location of the most probable cluster members on CMDs.
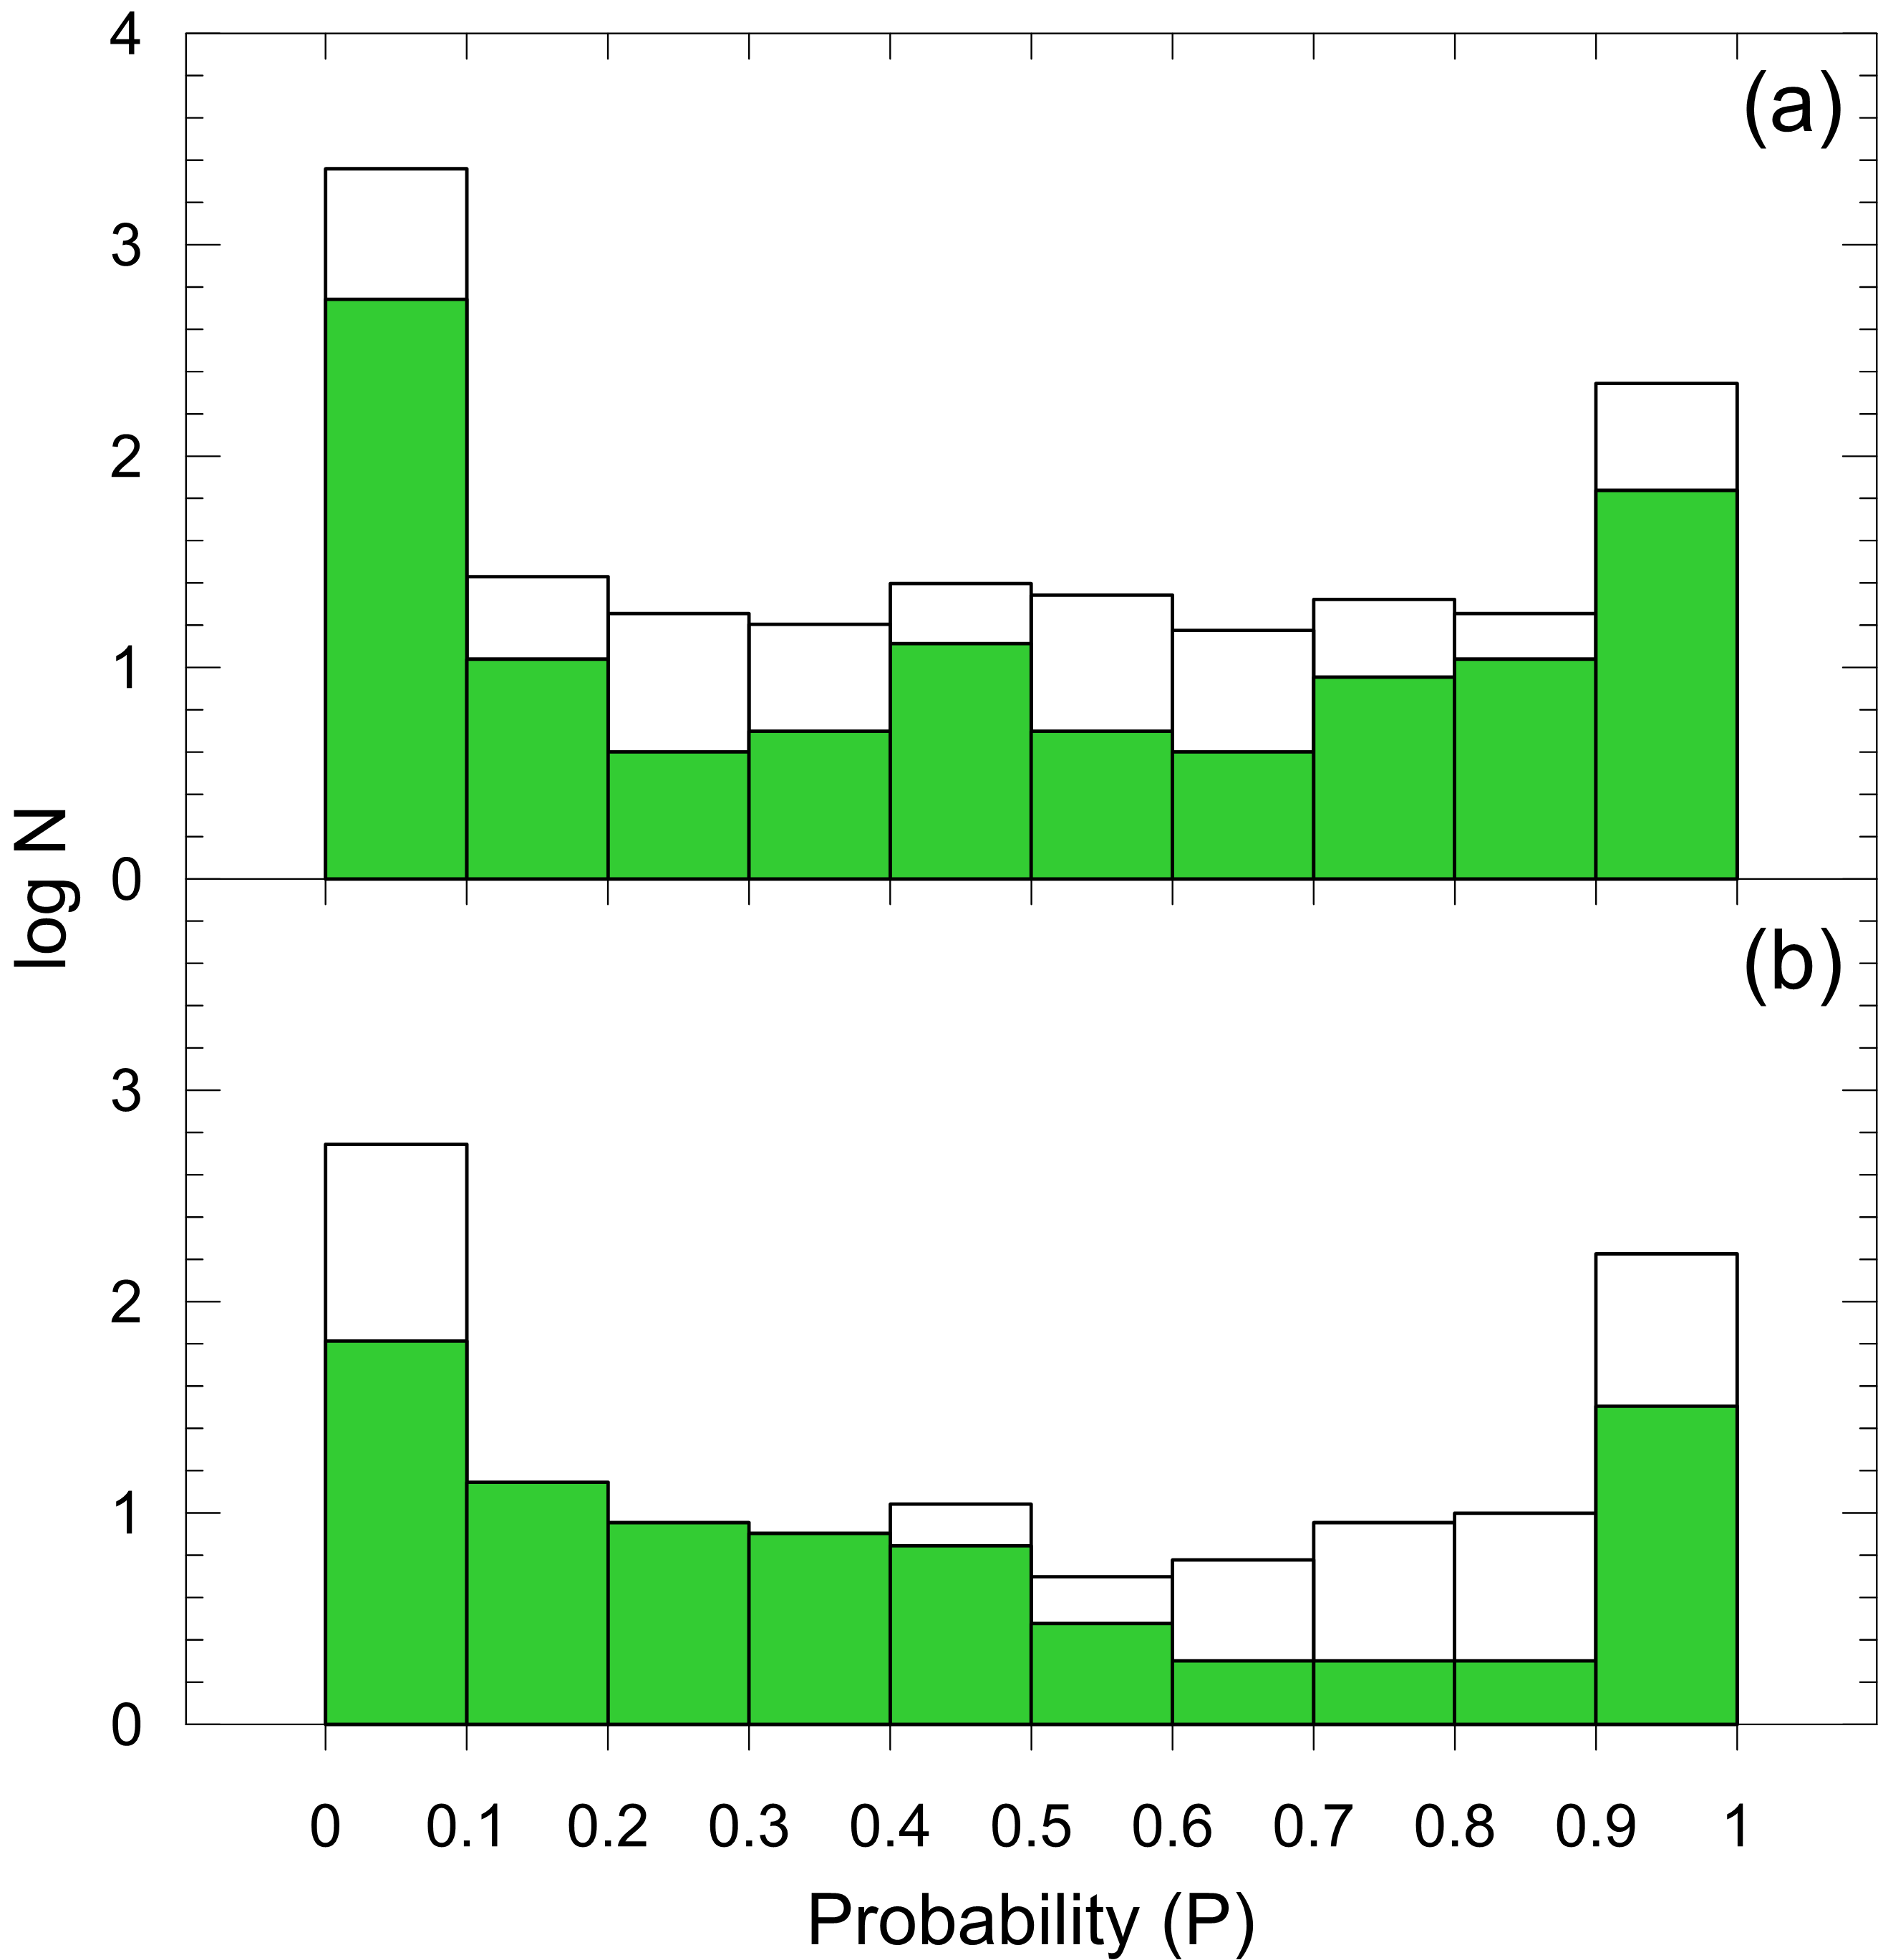
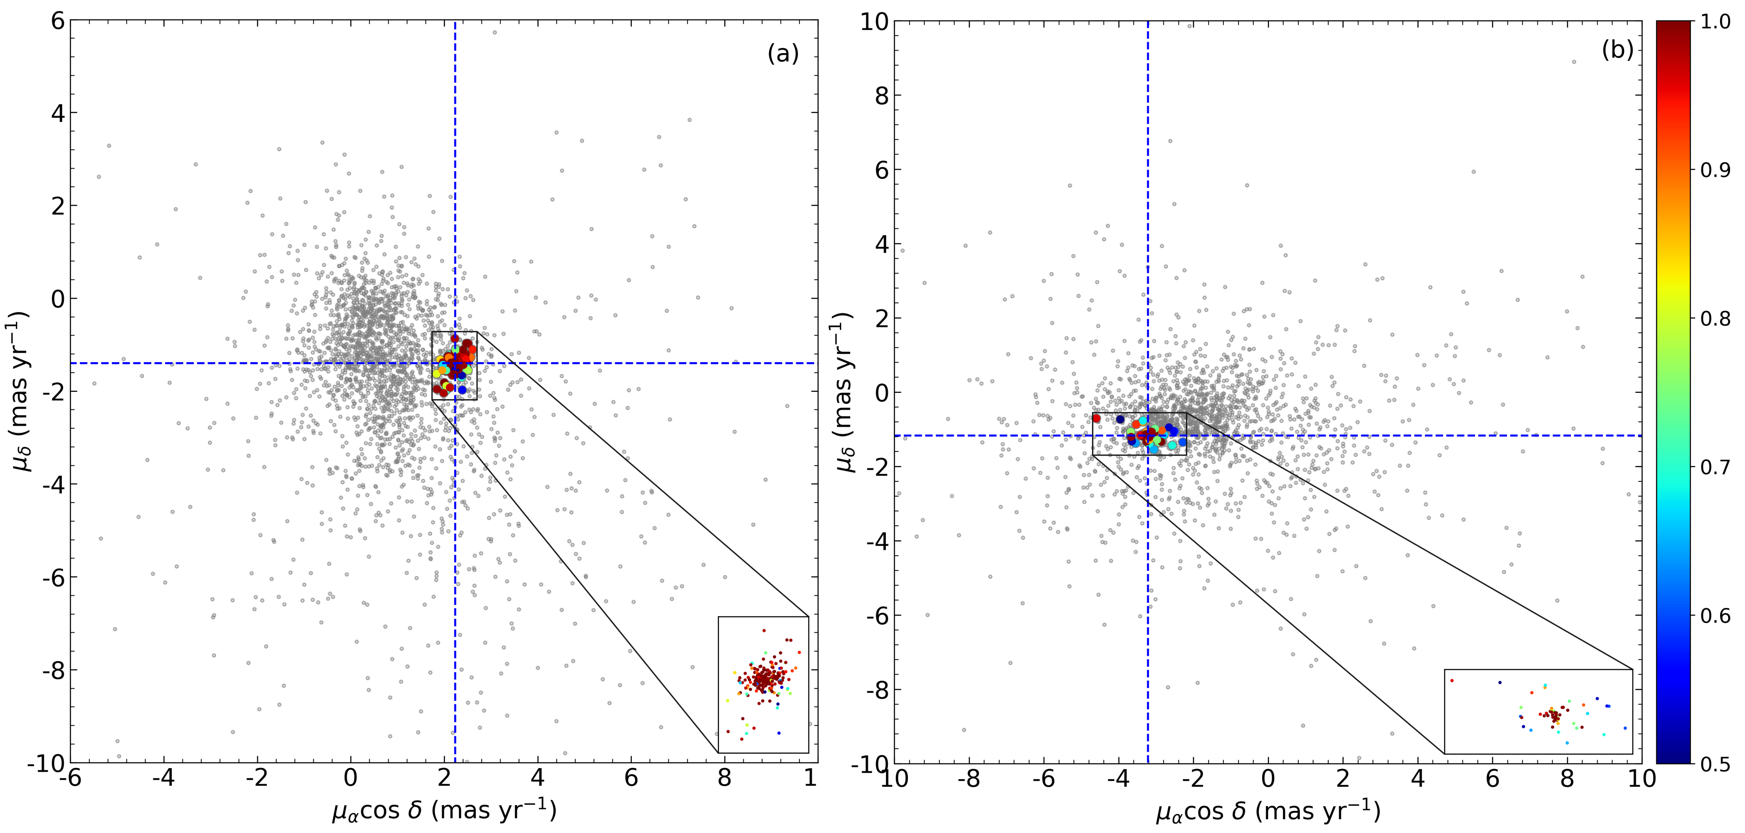
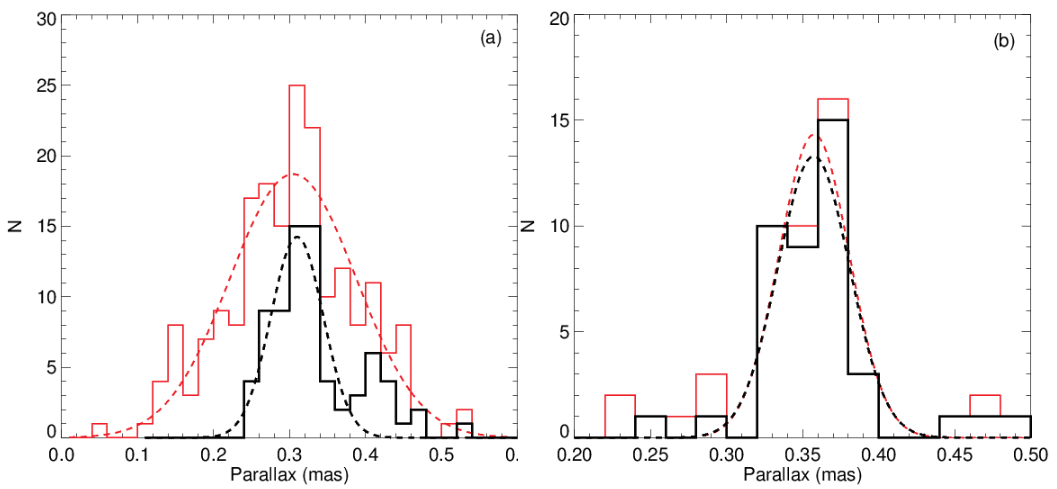
The membership probabilities versus the number of stars detected through the two cluster regions are plotted and presented in Figure 5. To picture the positions of most probable member stars in each cluster we plotted vector-point diagrams (VPDs), shown as Fig. 6. It can be seen in the figure that Berkeley 68 (Fig. 6a) is more distinctly separated from field stars than Stock 20 is (Fig. 6b). In Fig. 6, the blue dashed lines indicate the mean proper motion values calculated from the most probable cluster members. These values were estimated as (, )=(, ) mas yr-1 for Berkeley 68 and (, )=(, ) mas yr-1 for Stock 20. Mean proper motion component values calculated in the current study are compatible with the results of all studies performed with Gaia observations for the two clusters (see Table 1). To calculate mean trigonometric parallaxes of each cluster, we constructed the parallax histogram considering most probable cluster members and applied the Gaussian fit to the distribution (Fig. 7). During the calculation of , we considered the stars with a relative parallax error of less than 0.2 to minimize uncertainties. We obtained the mean of Berkeley 68 as mas and mas for Stock 20. We also applied the linear equation of (mas) to the mean trigonometric parallaxes and obtained parallax distances as pc and pc for Berkeley 68 and Stock 20, respectively. To compare results, we calculated trigonometric parallaxes without limiting the relative parallax error values and obtained mean as mas and mas for Berkeley 68 and Stock 20. It can be observed from the results that the uncertainty of for Berkeley 68 is getting larger when we consider all relative parallax errors, whereas the results do not change for Stock 20. In Fig. 7 red histograms and red dashed lines show the distribution of the most probable stars that were selected without limiting the relative parallax error and Gaussian fit, respectively, whereas the black solid lines present the histograms of stars with relative parallax error of less than 0.2. Gaussian fits are shown with black dashed lines.
4 Astrophysical Parameters of the Clusters
This section summarizes the procedures for the astrophysical analyses of Berkeley 68 and Stock 20. We determined the reddening and photometric metallicities separately using the two-color diagrams (TCDs). Keeping these two parameters as constant, we obtained the distance moduli and age of the clusters on CMDs simultaneously (for detailed descriptions on the methodology see Yontan et al., 2015, 2019, 2021, 2022; Ak et al., 2016; Bilir et al., 2006, 2010, 2016; Bostancı et al., 2015, 2018).
4.1 Reddening
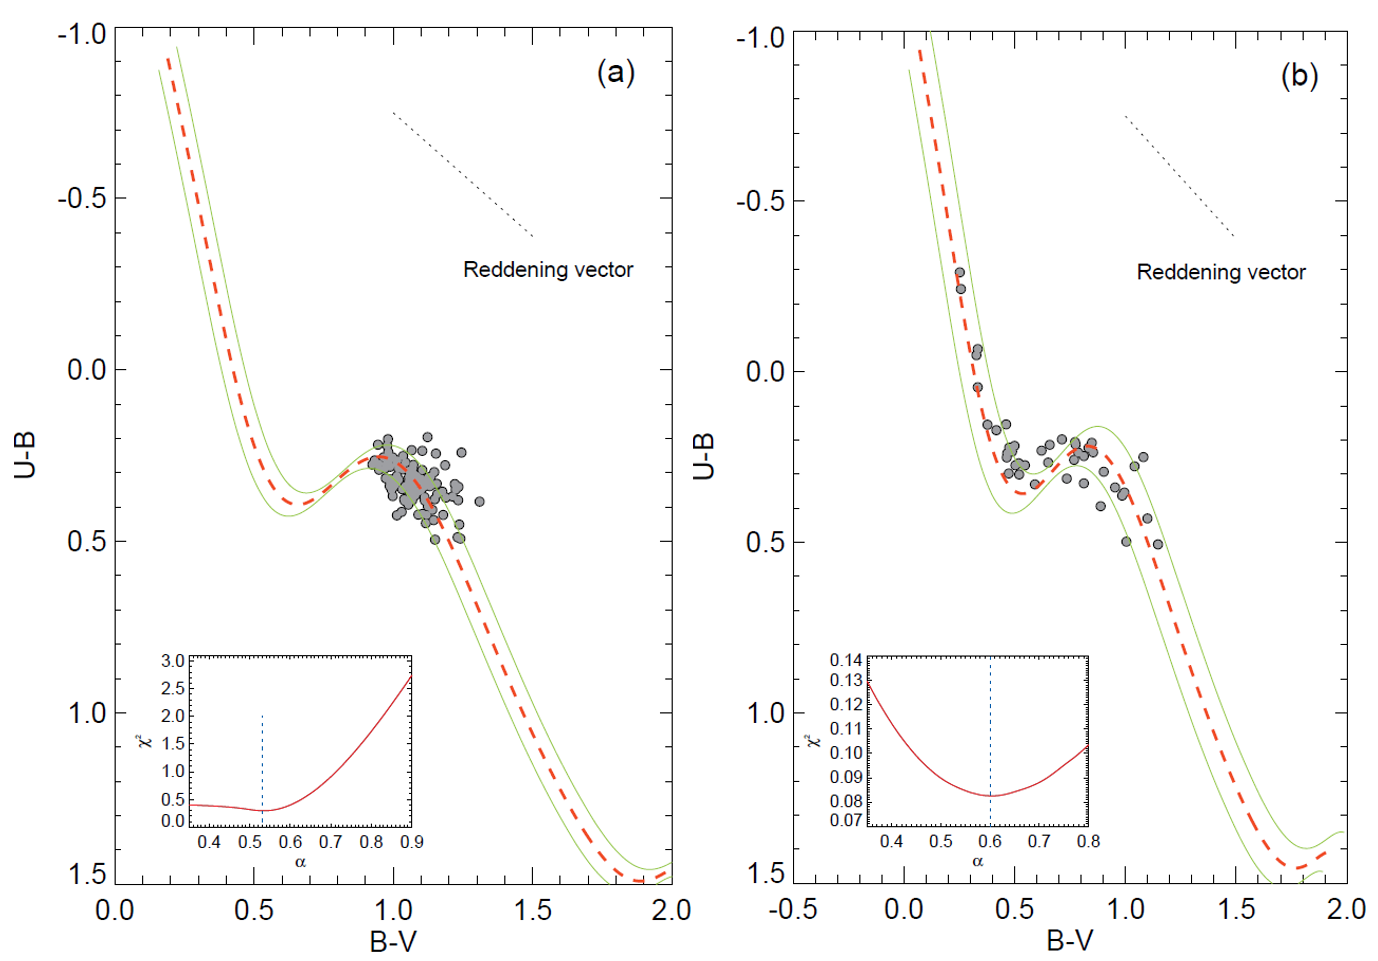
The separate estimation of the reddening in the direction of the cluster is important to obtain the precise age and distance of the studied cluster. In this study we used TCDs to determine color excesses across each cluster. To do this, we selected the most probable main-sequence stars () within the magnitude ranges for Berkeley 68 and mag for Stock 20. We constructed diagrams of the most probable member stars and fitted the intrinsic solar-metallicity ZAMS of Sung et al. (2013) to these. For and , the ZAMS was shifted along different values of the reddening vector utilizing minimization analyses. In the case of Berkeley 68, the best solution of minimum corresponds to the reddening vector being and the color excess mag. For Stock 20 the best values were for the reddening vector and mag for the color excess. In Fig. 8, we present the TCDs with the best results. The derived errors for the color excesses are the deviations. The estimated color excess for Berkeley 68 is in good agreement with the value mag given by Maurya & Joshi (2020). It is slightly lower than mag estimated by Kharchenko et al. (2012) and greater than the mag of Cantat-Gaudin et al. (2020). Moreover, the derived color excesses for Stock 20 agrees well with the and mag given by Cantat-Gaudin et al. (2020) and Dias et al. (2021), respectively, whereas it is higher than the value of mag represented by Kharchenko et al. (2012) (see Table 1 for detailed comparison).
4.2 Photometric Metallicity
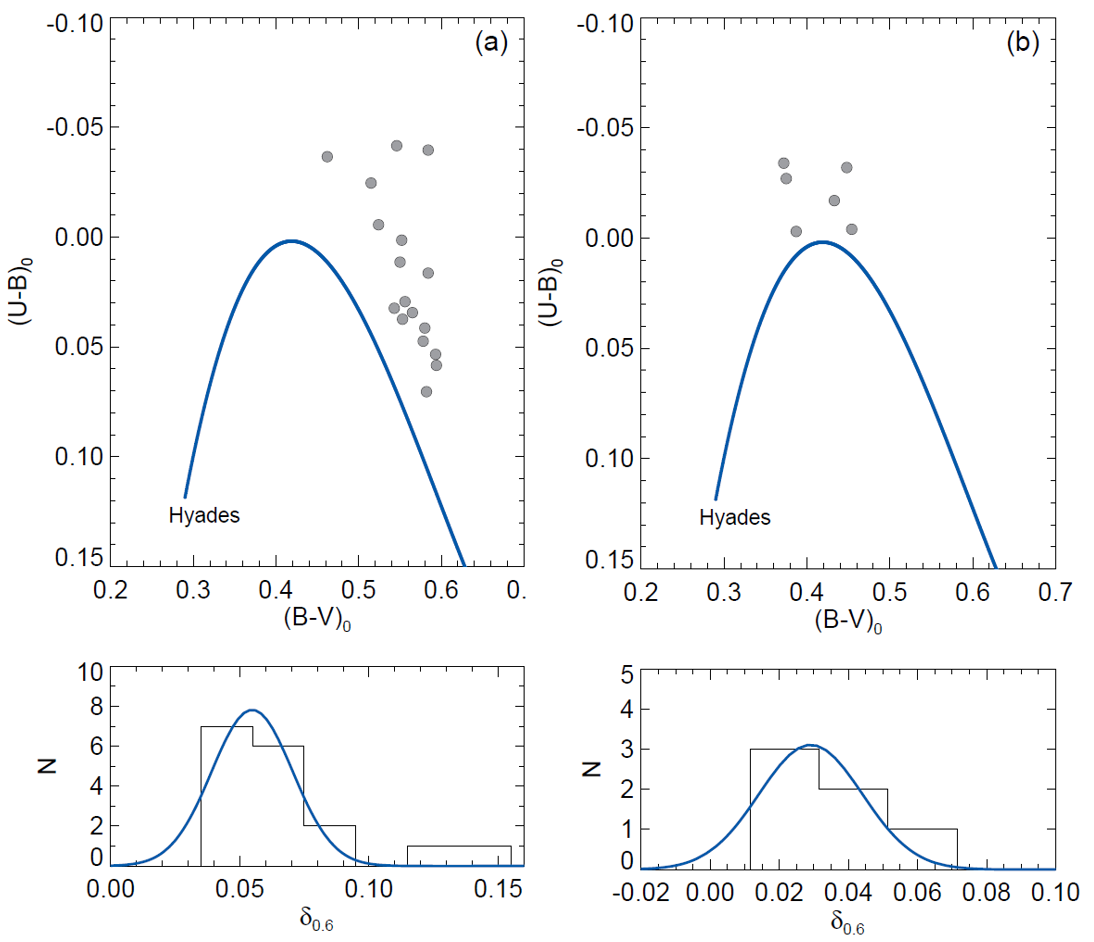
Applying Karaali et al. (2011)’s method to the TCDs of Berkeley 68 and Stock 20, the photometric metallicity [Fe/H] was determined using the mean UV-excess () of the most probable () F- and G-type main-sequence stars within the color index of mag (Eker et al., 2018, 2020). We calculated de-reddened and colors of most probable main-sequence stars and limited their color to the range to select F- and G- type main-sequence stars for the analyses. This resulted in the selection of 17 stars for Berkeley 68 and 6 stars for Stock 20. We plotted the TCDs for the selected stars and the Hyades main-sequence to compare colors of the data sets with the same de-reddened color and calculate the differences between the color indices. These differences are defined as UV-excess () which is given by the equation , where H and S subscripts represent the Hyades and cluster stars respectively.
To employ the method detailed in Karaali et al. (2011), we normalised the derived UV-excess of the selected F-G type stars to the UV-excess at mag (i.e. ) and calculated the mean via fitting Gaussians to the constructed histograms (Karaali et al., 2003a, b). The peak of the Gaussian gives the mean value which was determined as mag for Berkeley 68 and mag for Stock 20. Here, the uncertainty of the mean is the standard deviation of the Gaussian fit. The photometric metallicity of studied clusters were determined by evaluating mean value in the equation given by Karaali et al. (2011):
| (4) |
TCDs and histograms of for the selected stars in two clusters are given as Fig. 9. The photometric metallicities estimated from the most likely cluster members are [Fe/H]= for Berkeley 68 and [Fe/H]= dex for Stock 20.
We transformed the photometric metallicity [Fe/H] to the mass fraction for the selection of isochrones and hence age determination. For transformation between the two parameters we used the analytic equations provided by Bovy777https://github.com/jobovy/isodist/blob/master/isodist/Isochrone.py which are developed for parsec isochrones (Bressan et al., 2012). The relevant equations are:
| (5) |
and
| (6) |
Here and are intermediate values where solar metallicity was adopted as 0.0152 (Bressan et al., 2012). We calculated for Berkeley 68 and for Stock 20.
4.3 Distance Moduli and Age Estimation
CMDs were constructed using values for the most probable member stars. The morphology of these CMDs allows identification of the main-sequence, turn-off point, and giant members. It leads to a model-based mass, age, and distance for each star (Bisht et al., 2019). In this study we estimated the distance moduli and age simultaneously by fitting parsec isochrones of Bressan et al. (2012) to the and Gaia based CMDs of the two clusters.
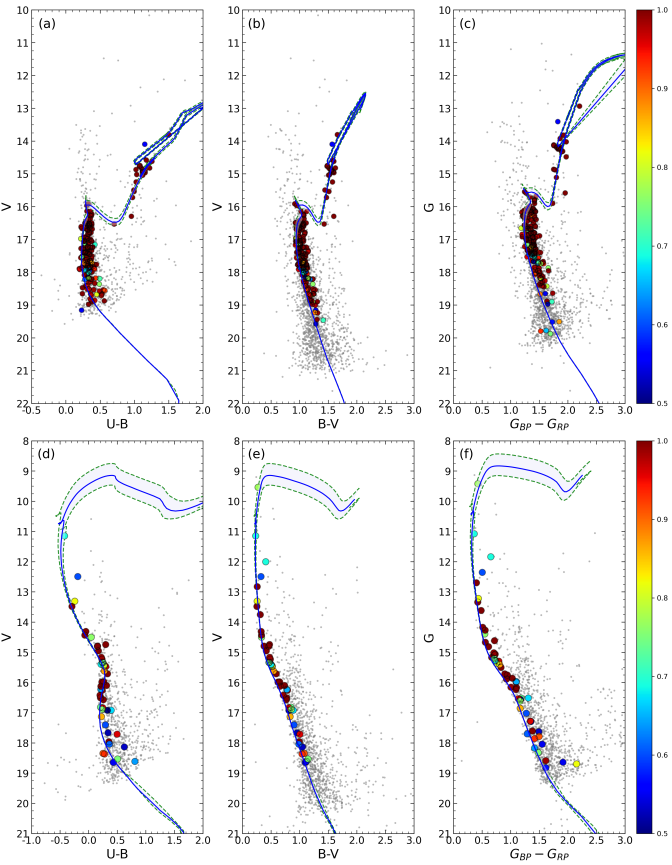
To determine the distance moduli and age of the clusters, we constructed , , and diagrams and visually fitted the isochrones (Bressan et al., 2012) considering the most probable main-sequence, turn-off and giant members (). Parsec isochrones were selected according to the mass fraction obtained above (Section 4.2). The data isochrone fitting procedure made reference to values calculated by this study. For Gaia DR3 data we used the expression presented in the study of Sun et al. (2021). Error estimations for distance moduli and distances considered a relation given by Carraro et al. (2017). Uncertainties in age were determined using low and high age isochrones whose values fitted the observed scatter about the MS. Fig. 10 presents the , and CMDs with best fitting isochrones. The derived distance moduli and ages for the two clusters are given as follow:
-
•
Berkeley 68: Isochrones of different ages ( and 9.41 with ) were superimposed onto the , , and diagrams. Considering only the most probable main-sequence stars, we derived the distance modulus as mag. This leads to the isochrone distance to be pc. If we apply over-weights to the turn-off point and giant member stars of the cluster, the age is estimated as Gyr. The derived isochrone distance is compatible with the values given by Cantat-Gaudin et al. (2018), Tarricq et al. (2021) and Dias et al. (2021) within the errors (see Table 1). The isochrone distance of Berkeley 68 is compatible with the Gaia DR3 trigonometric parallax distance value pc estimated in this study. Also, considering the estimated age and its error in the study, it can be concluded that the value is compatible with the results represented in the studies of Cantat-Gaudin et al. (2018) and Tarricq et al. (2021) (see Table 1 for detailed comparison).
-
•
Stock 20: The same methodology was applied to this cluster, using isochrones for and 7.78 with . The distance modulus is mag, corresponding to an isochrone-based distance of pc. Cluster age is Myr. Because of its young age, we took into account the main-sequence members during distance moduli and age estimation. The derived distance is compatible with the value pc given by Buckner & Froebrich (2013), as well as with the results found by most researches whose results are listed in Table 1. The estimated age of the cluster is lower than the values of Myr of Kharchenko et al. (2012) and Hao et al. (2021), whereas higher than the value Myr of Liu & Pang (2019) (see Table 1 for detailed comparison). The isochrone distance is in good agreement with the value pc obtained by the current study from Gaia DR3 trigonometric parallaxes.
The distances determined from the isochrone fitting for the clusters are similar to those derived from the Gaia DR3 trigonometric parallaxes.
5 Kinematics and Galactic Orbits Parameters
To obtain the galactic orbital parameters for the two clusters, we used the Python language based galactic dynamics library (galpy888See also https://galpy.readthedocs.io/en/v1.5.0/, Bovy, 2015) in which the potential functions are defined. Orbital integrations utilized via MWPotential2014 (Bovy, 2015) which assumes an axisymmetric potential for the Milky Way galaxy. The MWPotential2014 models a three-component model of the Galaxy consisting of bulge, disc, and halo potentials. The bulge component is described as a spherical power-law density profile represented in Bovy (2015). The galactic disc potential is defined by Miyamoto–Nagai expressions (Miyamoto & Nagai, 1975). Considering the spherically symmetric spatial distribution of dark matter in the halo, the halo potential is defined by the Navarro Frank–White profile (Navarro et al., 1996). For orbital analyses we took into account the parameters which are listed for the three components in Bovy (2015, see Table 1 of that paper). The Sun’s galactocentric distance and orbital velocity were taken as kpc and km s-1, respectively (Bovy, 2015; Bovy & Tremaine, 2012). The Sun’s distance from the galactic plane was assumed to be pc (Chen et al., 2000).
For successful integration of the orbit, one of the necessary parameters to know is radial velocity of the clusters. We adopted the radial velocity value for Berkeley 68 cluster as calculated by Soubiran et al. (2018), but did not have a corresponding value for Stock 20. Therefore, we estimated the velocity components and galactic orbital parameters for only Berkeley 68. To do this, we used the MWPotential2014 code with the following inputs: the central equatorial coordinates (, ) adopted from Cantat-Gaudin et al. (2020), the mean proper motion components (, =, mas yr-1) obtained in Section 3.3, isochrone distance ( pc) from Section 4.3, and the radial velocity ( km s-1) given by Soubiran et al. (2018). See also Table 7 on page 7.
We integrated the orbit forwards and backwards in time with 1 Myr steps up to the age 2.5 Gyr in order to estimate its possible current location and birth place. We did not integrate the orbit more than the cluster age given that inaccuracies of the used potentials depend on time and so influence the reliability of the kinematic and dynamic analyses results. Additional errors of the input parameters (proper motion components, distance and radial velocity) will affect the orbit determination, so the results are approximate (Tarricq et al., 2021; Sariya et al., 2021).
Orbital integration resulted in the following estimates for Berkeley 68: apogalactic ( pc) and perigalactic ( pc) distances, eccentricity (), maximum vertical distance from galactic plane ( pc), space velocity components (=, , km s-1), and orbital period ( Myr). Soubiran et al. (2018) used Gaia DR2 (Gaia collaboration et al., 2018) astrometric data, finding the space velocity components of Berkeley 68 to be =(, , km s-1) which is in good agreement with the values calculated in this study. We applied a local standard of rest (LSR) correction to the space velocity components considering the values (, , ) km s-1 of Coşkunoǧlu et al. (2011). The LSR corrected space velocity components are = (, , ) km s-1. Using these LSR corrected space velocities, we calculated the total space velocity as km s-1. This result is agreement for the velocity of young thin-disc stars (Leggett, 1992).
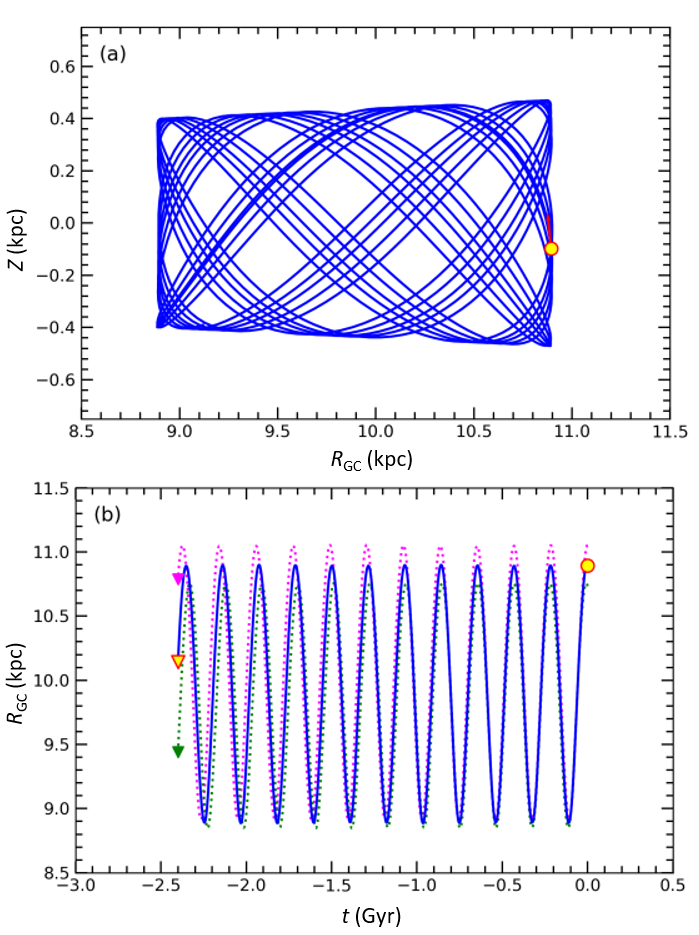
According to the results, Berkeley 68 intersects the galactic plane around eight times during its orbital period, rising up to maximum pc above the galactic plane. This indicates that Berkeley 68 belongs to the thin-disc component of the Galaxy. The orbit of the cluster is slightly eccentric with the value of . The birth radius of the Berkeley 68 is calculated as 10.16 kpc (see Fig. 11b). This radius is outside the solar circle which shows that Berkeley 68 was born in a metal-poor region. Investigating and distances, we can conclude that Berkeley 68 completely orbits outside the solar circle (see Fig. 11a).
Berkeley 68’s orbits on the and planes are represented in Fig. 11. The motion of Berkeley 68 is shown as a function of distance from the galactic center and the galactic plane as the ‘side view’ of Figure 11a. The red arrow shows the direction of motion for Berkeley 68. Yellow filled circles are the present-day location of the cluster (Figs. 11a and 11b), whereas the yellow filled triangle represents the birth position of the cluster (Fig. 11b). Figure 11b represents the distance of the cluster on the galactic plane with time. The pink and green dotted lines show the cluster movement in time when the upper and lower errors in proper motion, radial velocity and distance are considered. The pink and green filled triangles represent the position of the cluster’s birthplace. As can be seen from Fig. 11b, different input parameters can cause the estimated birth locations of clusters to change. In the plane of figure Berkeley 68 has an uncertainty of about 1.5 kpc for its possible birthplace.
We interpreted that the relative errors in and do not exceed 2%, whereas the relative error for parameter is about 7%, which lends us confidence that the orbital solutions are reasonable.
6 Dynamical Study of the Clusters
6.1 Luminosity Functions
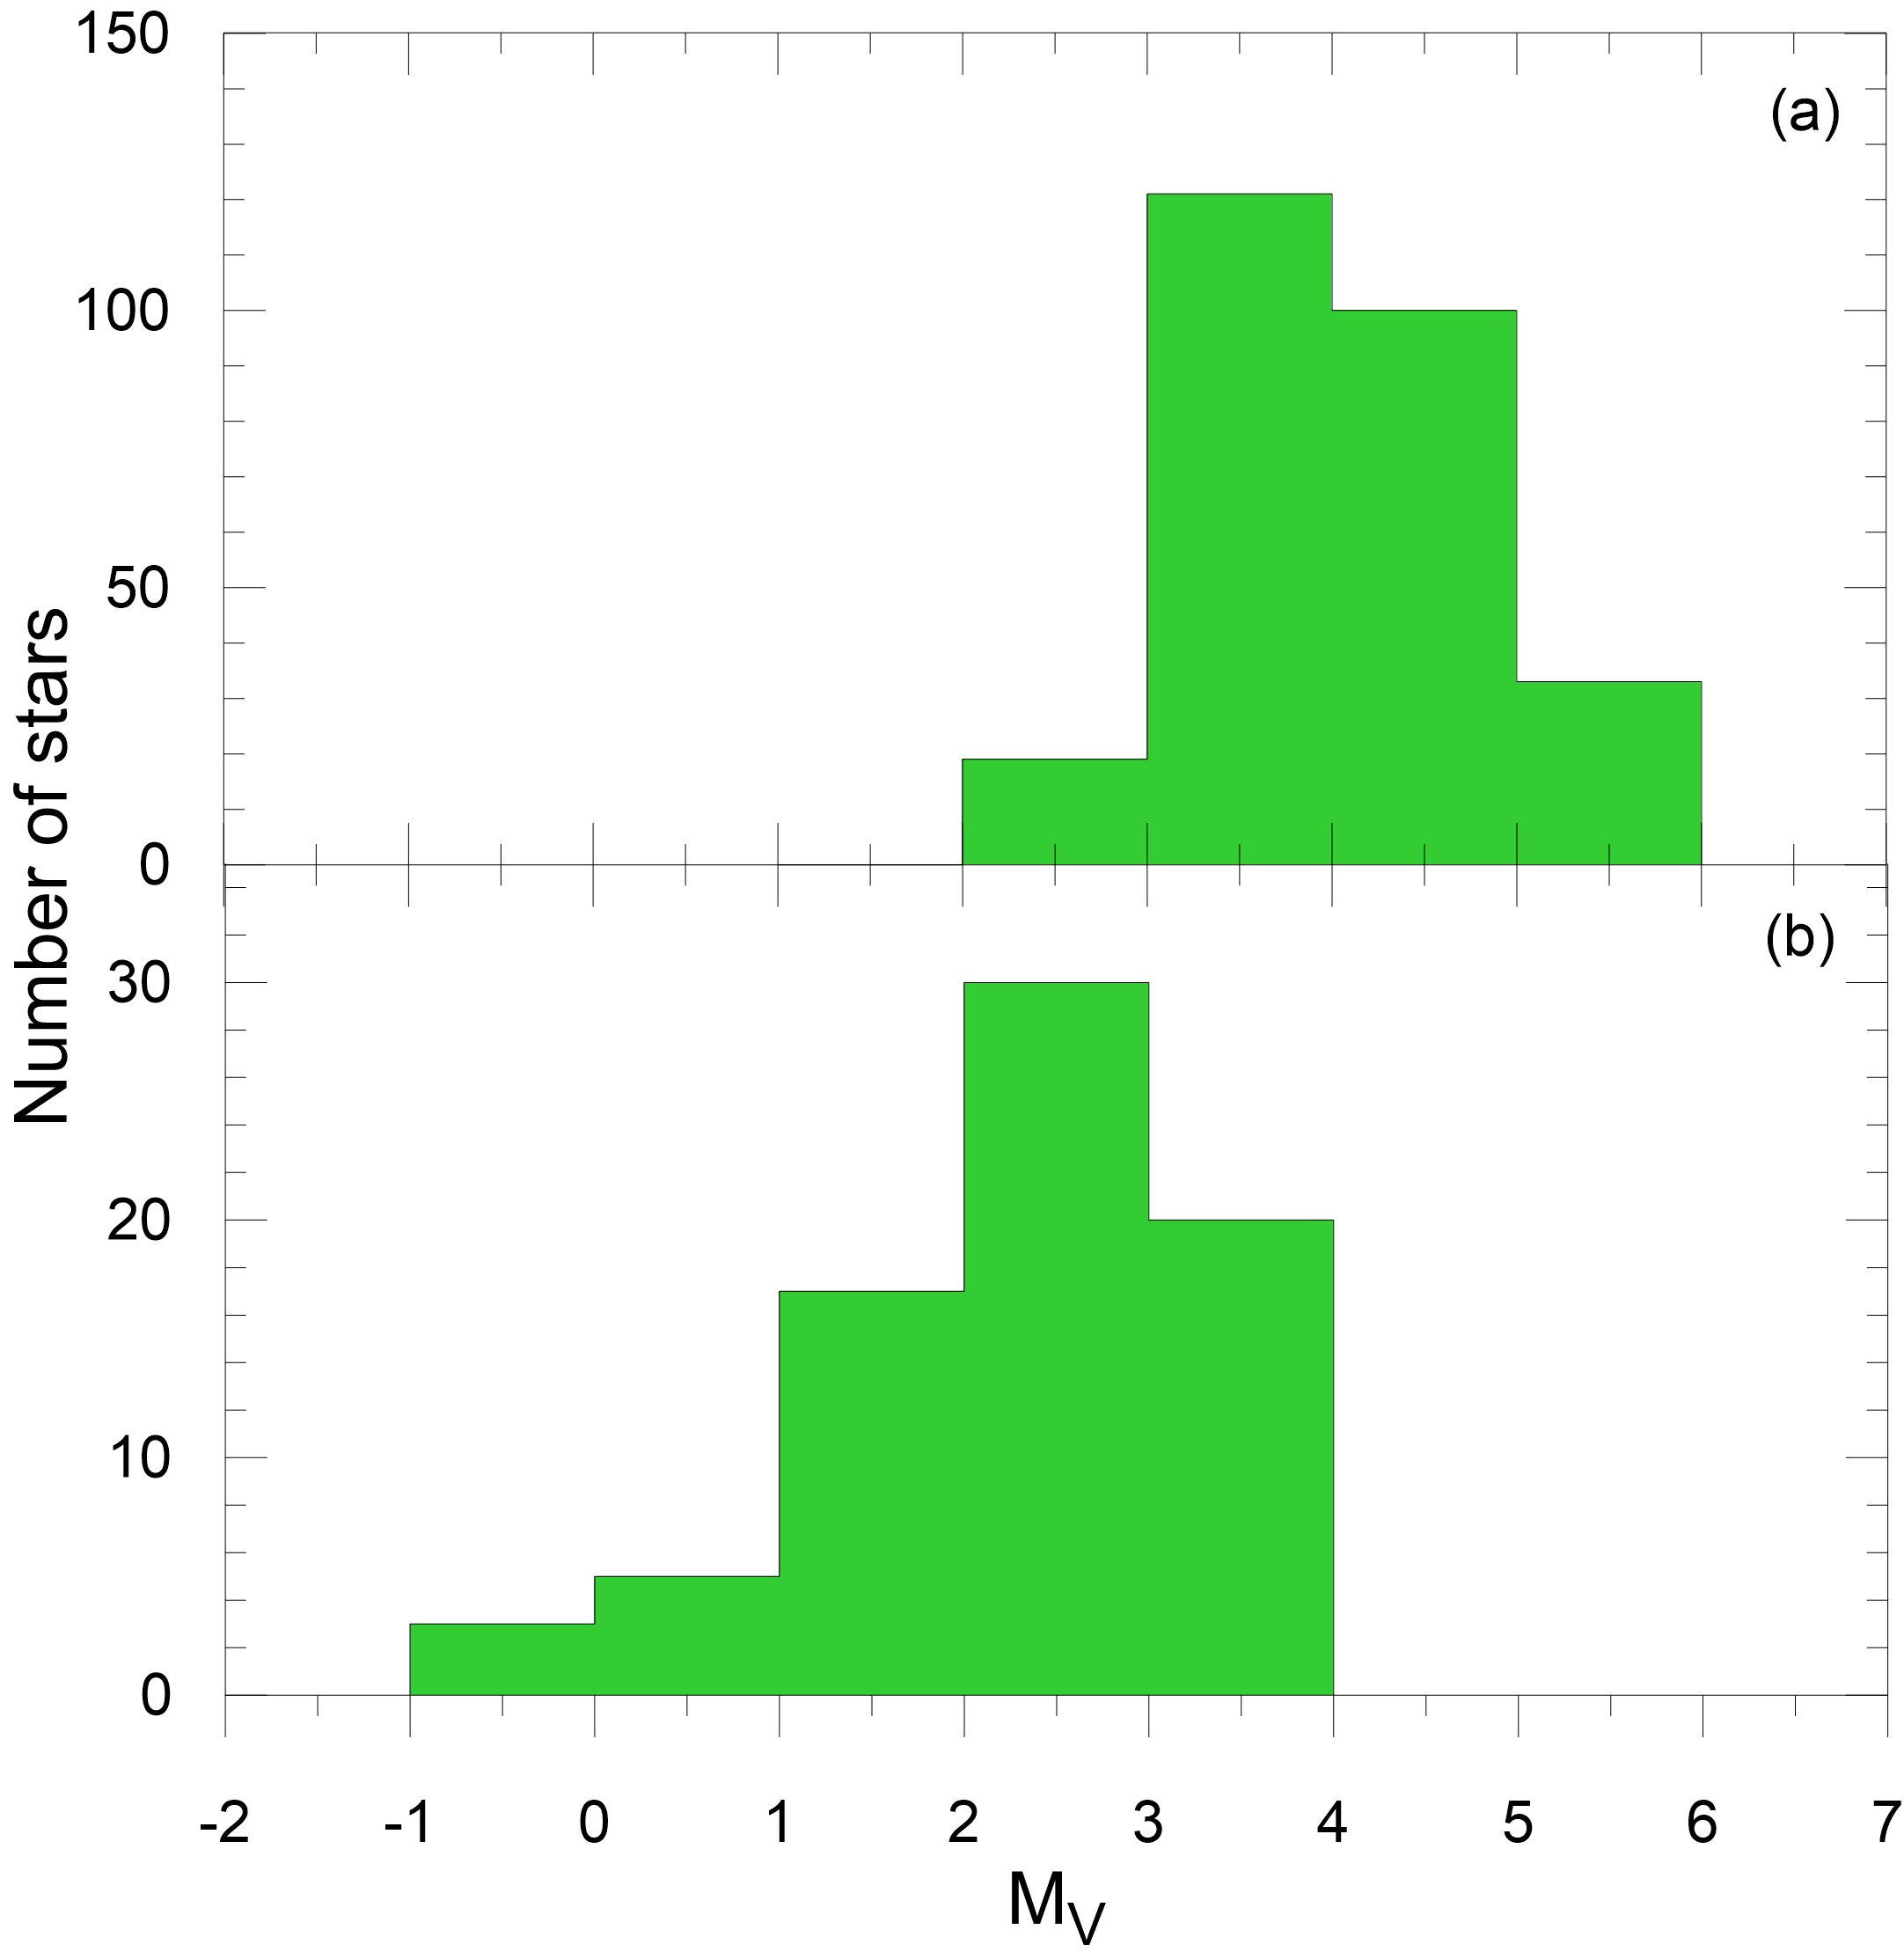
The luminosity functions (LF) and mass functions (MF) of OCs are related via well known mass-luminosity relationships. The LF for an open cluster is described as the distribution of the relative number of main-sequence members in different absolute magnitude ranges. To measure the LFs of the studied clusters, we considered main-sequence stars with membership probability located inside the previously obtained limiting radii of the clusters. For Berkeley 68, apparent magnitudes of selected main-sequence stars inside the radius lie within the range mag, and for Stock 20 apparent magnitudes of selected stars located inside the radius are within mag. We converted apparent magnitudes of the selected stars to their absolute magnitudes using the distance modulus expression . , and are apparent magnitude, isochrone distance, and color excess as previously estimated for each cluster, see also Table 7. Via these calculations, we achieved the and mag absolute magnitude ranges of the selected stars for Berkeley 68 and Stock 20 respectively. The resulting LF histograms were constructed with a bin width of 1 mag and are presented in Fig. 12 for each cluster. It can be seen from the figure that the LFs rise up to around mag for Berkeley 68 (Fig. 12a) and mag for Stock 20 (Fig. 12b), respectively.
6.2 Mass Functions
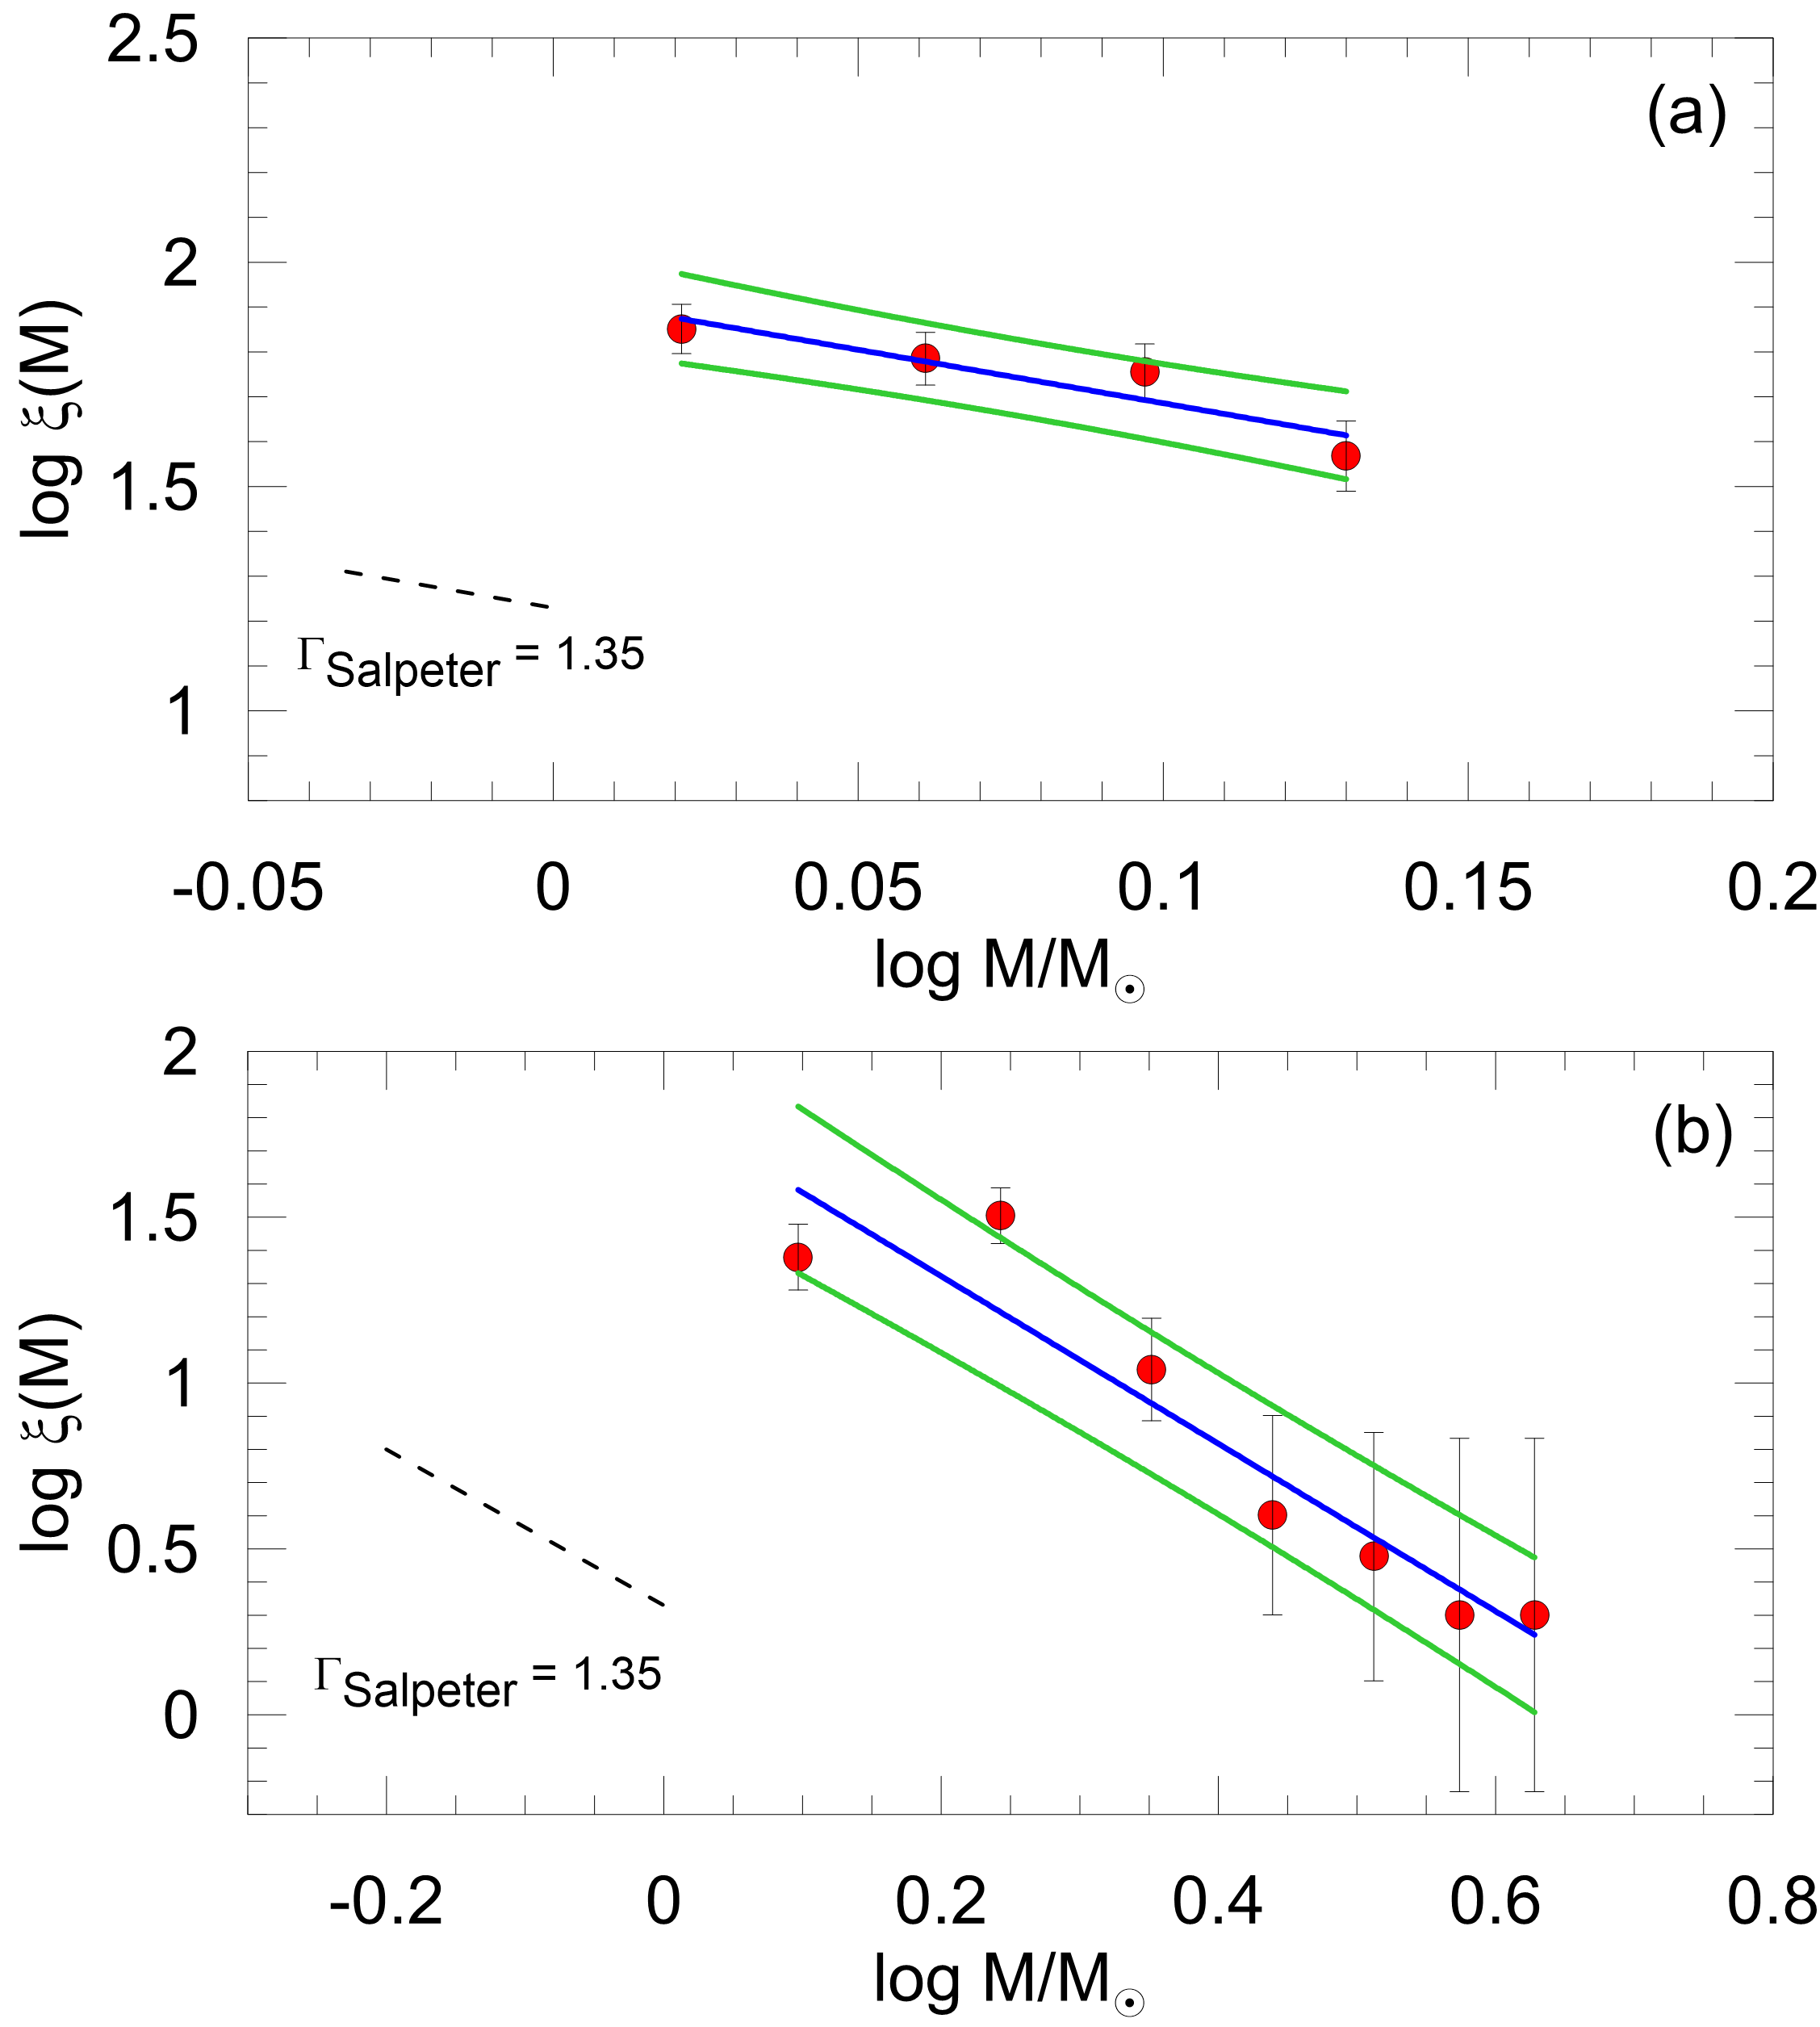
The initial mass function (IMF) is an empirical function that defines the initial distribution of masses per unit volume for a population of stars at the time of their formation. Investigating the IMF is useful to understand the ensuing evolution of the cluster. However, a direct determination of the IMF is difficult due to the evolution of cluster stars which takes place at different rates for different stellar masses (Joshi, 2022). From the present distribution of stellar masses we can measure the present day mass function (PDMF) for the clusters. The PDMF is associated with the LF according to a mass-luminosity relation, and is expressed by the following equation:
| (7) |
Here is the number of stars per unit mass , the central mass is designated as , and is the slope of the PDMF.
To obtain PDMFs we considered the parsec isochrones according to the ages and metallicity fractions () obtained above for the clusters. Using these isochrones we transformed the LF into the PDMF, through application of the theoretical models of Bressan et al. (2012) which produced a high degree polynomial equation between the -band absolute magnitudes and masses. Using this absolute magnitude-mass relation we converted the observational absolute magnitudes to masses. The number of stars with membership probability used in transformation processes are 273 for Berkeley 68 and 75 for Stock 20. The mass ranges of these stars were determined within for Berkeley 68 and for Stock 20. Using equation 7, we computed the PDMF slope values as for Berkeley 68 and as for Stock 20. PDMFs for both clusters are shown in Fig. 13
6.3 The Dynamical State of Mass Segregation
Mass segregation could occur at cluster formation. Hence investigation of mass segregation in young clusters could give insights into the process of cluster formation (Sagar et al., 1988; Raboud & Mermilliod, 1998; Fischer et al., 1998; Alcock & Parker, 2019). Interactions between cluster stars can cause energy transfer from high-mass stars to low-mass stars. This leads to more massive stars gradually moving toward the cluster center while lower-mass stars move toward the cluster halo, i.e., mass segregation (see e.g., Hillenbrand & Hartmann, 1998; Baumgardt & Makino, 2003; Dib & Henning, 2019; Bisht et al., 2020; Pavlík & Vesperini, 2022). This energy exchange enables kinetic energy equipartition leading to the velocity distribution of cluster stars conforming to a Maxwellian distribution. The time scale at which this duration occurs is defined as relaxation time (). It is related to dynamical evolution of the cluster. Relaxation time is defined by the following expression given by Spitzer & Hart (1971):
| (8) |
where is the number of considered stars, is the half-mass radius (in parsecs) of the cluster, and is the average mass of the stars.
The stars used in this study’s calculations of relaxation times were selected by limiting their mean proper motion and trigonometric parallax values as per Section 3.3. Stars were selected by defining a 1 mas yr-1 circular radius centered around the mean cluster proper motion values together with considering the upper and lower errors of trigonometric parallax for each cluster. With these limitations, 137 stars in Berkeley 68 and 54 stars in Stock 20 were within the probabilities in the mass range and . The total mass of Berkeley 68 was estimated to be and for Stock 20 . This means that the average stellar mass is for Berkeley 68 and for Stock 20. Half-mass radii are = 3.39 pc for Berkeley 68 and = 3.66 pc for Stock 20. The dynamical relaxation time of Berkeley 68 was estimated as Myr and for Stock 20 as Myr. We concluded that both clusters are dynamically relaxed due to the derived ages being younger than the present ages of two clusters as estimated in the current study (see Table 7).
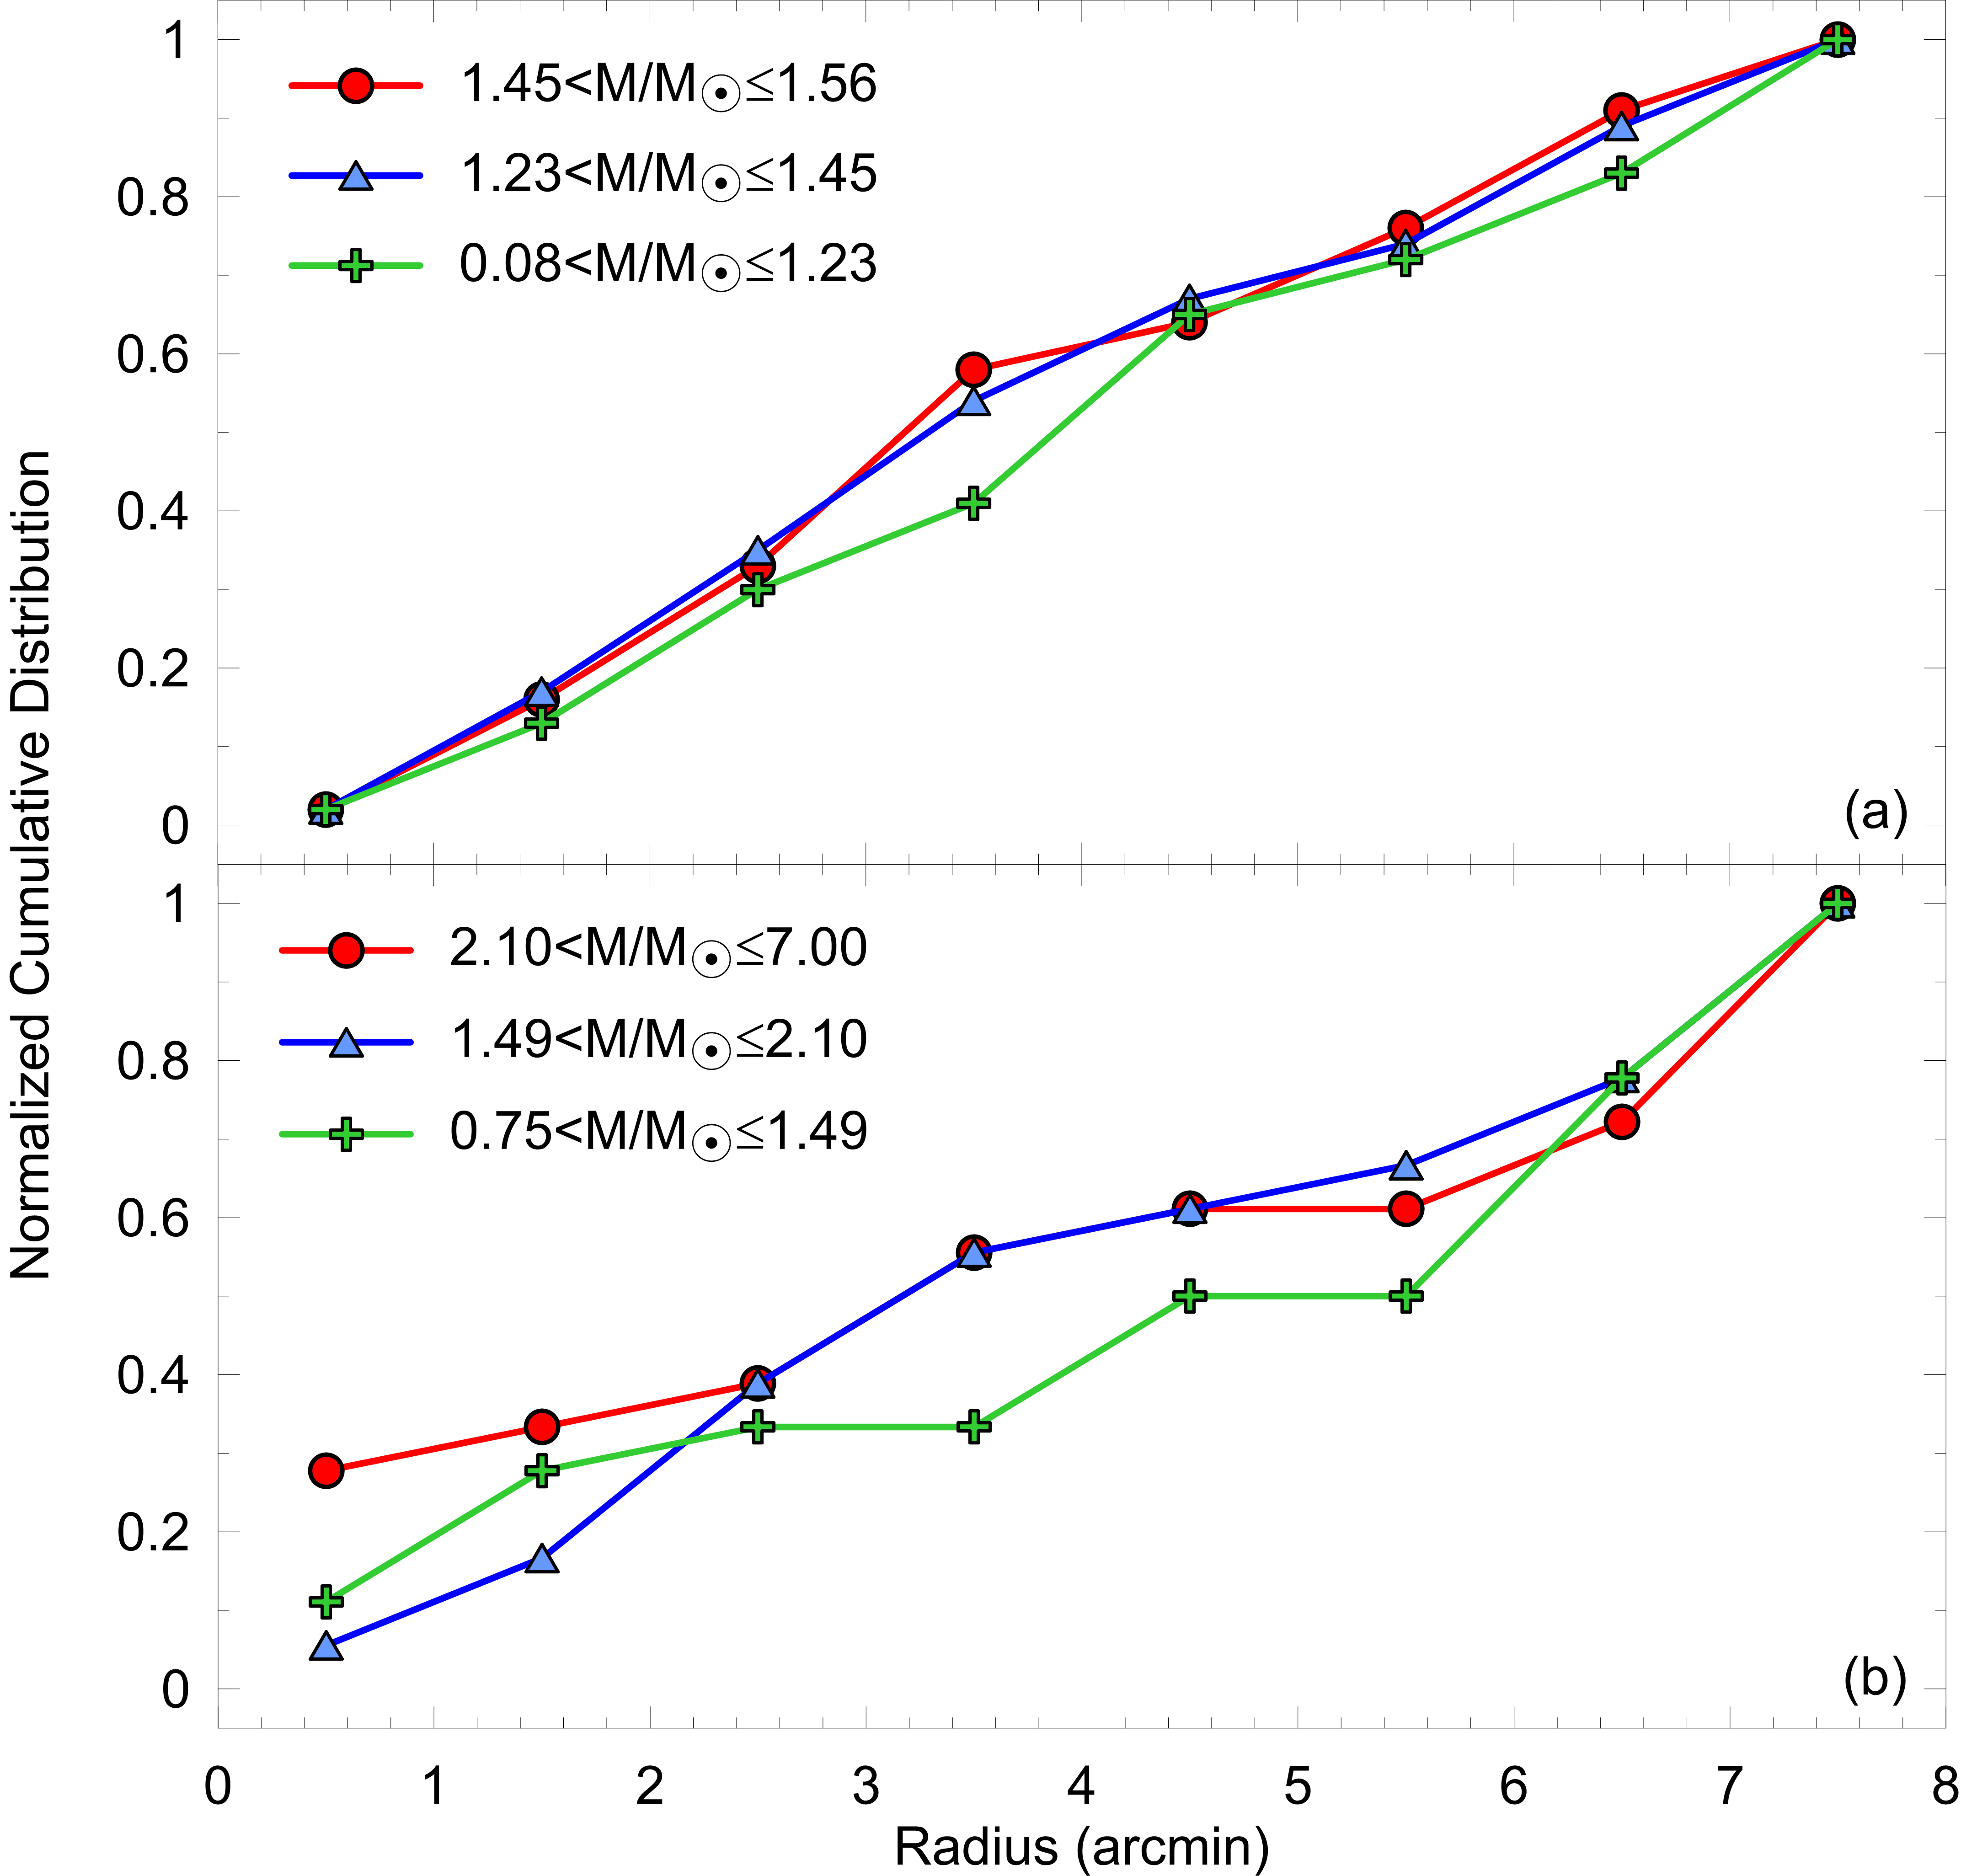
To understand the impact of mass segregation effect in the two clusters, we divided the masses of selected stars into three ranges containing equal number of stars. These ranges are (high-mass), (intermediate-mass), and (low-mass) for Berkeley 68 and , , and for Stock 20. The normalized cumulative radial distributions of stars in these different mass ranges are shown in Fig. 14. Fig. 14a exhibits that the radial stellar distributions are similar for all three mass groups for Berkeley 68. Hence, we suggest that the mass segregation is not occurring in Berkeley 68 (Fig. 14a), while Stock 20 shows a mass segregation effect due to the massive stars being more centrally concentrated than the intermediate and low-mass (Fig. 14b). We utilized the Kolmogorov–Smirnov (K-S) test, finding the confidence level for a mass segregation effect to be 62% for Berkeley 68 and 97% for Stock 20.
| Parameter | Berkeley 68 | Stock 20 |
|---|---|---|
| ( (Sexagesimal) | 04:44:12.72, 42:08:02.40 | 00:25:16.33, :37:26.40 |
| ( (Decimal) | 162.0391, 2.4041 | 119.9291, .0951 |
| (stars arcmin-2) | 8.204 2.008 | 27.197 7.164 |
| (stars arcmin-2) | 9.139 0.402 | 13.742 0.222 |
| (arcmin) | 2.663 0.616 | 0.225 |
| (arcmin) | 8 | 7.5 |
| (pc) | 6.99 0.38 | 6.35 0.47 |
| Cluster members () | 198 | 51 |
| (mas yr-1) | +2.237 0.007 | 0.004 |
| (mas yr-1) | 0.005 | 0.004 |
| (mas) | 0.31 0.03 | 0.36 0.03 |
| (pc) | 3226 312 | 2778 232 |
| (mag) | 0.520 0.032 | 0.400 0.048 |
| (mag) | 0.276 0.017 | 0.240 0.029 |
| (mag) | 1.612 0.099 | 1.240 0.149 |
| (dex) | 0.08 | 0.06 |
| Age (Myr) | 2400 200 | 50 10 |
| Distance modulus (mag) | 14.00 0.12 | 13.56 0.16 |
| Isochrone distance (pc) | 3003 165 | 2911 216 |
| (pc) | (, 925, 126) | (, 2523, 5) |
| (kpc) | 10.89 | 9.78 |
| PDMF slope | 1.38 0.71 | 1.53 0.39 |
| Total mass () | 181 | 118 |
| (km/s) | 1.86* | — |
| (km/s) | 16.62 2.42 | — |
| (km/s) | 1.35 | — |
| (km/s) | 18.49 0.69 | — |
| (km/s) | 36.03 2.85 | — |
| (pc) | 10901 149 | — |
| (pc) | 8893 34 | — |
| (pc) | 470 33 | — |
| 0.101 0.005 | — | |
| (Myr) | — | |
| Birthplace (kpc) | 10.16 | — |
| * Soubiran et al. (2018) |
7 Summary and Conclusion
We carried out a detailed study of the two open clusters Berkeley 68 and Stock 20. Analyses were based on CCD UBV and Gaia DR3 photometric data together with Gaia DR3 astrometry. Determination of fundamental and kinematic parameters were made using only stars with a cluster membership probability . The main outcomes of the study are as follows:
1) RDP fitting to the stellar density distribution determined the cluster limiting radii as ( pc) for Berkeley 68 and ( pc) for Stock 20. These radii are where the stellar densities match those of the surrounding fields about each cluster. Only stars inside these limiting radii were considered to be potential members of the clusters and subsequently used to derive fundamental cluster parameters.
2) The most probable members of each cluster were selected as follows. Firstly calculation of the membership probabilities was made considering Gaia DR3 astrometric data and their errors (, , ). Account was taken of the contamination of the main-sequence by binary stars. This was by fitting the ZAMS to CMDs with an additional shift of 0.75 mag in the band. We identified 198 stars for Berkeley 68 and 51 stars for Stock 20 as probable members (with the cluster membership probability ).
3) Mean proper motion components were derived as () mas yr-1 for Berkeley 68 and as () mas yr-1 for Stock 20. The mean trigonometric parallaxes were estimated as mas for Berkeley 68 and mas for Stock 20. These correspond to distances of pc and pc respectively.
4) Reddening and photometric metallicities were estimated separately for each cluster from UBV data based TCDs (using most probable main-sequence stars). The reddening and photometric metallicity for Berkeley 68 are mag and [Fe/H] dex. The corresponding values for Stock 20 are mag and [Fe/H] dex. To derive the distance moduli and ages, we transformed [Fe/H] to mass fraction . These are for Berkeley 68 and for Stock 20. This is the first time that metallicity has been calculated for either cluster.
5) Distance moduli and ages were derived by fitting parsec isochrones to the clusters’ UBV and Gaia EDR3-based CMDs. The isochrones were selected for metallicities calculated in the immediately previous step. During this step we kept reddening and metallicity as constants. The distance modulus of Berkeley 68 was found to be mag. The cluster’s distance and age were found to be pc and Myr, respectively. For Stock 20 the corresponding values are mag, pc, and Myr. It can be concluded that for both clusters the isochrone fitting distances are compatible with the distances calculated via trigonometric parallaxes () from Gaia DR3.
6) A radial velocity measurement was only available from the literature for Berkeley 68 but not for Stock 20. We therefore evaluated galactic orbit parameters and space velocities only for this cluster. We found that the Berkeley 68 belongs to thin-disc component, orbiting outside the solar circle.
7) We concluded from the orbital integration of Berkeley 68 (the previous step) that the cluster was born outside the solar circle at the birth radius kpc from the galactic centre and therefore came from a comparatively metal-poor region of the Milky Way.
8) The present day mass function slopes of Berkeley 68 and Stock 20 were estimated as and , respectively. Both of these values are in good agreement with the value of 1.35 given by Salpeter (1955).
9) Statistical evidence of mass segregation was noticed for Stock 20, with the Kolmogorov-Smirnov test indicating a 97% confidence level.
10) Calculation of the relaxation times for each cluster indicates that both clusters are dynamically relaxed: their estimated ages are larger than the relaxation times.
References
- Ak et al. (2016) Ak, T., Bostancı, Z. F., Yontan, T., et al., 2016, Ap&SS, 361, 126
- Akbulut et al. (2021) Akbulut, B., Ak, S., Yontan, T., et al., 2021, Ap&SS, 366, 68
- Alcock & Parker (2019) Alcock, H. L., Parker, R. J., 2019, MNRAS, 490, 350
- Balaguer-Nunez et al. (1998) Balaguer-Nunez, L., Tian, K. P., Zhao, J. L., 1998, Astron. Astrophys. Suppl. Ser., 133, 387
- Banks et al. (2020) Banks, T., Yontan, T., Bilir, S., Canbay, R., 2020, JApA, 41, 6
- Baumgardt & Makino (2003) Baumgardt, H., Makino, J., 2003, MNRAS, 340, 227
- Bertin & Arnouts (1996) Bertin, E., Arnouts, S., 1996, Astron. Astrophys. Suppl. Ser., 117, 393
- Bilir et al. (2006) Bilir, S., Güver, T., Aslan, M., 2006, Astron. Nachr., 327, 693
- Bilir et al. (2010) Bilir, S., Güver, T., Khamitov, I., Ak, T., Ak, S., Coşkunoğlu, K. B., Paunzen, E., Yaz, E., 2010, Ap&SS, 326, 139
- Bilir et al. (2016) Bilir, S., Bostancı, Z. F., Yontan, T., et al., 2016, Adv. Space Res., 58, 1900
- Bisht et al. (2019) Bisht, D., Yadav, R. K. S., Ganesh, S., Durgapal, A. K., Rangwal, G., Fynbo, J. P. U., 2019, MNRAS, 482, 1471
- Bisht et al. (2020) Bisht, D., Zhu, Q., Yadav, R. K. S., Durgapal, A., Rangwal, G., 2020, MNRAS, 494, 607
- Bostancı et al. (2015) Bostancı, Z. F., Ak, T., Yontan, T., et al., 2015, MNRAS, 453, 1095
- Bostancı et al. (2018) Bostancı, Z. F., Yontan, T., Bilir, S., et al., 2018, Ap&SS, 363, 143
- Bovy & Tremaine (2012) Bovy, J., Tremaine, S., 2012, ApJ, 756, 89
- Bovy (2015) Bovy, J., 2015, ApJS, 216, 29
- Bressan et al. (2012) Bressan, A., Marigo, P., Girardi, L., Salasnich, B., Dal Cero, C., Rubele, S., Nanni, A., 2012, MNRAS, 427, 127
- Buckner & Froebrich (2013) Buckner, A. S. M., Froebrich, D., 2013, MNRAS, 436, 1465
- Cantat-Gaudin et al. (2018) Cantat-Gaudin, T., Jordi, C., Vallenari, A., et al., 2018, A&A, 618, 93
- Cantat-Gaudin et al. (2019) Cantat-Gaudin, T., Krone-Martins, A., Sedaghat, N., et al., 2019, A&A, 624, A126
- Cantat-Gaudin et al. (2020) Cantat-Gaudin, T., Anders, F., Castro-Ginard, A., et al., 2020, A&A, 640, A1
- Carraro et al. (2017) Carraro, G., Sales Silva, J. V., Moni Bidin, C., Vazquez, R. A., 2017, ApJ, 153, 20
- Castro-Ginard et al. (2018) Castro-Ginard, A., Jordi, C., Luri, X., Julbe, F., Morvan, M., Balaguer-Núñez, L., Cantat-Gaudin, T., 2018, A&A, 618, A59
- Castro-Ginard et al. (2019) Castro-Ginard, A., Jordi, C., Luri, X., Cantat-Gaudin, T., Balaguer-Núñez, L., 2019, A&A, 627, A35
- Castro-Ginard et al. (2020) Castro-Ginard, A., Jordi, C., Luri, X., et al., 2020, A&A, 635, A45
- Chen et al. (2000) Chen, Y. Q., Nissen, P. E., Zhao, G., Zhang, H. W., Benoni, T., 2000, Astron. Astrophys. Suppl. Ser., 141, 491
- Coşkunoǧlu et al. (2011) Coşkunoǧlu, B., Ak S., Bilir, S., et al., 2011, MNRAS, 412, 1237
- Cutri et al. (2003) Cutri, R. M., Skrutskie, M. F., van Dyk, S., et al., 2003, yCat, II/246
- Dias et al. (2021) Dias, W. S., Monteiro, H., Moitinho, A., et al., 2021, MNRAS, 504, 356
- Dib & Henning (2019) Dib, S., Henning, T., 2019, A&A, 629, A135
- Eker et al. (2018) Eker, Z., Bakış, V., Bilir, S., et al., 2018, MNRAS, 479, 5491
- Eker et al. (2020) Eker, Z., Soydugan, F., Bilir, S., et al., 2020, MNRAS, 496, 3887
- Fischer et al. (1998) Fischer, P., Pryor, C., Murray, S., Mateo, M., Richtler, T., 1998, AJ, 115, 592
- Gaia collaboration et al. (2016) Gaia Collaboration, Brown A. G. A., Vallenari A., et al., 2016, A&A, 595, A1
- Gaia collaboration et al. (2018) Gaia Collaboration, Brown, A. G. A., Vallenari, A., Prusti, T., et al., 2018, A&A, 616, 22
- Gaia collaboration et al. (2021) Gaia Collaboration, Brown, A. G. A., Vallenari, A., Prusti, T., et al., 2021, A&A, 694, 1
- Gaia collaboration et al. (2022) Gaia Collaboration, Vallenari, A., Brown, A. G. A., Prusti, T., et al., 2022, A&A
- Hao et al. (2021) Hao, C. J., Xu, Y., Hou, L. G., et al., 2021, A&A, 652, A102
- He, Xu, & Hou (2021) He, Z.-H., Xu, Y., Hou, L.-G., 2021, RAA, 21, 093
- Hillenbrand & Hartmann (1998) Hillenbrand, L. A., Hartmann, L. W., 1998, ApJ, 492, 540
- Hou (2021) Hou, L. G., 2021, FrASS, 8, 103
- Janes & Hoq (2011) Janes, K., Hoq, S., 2011, AJ, 141, 92
- Joshi (2022) Joshi, G. C., 2022, InJPh, 96, 659
- Karaali et al. (2003a) Karaali, S., Bilir, S., Karataş, Y., Ak, S. G., 2003a, PASA, 20, 165
- Karaali et al. (2003b) Karaali, S., Ak, S. G., Bilir, S., Karataş, Y., Gilmore, G., 2003b, MNRAS, 343, 1013
- Karaali et al. (2011) Karaali, S., Bilir, S., Ak, S., Yaz, E., Coşkunoğlu, B., 2011, PASA, 28, 95
- Katz et al. (2022) Katz, D., Sartoretti, P., Guerrier, A., et al., 2022, arXiv, arXiv:2206.05902
- Kharchenko et al. (2012) Kharchenko, N. V., Piskunov, A. E., Schilbach, E., Roeser, S., Scholz, R. -D., 2012, A&A, 543, 156
- King (1962) King, I., 1962, AJ, 67, 471
- Koç et al. (2022) Koç, S., Yontan, T., Bilir, S., et al., 2022, AJ, 163, 191
- Krone-Martins & Moitinho (2014) Krone-Martins, A., Moitinho, A., 2014, A&A, 561, A57
- Lada & Lada (2003) Lada, C. J., Lada, E. A., 2003, ARA&A, 41, 57
- Landolt (2009) Landolt, A. U., 2009, AJ, 137, 4186
- Lang (2010) Lang, D., Hogg, D. W., Mierle, K., Blanton, M., Roweis, S., 2010, AJ, 139, 1782
- Leggett (1992) Leggett, S. K., 1992, ApJS, 82, 351
- Liu & Pang (2019) Liu, L., Pang, X., 2019, ApJS, 245, 32
- Marigo et al. (2017) Marigo, P., Girardi, L., Bressan, A., et al., 2017, ApJ, 835, 77
- Maurya & Joshi (2020) Maurya, J., Joshi Y. C., 2020, MNRAS, 494, 4713
- McKee & Ostriker (2007) McKee, C. F., Ostriker, E. C., 2007, ARA&A, 45, 565
- Miyamoto & Nagai (1975) Miyamoto, M., Nagai, R., 1975, PASJ, 27, 533
- Monteiro & Dias (2019) Monteiro, H., Dias, W. S., 2019, MNRAS, 487, 2385
- Navarro et al. (1996) Navarro, J. F., Frenk, C. S., White, S. D. M., 1996, ApJ, 462, 563
- Pavlík & Vesperini (2022) Pavlík, V., Vesperini, E., 2022, MNRAS, 515, 1830
- Poggio et al. (2021) Poggio, E., Drimmel, R., Cantat-Gaudin, T., et al., 2021, A&A, 651, A104
- Portegies Zwart, McMillan, & Gieles (2010) Portegies, Zwart, S. F., McMillan, S. L. W., Gieles, M., 2010, ARA&A, 48, 431
- Raboud & Mermilliod (1998) Raboud, D., Mermilliod, J.-C., 1998, A&A, 329, 101
- Ruprecht (1966) Ruprecht, J., 1966, BAICz, 17, 33
- Sagar et al. (1988) Sagar, R., Miakutin, V. I., Piskunov, A. E., Dluzhnevskaia, O. B., 1988, MNRAS, 234, 831
- Salpeter (1955) Salpeter, E. E., 1955, ApJ, 121, 161
- Sariya et al. (2021) Sariya, D. P., Jiang, I.-G., Bisht, D., et al., 2021, AJ, 162, 146
- Schmidt-Kaler (1982) Schmidt-Kaler, T., 1982, BICDS, 23, 2
- Science Software Branch at STScI (2012) Science Software Branch at STScI, 2012, PyRAF: Python alternative for IRAF, Astrophysics Source Code Library, ascl:1207.011
- Soubiran et al. (2018) Soubiran, C., Cantat-Gaudin, T., Romero-Gómez, M., et al., 2018, A&A, 619, A155
- Sun et al. (2021) Sun, M., Jiang, B., Yuan, H., Li, J., 2021, ApJS, 254, 38
- Spitzer & Hart (1971) Spitzer, L., Hart, M. H., 1971, ApJ, 164, 399
- Stetson (1980) Stetson, P. B., 1980, AJ, 85, 387
- Sung et al. (2013) Sung, H., Lim, B., Bessell, M. S., Kim, J. S., Hur, H., Chun, M., Park, B., 2013, J. Korean Astron. Soc., 46, 103
- Tarricq et al. (2021) Tarricq, Y., Soubiran, C., Casamiquela, L., et al., 2021, A&A, 647, A19
- Tody (1986) Tody, D., 1986, SPIE, 627, 733
- Tody (1993) Tody, D., 1993, ASPC, 52, 173
- Vasilevskis, Klemola, & Preston (1958) Vasilevskis, S., Klemola, A., Preston, G., 1958, AJ, 63, 387
- Wang et al. (2022) Wang, H., Zhang, Y., Zeng, X., Hu, Q., Liu, J., Qin, M., Lü, G., 2022, AJ, 164, 40
- Yadav, Sariya & Sagar (2013) Yadav, R. K. S., Sariya, D. P., Sagar, R., 2013, MNRAS, 430, 3350
- Yontan et al. (2015) Yontan, T., Bilir, S., Bostancı, Z. F., et al., 2015, Ap&SS, 355, 267
- Yontan et al. (2019) Yontan, T., Bilir, S., Bostancı, Z. F., et al., 2019, Ap&SS, 364, 20
- Yontan et al. (2021) Yontan, T., Bilir, S., Ak, T., et al., 2021, Astron. Nachr., 342, 538
- Yontan et al. (2022) Yontan, T., Çakmak, H., Bilir, S., et al., 2022, RMxAA, 58, 333
- Zhao & He (1990) Zhao, J. L., He, Y. P., 1990, A&A, 237, 54
- Zhong et al. (2020) Zhong, J., Chen, L., Wu, D., Li, L., Bai, L., Hou, J., 2020, A&A, 640, A127