A Census of the Taurus Star-forming Region and Neighboring Associations with Gaia11affiliation: Based on observations made with the Gaia mission, the Two Micron All Sky Survey, the Wide-field Infrared Survey Explorer, the LAMOST survey, the Sloan Digital Sky Survey IV, the NASA Infrared Telescope Facility, and Gemini Observatory.
Abstract
I have used high-precision photometry and astrometry from the third data release of Gaia (DR3) to perform a survey for members of the Taurus star-forming region and young associations in its vicinity. This work has produced a new catalog of 532 adopted members of Taurus, which has only minor changes relative to the previous catalog from Esplin & Luhman (2019). I have used the Gaia astrometry to divide the Taurus members into 13 groups that have distinct kinematics. Meanwhile, I have identified 1378 candidate members of seven associations near Taurus. All of these associations have histograms of spectral types that peak near M5 ( ), resembling other young populations in the solar neighborhood. For the Taurus groups and neighboring associations, I have estimated ages from their sequences of low-mass stars in Hertzsprung-Russell diagrams. Most of the Taurus groups have median ages of 1–3 Myr while the associations have ages ranging from 13 to 56 Myr. I have used mid-infrared photometry from the Wide-field Infrared Survey Explorer to search for excess emission from circumstellar disks among the candidate members of the associations. Disks are detected for 51 stars, 20 of which are reported for the first time in this work. Some recent studies have proposed that samples of older stars (10 Myr) found in the vicinity of Taurus represent a distributed population that is associated with the Taurus cloud complex. However, I find that most of those stars have kinematics that are inconsistent with any relationship with Taurus.
1. Introduction
The solar neighborhood contains numerous groups, associations, and clusters that span a wide range of ages. The youngest populations ( Myr) are associated with their natal molecular clouds and are located at distances of 100 pc. The Taurus complex of clouds is one of the nearest sites of recent star formation ( pc, Galli et al., 2018, references therein). Roughly a dozen small groups of stars are associated with the clouds in Taurus, which together have a total of proposed members (Esplin & Luhman, 2019). The Taurus groups appear to have roughly similar ages (few Myr) and yet have a long crossing time (10–20 Myr) because of their large physical extent, which has been cited as evidence that the formation of molecular clouds is rapid (Ballesteros-Paredes et al., 1999; Hartmann et al., 2001).
Since the Taurus groups have low stellar density and cover a large area of sky, membership surveys based on signatures of youth have been potentially subject to contamination from young stars in the field and in unrelated associations (Hartmann et al., 1991; Briceño et al., 1997; de Zeeuw et al., 1999). It should be possible to greatly reduce such contamination using data from the Gaia mission (Perryman et al., 2001; de Bruijne, 2012; Gaia Collaboration et al., 2016), which is performing an all-sky survey to measure high-precision photometry, proper motions, and parallaxes for more than a billion stars as faint as ( in Taurus). In addition, kinematic data from Gaia should enable discrimination among the Taurus groups. However, recent studies of Taurus with Gaia have produced substantially different results on both fronts (Luhman, 2018; Galli et al., 2019; Roccatagliata et al., 2020; Liu et al., 2021; Kerr et al., 2021; Krolikowski et al., 2021).
In this paper, I have used the third data release of Gaia (DR3, Gaia Collaboration et al., 2021, 2022) to perform a census of the Taurus groups and associations in their vicinity. I describe the construction of my catalog of adopted members of Taurus (Section 2), assign those members to individual Taurus groups based on their kinematics, and search for new members of the groups that have similar kinematics (Section 3). I then identify candidate members of young associations near Taurus (Section 4), characterize the properties of the stellar populations in the Taurus groups and the neighboring associations (Section 5), and compare the results of my work to those of recent studies (Section 6).
2. Catalog of Taurus Members
2.1. Adopted Members
My previous catalog of adopted members of Taurus contained 519 objects (Esplin & Luhman, 2019). In that catalog, the components of multiple systems were given separate entries if they were resolved by Gaia or other wide-field imaging surveys. Otherwise, the components appeared together in a single entry if they were resolved only in a multiplicity survey (e.g., Konopacky et al., 2007). Among the latter, the following eight companions are resolved by Gaia DR3 and have separate entries in my new catalog: LkCa 3B, LkCa 7B, XZ Tau B, HBC 412 B, IW Tau B, JH112 Ab, J2-2041 B, and a companion to 2MASS J04400174+2556292 (Gaia DR3 148386898125118464). Gaia DR3 149370651794032640 and 149370651795329536 have a separation of and are located near the infrared (IR) position of IRAS 04264+2433. In optical images from the Hubble Space Telescope (program 9103, K. Stapelfeldt), the first Gaia source is brighter and more point-like, so it is adopted as the counterpart to IRAS 04264+2433. The second Gaia source may be nebulosity rather than a star, so it is not included in my catalog. I have rejected eight stars from Esplin & Luhman (2019) based on the analysis of Gaia DR3 astrometry in Section 3, consisting of BS Tau A/B, HD 283782, Gaia DR3 151851867285622528, 151870352825256576, 151639902060635520, 157644373715415424, and 155964354307956480. Meanwhile, I have adopted the following 13 objects as new members based on their Gaia kinematics and spectroscopic confirmation of youth (Section 2.2): PW Aur, Gaia DR3 145200960104259200, 3420750548559422592, 3414676232147787136, 3418846267435680512, 3446890376655192832, 3446890411014932224, 180149418232233472, 156207518176564864, 157247965413620224, 156162674425653248, 3420824426291884672, and 3421359544857244160. My new catalog of Taurus members contains 532 objects.
2.2. New Spectral Classifications
Gaia DR3 3419115132386033280 is a candidate companion that has been adopted as a Taurus member in my recent studies but has lacked a spectral classification. I obtained a near-IR spectrum of it using SpeX (Rayner et al., 2003) at the NASA Infrared Telescope Facility (IRTF) on the night of 2020 January 2. The spectrum was reduced with the Spextool package (Cushing et al., 2004), which included correction of telluric absorption (Vacca et al., 2003). A spectral type was measured through comparison to standard spectra derived from optically-classified young stars (Luhman et al., 2017).
Thirteen of the candidate members of Taurus identified with Gaia DR3 in Section 3 have spectroscopy available for verifying their youth. Two of those objects, Gaia DR3 3414676232147787136 and PSO J079.3986+26.2455, have been spectroscopically confirmed as young in previous work (Slesnick et al., 2006; Zhang et al., 2018). I have measured a new spectral type from the previous data for the latter using the standards from Luhman et al. (2017). The remaining 11 stars have been observed through the Large Sky Area Multi-Object Fiber Spectroscopic Telescope survey (LAMOST; Cui et al., 2012; Zhao et al., 2012) or with the GoldCam spectrograph at the Kitt Peak National Observatory (KPNO) 2.1 m telescope (program 2010B-0530, S. Takita). The LAMOST data were taken from the seventh data release (DR7) of the survey. All of these stars exhibit evidence of youth in their spectra. I measured their spectral types through comparison to field dwarf standards for M5 (Henry et al., 1994; Kirkpatrick et al., 1991, 1997) and averages of dwarf and giant standards for M5 (Luhman et al., 1997; Luhman, 1999).
The new spectral classifications are provided in Table 1.
2.3. Compilation of Data
My catalog of adopted Taurus members is presented in Table 2, which includes source names from Gaia DR3, the Point Source Catalog of the Two Micron All Sky Survey (2MASS, Skrutskie et al., 2003, 2006), the United Kingdom Infrared Telescope (UKIRT) Infrared Deep Sky Survey (UKIDSS, Lawrence et al., 2007), and previous studies; equatorial coordinates from Gaia DR3, 2MASS, UKIDSS, or the Spitzer Space Telescope; measurements of spectral types and the type adopted in this work; data from Gaia DR3 that consist of proper motion, parallax, renormalized unit weight error (RUWE, Lindegren, 2018)111RUWE provides a measure of the goodness of fit for the astrometry., and photometry in bands at 3300–10500 Å (), 3300–6800 Å (), and 6300-10500 Å (); distance estimate based on the Gaia DR3 parallax (Bailer-Jones et al., 2021); the most accurate available radial velocity measurement that has an error less than 4 km s-1; velocities calculated from the proper motion, parallactic distance, and radial velocity (Johnson & Soderblom, 1987; Luhman & Esplin, 2020); a flag indicating whether the object is an outlier in terms of its Gaia astrometry; and the Taurus group to which the object has been assigned based on its Gaia astrometry (Section 3.2).
One of the sources of radial velocities for Taurus members is the APOGEE-2 program within the Sloan Digital Sky Survey IV (SDSS-IV, Blanton et al., 2017; Majewski et al., 2017; Abdurro’uf et al., 2022). The errors in those velocities are likely underestimated (Cottaar et al., 2014; Tsantaki et al., 2022). When multiple measurements are available from APOGEE-2, the average value is adopted in this work. For those stars, I have included in Table 2 the VSCATTER parameter from that survey, which measures the scatter among the multiple measurements. Large values of VSCATTER may indicate the presence of a binary, in which case the average velocity may not represent the velocity of the system. Thus, the radial velocities and corresponding velocities of such stars should be treated with caution. The radial velocities adopted from the LAMOST Medium-resolution Survey were derived from data at multiple epochs in the manner described by Luhman (2022c).
Proper motions and parallaxes are available from radio interferometry (Galli et al., 2018) for four Taurus members that lack such measurements from Gaia DR3, consisting of LkCa 3 A, V410 Anon 25, XZ Tau A, and LkHa332/G1. An additional member with radio astrometry, the binary system V807 Tau, has a large parallax error and a poor astrometric fit in Gaia DR3. The proper motions, parallaxes, and implied distances for these five stars in Table 2 are from Galli et al. (2018).
Among the 532 adopted members, 467 have entries in Gaia DR3 and 412 have proper motions and parallaxes from Gaia DR3. Those parameters are available for 416 members after including the radio measurements from Galli et al. (2018). The number of members with mas is 412, 291 of which also have radial velocity measurements. Radial velocities are available for 330 members, 37 of which lack parallax data. Most of the sources that lack parallaxes and radial velocities are close companions, brown dwarfs, or protostars.
The catalog of Taurus members from Esplin & Luhman (2019) included a compilation of IR photometry and disk classifications. I have checked the 13 additional stars adopted as members in this work for evidence of disks using mid-IR photometry from the AllWISE Source Catalog (Cutri et al., 2013; Wright et al., 2013) produced by the Wide-field Infrared Survey Explorer (WISE, Wright et al., 2010). Excess emission from disks was identified and classified in the manner described in previous studies (Esplin et al., 2014, 2018). The resulting classifications are included in Table 1. Five stars lack disk emission and are designated as class III (Lada & Wilking, 1984; Lada, 1987). The remaining eight stars have disks that are classified as full, all of which have been detected in previous studies (Rebull et al., 2011; Zhang et al., 2018; Liu et al., 2021). The disk classification for Gaia DR3 156162674425653248 is tentative because it is only slightly resolved from a candidate companion in the WISE data.
3. A Search for New Members of Taurus
3.1. Survey Strategy
In Luhman (2018), I used data from the second data release of Gaia (DR2, Gaia Collaboration et al., 2018) to search for new members of Taurus based on positions in color-magnitude diagrams (CMDs) that were indicative of young stars and based on kinematics that were similar to those of the groups of known young stars associated with the Taurus clouds. The resulting survey had a high level of completeness for spectral types of M6–M7 at low-to-moderate extinctions (). I have followed the same approach with my new survey that uses data from Gaia DR3. As done in Luhman (2018) and in my studies of other young associations (e.g., Esplin & Luhman, 2017; Luhman & Esplin, 2020; Luhman, 2022a), I have analyzed the Gaia astrometry in terms of a “proper motion offset” (), which is defined as the difference between the observed proper motion of a star and the motion expected at the celestial coordinates and parallactic distance of the star for a specified space velocity. By using the proper motion offset, projection effects are minimized, which is particularly important for regions like Taurus that cover a large area of sky. For my survey, the proper motion offsets are calculated relative to the motions expected for a velocity of km s-1, which approximates the median velocity of Taurus members (Luhman, 2018). For parallactic distances, I adopt the geometric values estimated by Bailer-Jones et al. (2021) from DR3 parallaxes.
3.2. Assigning Adopted Members to Groups
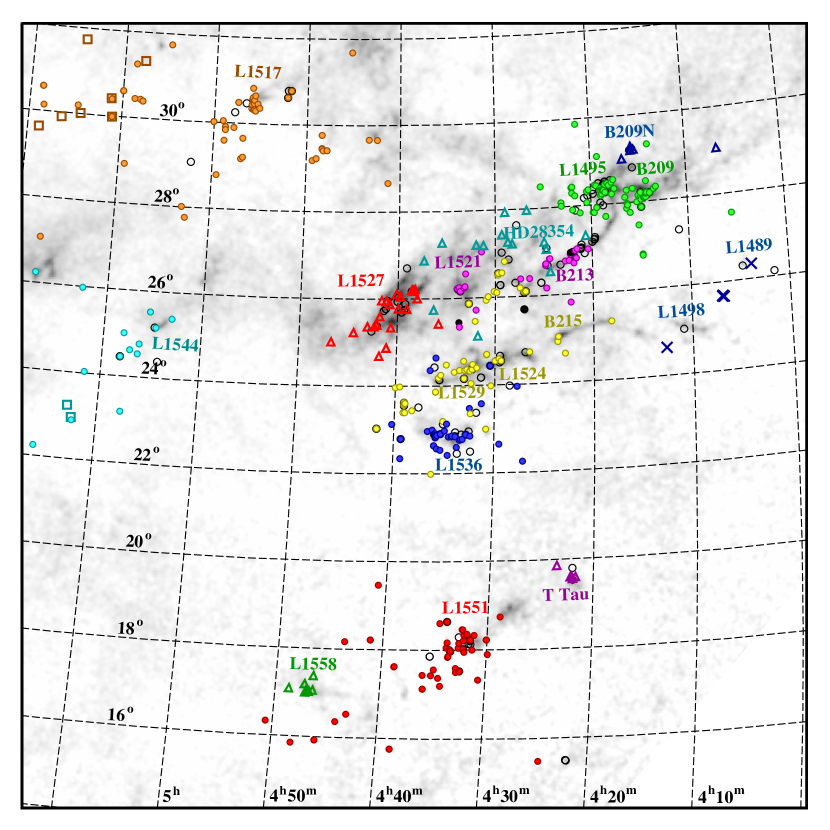
Before searching for new members of Taurus, I need to characterize the kinematics of the Taurus groups, which requires defining the groups and the adopted Taurus members that belong to them. I have divided the adopted members that have measurements of proper motions and parallaxes into groups based on their clusters in proper motion offsets, which I refer to as “kinematic clusters”. During that process, I have considered the spatial positions of stars in the following manner. If a given kinematic cluster contains stars that reside in two spatial clusters that are widely separated (i.e., two groups on opposite sides of the Taurus complex), they are divided into two groups. Otherwise, if all of the stars in a kinematic cluster have a continuous spatial distribution or consist of two adjacent spatial clusters, they are treated as a single group. An example of the latter is the pair of neighboring clumps of stars toward the L1495 and B209 clouds, which have similar kinematics. This analysis has produced 13 groups, which are named after the dark clouds that they surround or their brightest members (T Tau, HD 28354). Among the 416 adopted members with parallax measurements, 412 have been assigned to the groups, as indicated in Table 2. The remaining four stars are located in areas where groups overlap spatially and have sufficiently large astrometric uncertainties that it is unclear to which group they belong. The Taurus members that lack parallaxes have not been assigned to groups, but for many of them, the identities of their groups are strongly implied by their locations on the sky (i.e., they are near only a single group).
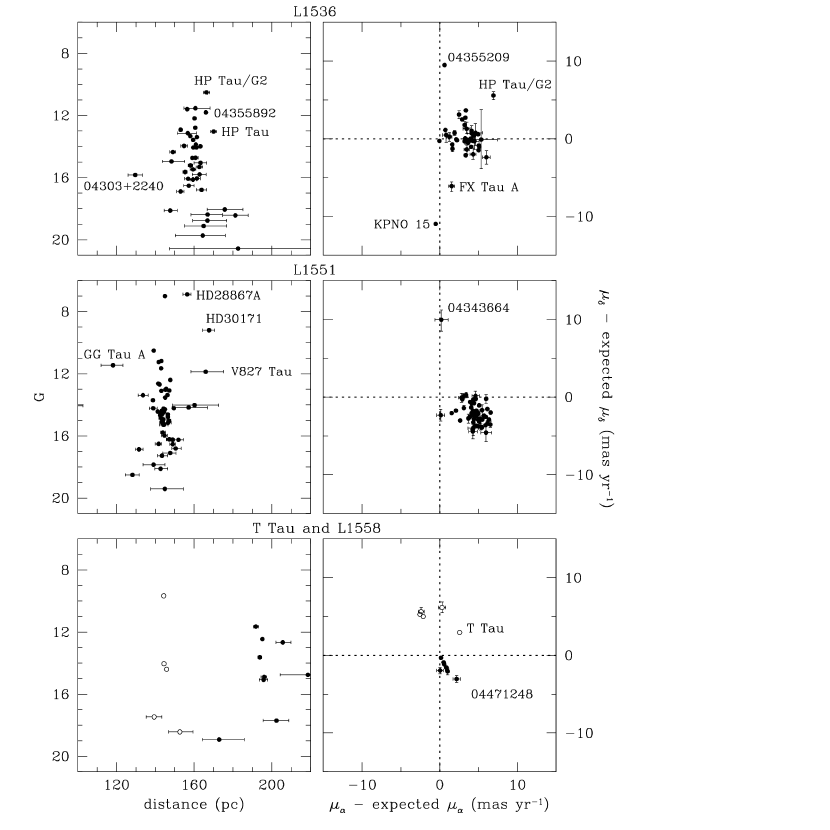
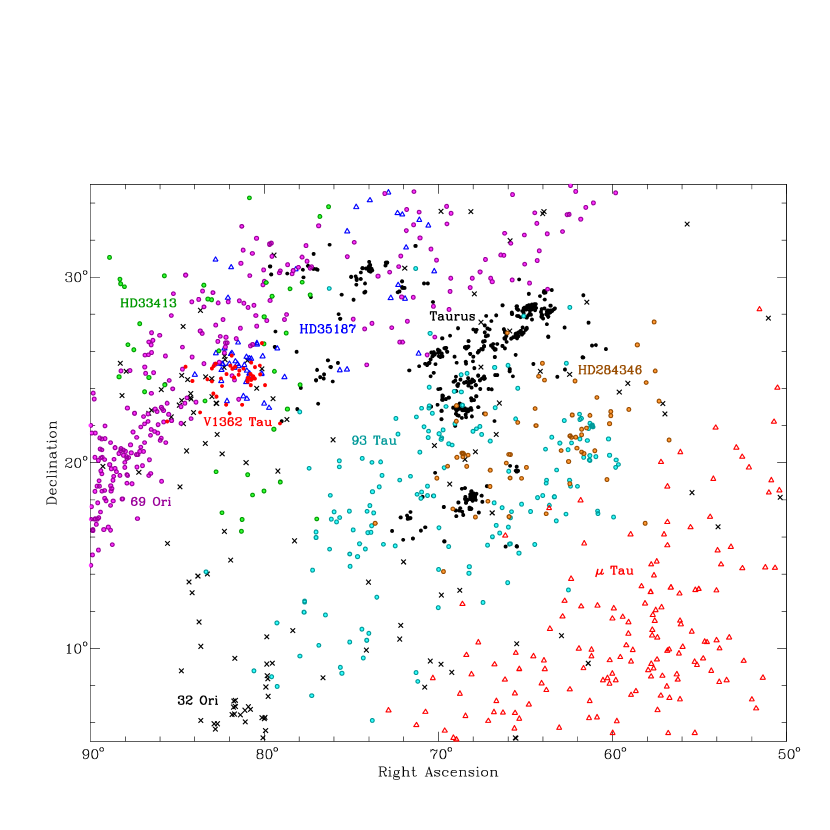
In Figure 1, I have plotted all adopted members of Taurus on a map of equatorial coordinates with symbols that indicate their assigned groups (or the absence of one). An extinction map is included to show the dark clouds. For each group, the members with parallax measurements are plotted in diagrams of versus distance and versus in Figures 2–5, which illustrate the spatial and kinematic clustering of the group members. Some of the stars in those diagrams have distances or proper motion offsets that are discrepant relative to their assigned groups, which are flagged in Table 2. Those stars are retained as members of groups because (1) their discrepant astrometry may be explained by poor astrometric fits based on their large values of RUWE, the presence of close companions, or large changes in parallax between DR2 and DR3 or (2) they appear to have experienced dynamical ejections, which applies to KPNO 15 and 2MASS J04355209+225503 (Luhman, 2018). Examples of members in the first category of outliers include MHO 3 in L1495/B209 (Figure 2) and GG Tau A, HD 28867 A, HD 30171, and V827 Tau in L1551 (Figure 5). All of these stars have large enough values of RUWE (1.6, Luhman & Esplin, 2020) to indicate that they may have poor astrometric fits. The parallaxes from DR2 and DR3 for MHO 3 differ significantly, further indicating that its DR3 astrometry may not be reliable. It is not surprising that GG Tau A would have a poor fit given that it is binary system with a separation just below the resolution of Gaia (, Leinert et al., 1991; White et al., 1999). HD 28867 A is also suspected to have a close companion that is unresolved in available imaging (, Walter et al., 2003). The astrometry of HD 28867 B, which has a separation of from the primary, agrees well with that of L1551.
Eight of the stars adopted as Taurus members by Esplin & Luhman (2019) have Gaia astrometry that is inconsistent with membership in the Taurus groups and seem to have reliable astrometry, so they have been rejected and are absent from Figures 2–5. The names of those stars were provided in Section 2.1.
In Section 6, I compare the Taurus groups defined in this work and to those from previous studies.
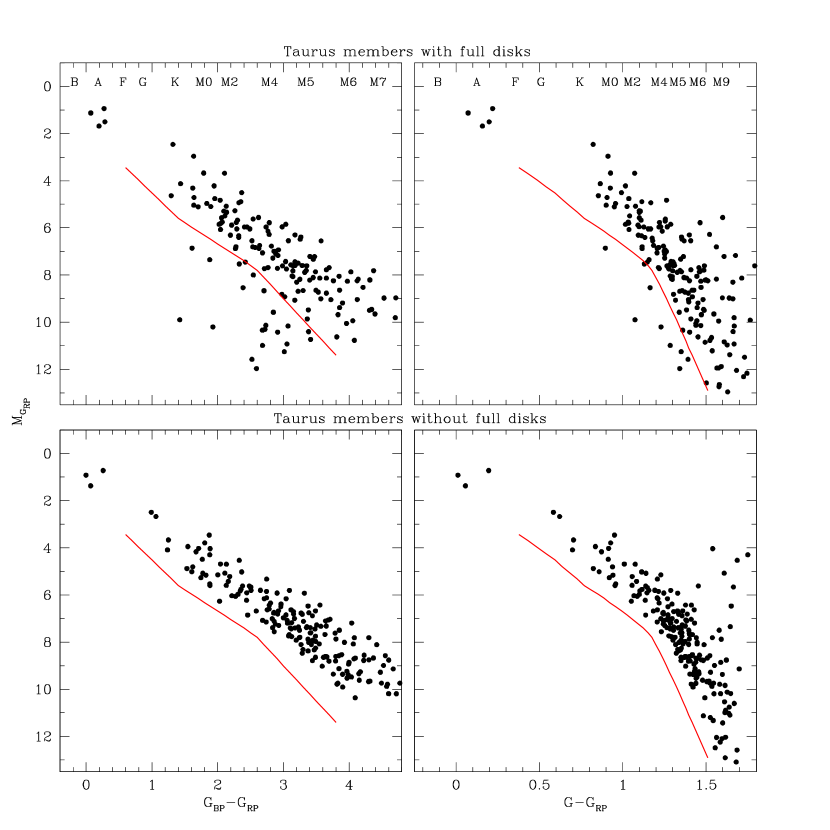
3.3. New Candidate Members of Taurus Groups
To illustrate the photometric selection criteria for my search for new members of Taurus, I have plotted diagrams of versus and in Figure 6 for the adopted members of Taurus that have parallax measurements. Separate diagrams are shown for stars with and without full disks. In each color, the latter form a well-defined sequence except for a few stars that are very red in for their magnitudes, which is likely a reflection of erroneous photometry in that is caused by contamination from close companions (Evans et al., 2018). Meanwhile, the sequence of stars with full disks includes an extension to relatively faint magnitudes at a given color, which can be explained by short-wavelength emission associated with accretion or scattered light from an edge-on disk. In Figure 6, I have marked the boundaries that I have previously used for selecting candidate members of populations in the Scorpius-Centaurus (Sco-Cen) OB association (Luhman, 2022a). I have applied those boundaries to my survey of Taurus as well. Thus, my survey is sensitive to stars in the same age range as found in Sco-Cen (20 Myr).
I have searched Gaia DR3 for stars that appear above one of the CMD boundaries in Figure 6, do not appear below either CMD boundary, overlap with the proper motion offsets of a Taurus group, are located within pc of a member of that group, and have mas. Only photometric data with errors less than 0.1 mag were utilized. Given that disk-bearing stars can appear below the CMD thresholds, I allowed the selection of stars below those thresholds if they exhibited mid-IR excess emission in data from WISE. This selection process has produced 22 candidates. All but one of the candidates are beyond the eastern boundary of the field considered in my previous surveys of Taurus. As discussed in Section 2.2, 13 of the candidates have spectroscopy available, all of which are confirmed to be young and have been adopted as members. The remaining nine candidates that lack spectra are presented in Table 3, which includes astrometry and photometry from Gaia DR3, radial and velocities, IR photometry from 2MASS and WISE, disk classifications, and Taurus group assignments.
4. A Search for Members of Young Associations near Taurus
4.1. Identification of Candidate Members
Many studies have found young stars in the general vicinity of the Taurus clouds that have kinematics or ages that seem inconsistent with membership in the groups associated with the clouds (Blaauw, 1956; Walter & Wolstencroft, 1988; Neuhäuser et al., 1995; Wichmann et al., 1996; Luhman, 2006; Slesnick et al., 2006; Daemgen et al., 2015; Kraus et al., 2017; Esplin & Luhman, 2017). Some of those stars have been identified as possible members of small groups (Mamajek, 2007, 2016; Bell et al., 2017; Liu et al., 2021; Kerr et al., 2021; Krolikowski et al., 2021) and larger associations (Luhman, 2018; Liu et al., 2020; Gagné et al., 2020). I have attempted to perform a systematic search for young associations that are near Taurus spatially and kinematically using Gaia DR3. I have considered Gaia sources with distances between 80 and 250 pc, right ascensions between 35 and 90, declinations between and 35, mas, and proper motion offsets of mas yr-1 when calculated for the median velocity of Taurus. For reference, the Pleiades cluster is within that volume of space but is beyond the thresholds for proper motion offsets and the opposite is true for the Per cluster. I selected candidate young low-mass stars with colors of and positions in CMDs above the sequence of Pleiades members (Stauffer et al., 2007), which has an age of Myr (Stauffer et al., 1998; Dahm, 2015). Among those candidates, I identified associations based on their clustering in proper motion offsets and spatial positions. For each association that was found, sequences of members were apparent in the two CMDs, so I defined boundaries that followed the lower envelopes of the sequences and used them to further refine the sample of candidate members. I defined criteria for the proper motion offsets that captured the refined sample of low-mass stellar candidates and I used those criteria and the CMD boundaries to select candidate members across the full range of stellar masses. For each association, the spatial positions of the resulting kinematic and CMD candidates exhibited a concentration surrounded by a very sparse population extending to the boundaries of the survey volume. The latter are likely dominated by field stars, so for a given association I report only the candidates in the spatial volume where they are concentrated. As done in Section 3 for Taurus, I have allowed the selection of candidates that appear below the CMD thresholds if they exhibit mid-IR excess emission in data from WISE. I have not attempted to identify white dwarfs in the associations, which would fall below the CMD thresholds as well.
After arriving at a sample of candidates for a given association, I searched for companions to those candidates that are in Gaia DR3 but did not satisfy the selection criteria. I retrieved DR3 sources that have separations of from the candidates and that (1) fail the kinematic criteria but satisfy the photometric criteria and share roughly similar parallaxes and proper motions as their neighboring candidates, (2) lack measurements of proper motion and parallax but satisfy the photometric criteria when adopting the distances of their neighboring candidates, or (3) satisfy the kinematic criteria but lack the photometry for the CMDs. The resulting objects have been included in my samples of candidate members of the associations.
In the next section, I describe the compilation of various data that are available for the candidates, which includes spectral classifications and radial velocity measurements. I have rejected each candidate that (1) has a nondetection of Li at 6707 Å that would be inconsistent with membership in the association in question or (2) has a radial velocity that produces a discrepant space velocity relative to the bulk of the candidates for a given association. In the latter scenario, a candidate is retained if its discrepant velocity may be due to binarity as indicated by the presence of multiple velocity measurements that span a large range.
Eight associations are detected in the vicinity of Taurus through my analysis. Their names and numbers of candidates are 32 Ori (169), Tau (354), 93 Tau (190), 69 Ori (591), HD 284346 (78), HD 33413 (47), HD 35187 (65), and V1362 Tau (53). The 32 Ori association was discovered by Mamajek (2007) and surveyed by Bell et al. (2017). My catalog of candidates for 32 Ori from Gaia DR3 is presented in Luhman (2022c). Catalogs for the other seven associations are presented in this work. The Tau association was discovered with Gaia DR2 by Liu et al. (2020) and Gagné et al. (2020). 93 Tau originated as group 29 from Oh et al. (2017), which consisted of nine stars selected from the first data release (DR1) of Gaia and expanded to 91 candidates with Gaia DR2 (Luhman, 2018). The brightest star in my new sample from DR3 is 93 Tau, which I have adopted as the name for that association. As with 93 Tau, I have named the five remaining associations after their brightest members. In Luhman (2022c) and Section 6, I compare my samples of candidates for the eight associations to those from previous studies.
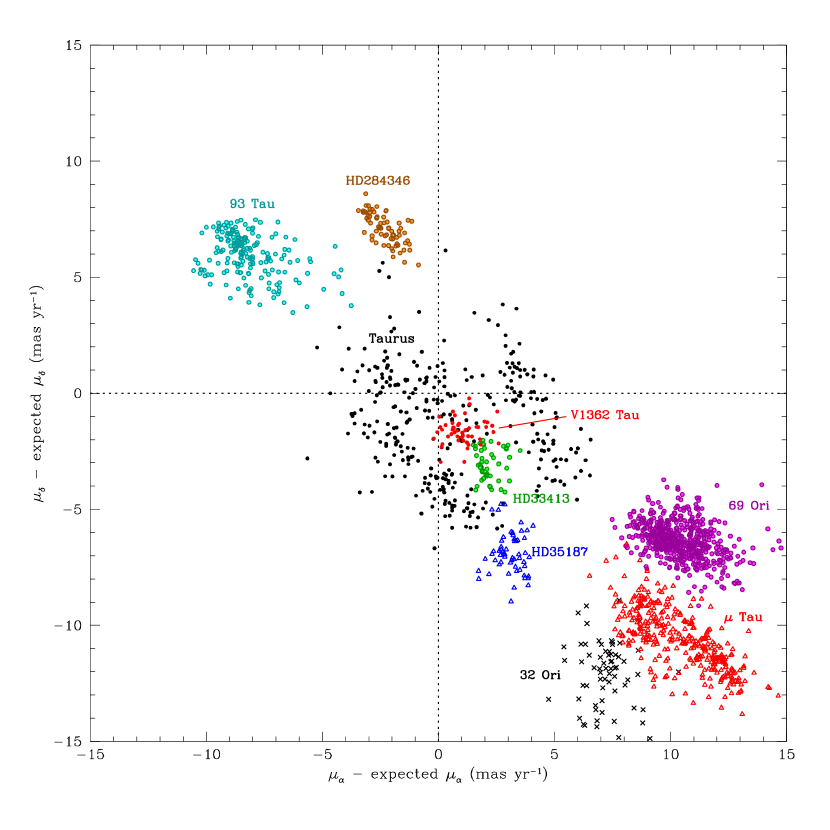
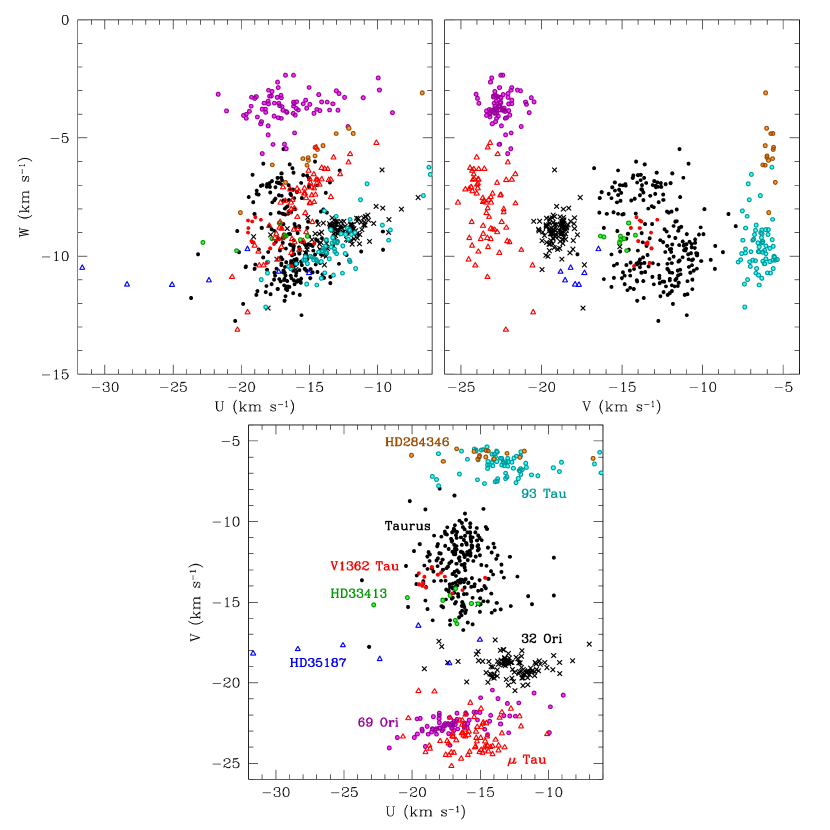
In Figure 7, I have plotted the proper motion offsets for the adopted members of Taurus and the candidate members of the eight neighboring associations, which are calculated for the median velocity of Taurus. The diagonal alignment of the associations is a reflection of the fact that their velocities differ primarily in (Section 5.5). Most of the associations have distinct kinematics in Figure 7 relative to Taurus. One of them, V1362 Tau, does overlap slightly with a Taurus group, L1544. Their kinematics, spatial distributions, and ages are compared in Section 6.6.
In a diagram of proper motion offsets like the one in Figure 7, the distribution of offsets for a group of stars will be broader for larger deviations from the velocity assumed when calculating the offsets (i.e., when the offsets are larger), particularly if the group is spread across a large area of sky. For instance, the associations in Figure 7 that are farther from the origin like 93 Tau and 32 Ori would be somewhat more tightly clustered (and near the origin) if their offsets were calculated with their median velocities rather than that of Taurus. As a result, the selection of candidates for an association is more refined if performed with proper motion offsets calculated for the association’s velocity. Therefore, after identifying a given association via its clustering in the proper motion offsets for the velocity of Taurus, I compiled the available radial velocities for the initial sample of candidates, calculated their space velocities, derived new proper motion offsets for their median velocity, and repeated the identification of candidates via the clustering of the new offsets.
The distributions of the Taurus groups and the neighboring associations on the sky are compared in a map of equatorial coordinates in Figure 8. 32 Ori, 93 Tau, and HD 284346 overlap with the main complex of Taurus groups while four of the other associations are near the two easternmost Taurus groups, L1517 and L1544. The properties of the stellar populations in the associations near Taurus (e.g., ages, spatial and kinematic distributions) are investigated in Section 5.
4.2. Compilation of Data
A compilation of data for the candidate members of 32 Ori is provided in Luhman (2022c). The candidates for the remaining seven associations near Taurus are presented in Table 4, which includes source names from Gaia DR3 and previous studies; equatorial coordinates, proper motion, parallax, RUWE, and photometry from Gaia DR3; measurements of spectral types and the type adopted in this work; distance estimate based on the Gaia DR3 parallax (Bailer-Jones et al., 2021); the most accurate available radial velocity measurement that has an error less than 4 km s-1; VSCATTER from APOGEE-2; velocities; the designations and angular separations of the closest sources within from 2MASS and WISE; flags indicating whether the Gaia source is the closest match in DR3 for the 2MASS and WISE sources; photometry from 2MASS and WISE; flags indicating whether excesses are detected in three WISE bands and a disk classification if excess emission is detected (Section 5.4); and the name of the association to which the candidate is assigned. Some of the compiled spectral types have been measured in this work. I have classified an IRTF/SpeX spectrum from Zhang et al. (2018), an optical spectrum obtained during the observations with the MMT Red Channel Spectrograph (Schmidt et al., 1989) described in Esplin & Luhman (2019), optical spectra of 51 candidates in 93 Tau that I collected with the Gemini Multi-Object Spectrograph (GMOS; Hook et al., 2004) at the Gemini North telescope, and optical spectra from LAMOST DR7 for 391 candidates. Among the 1378 candidates in Table 4, 556 have spectral classifications and 274 have measurements of radial velocities.
5. Properties of the Stellar Populations in Taurus and Neighboring Associations
5.1. Spectral Types and Extinctions
Portions of my analysis of the stellar populations in Taurus and neighboring associations require spectral types and extinctions for the members that have parallax measurements. Most of the adopted members of Taurus have spectral classifications (Table 2) and extinction estimates (Esplin & Luhman, 2019), including nearly all of those with parallax data. For the stars in Taurus and neighboring associations that have spectral types but no previous estimates of extinction, I have derived extinctions from color excesses in , , , or (in order of preference) relative to the intrinsic colors of young stars at a given spectral type (Luhman, 2022a).
Spectroscopy is not available for the nine Taurus candidates (Table 3)222The Taurus candidates are not projected against dark clouds, so their extinctions are expected to be low. Eight of the nine candidates have colors that indicate extinctions of . and most of the candidates in the associations. For those stars, I have estimated spectral types and extinctions by dereddening their observed colors to the sequences of intrinsic colors of young stars in diagrams of and versus using the extinction curve from Schlafly et al. (2016). Stars with types of K5–M5 have the most accurate estimates of spectral types and extinctions from that process since the reddening vectors are closest to perpendicular to the sequences of intrinsic colors among those types. Because the Gaia filters are broad, the reddening relation for a color that includes a Gaia band depends significantly on the intrinsic spectrum and extinction of a star. I derived extinction relations among the bands in question as a function of extinction and effective temperature in the manner done by Luhman & Esplin (2020) for Gaia DR2 but with the filter profiles for DR3 (Riello et al., 2021). For each star, I dereddened the observed colors to the intrinsic colors of young stars using the reddening relations for and a temperature that corresponds to the spectral type implied by the observed color, producing an initial estimate of extinction. The dereddening process was then iteratively repeated using the reddening relations for the new extinction and temperature (as implied by the spectral type) until converging on the final values.
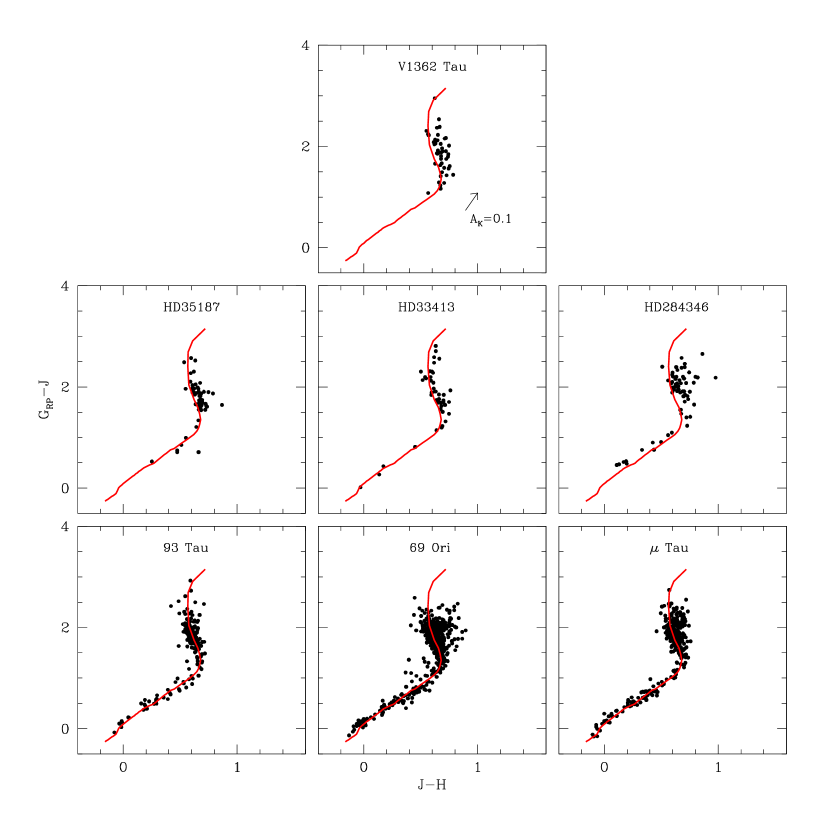
To illustrate the levels of extinction for the associations near Taurus, I have plotted their candidate members with the typical intrinsic colors of young stars in diagrams of versus in Figure 9. Among K5–M5 stars, which have the most accurate extinction estimates when spectral types are not available, the median values of are 0.043 (V1362 Tau), 0.029 (HD 35187), 0.021 (HD 33413), 0.055 (HD 284346), 0.003 (93 Tau), 0.012 (69 Ori), and 0.015 ( Tau). A similar diagram for 32 Ori indicates negligible extinction (Luhman, 2022c). As expected, extinction is lowest in the closest associations. HD 284346 has the highest reddening since it is behind the Taurus clouds. The western edge of 69 Ori also extends behind Taurus, resulting in a small number of members at somewhat higher reddenings.
5.2. Initial Mass Functions
The census of Taurus from Esplin & Luhman (2019) was estimated to have a high level of completeness for (1) spectral types earlier than M6–M7 at within a field encompassing all of the Taurus clouds and (2) spectral types of L0 at within fields covering a large fraction of the known members. The completeness estimates for those two samples were primarily based on Gaia DR2 and deep optical and IR imaging, respectively. Since my new work with Gaia DR3 has produced only minor changes to the census of Taurus, it is unnecessary to update the analysis of the initial mass function (IMF) in Taurus from Esplin & Luhman (2019).
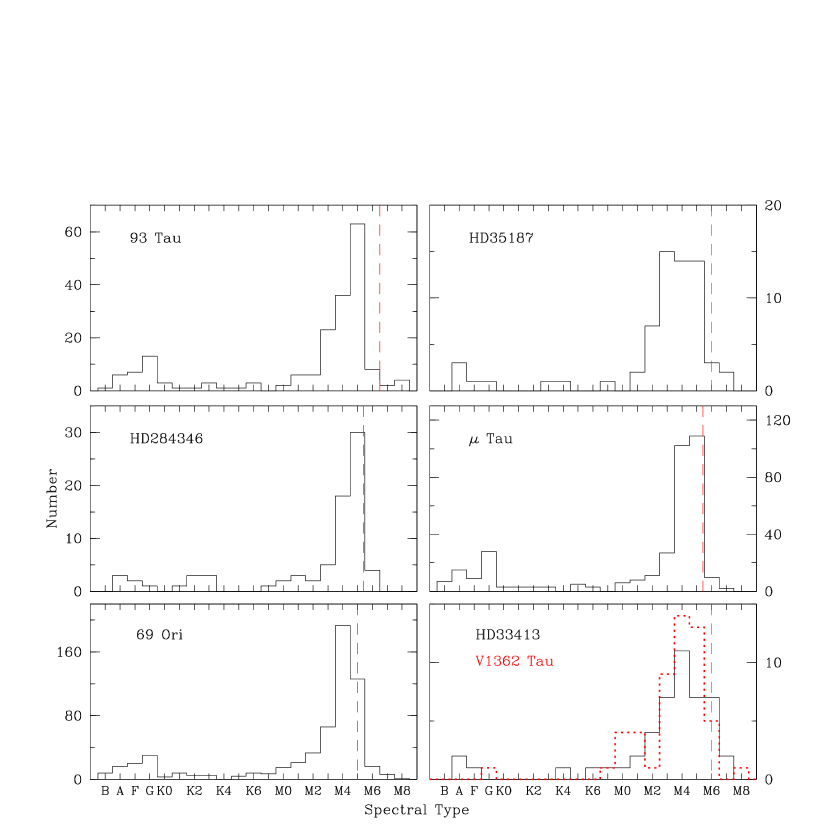
For the associations near Taurus, I choose to use histograms of spectral types as observational proxies for their IMFs, as done in my previous work in Taurus and other nearby young populations. The photometric estimates of spectral types from the previous section are used for stars that lack spectroscopy. Luhman (2022c) presented a histogram of spectral types for 32 Ori. The histograms for the remaining associations near Taurus are plotted in Figure 10. The completeness limits are marked, which were derived in the manner described by Luhman (2022c). All of the associations exhibit a prominent peak near M5 ( ), resembling the distributions in Taurus (Esplin & Luhman, 2019) and other nearby associations and star-forming regions (e.g., Luhman, 2022a).
5.3. Ages
The ages of young stellar populations can be estimated via their sequences of low-mass stars in the Hertzsprung-Russell (H-R) diagram (Herczeg & Hillenbrand, 2015). For the Taurus groups and the neighboring associations, I have constructed H-R diagrams in parameters that should minimize the combined errors associated with extinction correction, disk-related emission, and the measurement of photometry given the data that are available. For the H-R diagrams in Taurus, I have selected spectral types as proxies for effective temperatures because they are available for nearly all of the Gaia-detected members and are not affected by extinction or disk emission when measured properly. Because some Taurus members have significant extinction, I have selected absolute magnitudes in from 2MASS () to represent the luminosities, which is long enough in wavelength that extinction is low while short enough in wavelength that emission from non-full disks is negligible. The lower precision of the 2MASS photometry relative to the Gaia data should be more than compensated by the smaller errors in the extinction corrections. For the associations near Taurus, the optimal approach is to construct the H-R diagrams with and since these bands have high precision, are available for most of the candidates, and are not subject to large errors in extinction corrections given the low extinctions of the associations. Since extinction varies significantly among the members of Taurus, their individual extinction estimates are used to correct their photometry in (Section 5.1). The extinctions within the other associations span very small ranges (Figure 9), so I have corrected the Gaia photometry using the median value of in a given association (Section 5.1).
In addition to the groups and associations surveyed in this work, I have included in my age analysis two young clusters in the vicinity of Taurus that are rich and well-studied: the Pleiades and Per. For the Pleiades, I have adopted the sample of members from Stauffer et al. (2007) after rejecting a few kinematic and photometric outliers based on Gaia DR3. For Per, I have identified a sample of candidate members within a radius field containing the cluster core using data from Gaia DR3 and the methods from Section 4. Alternative catalogs of members of these two clusters selected with Gaia DR2 are available from Lodieu et al. (2019). The Gaia data for the Pleiades have been corrected for an extinction of (Stauffer et al., 2007). An extinction correction of has been applied to the candidates in Per, which is the median value derived from color-color diagrams in the manner described earlier for other associations.
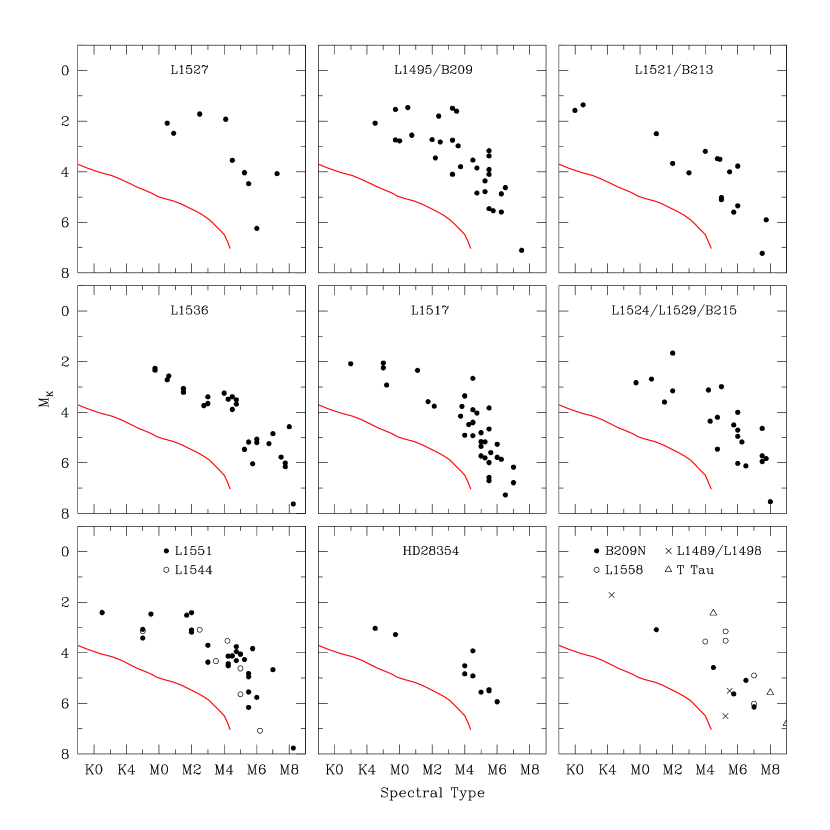
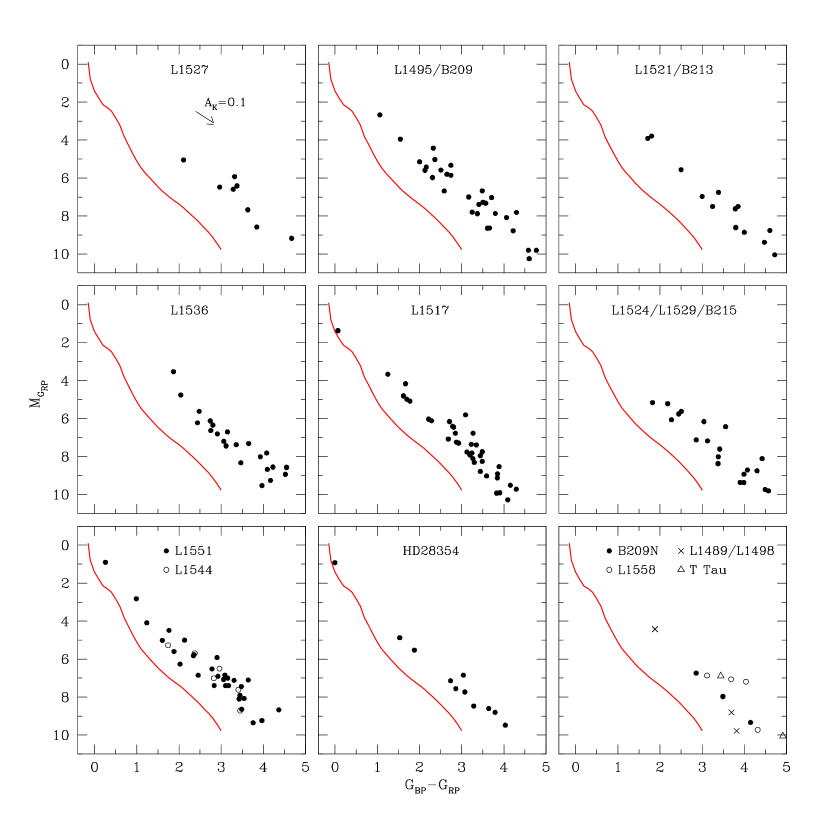
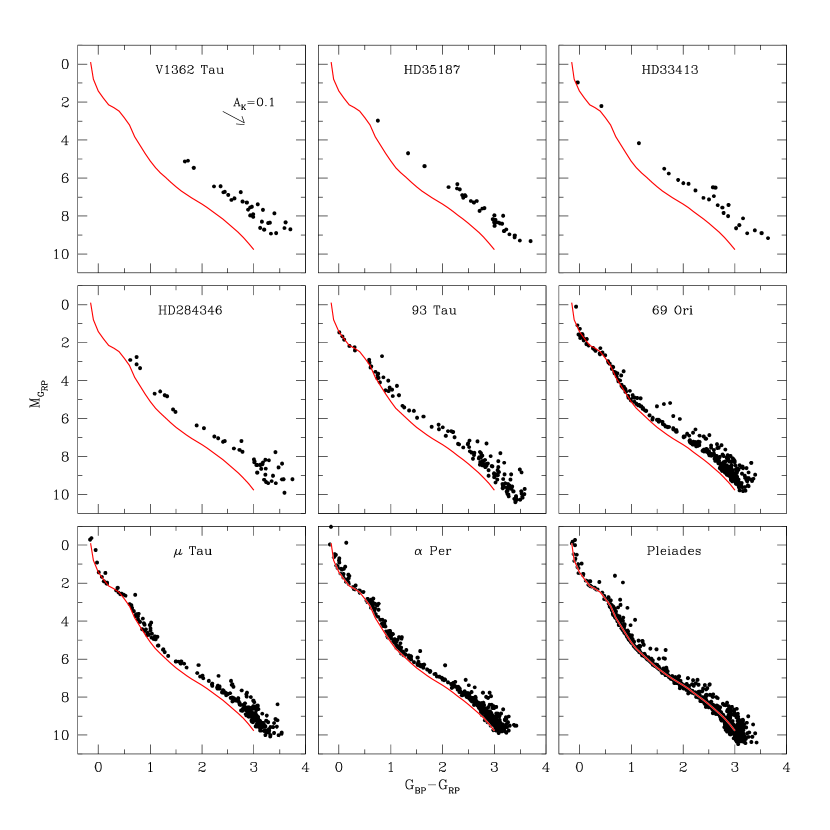
For all H-R diagrams, I have excluded stars with full disks to mitigate contamination of the photometry by disk-related emission. Because the uncertainties in the age estimates depend in part on the errors in the distances and photometry, I have included only the candidates that have RUWE1.6, mas, , and in the CMDs for the associations near Taurus. Meanwhile, Taurus members with mas are considered, but for those with mas, the median distances of their groups are adopted when calculating . For the CMD of 69 Ori, I have omitted the small subset of candidates that are behind the Taurus clouds since they have higher extinctions. The diagrams of extinction-corrected versus spectral type for the Taurus groups are shown in Figure 11. In each diagram, I have marked a fit to the single-star sequence of the Pleiades in a diagram of versus , which has been converted to and spectral type using the typical intrinsic colors of young stars (Luhman, 2022a). Although they are not used in the age analysis, I also have plotted the observed CMDs (no extinction corrections) of the Taurus groups in Figure 12 for reference. In Figure 13, I present the extinction-corrected CMDs for the associations near Taurus and the Per and Pleiades clusters. A CMD in the same bands for 32 Ori is provided in Luhman (2022c). In Figures 11–13, the populations are shown in order of the ages implied by their sequences with the exception of one H-R diagram that combines the four smallest Taurus groups (B209N, L1558, L1489/L1498, T Tau). As found in many previous studies, the sequences of low-mass stars are broadest in absolute magnitude at the youngest ages and become narrower at older ages. At old enough ages, the sequences are sufficiently well-defined that separate sequences of single stars and unresolved binaries are detected, as shown in Figure 13.
To estimate ages from the sequences of low-mass stars in the H-R diagrams, I have considered stars within a range of across which the sequences are predicted to fade at a similar rate for ages of 1–80 Myr (i.e., the isochrones maintain a similar shape over time). Based on theoretical evolutionary models (Baraffe et al., 2015; Choi et al., 2016; Dotter, 2016; Feiden, 2016), I have selected –2.8 for the associations, which corresponds to spectral types of K4–M4 (Luhman, 2022a), temperatures of 3300–4400 K, and masses of 0.2–1 . I have closely compared the median sequences within that color range for 32 Ori, Upper Centaurus-Lupus/Lower Centaurus-Crux (UCL/LCC), and the associations and clusters in Figure 12, finding that they do not show significant changes in shape with age until reaching the oldest population, the Pleiades, whose the sequence becomes slightly steeper at in agreement with model predictions. To alleviate the small number statistics in the Taurus groups, I extend the range of spectral types considered in their age analysis to M5.
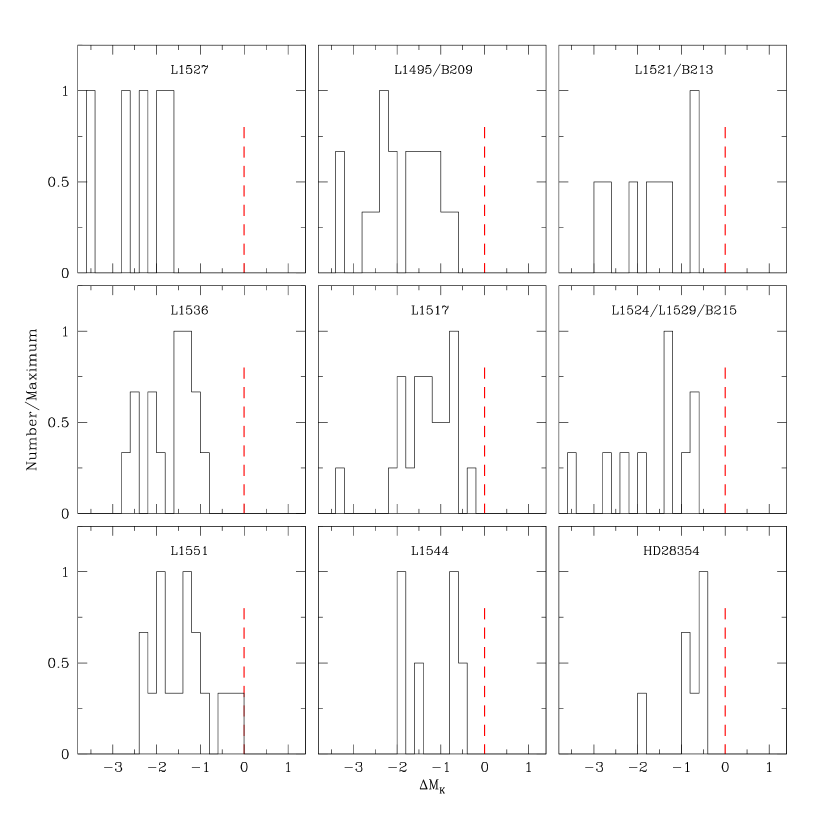
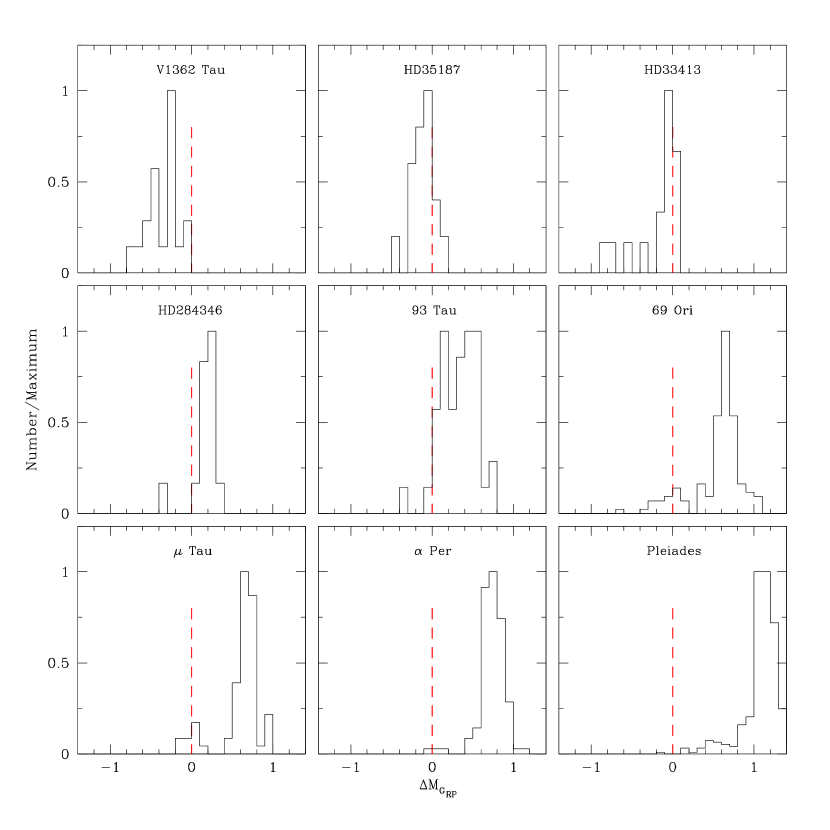
For the K4–M5 Taurus members in Figure 11 and the stars between –2.8 in Figure 13, I have calculated offsets in and from a fit to the median of the sequence for UCL/LCC (Luhman, 2022a), which is provided in Table 5. That median sequence was derived in the CMD and then converted to spectral type and using the intrinsic colors of young stars as a function of spectral types from Luhman (2022a). Histograms of the resulting offsets in and are presented in Figures 14 and 15, respectively. Similar measurements for 32 Ori are found in Luhman (2022c). I have not attempted to estimate the ages of the four smallest Taurus groups, so their histograms are not shown. For the Pleiades, the offsets for are excluded since the cluster is old enough that those stars are no longer fading at the same rate as younger stars. I have calculated the median and the median absolute deviation (MAD) of the offsets in each population, which appear as M in Table 6. I have derived ages from those median offsets by assuming that UCL/LCC (M=0) has an age of 20 Myr (Luhman, 2022a) and that log L/log age, which describes the typical evolution of isochrones that has been predicted for the temperature range in question (Baraffe et al., 2015; Choi et al., 2016; Dotter, 2016; Feiden, 2016). The resulting ages are included in Table 6. The quoted errors reflect only the MAD of the offsets and do not include systematic errors, which may vary with age. In Luhman (2022c), I found that 32 Ori is coeval with UCL/LCC based on this kind of analysis.
Eight of the nine Taurus groups in Table 6 have median ages between 1 and 3 Myr while the remaining group, HD 28354, as an age of 6 Myr. The age uncertainties are large enough that most of the groups could be coeval. The ages of the associations near Taurus that I have surveyed range from 13–56 Myr. These ages are based on an adopted age of 20 Myr for UCL/LCC, which in turn is tied to the lithium depletion boundary (LDB) age for the Pic moving group (Binks & Jeffries, 2016), as discussed in Luhman (2022a). In addition, my age of 12424 Myr for the Pleiades is consistent with estimates of Myr and Myr based on the LDB (Stauffer et al., 1998; Dahm, 2015). Meanwhile, my age of Myr for Per is younger than the LDB age of Myr from Barrado y Navascués et al. (2004). An age younger than the LDB value also has been produced for Per by isochrone fitting of a CMD from Gaia DR2 (70 Myr, Gaia Collaboration et al., 2018).
5.4. Circumstellar Disks
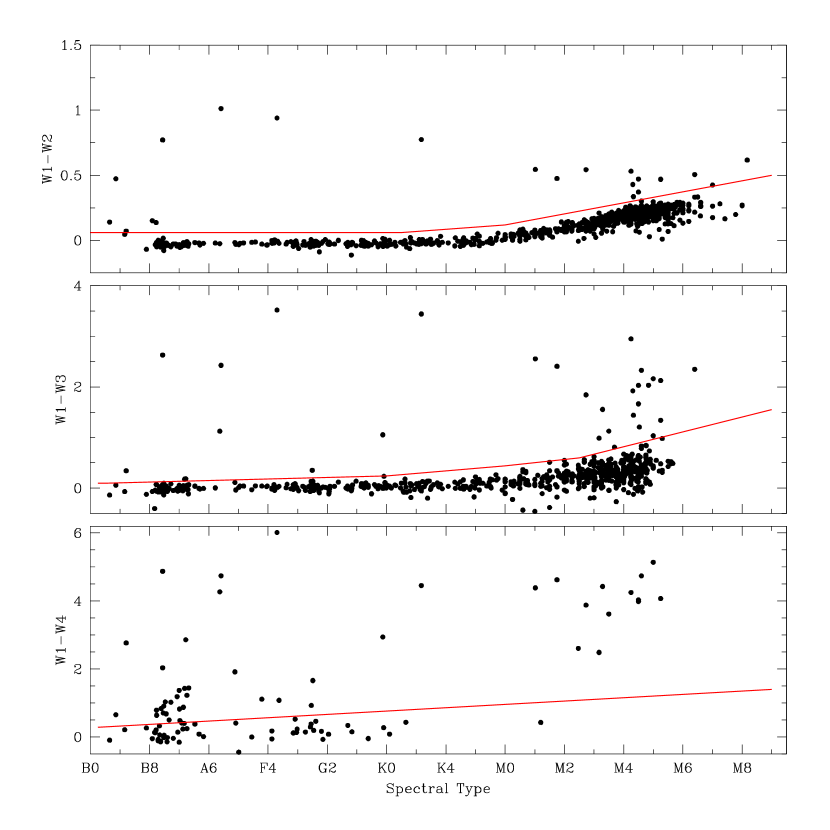
As mentioned in Section 2.3, disk classifications for my adopted members of Taurus are provided in Esplin & Luhman (2019) and Table 1. For the candidate members of the associations near Taurus, I have used mid-IR photometry from WISE to search for evidence of disks. The WISE images were obtained in bands centered at 3.4, 4.6, 12, and 22 m, which are denoted as W1, W2, W3, and W4, respectively. The 1378 candidates in the associations have 1291 matching sources from WISE. If a close pair of candidates has the same WISE source as their closest match, the WISE designation appears in both of their entries in Table 4, but the disk measurements are listed only for the candidate that is closest to the WISE source. I have visually inspected the AllWISE Atlas images of the WISE sources to check for detections that are false or unreliable, which are marked by a flag in Table 4.
I have used W1W2, W1W3, and W1W4 to detect excess emission from disks among the 1291 WISE sources (Luhman, 2022a). Those colors are plotted versus spectral type in Figure 16. The W2 data at W26 have been omitted since they are subject to significant systematic errors (Cutri et al., 2012). Photometric estimates of spectral types are adopted for stars that lack spectroscopy (Section 5.1). In each of the three colors in Figure 16, most stars form a well-defined sequence that corresponds to stellar photospheres. A small number of stars have redder colors that indicate the presence of IR excess emission. In Figure 16, I have marked the threshold for each color that was used by Luhman (2022b) for identifying color excesses. If a star appears above a threshold but a detection at a longer wavelength is consistent with a photosphere, an excess is not assigned to the first band. Table 4 includes flags that indicate whether excesses are present in W2, W3, and W4. The IR excess for the A-type star HD 284470 was flagged as confused by Rebull et al. (2011), likely because of blending with a fainter companion at a separation of . However, I find that the two stars are sufficiently resolved that the WISE photometry should be reliable.
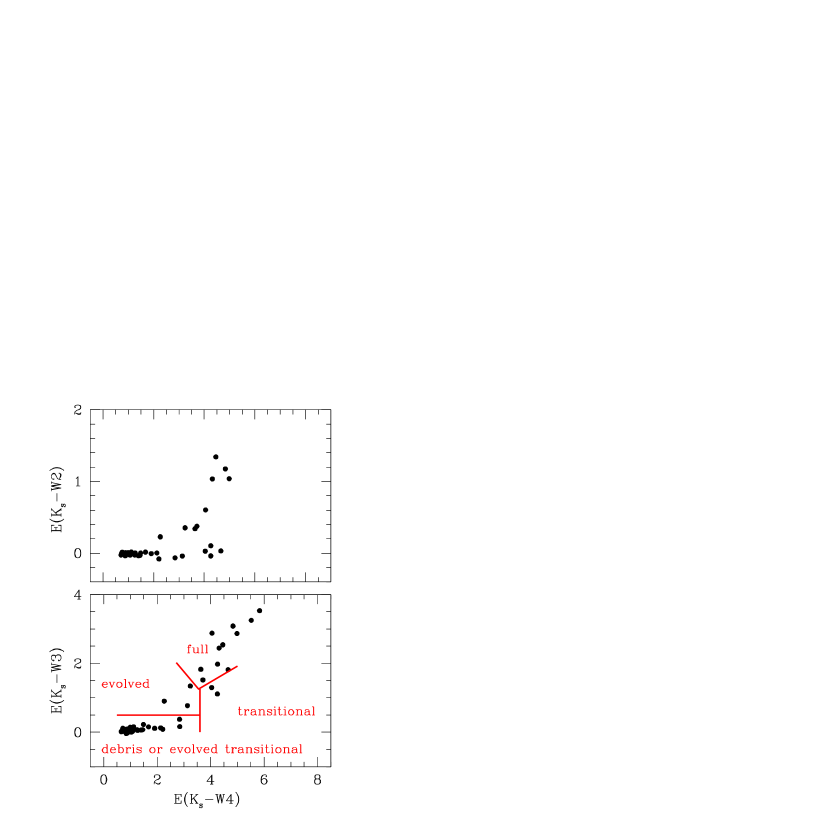
I have classified the evolutionary stages of the detected disks from among the following options: full disk, transitional disk, evolved disk, evolved transitional disk, and debris disk (Kenyon & Bromley, 2005; Rieke et al., 2005; Hernández et al., 2007; Luhman et al., 2010; Espaillat et al., 2012). All of these classes except for the last one are primordial disks. The classes are assigned based on the sizes of the excesses in W3 and W4 (Luhman & Mamajek, 2012; Esplin et al., 2014, 2018). I have calculated the color excesses, E(W3) and E(W4), by subtracting the expected photospheric color for a given spectral type (Luhman, 2022a). The resulting excesses are presented in Figure 17 with the criteria for the disk classes (Esplin et al., 2018). To illustrate the sizes of the excesses in W2, I have included E(W2) as well. As shown in Figure 17, the same criteria apply to debris and evolved transitional disks, which are indistinguishable in mid-IR photometry. Sources that lack excesses in any of the WISE bands are omitted from Figure 17 and are listed as class III.
IR excesses are detected for 51 of the WISE sources, 31 of which have had disks reported in previous work (Walter & Wolstencroft, 1988; Oudmaijer et al., 1992; The et al., 1994; Luhman et al., 2006; Rebull et al., 2011; McDonald et al., 2012, 2017; Esplin et al., 2014; Cotten & Song, 2016; Theissen & West, 2017; Liu et al., 2021). The IR excess sources are classified as 18 full, two transitional, three evolved, three evolved or transitional, and 25 debris or evolved transitional disks. Most of the disk-bearing stars have not been previously recognized as members of associations. My age estimates for those associations can be useful for interpreting observations of the disks. In addition, primordial disks are rare at the ages in question (Luhman, 2022b), making them valuable for studies of disk evolution (Boucher et al., 2016; Silverberg et al., 2016, 2020; Murphy et al., 2018; Flaherty et al., 2019; Lee et al., 2020). Three of the full disks are in well-known Herbig Ae/Be systems (HD 35187, CQ Tau, MWC 758), all of which are candidate members of the HD 35187 association (18 Myr, Section 5.3). All but one of the disks classified as debris or evolved transitional have spectral types of G0. For the stars with IR excesses that lack spectroscopy, measurements of spectral classifications and radial velocities would be useful for confirming their youth and better constraining their membership.
5.5. Spatial and Kinematic Distributions
Several aspects of the spatial and kinematic distributions in Taurus and its neighboring associations can be investigated using the astrometry from Gaia DR3 and the radial velocities (and corresponding velocities) that have been compiled in Sections 2.3 and 4.2 (Tables 2 and 4). For each group and association, I have calculated the median values of the parallactic distances, proper motions, and velocities and the standard deviations of the velocities, excluding the stars flagged as astrometric outliers in Tables 2. I also have omitted sources with VSCATTER km s-1 from the velocity calculations. The results for the Taurus groups and the seven associations surveyed in this work are presented in Table 7. The median velocity for 32 Ori is km s-1 (Luhman, 2022c). From my sample of candidate members of Per, I have calculated a median velocity of km s-1, which is similar to the value for Tau.
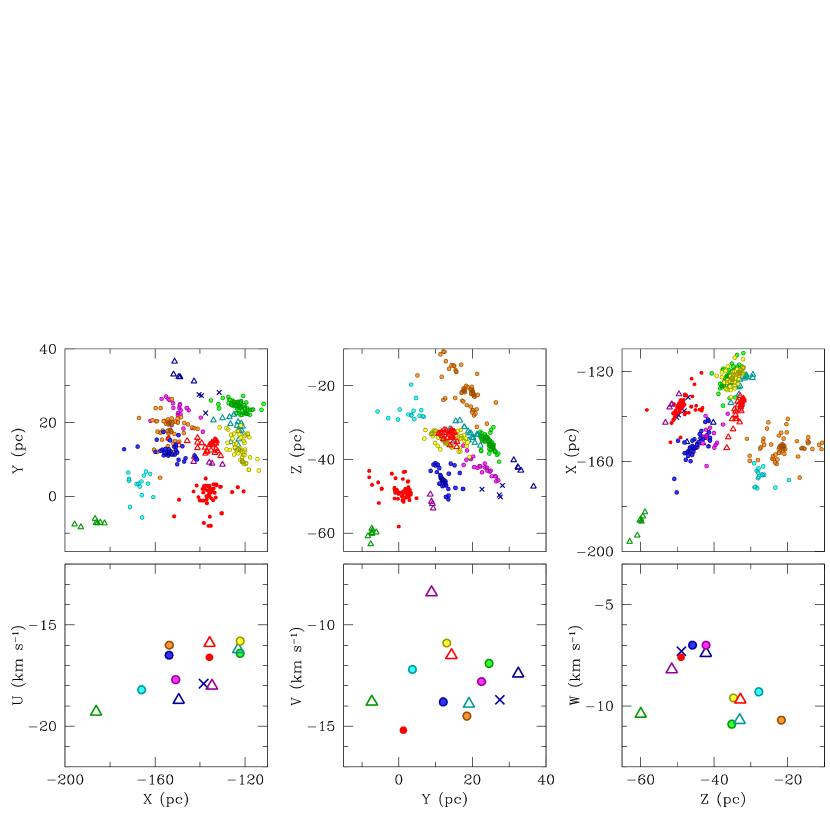
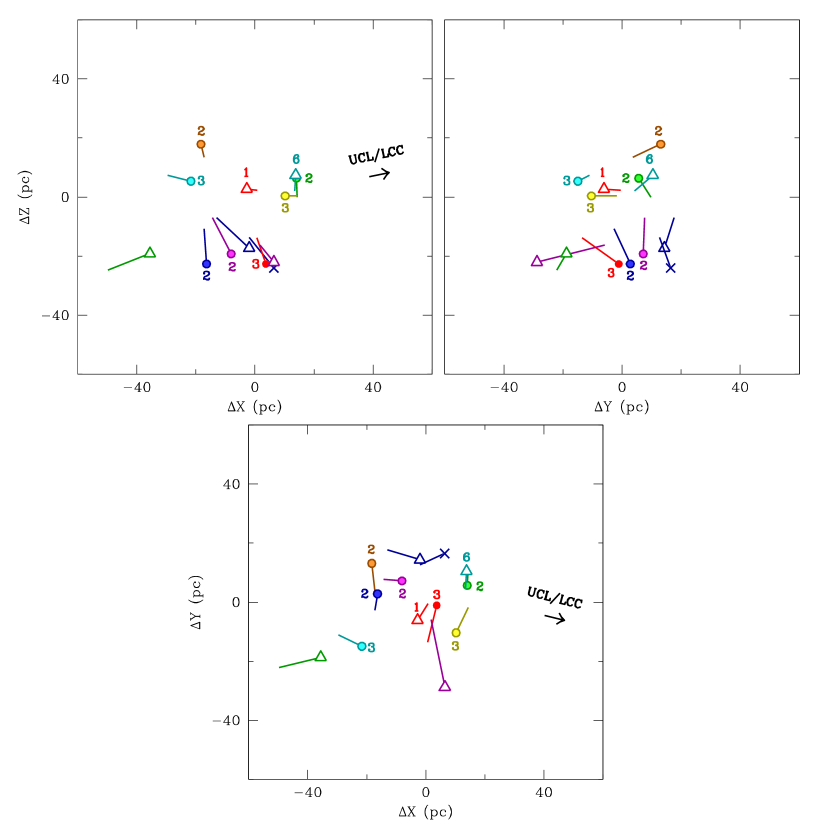
To illustrate the spatial clustering of the Taurus groups, I have plotted in the top row of Figure 18 the positions in Galactic Cartesian coordinates for the group members that have mas using the symbols in the map from Figure 1. The bottom row of Figure 18 shows the three components of the median velocities of the groups versus their respective spatial positions. The groups exhibit a correlation between and and an anti-correlation between and , which indicates that portions of the complex are expanding in and contracting in .
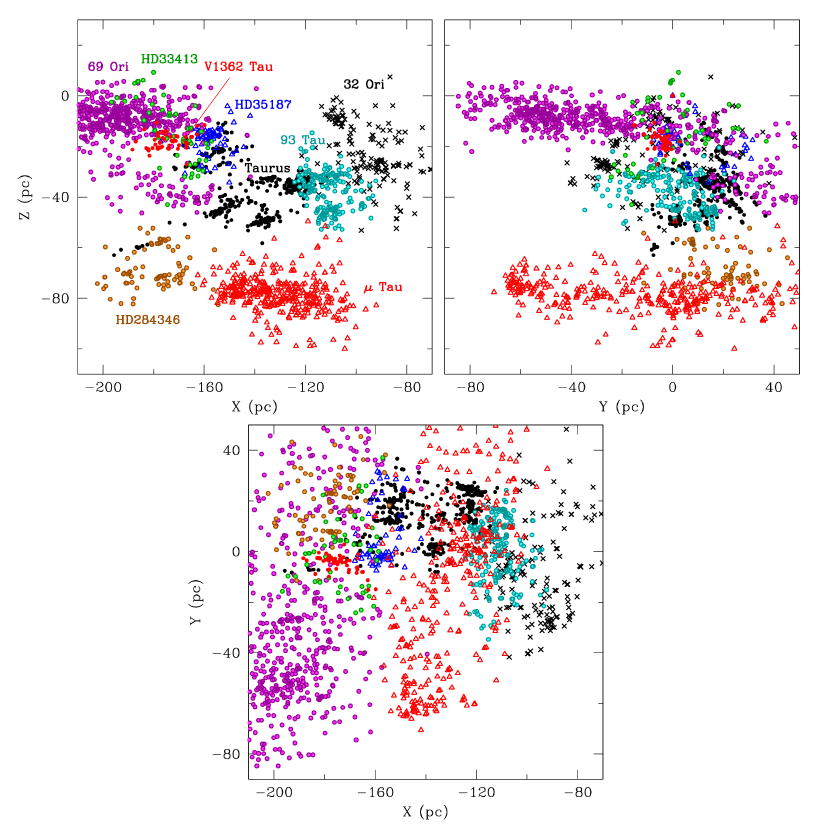
To compare the spatial distributions of the Taurus groups and the neighboring associations, I have plotted in Figure 19 the positions of their members using the symbols from the map in Figure 8. Although Taurus overlaps with several associations on the sky, most of the Taurus groups are fairly well isolated from the surrounding associations in spatial positions. Since Taurus is near the Galactic anticenter, distance is roughly along the axis. For instance, 32 Ori and 93 Tau are in the foreground of Taurus. The two largest associations, 69 Ori and Tau, are broader in and than in , i.e., they have sheet-like distributions that are parallel to the Galactic plane.
Figure 20 shows the velocities that are available in Taurus and the associations with the exception of the astrometric outliers and the stars with VSCATTER km s-1. For most stars, the radial velocities contribute much larger errors than the proper motions. Those large radial velocity errors produce the stretching that is evident among the velocities in Figure 20. The angle of the stretching varies among the associations because of their differing positions on the sky. Taurus and the surrounding associations exhibited distinct kinematics in terms of proper motion offsets in Figure 7 and the same is true for the velocities in Figure 20.
Previous studies have proposed that the expansion of the Local Bubble was propelled by a series of supernovae in UCL/LCC beginning 10–15 Myr ago (Maíz-Apellániz, 2001; Fuchs et al., 2006, 2009), which resulted in the formation of many of the nearest molecular clouds, including Taurus, and the triggering of star formation within them (Zucker et al., 2022). I have examined whether the positions and ages of the groups in Taurus show a pattern that would support that scenario. I have calculated the positions of the Taurus groups and UCL/LCC 5 Myr ago (5 Myr) using their median positions and velocities (Table 7, Luhman, 2022a) and an epicyclic approximation of Galactic orbital motion (Makarov et al., 2004). I selected 5 Myr because it is roughly similar to the oldest ages of the Taurus groups. The results of this exercise are not sensitive to the value that is adopted. In Figure 21, I have plotted the offsets in of the Taurus groups from the median position of Taurus at Myr using the symbols from Figure 1. I also include lines that represent the motion of the groups over the past 5 Myr (i.e., the end of a line that has no symbol is the current position of a group). The groups with age estimates from Table 6 are labeled with those ages after rounding to the nearest integer. From the point of view of the Taurus clouds at that time, an expanding shell from UCL/LCC should have arrived from a direction between the direction of UCL/LCC at the time that the supernovae began ( Myr, Zucker et al., 2022) and UCL/LCC’s direction when the shell arrived at Taurus ( Myr). There is little difference between those two directions since most of the relative motion of UCL/LCC and Taurus is along the axis between them. The direction of UCL/LCC at Myr is indicated in Figure 21.
Assuming an expansion velocity of 8 km s-1 for the Local Bubble at Myr (Zucker et al., 2022), the expanding shell would have crossed the Taurus clouds in 5 Myr. Thus, one might expect an age gradient of 5 Myr across the Taurus groups along the direction toward UCL/LCC. Although the ages of the groups have large uncertainties, a gradient of that size could be marginally detectable. The oldest group, HD 28354 (6 Myr), is indeed on the side of the Taurus complex facing UCL/LCC, but the two other groups on that side of Taurus appear to have younger ages of 2–3 Myr. The remaining groups that are farther from UCL/LCC have similar ages (–3 Myr). It is possible that the interface between the interstellar medium and the Local Bubble was too clumpy and irregular for a clear correlation between age and distance to appear. Meanwhile, all of the associations in the vicinity of Taurus discussed in this work are too old for UCL/LCC to have played a role in their formation.
Kraus et al. (2017), Kerr et al. (2021), and Krolikowski et al. (2021) have proposed that previous samples of older stars near Taurus ( Myr) have a relationship with the Taurus clouds. There are two possible forms for a relationship: (1) the older stars were born within the existing Taurus clouds or (2) they were born from clouds that were connected to the gas that eventually formed the Taurus clouds, i.e., the Taurus groups and the older stars represent different generations of star formation within a cloud complex. In the first scenario, the older stars should have the same average velocities as the younger stars associated with the Taurus clouds. However, the stars from Kraus et al. (2017), Kerr et al. (2021), and Krolikowski et al. (2021) that were proposed as older members of Taurus do not share the same motions with the Taurus groups based on their proper motion offsets and velocities (Luhman, 2018, Section 6). The same is true for the associations near Taurus, as shown in Figures 7 and 20.
In the second scenario, the neighboring clouds that produced the different epochs of star formation should have motions that are similar or differ only modestly, so the same would be true for the stellar populations that they generated. Today, those populations would overlap spatially or they would have drifted apart. In the latter case, the two populations should still trace back to adjacent locations in the past. For each association near Taurus, I have calculated its distance from each of the Taurus groups (or its progenitor gas) when the association was born using the median positions and velocities of the association and the Taurus groups and the epicyclic approximation of Galactic orbital motion. The V1362 Tau association (13 Myr) traces back to within pc from the past location of the L1527 group, which is near the center of Taurus. None of the other associations had birth sites within 30 pc of any of the Taurus groups. Although the HD 35187 association overlaps with one of the Taurus groups on the sky (L1517, Section 6.6), their differing velocities indicate they would have been widely separated (100 pc) when HD 35187 was born. Thus, V1362 Tau is the only one of the associations that could have a relationship with Taurus. It is not possible to conclusively assess that possibility. Given the number of associations in the vicinity of Taurus, a close approach between a cloud complex with the size of Taurus and an unrelated association is plausible.
When assessing whether the Taurus groups belong to a complex that has produced earlier episodes of star formation, it is useful to consider the properties of known complexes of that kind. Two of the nearest examples of molecular clouds that are related to older generations of stars are Corona Australis and Ophiuchus. In both cases, (1) the cloud and its associated stars are located within a richer and more extended distribution of older stars (10–15 Myr, Upper Corona Australis and Upper Sco) and (2) the older population spans a broader range of velocities that encompasses the narrower range of velocities of the younger stars (Luhman & Esplin, 2020; Luhman, 2022a; Esplin & Luhman, 2022). An older population with those characteristics is not present in the Taurus complex.
6. Comparison to Recent Studies
6.1. Galli et al. (2019)
Galli et al. (2019) applied a hierarchical clustering algorithm to the equatorial coordinates, proper motions, and parallaxes of 519 candidate Taurus members from Joncour et al. (2017) and Luhman (2018) that had measurements of proper motions and parallaxes from Gaia DR2 or radio interferometry. My catalog of adopted members includes 485 of those stars. I classify the remaining 34 stars from Galli et al. (2019) as likely nonmembers. The analysis from that study produced 21 clusters, half of which contain only 2–5 stars per cluster. Two of those small clusters,#2 and #5, are entirely nonmembers. For seven clusters, their cluster corresponds to a subset of a single group from Section 3.2 (i.e., the two studies identify the same groups). However, five of my groups (L1517, L1521/B213, L1524/L1529/B215, L1527, HD 28354) are each broken into 2–4 clusters in Galli et al. (2019), which is likely partially due to the fact that their clustering analysis did not account for the projection effects that can cause stars with similar velocities to have different proper motions, particularly in a population like Taurus that is widely distributed on the sky. Even with corrections for projected effects, a clustering analysis performed in part on celestial coordinates is susceptible to breaking an association into small fragments if it is clumpy (Gagné et al., 2020). Finally, one of their clusters (#7) is a mixture of two of my groups, L1495/B209 and HD 28354. These two groups are adjacent spatially, but have different kinematics and ages (Section 5).
6.2. Roccatagliata et al. (2020)
Roccatagliata et al. (2020) used a maximum likelihood technique to fit the Gaia DR2 proper motions and parallaxes of a selection of 283 candidate members of Taurus from Esplin & Luhman (2019) in terms of multiple populations, each of which was defined by means and dispersions in parallax and proper motion and a normalization factor that accounted for the fraction of all stars in the population. Their analysis produced six populations. Five of their populations contain stars that span three or more of the Taurus groups defined in this work. For some of the populations, most notably “Taurus D”, the stars are projected against multiple clouds across a large area of Taurus and exhibit significant variations in kinematics as measured by their proper motion offsets and space velocities. These discrepancies likely arise from the fact that the fitting of the populations was performed on proper motions without correction for projection effects. For instance, stars in different Taurus clouds can have similar proper motions but different space velocities because of those effects. As a result, most of the populations from Roccatagliata et al. (2020) do not represent coherent stellar groups.
6.3. Liu et al. (2020, 2021)
Liu et al. (2020) found two new associations, u Tau and e Tau, southwest of the Taurus clouds based on the clustering of their members in equatorial coordinates, proper motions, and parallaxes from Gaia DR2. The first association is sufficiently far from Taurus that I have not attempted to identify its members. The second one has been named Tau by Gagné et al. (2020). My sample for Tau includes 84 of the 119 candidates from Liu et al. (2020).
Liu et al. (2021) used data from Gaia DR2 to search for groups of young stars (100 Myr) within a large volume extending well beyond the Taurus clouds. The groups were identified via clustering in spatial positions and tangential velocities that were calculated from proper motions and parallactic distances. Their analysis produced 22 groups. Groups 1–8 from Liu et al. (2021) contain 277 stars; 246 are among my adopted members of Taurus and 31 are classified in this work as field stars or candidate members of associations near Taurus. The remaining groups from that study correspond to subsets of the associations that were described in Section 4. The group number from Liu et al. (2021), the number of stars from that group that are within an association from Section 4, and the name of the latter are as follows: group 9, 40 stars, and V1362 Tau; group 10, 29 stars, and HD 35187; group 11, 32 stars, and 32 Ori; groups 12–14, 101 stars, and 93 Tau; groups 15–21, 96 stars, and 69 Ori; and group 22, 15 stars, and Tau. Groups 12–14 also included 77 of the candidate members of 93 Tau (group 29) from Luhman (2018). The multiple groups that Liu et al. (2021) identified for 93 Tau and 69 Ori are adjacent to each other on the sky, which is likely a reflection of the fact that the analysis from that study detected clusters in tangential velocities, which vary with celestial coordinates for a given space velocity.
6.4. Gagné et al. (2020)
Gagné et al. (2020) identified candidate members of the Tau association using astrometry and photometry from Gaia DR2 in conjunction with a model for the spatial positions and velocities of members of the association. They arrived at 393 higher-quality candidates and 155 lower-quality candidates, 208 and eight of which appear in my sample of candidates for Tau, respectively. Most of their candidates that are absent from my sample were rejected in my analysis via kinematics and CMDs. A few do satisfy those criteria, but are outside the range of distances in which I selected candidates. Gagné et al. (2020) included white dwarf candidates in their sample, which I did not attempt to identify (Section 4.1). My catalog contains 138 candidates that are not in the sample from Gagné et al. (2020).
6.5. Kraus et al. (2017)
Kraus et al. (2017) compiled 396 diskless stars that had been previously identified as possible members of Taurus. They classified 218 of those stars as confirmed or likely members of Taurus based on diagnostics of youth and pre-Gaia kinematic data. Roughly 40% of the proposed members were absent from my prior catalogs of Taurus (e.g., Luhman et al., 2017), most of which were older and more widely scattered than the adopted members from the latter study. Kraus et al. (2017) suggested that those stars represented an older distributed population that was associated with the Taurus complex. The high-precision parallaxes and proper motions from Gaia DR1 and DR2 made it possible for Esplin & Luhman (2017) and Luhman (2018) to closely scrutinize the membership of the older candidates from Kraus et al. (2017). For the candidates that were located within the field considered by Luhman (2018) and that had kinematic measurements from Gaia, none were comoving with the groups of stars associated with the Taurus clouds. A subset of those stars shared similar motions and spatial positions with group 29 from Oh et al. (2017) (93 Tau in this work), which were included in a new catalog for that association by Luhman (2018).
I have performed an updated examination of the candidates from Kraus et al. (2017) with my new survey of Taurus and its neighboring associations with Gaia DR3. I find that their 218 proposed members of Taurus included a mixture of stars from the Taurus groups (126), 93 Tau (26), V1362 Tau (8), and 32 Ori (11). Two candidates lack parallax measurements from Gaia. The remaining 45 stars have kinematics that are inconsistent with Taurus and that span a wide range. A few of those stars are roughly comoving with the associations near Taurus, but are located sufficiently far from the latter that membership is uncertain. For instance, 15 of those 45 candidates have distances of 100 pc or 200 pc. As in Luhman (2018), I find that the older candidates from Kraus et al. (2017) are not comoving with the Taurus groups, and instead are isolated field stars and members of the associations near Taurus.
6.6. Kerr et al. (2021)
Kerr et al. (2021) used data from Gaia DR2 to search for groups of young low-mass stars in the solar neighborhood via CMDs and clustering in spatial positions and tangential velocities. Eleven of the resulting groups were near the constellation of Taurus, so they were named with the affix of “GT” for “Greater Taurus”. Each group included a core sample and an expanded sample that was expected to have greater contamination from nonmembers. Only the core samples are considered in the following discussion.
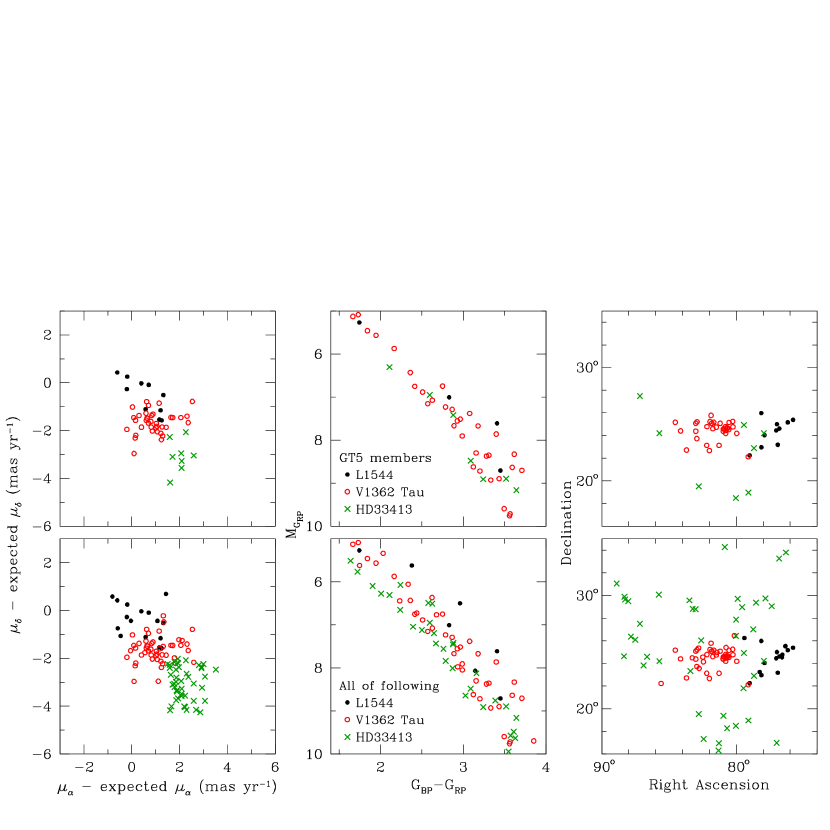
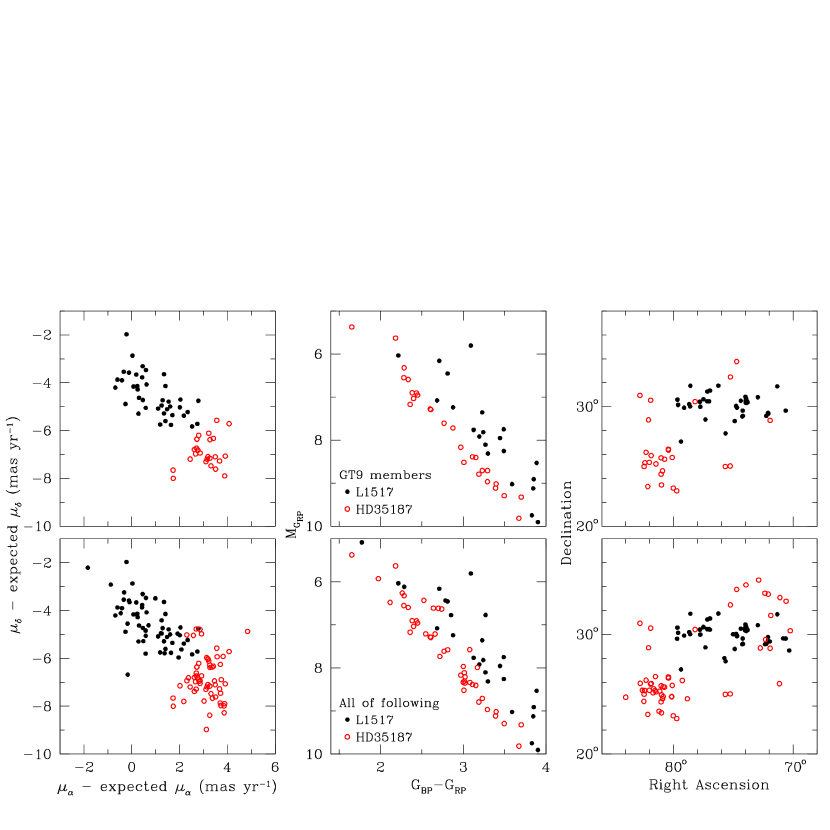
As recognized by Kerr et al. (2021), GT1 (17 stars) is a small fragment of the Tau association. GT2 (25 stars) is quite far from the nearest Taurus cloud (), so I have not attempted to identify its members. GT3 (46 stars) consists of three distinct clusters in spatial positions and proper motion offsets that correspond to Tau and two much younger groups that are more than south of the Taurus complex. The latter two groups were identified as GT3A and GT3B by Kerr et al. (2021) and are sufficiently far from Taurus that I have not performed a census of them. GT4 (51 stars) is dominated by members of 93 Tau, including 21 candidates from Luhman (2018) and 39 candidates from this work. According to my membership classifications, GT5 (55 stars) and GT9 (77 stars) each consist of a combination of a Taurus group and one or more older associations, all of which have distinct kinematics, spatial positions, and ages and hence do not belong in the same populations. GT5 is a mixture of L1544 in Taurus and two older associations, V1362 Tau and HD 33413. GT9 combines members of L1517 in Taurus with the older association HD 35187. To illustrate the differing kinematics, positions, and ages of the groups within GT5 and GT9, I present in Figures 22 and 23 the proper motion offsets, CMDs, and equatorial coordinates for (1) the members of GT5 and GT9, which are plotted with symbols that indicate the groups to which they are assigned in my analysis and (2) all candidates that I have identified for those groups. Only stars that lack full disks are shown in the CMDs so that the comparisons of ages are not affected by disk-related phenomena (Figure 6). As discussed in Luhman (2022c), GT6 and GT7 (33 and 11 stars) are fragments of 32 Ori. The remaining three groups from Kerr et al. (2021), GT8, GT10, and GT11, correspond to groups in Taurus. GT8 (87 stars) combines members of four groups (L1495/B209, L1524/L1529/B215, L1527, HD 28354), GT10 (30 stars) is a subset of L1551, and GT11 (34 stars) includes members of three groups (B209N, L1521/B213, L1536). As with some of the previously mentioned studies, the identification of groups via clustering in tangential velocities in Kerr et al. (2021) was prone to both breaking extended associations into small fragments (as noted by that study) and assigning stars with different space velocities to the same group.
6.7. Krolikowski et al. (2021)
To analyze the properties of groups within Taurus, Krolikowski et al. (2021) compiled 571 Gaia-detected stars that they considered to be candidate members of Taurus based on previous surveys. My catalog of adopted members includes 452 of their candidates. Among the 119 stars from Krolikowski et al. (2021) that are absent from my catalog, 53 are classified as members of the older associations near Taurus in Section 4, 59 were rejected as candidates for Taurus or the older associations in Section 4, and seven lack parallax measurements. The 59 rejected stars include 10 that have distances of 100 pc or 200 pc, and thus are far from the Taurus clouds. The seven stars that lack parallaxes consist of HD 284135, RX J0420.8+3009, Gaia DR3 3411198987968134528, 152416436441091584, 3415706130945884416, 149367387618890624, and 149370651795329536. The first three are far from the Taurus groups on the sky, so parallax data are needed to assess whether they are members of Taurus or the neighboring associations. Gaia DR3 152416436441091584 and 3415706130945884416 are possible companions to adopted Taurus members (Esplin & Luhman, 2019), but I have not included them in my catalog since they lack any data that could better constrain companionship, such as parallaxes, colors, and spectra. Gaia DR3 149367387618890624 and 149370651795329536 were matched to GV Tau B and IRAS 04264+2433 by Krolikowski et al. (2021), respectively, but the position of the first Gaia source relative to GV Tau is inconsistent with previous astrometry of the pair (Leinert et al., 1993) while the second Gaia source appears to be nebulosity (Section 2.1).
Many of the stars in the catalog from Krolikowski et al. (2021) that are absent from my census of Taurus have ages of 10 Myr in CMDs. Krolikowski et al. (2021) proposed that those older stars have a relationship with the Taurus complex. In Section 5.3, I examined that possibility for the associations near Taurus, which contain 53 of the stars from Krolikowski et al. (2021), as mentioned earlier in this section. I now perform a similar analysis for the 59 stars that I rejected for membership in Taurus or the older associations. The proper motion offsets of those stars span a large range, indicating that the stars do not comprise a coherent stellar population (e.g., an earlier generation of stars associated with Taurus) and instead are likely to be young field stars. Among the 49 stars at distances of 100–200 pc, 36 have measurements of radial velocities, enabling estimates of velocities. Using those velocities, the ages implied by CMDs, and the epicyclic approximation of Galactic orbital motion, I have estimated the positions of those 36 stars when they were born. Only two of the stars with ages of Myr were located within 10 pc of the positions of the Taurus groups (or their progenitor gas) at those times. Thus, that sample contains no evidence of an older population of stars associated with the Taurus complex. One of the older stars in question is the spectroscopic binary St34. It was included in catalogs of Taurus members at one time (e.g., Kenyon & Hartmann, 1995), but its membership was questioned by Hartmann et al. (2005) based on the relatively old age implied by the absence of Li absorption (White & Hillenbrand, 2005). Its velocity differs by km s-1 from median velocities of all of the Taurus groups and it differs by km s-1 from that of the nearest group, L1551, indicating that St34 is not a member of any of the Taurus groups. Based on my traceback calculations, St34 was separated by pc from the progenitor clouds of the Taurus groups when it was born, which demonstrates that St34 has no relationship with Taurus. Instead, St34 and the other stars discussed here are examples of the numerous young stars that permeate the solar neighborhood and whose parent associations have either dissolved or are too diffuse to be recognizable.
Kraus et al. (2017), Kerr et al. (2021), and Krolikowski et al. (2021) described their proposed older members of Taurus as a “distributed” population, which typically refers to widely scattered stars that surround and encompass a clustered population. However, many of those stars are members of the associations near Taurus, such as 32 Ori and 93 Tau, and my work has demonstrated that those associations are spatially separate from the Taurus groups (Figure 19) and thus do not represent a distributed population relative to Taurus. Meanwhile, as discussed previously, the remaining older stars span a wide range of kinematics and are very likely to be young field stars, which naturally have a distribution that is uniform and widely scattered.
Krolikowski et al. (2021) sought to identify groups within Taurus by applying a Gaussian mixture model (GMM) to the Galactic Cartesian coordinates of their adopted members that had parallax measurements from Gaia DR3. They adopted a model with 14 components, which were labeled as C1–C10 and D1–D4. My group classifications for the members of those components are summarized in Table 8. A few stars are listed as “no group” because their group assignments are uncertain (Section 3.2). For some of the components from Krolikowski et al. (2021), there is a direct correspondence to a single one of the groups that I have defined, which occurs for groups that are spatially isolated. However, several of the components contain members of multiple groups from my work that have varying kinematics, which results from the fact that kinematics were not considered by Krolikowski et al. (2021) in their GMM model. As an example, C1 consists of the L1551 and T Tau groups, which do not share the same kinematics and do not comprise a single stellar population, as shown in Figure 5. In addition, some of the components (e.g., D2, D4) combine several Taurus groups, older associations near Taurus, and stars that are not members of either Taurus or known associations (young field stars). As a result, those components are not coherent stellar populations and hence do not have physically meaningful properties.
6.8. Membership of Planet-hosting Young Stars
David et al. (2019) detected a Jupiter-sized planetary companion to V1298 Tau. It was among the nine candidate members of group 29 from Oh et al. (2017) (the 93 Tau association), which were identified with the first data release of Gaia. It was not included in the larger sample of 91 candidates selected with DR2 by Luhman (2018) because it was a modest outlier in parallax. V1298 Tau does appear in my new sample of 192 candidates for 93 Tau, so the age for that association can be adopted for V1298 Tau (35 Myr, Section 5.3).
Yu et al. (2017) reported evidence of a close-in gas giant around V1069 Tau (TAP 26, HBC 376). Because it is located within a few degrees of T Tau, Yu et al. (2017) adopted the distance of T Tau for V1069 Tau, arriving at an age estimate of 17 Myr based on its position in the Hertzsprung-Russell and the predictions of evolutionary models. However, the Gaia DR3 parallax for V1069 Tau corresponds to a distance of 121 pc, resulting in an older age. In addition, I find that the star is kinematically distinct from Taurus and is a candidate member of 93 Tau.
In direct imaging, Gaidos et al. (2022) resolved a planetary-mass companion at a separation of from 2MASS J04372171+2651014 (hereafter 2M0437), which was identified as a Taurus member by Esplin & Luhman (2017) and is classified in this work as a member of the Taurus group associated with HD 28354 (6 Myr, Section 5.3). To search for additional components of this system, Gaidos et al. (2022) checked Gaia DR3 for sources within an angular distance of that are comoving with the primary. They found one possible companion, 2MASS J04372631+2651438 (hereafter 2M043726), which has a separation of , a similar proper motion to 2M0437 (differing by mas yr-1), and an uncertain parallax ( mas) that is consistent with that of 2M0437 ( mas). Based on those data, Gaidos et al. (2022) concluded that 2M043726 is a Taurus member and is likely to be a companion to 2M0437 (as opposed to an unrelated member). They measured a spectral type of K5–M3 for 2M043726 using near-IR spectroscopy, which is earlier than expected for a Taurus member given its faint photometry (i.e., it is fainter than expected for a Taurus member near that spectral type). This is reflected in the fact that 2M043726 appears well below the sequence of Taurus members when placed in a diagram of versus using the distance of 2M0437. To explain the anomalously faint photometry of 2M043726, Gaidos et al. (2022) proposed that it is occulted by an edge-on disk. They concluded that the available mid-IR images are inadequate to verify that a disk is present.
I have assessed the companionship of 2M043726 with 2M0437 and its membership in Taurus. Although the 1 errors for the parallax of 2M043726 overlap with the parallax of 2M0437, the same is not true for the distances inferred from those parallaxes by Bailer-Jones et al. (2021), which are pc for 2M043726 and pc for 2M0437. Thus, 2M043726 is unlikely to be a companion to 2M0437 or a member of its Taurus group based on those distance estimates. For Gaia DR3 sources within from 2M0437 that are not known Taurus members, the average number of stars with proper motions similar to that of 2M0437 ( mas yr-1) and unconstrained values of parallax corresponds to for an area equal to the field searched by Gaidos et al. (2022), so it is not surprising that their search would find a field star that appeared to be comoving with 2M0437. Meanwhile, the proposal that 2M043726 has an edge-on disk can be tested with mid-IR photometry from the Spitzer Space Telescope. 2M043726 was detected by Spitzer in four bands from 3.6–8.0 µm and was not detected in a band at 24 µm. The 3.6–8.0 µm detections are consistent with photospheric emission and do not show excess emission from a disk. In comparison, several known members of Taurus have edge-on disks, all of which have excess emission at 8.0 µm (and at shorter wavelengths in some cases) and have large enough excesses at 24 µm that they are easily detected in that band (Luhman et al., 2010). Therefore, 2M043726 is unlikely to have an edge-on disk, in which case its photometry is inconsistent with Taurus membership. Finally, I note that 2M043726 lacks any evidence of youth, which is desirable when assigning membership in Taurus. The available data indicate that 2M043726 is not a member of Taurus and therefore is not a companion to 2M0437.
7. Conclusions
I have used high-precision photometry and astrometry from Gaia DR3 to perform a census of the Taurus star-forming region and young associations in its vicinity. The results are summarized as follows:
-
1.
I have used proper motions and parallaxes from Gaia DR3 to vet my previous census of Taurus for nonmembers (Esplin & Luhman, 2019) and to search for new members, which has resulted in minor updates. The new catalog contains 532 adopted members. I have compiled various data for these sources, including spectral classifications, Gaia photometry and astrometry, and radial velocities. Measurements of parallaxes with mas and radial velocities are available for 412 and 330 members, respectively. In addition to the adopted members, there remain nine candidates identified with Gaia DR3 that lack spectral classifications.
-
2.
The Taurus complex contains multiple clouds and associated stellar groups, which have modestly different average velocities. For adopted Taurus members that have parallaxes with mas, I have used proper motions in a way that accounts for projection effects to identify the individual groups based on their distinct kinematics. Through this analysis, I have divided the members with parallaxes into 13 groups, which are named after their associated dark clouds or their brightest stellar members. Some of those Taurus groups differ substantially from the groups produced by recent studies. Those differences are explained in part by the fact that clustering analysis based on proper motions or tangential velocities without correction for projection effects is prone to breaking extended associations into small fragments and assigning stars with different velocities to the same group.
-
3.
My survey for new members of the Taurus groups with Gaia DR3 has been sensitive to stars with ages of Myr. I find no evidence of a population of older stars (10–20 Myr) that is comoving with the Taurus groups, which is consistent with the results of a previous search with Gaia DR2 (Luhman, 2018).
-
4.
Previous studies have identified several groups and associations of young stars within a large volume surrounding the Taurus clouds (Mamajek, 2007, 2016; Bell et al., 2017; Oh et al., 2017; Luhman, 2018; Liu et al., 2020, 2021; Gagné et al., 2020; Kerr et al., 2021). I have performed a survey for young associations near Taurus using Gaia DR3, which has resulted in 1378 candidate members of seven associations. A similar survey of an additional association near Taurus, 32 Ori, was recently presented in Luhman (2022c). The numbers of candidates in these associations range from 47 to 591, most of which have not been previously identified. As found in previous work (Gagné et al., 2020), my results illustrate that surveys based on clustering of proper motions or tangential velocities often identify only small fragments of associations.
-
5.
All of the associations near Taurus have histograms of spectral types that peak near M5 ( ), indicating that they have IMFs with similar characteristic masses to other nearby associations and star-forming regions.
-
6.
For the nine largest Taurus groups and the neighboring associations, I have measured the offsets in absolute magnitudes of their sequences of low-mass stars from the median sequence of UCL/LCC in H-R diagrams. Those offsets have been converted to ages by assuming that UCL/LCC has an age of 20 Myr and that the luminosities fade at a rate given by log L/log age, which is typical of the predictions of evolutionary models (Baraffe et al., 2015; Choi et al., 2016; Dotter, 2016; Feiden, 2016). That method produces ages that are broadly consistent with the values for the Pic moving group ( Myr, Binks & Jeffries, 2016) and the Pleiades cluster ( Myr, Stauffer et al., 1998; Dahm, 2015) based on the lithium depletion boundary. Eight Taurus groups have median ages between 1 and 3 Myr while the remaining group, HD 28354, as an age of 6 Myr. The age uncertainties are large enough that most of the groups could be coeval. The age estimates for the associations near Taurus range from 13 to 56 Myr.
-
7.
I have used mid-IR photometry from WISE to search for IR excesses from circumstellar disks among the candidate members of the associations near Taurus. Disks are detected for 51 stars, 20 of which are reported for the first time in this work. Most of the disk-bearing stars have not been previously identified as members of associations. I have classified the evolutionary stages of the disks using the sizes of their mid-IR excesses. Roughly half of the disks are classified as full, transitional, or evolved, making them relatively old examples of primordial disks.
-
8.
I have calculated velocities for members of Taurus and the neighboring associations that have measurements of proper motions, parallaxes, and radial velocities. As found with the proper motion data, the associations have velocities that are distinct from those of the Taurus groups. There is also little spatial overlap between the Taurus groups and the associations.
-
9.
Previous studies have proposed that supernovae in UCL/LCC beginning 10–15 Myr ago powered the expansion of the Local Bubble, sweeping up gas to form Taurus and other nearby molecular clouds and triggering their star formation (e.g., Zucker et al., 2022). In that scenario, one might expect an age gradient among the Taurus groups that corresponds to the crossing time of the expanding shell (5 Myr). A gradient of that kind is not evident when I use the median velocities of the groups to estimate their relative positions in the past, although it might only be marginally detectable given the uncertainties of the group ages. In addition, the interface between the interstellar medium and the Local Bubble may have been too clumpy and irregular for a gradient to appear.
-
10.
Some recent studies have contended that samples of older stars (10 Myr) found in the vicinity of Taurus represent a distributed population produced by an earlier epoch of star formation in the Taurus complex (Kraus et al., 2017; Kerr et al., 2021; Krolikowski et al., 2021). I find that the older stars in question consist of a mixture of candidate members of the associations near Taurus and stars spanning a wide range of kinematics that do not comprise a coherent population and instead are likely to be young field stars. These stars do not share the same motions as the Taurus groups, indicating that they did not arise from the existing clouds. In addition, very few of the older stars that have velocity measurements trace back to birth sites that would have been near the Taurus groups (or their progenitor gas), demonstrating that they have no relationship with the latter. The same is true for most of the full samples of candidates that I have identified in the associations near Taurus. The one exception is the small association containing V1362 Tau (53 stars), which has an age of 13 Myr and a projected birth site that was within pc from the L1527 group in Taurus. V1362 Tau could represent the first group born in the Taurus complex, although a close approach of the Taurus clouds with an unrelated association is plausible as well. In either case, I find that a distributed population of older stars associated with the Taurus clouds does not exist.
-
11.
My catalogs for the associations near Taurus include a few stars that are well-studied or notable, such as the Herbig Ae/Be stars HD 35187, CQ Tau, and MWC 758 (members of the HD 35187 association) and the planet-hosting stars V1298 Tau and V1069 Tau (members of the 93 Tau association).
References
- Abdurro’uf et al. (2022) Abdurro’uf, Accetta, K., Aerts, C., et al. 2022, ApJS, 259, 35
- Aberasturi et al. (2014) Aberasturi, M., Caballero, J. A., Montesinos, B., et al. 2014, AJ, 148, 36
- Abt (2004) Abt, H. A. 2004, ApJS, 155, 175
- Abt (2008) Abt, H. A. 2008, ApJS, 176, 216
- Alcalá et al. (2000) Alcalá, J. M., Covino, E., Torres, G., et al. 2000, A&A, 353, 186
- Alcalá et al. (1996) Alcalá, J. M., Terranegra, L., Wichmann, R., et al. 1996, A&AS, 119, 7
- Bailer-Jones et al. (2021) Bailer-Jones, C. A. L., Rybizki, J., Fouesneau, M., Demleitner, M., & Andrae, R. 2021, AJ, 161, 147
- Ballesteros-Paredes et al. (1999) Ballesteros-Paredes, J., Hartmann, L., & Vázquez-Semadeni, E. 1999, ApJ, 527, 285
- Baraffe et al. (2015) Baraffe, I., Hormeier, D., Allard, F., & Chabrier, G. 2015, A&A, 577, 42
- Barrado y Navascués et al. (2004) Barrado y Navascués, D. Stauffer, J. R., & Jayawardhana, R. 2004, ApJ, 614, 386
- Basri & Marcy (1995) Basri, G., & Marcy, G. W. 1995, AJ, 109, 762
- Beck (2007) Beck, T. L. 2007, AJ, 133, 1673
- Bell et al. (2017) Bell, C. P. M., Murphy, S. J., & Mamajek, E. E. 2017, MNRAS, 468, 1198
- Biazzo et al. (2012) Biazzo, K., Alcalá, M., Covino, E., et al. 2012, A&A, 542, A115
- Bidelman et al. (1988) Bidelman, W. P., Ratcliff, S. J., & Svolopoulos, S. 1988, PASP, 100, 828
- Binks & Jeffries (2016) Binks, A. S., & Jeffries, R. D. 2016, MNRAS, 455, 3345
- Binks et al. (2015) Binks, A. S., Jeffries, R. D., & Maxted, P. F. L. 2015, MNRAS, 452, 173
- Blaauw (1956) Blaauw, A. 1956, ApJ, 132, 408
- Blanton et al. (2017) Blanton, M. R., Bershady, M. A., Abolfathi, B., et al. 2017, AJ, 154, 28
- Bonnefoy et al. (2014) Bonnefoy, M., Chauvin, G., Lagrange, A.-M., et al. 2014, A&A, 562, A127
- Boss (1937) Boss, B. 1937, General Catalogue of 33342 stars for the epoch 1950. Vol.1: Introduction and explanatory tables; Right Ascension 6 h-12 h; Right Ascension 12 h-18 h; Vol. 5: Right Ascension 18 h-24 h
- Boucher et al. (2016) Boucher, A., Lafrenière, D., Gagné, J., et al. 2016, ApJ, 832, 50
- Bowler & Hillenbrand (2015) Bowler, B. P., & Hillenbrand, L. A. 2015, ApJ, 811, L30
- Briceño et al. (1993) Briceño, C., Calvet, N., Gomez, M., et al. 1993, PASP, 105, 686
- Briceño et al. (2019) Briceño, C., Calvet, N., Hernández, J., et al. 2019, AJ, 157, 85
- Briceño et al. (1999) Briceño, C., Calvet, N., Kenyon, S., & Hartmann, L. 1999, AJ, 118, 1354
- Briceño et al. (1998) Briceño, C., Hartmann, L., Stauffer, J., & Martín, E. L., 1998, AJ, 115, 2074
- Briceño et al. (1997) Briceño, C., Hartmann, L., Stauffer, J., et al. 1997, AJ, 113, 740
- Briceño et al. (2002) Briceño, C., Luhman, K. L., Hartmann, L., Stauffer, J. R., & Kirkpatrick, J. D. 2002, ApJ, 580, 317
- Buder et al. (2021) Buder, S., Sharma, S., Kos, J., et al. 2021, MNRAS, 506, 150
- Calvet et al. (2004) Calvet, N., Muzerolle, J., Briceño, C., et al. 2004, AJ, 128, 1294
- Cannon & Mayall (1949) Cannon, A. J., & Mayall, M. W. 1949, Annals of Harvard College Observatory, 112, 1
- Cannon & Pickering (1993) Cannon, A. J., & Pickering, E. C. 1993, yCat, 3135, 0
- Choi et al. (2016) Choi, J., Dotter, A., Conroy, C., et al. 2016, ApJ, 823, 102
- Cieza et al. (2012) Cieza, L. A., Schreiber, M. R., Romero, G. A., et al. 2012, ApJ, 750, 157
- Cohen & Kuhi (1979) Cohen, M., & Kuhi, L. V. 1979, ApJS, 41, 743
- Connelley & Greene (2010) Connelley, M. S., & Greene, T. P. 2010, AJ, 140, 1214
- Cottaar et al. (2014) Cottaar, M., Covey, K. R., Meyer, M. R., et al. 2014, ApJ, 794, 125
- Cotten & Song (2016) Cotten, T. H., & Song, I. 2016, ApJS, 225, 15
- Cowley (1968) Cowley, A. 1968, PASP, 80, 453
- Cowley (1972) Cowley, A. 1972, AJ, 77, 750
- Cowley et al. (1969) Cowley, A., Cowley, C., Jaschek, M., & Jaschek, C. 1969, AJ, 74, 375
- Cui et al. (2012) Cui, X., Zhao, Y., Chu, Y., et al. 2012, RAA, 12, 1197
- Cushing et al. (2004) Cushing, M. C., Vacca, W. D., & Rayner, J. T. 2004, PASP, 116, 362
- Cutri et al. (2012) Cutri, R. M., Wright, E. L., Conrow, T., et al. 2012, Explanatory Supplement to the WISE All-Sky Data Release Products
- Cutri et al. (2013) Cutri, R. M., Wright, E. L., Conrow, T., et al. 2013, yCat, 2328, 0C
- Daemgen et al. (2015) Daemgen, S., Bonavita, M., Jayawardhana, R., Lafrenière, D., & Janson, M. 2015, ApJ, 799, 155
- David et al. (2019) David, T. J., Cody, A. M., Hedges, C. L., et al. 2019, AJ, 158, 79
- de Bruijne (2012) de Bruijne, J. H. J. 2012, Ap&SS, 341, 31
- de Zeeuw et al. (1999) de Zeeuw, P. T., Hoogerwerf, R., de Bruijne, J. H. J., Brown, A. G. A., & Blaauw, A. 1999, AJ, 117, 354
- Dahm (2015) Dahm, S. E. 2015, ApJ, 813, 108
- Dobashi et al. (2005) Dobashi, K., Uehara, H., Kandori, R., et al. 2005, PASJ, 57, 1
- Doppmann et al. (2005) Doppmann, G. W., Greene, T. P., Covey, K. R., & Lada, C. J. 2005, AJ, 130, 1145
- Dotter (2016) Dotter, A. 2016, ApJS, 222, 8
- Duchêne et al. (1999) Duchêne Monin, J.-L., Bouvier, J., & Ménard, F. 1999, A&A, 351, 954
- Espaillat et al. (2012) Espaillat, C., Ingleby, L., Hernandez, J., et al. 2012, ApJ, 747, 103
- Esplin & Luhman (2017) Esplin, T. L., & Luhman, K. L. 2017, AJ, 154, 134
- Esplin & Luhman (2019) Esplin, T. L., & Luhman, K. L. 2019, AJ, 158, 54
- Esplin & Luhman (2022) Esplin, T. L., & Luhman, K. L. 2022, AJ, 163, 64
- Esplin et al. (2014) Esplin, T. L., Luhman, K. L., & Mamajek, E. E. 2014, ApJ, 784, 126
- Esplin et al. (2018) Esplin, T. L., Luhman, K. L., Miller, E. B., & Mamajek, E. E. 2018, AJ, 156, 75
- Evans et al. (2018) Evans, D. W., Riello, M., De Angeli, F., et al. 2018, A&A, 616, A4
- Feiden (2016) Feiden, G. A. 2016, A&A, 593, A99
- Findeisen & Hillenbrand (2010) Findeisen, K., & Hillenbrand, L. 2010, AJ, 139, 1338
- Flaherty et al. (2019) Flaherty, K., Hughes, A. M., Mamajek, E. E., & Murphy, S. J. 2019, ApJ, 872, 92
- Fuchs et al. (2009) Fuchs, B., Breitschwerdt, D., de Avillez, M. A., & Dettbarn, C. 2009, Space Sci. Rev., 143, 437
- Fuchs et al. (2006) Fuchs, B., Breitschwerdt, D., de Avillez, M. A., Dettbarn, C., & Flynn, C. 2006, MNRAS, 373, 993
- Gagné et al. (2020) Gagné, J., David, T. J., Mamajek, E. E., et al. 2020, ApJ, 903, 96
- Gagné et al. (2015) Gagné, J., Faherty, J. K., Cruz, K. L., et al. 2015, ApJS, 219, 33
- Gaidos et al. (2022) Gaidos, E., Hirano, T., Kraus, A. L., et al. 2022, MNRAS, 512, 583
- Gaia Collaboration et al. (2018) Gaia Collaboration, Babusiaux, C., van Leeuwen, F., Barstow, M. A., et al. 2018, A&A, 616, A10
- Gaia Collaboration et al. (2018) Gaia Collaboration, Brown, A. G. A., Vallenari, A., Prusti, T., et al. 2018, A&A, 616, A1
- Gaia Collaboration et al. (2021) Gaia Collaboration, Brown, A. G. A., Vallenari, A., Prusti, T., et al. 2021, A&A, 649, A1
- Gaia Collaboration et al. (2016) Gaia Collaboration, Prusti, T., de Bruijne, J. H. J., et al. 2016, A&A, 595, A1
- Gaia Collaboration et al. (2022) Gaia Collaboration, Vallenari, A., Brown, A. G. A., Prusti, T., et al., 2022, A&A, in press
- Galli et al. (2019) Galli, P. A. B., Loinard, L., Bouy, H., et al. 2019, A&A, 630, A137
- Galli et al. (2018) Galli, P. A. B., Loinard, L., Ortiz-Léon, G. N., et al. 2018, ApJ, 859, 33
- Gizis et al. (1999) Gizis, J. E., Reid, I. N., & Monet, D. G. 1999, AJ, 118, 997
- Gomez et al. (1992) Gomez, M., Jones, B. F., Hartmann, L., et al. 1992, AJ, 104, 762
- Gontcharov (2006) Gontcharov, G. A. 2006, AstL, 32, 759
- Grenier et al. (1999) Grenier, S., Baylac, M. -O., Rolland, L., et al. 1999, A&AS, 137, 451
- Guieu et al. (2006) Guieu, S., Dougados, C., Monin, J.-L., Magnier, E. & Martín, E. L. 2006, A&A, 446, 485
- Hartigan et al. (1995) Hartigan, P., Edwards, S., & Ghandour, L. 1995, ApJ, 452, 736
- Hartigan & Kenyon (2003) Hartigan, P., & Kenyon, S. J. 2003, ApJ, 583, 334
- Hartigan et al. (1994) Hartigan, P., Strom, K. M., & Strom, S. E. 1994, ApJ, 427, 961
- Hartmann et al. (2001) Hartmann, L., Ballesteros-Paredes, J., & Bergin, E. A. 2001, ApJ, 562, 852
- Hartmann et al. (2005) Hartmann, L., Calvet, N., Watson, D. M., et al. 2005, ApJ, 628, L147
- Hartmann et al. (1986) Hartmann, L., Hewett, R., Stahler, S., & Mathieu, R. D. 1986, ApJ, 309, 275
- Hartmann et al. (1991) Hartmann, L., Jones, B. F., Stauffer, J. R., & Kenyon, S. J. 1991, AJ, 101, 1050
- Henry et al. (1994) Henry, T. J., Kirkpatrick, J. D., & Simons, D. A. 1994, AJ, 108, 1437
- Herbig (1977) Herbig, G. H. 1977, ApJ, 214, 747
- Herbig & Bell (1988) Herbig, G. H., & Bell, K. R. 1988, Third Catalog of Emission-Line Stars of the Orion Population, ed. G. H. Gerbig and K. R. Bell (Santa Cruz, CA: Lick Observatory) Vol. 3, 90
- Herbig et al. (1986) Herbig, G. H., Vrba, F. J., & Rydgren, A. E. 1986, AJ, 91, 575
- Herczeg & Hillenbrand (2008) Herczeg, G. J., & Hillenbrand, L. A. 2008, ApJ, 681, 594
- Herczeg & Hillenbrand (2014) Herczeg, G. J., & Hillenbrand, L. A. 2014, ApJ, 786, 97
- Herczeg & Hillenbrand (2015) Herczeg, G. J., & Hillenbrand, L. A. 2015, ApJ, 808, 23
- Hernández et al. (2007) Hernández, J., Hartmann, L., Megeath, T., et al. 2007, ApJ, 662, 1067
- Hook et al. (2004) Hook, I., Jørgensen, I., Allington-Smith, J. R., et al. 2004, PASP, 116, 425
- Houk & Swift (1999) Houk, N., & Swift, C. 1999, Michigan Catalogue of Two-dimensional Spectral Types for the HD Stars. Vol. 5, (Ann Arbor: Univ. Mich.)
- Johnson & Soderblom (1987) Johnson D. R. H., & Soderblom D. R., 1987, AJ, 93, 864
- Joncour et al. (2017) Joncour, I., Duchêne, G., & Moraux, E. 2017, A&A, 599, A14
- Kenyon & Bromley (2005) Kenyon, S. J., & Bromley, B. C. 2005, AJ, 130, 269
- Kenyon et al. (1998) Kenyon, S. J., Brown, D. I., Tout, C. A., & Berlind, P. 1998, AJ, 115, 2491
- Kenyon et al. (1994) Kenyon, S. J., Gomez, M., Marzke, R. O., & Hartmann, L. 1994, AJ, 108, 251
- Kenyon & Hartmann (1995) Kenyon, S. J., & Hartmann, L. 1995, ApJS, 101, 117
- Kenyon et al. (1990) Kenyon, S. J., Hartmann, L. W., Strom, K. M., & Strom, S. E. 1990, AJ, 99, 869
- Kerr et al. (2021) Kerr, R., Rizzuto, A. C., Kraus, A. L., & Offner, S. S. R. 2021, ApJ, 917, 23
- Kirkpatrick et al. (1997) Kirkpatrick, J. D., Henry, T. J., & Irwin, M. J. 1997, AJ, 113, 1421
- Kirkpatrick et al. (1991) Kirkpatrick, J. D., Henry, T. J., & McCarthy, D. W. 1991, ApJS, 77, 417
- Konopacky et al. (2007) Konopacky, Q. M., Ghez, A. M., Rice, E. L. & Duchêne, G. 2007, ApJ, 663, 394
- Kounkel et al. (2019) Kounkel, M., Covey, K., Moe, M., et al. 2019, AJ, 157, 196
- Kraus et al. (2017) Kraus, A. L., Herczeg, G. J., Rizzuto, A. C., et al. 2017, ApJ, 838, 150
- Kraus & Hillenbrand (2009) Kraus, A. L., & Hillenbrand, L. A. 2009, ApJ, 703, 1511
- Krolikowski et al. (2021) Krolikowski, D. M., Kraus, A. L., & Rizzuto, A. C. 2021, AJ, 162, 110
- Lada (1987) Lada, C. J. 1987, in IAU Symp. 115, Star Forming Regions, ed. M. Peimbert & J. Jugaku (Dordrecht: Reidel), 1
- Lada & Wilking (1984) Lada, C. J., & Wilking, B. A. 1984, ApJ, 287, 610
- Lawrence et al. (2007) Lawrence, A., Warren, S. J., Almaini, O., et al. 2007, MNRAS, 379, 1599
- Lee et al. (2020) Lee, J., Song, I., & Murphy, S. 2020, MNRAS, 494, 62
- Leinert et al. (1991) Leinert, Ch., Haas, M., Richichi, A., Zinnecker, H., & Mundt, R. 1991, A&A, 250, 407
- Leinert et al. (1993) Leinert, Ch., Zinnecker, H., Weitzel, N., et al. 1993, A&A, 278, 129
- Li & Hu (1998) Li, J. Z., & Hu, J. Y. 1998, A&AS, 132, 173
- Lindegren (2018) Lindegren, L. 2018, Re-normalising the astrometric chi-square in Gaia DR2, GAIA-C3-TN-LU-LL-124-01, http://www.rssd.esa.int/doc_fetch.php?id=3757412
- Liu et al. (2020) Liu, J., Fang, M., & Liu, C. 2020, AJ, 159, 105
- Liu et al. (2021) Liu, J., Fang, M., Tian, H., et al. 2021, ApJS, 254, 20
- Lodieu et al. (2019) Lodieu, N., Pérez-Garrido, A., Smart, R. L., & Silvotti, R. 2019, A&A, 628, A66
- Luhman (1999) Luhman, K. L. 1999, ApJ, 525, 466
- Luhman (2004) Luhman, K. L. 2004, ApJ, 617, 1216
- Luhman (2006) Luhman, K. L. 2006, ApJ, 645, 676
- Luhman (2018) Luhman, K. L. 2018, AJ, 156, 271
- Luhman (2022a) Luhman, K. L. 2022a, AJ, 163, 24
- Luhman (2022b) Luhman, K. L. 2022b, AJ, 163, 25
- Luhman (2022c) Luhman, K. L. 2022c, AJ, 164, 151
- Luhman et al. (2010) Luhman, K. L., Allen, P. R., Espaillat, C., Hartmann, L., & Calvet, N. 2010, ApJS, 186, 111
- Luhman et al. (1998) Luhman, K. L., Briceño, C., Rieke, G. H., Hartmann, L. 1998, ApJ, 493, 909
- Luhman et al. (2003) Luhman, K. L., Briceño, C., Stauffer, J. R., et al. 2003, ApJ, 590, 348
- Luhman & Esplin (2020) Luhman, K. L., & Esplin, T. L. 2020, AJ, 160, 44
- Luhman et al. (1997) Luhman, K. L., Liebert, J., & Rieke, G. H. 1997, ApJ, 489, L165
- Luhman & Mamajek (2012) Luhman, K. L., & Mamajek, E. E. 2012, ApJ, 758, 31
- Luhman et al. (2009b) Luhman, K. L., Mamajek, E. E., Allen, P. R., & Cruz, K. L. 2009b, ApJ, 703, 399
- Luhman et al. (2009a) Luhman, K. L., Mamajek, E. E., Allen, P. R., Muench, A. A., & Finkbeiner, D. P. 2009a, ApJ, 691, 1265
- Luhman et al. (2017) Luhman, K. L., Mamajek, E. E., Shukla, S. J., & Loutrel, N. P. 2017, AJ, 153, 46
- Luhman & Rieke (1998) Luhman, K. L., & Rieke, G. H. 1998, ApJ, 497, 354
- Luhman et al. (2006) Luhman, K. L., Whitney, B. A., Meade, M. R., et al. 2006, ApJ, 647, 1180
- Magazzú et al. (1997) Magazzú, A., Martín, E. L., Sterzik, M. F., et al. 1997, A&AS, 124, 449
- Maíz-Apellániz (2001) Maíz-Apellániz, J. 2001, ApJ, 560, L83
- Majewski et al. (2017) Majewski, S. R., Schiavon, R. P., Frinchaboy, P. M., et al. 2017, AJ, 154, 94
- Makarov et al. (2004) Makarov, V. V., Olling, R. P., & Teuben, P. J. 2004, MNRAS, 352, 1199
- Malfait et al. (1998) Malfait, K., Bogaert, E., & Waelkens, C. 1998, A&A, 331, 211
- Mamajek (2007) Mamajek, E. E. 2007, in IAU Symp. 237, Triggered Star Formation in a Turbulent ISM, ed. B. G. Elmegreen & J. Palous (Cambridge: Cambridge Univ. Press), 442
- Mamajek (2016) Mamajek, E. 2016, A New Candidate Young Stellar Group at d=121 pc Associated with 118 Tauri, v.1 Figshare, doi:10.6084/m9.figshare.3122689.v1
- Manara et al. (2017) Manara, C. F., Frasca, A., Alcalá, J. M., et al. 2017, A&A, 605, 86
- Martín (2000) Martín, E. L. 2000, AJ, 120, 2114
- Martín et al. (2001) Martín, E. L., Dougados, C., Magnier, E., et al. 2001, ApJ, 561, L195
- Martín & Magazzù (1999) Martín, E. L., & Magazzù, A. 1999, A&A, 342, 173
- Martín et al. (1994) Martín, E. L., Rebolo, R., Magazzù, A., & Pavlenko, Y. V. 1994, A&A, 282, 503
- Mathieu et al. (1997) Mathieu, R. D., Stassun, K., Basri, G., et al. 1997, AJ, 113, 1841
- McCuskey (1959) McCuskey, S. W. 1959, ApJS, 4, 23
- McDonald et al. (2012) McDonald, I., Zijlstra, A. A., & Boyer, M. L. 2012, MNRAS, 427, 343
- McDonald et al. (2017) McDonald, I., Zijlstra, A. A., & Watson, R. A. 2017, MNRAS, 471, 770
- Mermilliod et al. (2009) Mermilliod, J. -C., Mayor, M., & Udry, S. 2009, A&A, 498, 949
- Monin et al. (1998) Monin, J.-L., Ménard, F., & Duchêne, G. 1998, A&A, 339, 113
- Mooley et al. (2013) Mooley, K. P., Hillenbrand, L. A., Rebull, L., Padgett, D., & Knapp, G. 2013, ApJ, 771, 110
- Mora et al. (2001) Mora, A., Merín, B. Solano, E., et al. 2001, A&A, 378, 116
- Mundt et al. (1983) Mundt, R., Walter, F. M., Feigelson, E. D., et al. 1983, ApJ, 269, 229
- Murphy et al. (2018) Murphy, S. J., Mamajek, E. E., & Bell, C. P. M. 2018, MNRAS, 476, 3290
- Muzerolle et al. (2003) Muzerolle, J., Hillenbrand, L., Calvet, N., Briceño, C., & Hartmann, L. 2003, ApJ, 592, 266
- Nesterov et al. (1995) Nesterov, V. V., Kuzmin, A. V., Ashimbaeva, N. T., et al. 1995, A&AS, 110, 367
- Neuhäuser et al. (1995) Neuhäuser, R., Sterzik, M. F., Schmitt, J. H. M. M., Wichmann, R., & Krautter, J. 1995, A&A, 295, L5
- Nguyen et al. (2012) Nguyen, D. C., Brandeker, A., Van Kerkwijk, M. H., & Jawawardhana, R. 2012, ApJ, 745, 119
- Oh et al. (2017) Oh, S., Price-Whelan, A. M., Hogg, D. W., Morton, T. D., & Spergel, D. N. 2017, AJ, 153, 257
- Oudmaijer et al. (1992) Oudmaijer, R. D., van der Veen, W. E. C. J., Waters, L. B. F. M., et al. 1992, A&AS, 96, 625
- Patterer et al. (1993) Patterer, R. J., Ramsey, L., Welty, A. D., & Huenemoerder, D. P. 1993, AJ, 105, 1519
- Paunzen et al. (2001) Paunzen, E., Duffee, B., Heiter, U., Kuschnig, R., & Weiss, W. W. 2001, A&A, 373, 625
- Perryman et al. (2001) Perryman, M. A. C., de Boer, K. S., Gilmore, G., et al. 2001, A&A, 369, 339
- Prato et al. (2009) Prato, L., Lockhart, K. E., Johns-Krull, C. M., & Rayner, J. T. 2009, AJ, 137, 3931
- Prato et al. (2002) Prato, L., Simon, M., Mazeh, T., Zucker, S., & McLean, I. S. 2002, ApJ, 579, L99
- Racine (1968) Racine, R. 1968, AJ, 73, 233
- Rayner et al. (2003) Rayner, J. T., Toomey, D. W., Onaka, P. M., et al. 2003, PASP, 115, 362
- Rebull et al. (2011) Rebull, L. M., Koenig, X. P., Padgett, D. L., et al. 2011, ApJS, 196, 4
- Rebull et al. (2010) Rebull, L. M., Padgett, D. L., McCabe, C. E., et al. 2010, ApJS, 186, 259
- Reid & Hawley (1999) Reid, I. N., & Hawley, S. L. 1999, AJ, 117, 343
- Reipurth et al. (1990) Reipurth, B., Lindgren, H., Nordstrom, B., & Mayor, M. 1990, A&A, 235, 197
- Riaz et al. (2006) Riaz, B., Gizis, J. E., & Harvin, J. 2006, AJ, 132, 866
- Rieke et al. (2005) Rieke, G. H., Su, K. Y. L., Stansberry, J. A., et al. 2005, ApJ, 620, 1010
- Riello et al. (2021) Riello, M., De Angeli, F., Evans, D. W., et al. 2021, A&A, 649, A3
- Roccatagliata et al. (2020) Roccatagliata, V., Franciosini, E., Sacco, G. G., Randich, S., & Sicilia-Aguilar, A. 2020, A&A, 638, A85
- Scelsi et al. (2008) Scelsi, L., Sacco, G., Affer, L., et al. 2008, A&A, 490, 601
- Schaefer et al. (2009) Schaefer, G. H., Dutrey, A. Guilloteau, S., Simon, M., & White, R. J. 2009, ApJ, 701, 698
- Schlafly et al. (2016) Schlafly, E. F., Meisner, A. M., Stutz, A. M., et al. 2016, ApJ, 821, 78
- Schmidt et al. (1989) Schmidt, G. G., Weymann, R. J., & Foltz, C. B. 1989, PASP, 101, 713
- Silverberg et al. (2016) Silverberg, S. M., Kuchner, M. J., Wisniewski, J. P., et a l. 2016, ApJ, 830, L28
- Silverberg et al. (2020) Silverberg, S. M., Wisniewski, J. P., Kuchner, M. J., et a l. 2020, ApJ, 890, 106
- Skrutskie et al. (2003) Skrutskie, M., Cutri, R. M., Stiening, R., et al. 2003, 2MASS All-Sky Point Source Catalog, IPAC, doi:10.26131/IRSA2
- Skrutskie et al. (2006) Skrutskie, M., Cutri, R. M., Stiening, R., et al. 2006, AJ, 131, 1163
- Slesnick et al. (2006) Slesnick, C. L., Carpenter, J. M., Hillenbrand, L. A., & Mamajek, E. E. 2006, AJ, 132, 2665
- Soubiran et al. (2018) Soubiran, C., Jasniewicz, G., Chemin, L., et al. 2018, A&A, 616, A7
- Stauffer et al. (2007) Stauffer, J. R., Hartmann, L. W., Fazio, G. G., et al. 2007, ApJS, 172, 663
- Stauffer et al. (1998) Stauffer, J. R., Schultz, G., & Kirkpatrick, J. D. 1998, ApJ, 499, L199
- Steffen et al. (2001) Steffen, A. T., Mathieu, R. D., Lattanzi, M. G., et al. 2001, AJ, 122, 997
- Strom & Strom (1994) Strom, K. M., & Strom, S. E. 1994, ApJ, 424, 237
- The et al. (1994) The, P. S., de Winter, D., & Perez, M. R. 1994, A&AS, 104, 315
- Theissen & West (2017) Theissen, C. A., & West, A. A. 2017, AJ, 153, 165
- Torres et al. (1995) Torres, C. A. O., Quast, G., de la Reza, R., Gregorio-Hetem, J., Lepine, J. R. D. 1995, AJ, 109, 2146
- Torres et al. (2013) Torres, G., Ruíz-Rodríguez, D., Badenas, M., et al. 2013, ApJ, 773, 40
- Tsantaki et al. (2022) Tsantaki, M., Pancino, E., Marrese, P., et al. 2022, A&A, 659, A95
- Vacca et al. (2003) Vacca, W. D., Cushing, M. C., & Rayner, J. T. 2003, PASP, 115, 389
- Vieira et al. (2003) Vieira, S. L. A., Corradi, W. J. B., Alencar, S. H. P., et al. 2003, AJ, 126, 2971
- Walter et al. (2003) Walter, F. M., Beck, T. L., Morse, J. A., & Wolk, S. J. 2003, AJ, 125, 2123
- Walter & Wolstencroft (1988) Walker, H. J., & Wolstencroft, R. D. 1988, PASP, 100, 1509
- Welty (1995) Welty, A. D. 1995, AJ, 110, 776
- White & Basri (2003) White, R. J., & Basri, G. 2003, ApJ, 582, 1109
- White et al. (2007) White, R. J., Gabor, J. M., & Hillenbrand, L. A. 2007, AJ, 133, 2524
- White & Ghez (2001) White, R. J., & Ghez, A. M. 2001, ApJ, 556, 265
- White et al. (1999) White, R. J., Ghez, A. M., Reid, I. N., & Schultz, G. 1999, ApJ, 520, 811
- White & Hillenbrand (2004) White, R. J., & Hillenbrand, L. A. 2004, ApJ, 616, 998
- White & Hillenbrand (2005) White, R. J., & Hillenbrand, L. A. 2005, ApJ, 621, L65
- Wichmann et al. (1996) Wichmann, R., Krautter, J., Schmitt, J. H. M. M., et al. 1996, A&A, 312, 439
- Wichmann et al. (2000) Wichmann, R., Torres, G., Melo, C. H. F., et al. 2000, A&A, 359, 181
- Wilson & Joy (1952) Wilson, R. E., & Joy, A. H. 1952, ApJ, 115, 157
- Wright et al. (2010) Wright, E. L., Eisenhardt, P. R. M., Mainzer, A. K., et al. 2010, AJ, 140, 1868
- Wright et al. (2013) Wright, E. L., Eisenhardt, P. R. M., Mainzer, A. K., et al. 2013, AllWISE Source Catalog, IPAC, doi:10.26131/IRSA1
- Yu et al. (2017) Yu, L., Donati, J.-F., Hébrard, E. M., et al. 2017, MNRAS, 467, 1342
- Zhang et al. (2021) Zhang, B., Li, J., Yang, F., et al. 2021, ApJS, 256, 14
- Zhang et al. (2018) Zhang, Z., Liu, M. C., Best, W. M. J., et al. 2018, ApJ, 858, 41
- Zhao et al. (2012) Zhao, G., Zhao Y. H., Chu Y. Q., Jing Y. P., Deng L. C., 2012, RAA, 12, 723
- Zickgraf et al. (2005) Zickgraf, F.-J., Krautter, J., Reffert, S., et al. 2005, A&A, 433, 151
- Zucker et al. (2022) Zucker, C., Goodman, A. A., Alves, J., et al. 2022, Nature, 601, 334
| Gaia DR3 | Other Name | Spectral Type | Telescope/Instrument | Disk Type |
|---|---|---|---|---|
| 3420750548559422592 | PSO J079.3986+26.2455 | M6.5 | IRTF/SpeX | full |
| 3414676232147787136 | III | |||
| 3419115132386033280 | M3.75 | IRTF/SpeX | ||
| 145200960104259200 | M0.5 | LAMOST | III | |
| 3418846267435680512 | M5.25 | LAMOST | full | |
| 3446890376655192832 | M5.5 | LAMOST | III | |
| 3446890411014932224 | M5.25 | LAMOST | III | |
| 3446722593755425024 | PW Aur | M3 | LAMOST | full |
| 180149418232233472 | M5.5 | LAMOST | full | |
| 156207518176564864 | M4.75 | LAMOST | full | |
| 157247965413620224 | M5.75 | LAMOST | full | |
| 156162674425653248 | M1 | KPNO 2.1 m/GoldCam | full? | |
| 3420824426291884672 | M0.5 | KPNO 2.1 m/GoldCam | full | |
| 3421359544857244160 | M5.5 | LAMOST | III |
| Column Label | Description |
|---|---|
| GaiaDR3 | Gaia DR3 source name |
| 2MASS | 2MASS source name |
| UGCS | UKIDSS Galactic Clusters Survey source nameaaBased on coordinates from Data Release 10 of the UKIDSS Galactic Clusters Survey for stars with from 2MASS. |
| Name | Other source name |
| RAdeg | Right ascension (ICRS) |
| DEdeg | Declination (ICRS) |
| Ref-Pos | Reference for right ascension and declinationbbSources of the right ascension and declination are are the 2MASS Point Source Catalog, Gaia DR3 (Epoch 2016.0), UKIDSS Data Release 10, and images from the Spitzer Space Telescope (Luhman et al., 2010). |
| SpType | Spectral type |
| r_SpType | Spectral type referencecc (1) Esplin & Luhman (2019); (2) Luhman et al. (2009b); (3) White & Hillenbrand (2004); (4) Doppmann et al. (2005); (5) Prato et al. (2009); (6) Esplin et al. (2014); (7) Nguyen et al. (2012); (8) Wichmann et al. (1996); (9) Luhman et al. (2017); (10) Esplin & Luhman (2017); (11) Herbig et al. (1986); (12) Herczeg & Hillenbrand (2014); (13) Herbig (1977); (14) Connelley & Greene (2010); (15) Torres et al. (1995); (16) Schaefer et al. (2009); (17) Rebull et al. (2010); (18) Luhman (2004); (19) Hartigan et al. (1994); (20) Welty (1995); (21) Cohen & Kuhi (1979); (22) White & Basri (2003); (23) Briceño et al. (1998); (24) Strom & Strom (1994); (25) Hartigan & Kenyon (2003); (26) Scelsi et al. (2008); (27) Briceño et al. (1993); (28) Briceño et al. (2002); (29) Guieu et al. (2006); (30) Luhman (2006); (31) Luhman & Rieke (1998); (32) Luhman et al. (2003); (33) Luhman et al. (1998); (34) Martín et al. (2001); (35) Patterer et al. (1993); (36) Kenyon et al. (1998); (37) Beck (2007); (38) Luhman (1999); (39) Mundt et al. (1983); (40) Duchêne et al. (1999); (41) Kenyon et al. (1990); (42) Calvet et al. (2004); (43) Martín & Magazzù (1999); (44) Luhman et al. (2006); (45) Aberasturi et al. (2014); (46) Zhang et al. (2018); (47) Luhman et al. (2009a); (48) Cieza et al. (2012); (49) Kenyon et al. (1994); (50) Hartmann et al. (1991); (51) Wichmann et al. (2000); (52) White & Ghez (2001); (53) Slesnick et al. (2006); (54) Bonnefoy et al. (2014); (55) Gizis et al. (1999); (56) Abt (2004); (57) Monin et al. (1998); (58) Herbig & Bell (1988); (59) Muzerolle et al. (2003); (60) Kraus & Hillenbrand (2009); (61) Walter & Wolstencroft (1988); (62) White et al. (1999); (63) Prato et al. (2002); (64) Reid & Hawley (1999); (65) Walter et al. (2003); (66) Cowley (1972); (67) Martín et al. (1994); (68) Gomez et al. (1992); (69) this work; (70) Kraus et al. (2017); (71) Herczeg & Hillenbrand (2008); (72) Nesterov et al. (1995); (73) Martín (2000); (74) Bowler & Hillenbrand (2015); (75) Briceño et al. (1999); (76) Luhman (2018); (77) Racine (1968); (78) Hartigan et al. (1995); (79) Boss (1937); (80) Steffen et al. (2001); (81) Malfait et al. (1998); (82) Li & Hu (1998); (83) Liu et al. (2021); (84) Findeisen & Hillenbrand (2010). |
| Adopt | Adopted spectral type |
| pmRA | Gaia DR3 proper motion in right ascensionddProper motions, parallaxes, and distances for LkCa 3 A, V410 Anon 25, XZ Tau A, LkHa332/G1, and V807 Tau are from radio interferometry (Galli et al., 2018). |
| e_pmRA | Error in pmRAddProper motions, parallaxes, and distances for LkCa 3 A, V410 Anon 25, XZ Tau A, LkHa332/G1, and V807 Tau are from radio interferometry (Galli et al., 2018). |
| pmDec | Gaia DR3 proper motion in declinationddProper motions, parallaxes, and distances for LkCa 3 A, V410 Anon 25, XZ Tau A, LkHa332/G1, and V807 Tau are from radio interferometry (Galli et al., 2018). |
| e_pmDec | Error in pmDecddProper motions, parallaxes, and distances for LkCa 3 A, V410 Anon 25, XZ Tau A, LkHa332/G1, and V807 Tau are from radio interferometry (Galli et al., 2018). |
| plx | Gaia DR3 parallaxddProper motions, parallaxes, and distances for LkCa 3 A, V410 Anon 25, XZ Tau A, LkHa332/G1, and V807 Tau are from radio interferometry (Galli et al., 2018). |
| e_plx | Error in plxddProper motions, parallaxes, and distances for LkCa 3 A, V410 Anon 25, XZ Tau A, LkHa332/G1, and V807 Tau are from radio interferometry (Galli et al., 2018). |
| r_med_geo | Median of the geometric distance posterior (Bailer-Jones et al., 2021)ddProper motions, parallaxes, and distances for LkCa 3 A, V410 Anon 25, XZ Tau A, LkHa332/G1, and V807 Tau are from radio interferometry (Galli et al., 2018). |
| r_lo_geo | 16th percentile of the geometric distance posterior (Bailer-Jones et al., 2021)ddProper motions, parallaxes, and distances for LkCa 3 A, V410 Anon 25, XZ Tau A, LkHa332/G1, and V807 Tau are from radio interferometry (Galli et al., 2018). |
| r_hi_geo | 84th percentile of the geometric distance posterior (Bailer-Jones et al., 2021)ddProper motions, parallaxes, and distances for LkCa 3 A, V410 Anon 25, XZ Tau A, LkHa332/G1, and V807 Tau are from radio interferometry (Galli et al., 2018). |
| RVel | Radial velocity |
| e_RVel | Error in RVel |
| vscatter | VSCATTER for radial velocity from SDSS-IV DR17 (Abdurro’uf et al., 2022) |
| r_RVel | Radial velocity referenceee (1) Gaia DR3; (2) Abdurro’uf et al. (2022); (3) Gontcharov (2006); (4) Torres et al. (2013); (5) Nguyen et al. (2012); (6) Krolikowski et al. (2021); (7) Kounkel et al. (2019); (8) Hartmann et al. (1986); (9) Zhang et al. (2021) and LAMOST DR7; (10) Basri & Marcy (1995); (11) White & Basri (2003); (12) Reipurth et al. (1990); (13) Kraus et al. (2017); (14) Muzerolle et al. (2003); (15) Mathieu et al. (1997). |
| U | component of space velocity |
| e_U | Error in U |
| V | component of space velocity |
| e_V | Error in V |
| W | component of space velocity |
| e_W | Error in W |
| Gmag | Gaia DR3 magnitude |
| e_Gmag | Error in Gmag |
| GBPmag | Gaia DR3 magnitude |
| e_GBPmag | Error in GBPmag |
| GRPmag | Gaia DR3 magnitude |
| e_GRPmag | Error in GRPmag |
| RUWE | Gaia DR3 renormalized unit weight error |
| outlier | Astrometric outlierff * = outlier in distance or proper motion offset in Figures 2–5. |
| group | Taurus group based on Gaia DR3 astrometry |
Note. — The table is available in a machine-readable form.
| Column Label | Description |
|---|---|
| GaiaDR3 | Gaia DR3 source name |
| 2MASS | 2MASS source name |
| WISEA | AllWISE source nameaaThe WISE source name for Gaia DR3156162678718169344 is from the WISE All-Sky Catalog. |
| Name | Other source name |
| RAdeg | Gaia DR3 right ascension (ICRS at Epoch 2016.0) |
| DEdeg | Gaia DR3 declination (ICRS at Epoch 2016.0) |
| pmRA | Gaia DR3 proper motion in right ascension |
| e_pmRA | Error in pmRA |
| pmDec | Gaia DR3 proper motion in declination |
| e_pmDec | Error in pmDec |
| plx | Gaia DR3 parallax |
| e_plx | Error in plx |
| r_med_geo | Median of the geometric distance posterior (Bailer-Jones et al., 2021) |
| r_lo_geo | 16th percentile of the geometric distance posterior (Bailer-Jones et al., 2021) |
| r_hi_geo | 84th percentile of the geometric distance posterior (Bailer-Jones et al., 2021) |
| RVel | Gaia DR3 radial velocity |
| e_RVel | Error in RVel |
| U | component of space velocity |
| e_U | Error in U |
| V | component of space velocity |
| e_V | Error in V |
| W | component of space velocity |
| e_W | Error in W |
| Gmag | Gaia DR3 magnitude |
| e_Gmag | Error in Gmag |
| GBPmag | Gaia DR3 magnitude |
| e_GBPmag | Error in GBPmag |
| GRPmag | Gaia DR3 magnitude |
| e_GRPmag | Error in GRPmag |
| RUWE | Gaia DR3 renormalized unit weight error |
| Jmag | 2MASS magnitude |
| e_Jmag | Error in Jmag |
| Hmag | 2MASS magnitude |
| e_Hmag | Error in Hmag |
| Ksmag | 2MASS magnitude |
| e_Ksmag | Error in Ksmag |
| W1mag | WISE W1 magnitude |
| e_W1mag | Error in W1mag |
| W2mag | WISE W2 magnitude |
| e_W2mag | Error in W2mag |
| W3mag | WISE W3 magnitude |
| e_W3mag | Error in W3mag |
| f_W3mag | Flag on W3magbbnodet = nondetection; false = detection from WISE appears to be false or unreliable based on visual inspection. |
| W4mag | WISE W4 magnitude |
| e_W4mag | Error in W4mag |
| f_W4mag | Flag on W4magbbnodet = nondetection; false = detection from WISE appears to be false or unreliable based on visual inspection. |
| DiskType | Disk type |
| group | Taurus group based on Gaia DR3 astrometry |
Note. — The table is available in a machine-readable form.
| Column Label | Description |
|---|---|
| GaiaDR3 | Gaia DR3 source name |
| Name | Other source name |
| RAdeg | Gaia DR3 right ascension (ICRS at Epoch 2016.0) |
| DEdeg | Gaia DR3 declination (ICRS at Epoch 2016.0) |
| SpType | Spectral type |
| r_SpType | Spectral type referenceaa (1) Liu et al. (2021); (2) measured in this work with LAMOST DR7 data; (3) measured in this work with GMOS data; (4) Slesnick et al. (2006); (5) Riaz et al. (2006); (6) Cannon & Pickering (1993); (7) Esplin & Luhman (2019); (8) Nesterov et al. (1995); (9) Wichmann et al. (1996); (10) White et al. (2007); (11) Walter & Wolstencroft (1988); (12) Patterer et al. (1993); (13) Hartigan & Kenyon (2003); (14) Herczeg & Hillenbrand (2014); (15) measured in this work with Red Channel data; (16) Kraus et al. (2017); (17) Cannon & Mayall (1949); (18) Findeisen & Hillenbrand (2010); (19) Luhman et al. (2017); (20) Zhang et al. (2018); (21) measured in this work with SpeX data from Zhang et al. (2018); (22) Gomez et al. (1992); (23) Briceño et al. (1998); (24) Reid & Hawley (1999); (25) Esplin & Luhman (2017); (26) Esplin et al. (2014); (27) Luhman et al. (2006); (28) Cowley et al. (1969); (29) Mooley et al. (2013); (30) Neuhäuser et al. (1995); (31) Magazzú et al. (1997); (32) Gizis et al. (1999); (33) Manara et al. (2017); (34) Li & Hu (1998); (35) Alcalá et al. (1996); (36) Alcalá et al. (2000); (37) Biazzo et al. (2012); (38) Grenier et al. (1999); (39) Abt (2008); (40) McCuskey (1959); (41) Cowley (1972); (42) Bidelman et al. (1988); (43) Binks et al. (2015); (44) Vieira et al. (2003); (45) Mora et al. (2001); (46) Gagné et al. (2015); (47) Cowley (1968); (48) Wilson & Joy (1952); (49) Zickgraf et al. (2005); (50) Houk & Swift (1999); (51) Paunzen et al. (2001); (52) Briceño et al. (2019). |
| Adopt | Adopted spectral type |
| pmRA | Gaia DR3 proper motion in right ascension |
| e_pmRA | Error in pmRA |
| pmDec | Gaia DR3 proper motion in declination |
| e_pmDec | Error in pmDec |
| plx | Gaia DR3 parallax |
| e_plx | Error in plx |
| r_med_geo | Median of the geometric distance posterior (Bailer-Jones et al., 2021) |
| r_lo_geo | 16th percentile of the geometric distance posterior (Bailer-Jones et al., 2021) |
| r_hi_geo | 84th percentile of the geometric distance posterior (Bailer-Jones et al., 2021) |
| RVel | Radial velocity |
| e_RVel | Error in RVel |
| vscatter | VSCATTER for radial velocity from SDSS-IV DR17 (Abdurro’uf et al., 2022) |
| r_RVel | Radial velocity referencebb (1) Gaia DR3; (2) Abdurro’uf et al. (2022); (3) Nguyen et al. (2012); (4) Soubiran et al. (2018); (5) Walter & Wolstencroft (1988); (6) Kraus et al. (2017); (7) Mermilliod et al. (2009); (8) Zhang et al. (2021) and LAMOST DR7; (9) Reid & Hawley (1999); (10) Gontcharov (2006); (11) Gaia DR2; (12) Biazzo et al. (2012); (13) Buder et al. (2021); (14) Grenier et al. (1999). |
| U | component of space velocity |
| e_U | Error in U |
| V | component of space velocity |
| e_V | Error in V |
| W | component of space velocity |
| e_W | Error in W |
| Gmag | Gaia DR3 magnitude |
| e_Gmag | Error in Gmag |
| GBPmag | Gaia DR3 magnitude |
| e_GBPmag | Error in GBPmag |
| GRPmag | Gaia DR3 magnitude |
| e_GRPmag | Error in GRPmag |
| RUWE | Gaia DR3 renormalized unit weight error |
| 2m | Closest 2MASS source within |
| 2msep | Angular separation between Gaia DR3 (epoch 2000) and 2MASS |
| 2mclosest | Is this Gaia source the closest match for the 2MASS source? |
| wise | Closest WISE source within ccSource name from AllWISE Source Catalog, AllWISE Reject Catalog, or WISE All-Sky Source Catalog. |
| wisesep | Angular separation between Gaia DR3 (epoch 2010.5) and WISE |
| wiseclosest | Is this Gaia source the closest match for the WISE source? |
| Jmag | 2MASS magnitude |
| e_Jmag | Error in Jmag |
| Hmag | 2MASS magnitude |
| e_Hmag | Error in Hmag |
| Ksmag | 2MASS magnitude |
| e_Ksmag | Error in Ksmag |
| W1mag | WISE W1 magnitude |
| e_W1mag | Error in W1mag |
| W2mag | WISE W2 magnitude |
| e_W2mag | Error in W2mag |
| W3mag | WISE W3 magnitude |
| e_W3mag | Error in W3mag |
| f_W3mag | Flag on W3magddnodet = nondetection; false = detection from WISE catalog appears to be false or unreliable based on visual inspection. |
| W4mag | WISE W4 magnitude |
| e_W4mag | Error in W4mag |
| f_W4mag | Flag on W4magddnodet = nondetection; false = detection from WISE catalog appears to be false or unreliable based on visual inspection. |
| ExcW2 | Excess present in W2? |
| ExcW3 | Excess present in W3? |
| ExcW4 | Excess present in W4? |
| DiskType | Disk Type |
| association | Association |
Note. — The table is available in a machine-readable form.
| 1.4 | 5.18 |
| 1.5 | 5.37 |
| 1.6 | 5.56 |
| 1.7 | 5.75 |
| 1.8 | 5.94 |
| 1.9 | 6.13 |
| 2.0 | 6.32 |
| 2.1 | 6.51 |
| 2.2 | 6.70 |
| 2.3 | 6.85 |
| 2.4 | 7.00 |
| 2.5 | 7.18 |
| 2.6 | 7.40 |
| 2.7 | 7.65 |
| 2.8 | 7.92 |
Note. — The fit can be transformed to spectral types and other bands using the typical intrinsic colors of young stars from Luhman (2022a).
| Group/Association | aaMedian of the offsets from the median sequence for UCL/LCC in (Taurus groups) or (other associations) for low-mass stars. | N∗bbNumber of low-mass stars used in calculation of . | AgeccCalculated from assuming an age of 20 Myr for UCL/LCC and log L/log age. |
|---|---|---|---|
| (mag) | (Myr) | ||
| Taurus Groups | |||
| L1527 | 2.320.70 | 5 | 0.6 |
| L1495/B209 | 1.680.87 | 19 | 1.5 |
| L1521/B213 | 1.521.01 | 8 | 1.9 |
| L1536 | 1.480.70 | 15 | 2.1 |
| L1517 | 1.350.60 | 21 | 2.5 |
| L1524/L1529/B215 | 1.320.93 | 10 | 2.6 |
| L1551 | 1.300.76 | 17 | 2.7 |
| L1544 | 1.110.87 | 6 | 3.6 |
| HD28354 | 0.780.36 | 7 | 6.0 |
| Associations and Clusters Near Taurus | |||
| V1362 Tau | 0.300.26 | 19 | 135 |
| HD35187 | 0.080.15 | 16 | 184 |
| HD33413 | 0.050.12 | 16 | 193 |
| HD284346 | 0.200.10 | 14 | 274 |
| 93 Tau | 0.360.24 | 40 | 3513 |
| 69 Ori | 0.630.13 | 137 | 5311 |
| Tau | 0.670.11 | 69 | 569 |
| Per | 0.730.11 | 116 | 6111 |
| Pleiades | 1.190.12 | 189 | 12424 |
| Group | DistanceaaMedian value for members that have Gaia DR3 proper motions and parallaxes and are not outliers in Figures 2–5. | aaMedian value for members that have Gaia DR3 proper motions and parallaxes and are not outliers in Figures 2–5. | aaMedian value for members that have Gaia DR3 proper motions and parallaxes and are not outliers in Figures 2–5. | N∗ | bbMedian value for members that have Gaia DR3 proper motions and parallaxes, are not outliers in Figures 2–5, have radial velocity measurements, and have VSCATTER km s-1 from Abdurro’uf et al. (2022) when available. | bbMedian value for members that have Gaia DR3 proper motions and parallaxes, are not outliers in Figures 2–5, have radial velocity measurements, and have VSCATTER km s-1 from Abdurro’uf et al. (2022) when available. | bbMedian value for members that have Gaia DR3 proper motions and parallaxes, are not outliers in Figures 2–5, have radial velocity measurements, and have VSCATTER km s-1 from Abdurro’uf et al. (2022) when available. | bbMedian value for members that have Gaia DR3 proper motions and parallaxes, are not outliers in Figures 2–5, have radial velocity measurements, and have VSCATTER km s-1 from Abdurro’uf et al. (2022) when available. | bbMedian value for members that have Gaia DR3 proper motions and parallaxes, are not outliers in Figures 2–5, have radial velocity measurements, and have VSCATTER km s-1 from Abdurro’uf et al. (2022) when available. | bbMedian value for members that have Gaia DR3 proper motions and parallaxes, are not outliers in Figures 2–5, have radial velocity measurements, and have VSCATTER km s-1 from Abdurro’uf et al. (2022) when available. | N∗ |
|---|---|---|---|---|---|---|---|---|---|---|---|
| (pc) | (mas yr-1) | (km s-1) | (km s-1) | ||||||||
| Taurus Groups | |||||||||||
| L1495/B209 | 130 | 8.8 | 25.2 | 66 | 16.4 | 11.9 | 10.9 | 1.9 | 1.1 | 1.1 | 47 |
| B209N | 159 | 12.1 | 18.1 | 5 | 18.7 | 12.4 | 7.4 | 3 | |||
| L1489/L1498 | 149 | 14.2 | 18.8 | 4 | 17.9 | 13.7 | 7.3 | 1 | |||
| L1521/B213 | 158 | 11.3 | 17.7 | 26 | 17.7 | 12.8 | 7.0 | 0.8 | 0.7 | 0.7 | 16 |
| HD28354 | 129 | 8.9 | 26.7 | 16 | 16.2 | 13.9 | 10.7 | 1.7 | 0.8 | 0.8 | 9 |
| L1524/L1529/B215 | 128 | 7.0 | 21.3 | 59 | 15.8 | 10.9 | 9.6 | 1.1 | 0.7 | 0.7 | 37 |
| L1517 | 156 | 4.4 | 24.7 | 57 | 16.0 | 14.5 | 10.7 | 2.4 | 0.8 | 0.8 | 26 |
| L1527 | 140 | 5.4 | 20.2 | 25 | 15.9 | 11.5 | 9.7 | 1.1 | 0.8 | 0.8 | 18 |
| L1544 | 168 | 3.0 | 17.3 | 14 | 18.2 | 12.2 | 9.3 | 0.7 | 0.8 | 0.8 | 4 |
| L1536 | 161 | 10.3 | 17.0 | 35 | 16.5 | 13.8 | 7.0 | 1.0 | 1.1 | 1.1 | 23 |
| L1551 | 144 | 12.1 | 19.0 | 54 | 16.6 | 15.2 | 7.6 | 2.0 | 0.9 | 0.9 | 33 |
| T Tau | 144 | 7.0 | 12.3 | 5 | 18.0 | 8.4 | 8.2 | 3 | |||
| L1558 | 196 | 5.0 | 13.3 | 7 | 19.3 | 13.8 | 10.4 | 0.5 | 0.3 | 0.3 | 4 |
| Associations Near Taurus | |||||||||||
| 93 Tau | 119 | 0.0 | 14.5 | 190 | 13.4 | 6.4 | 9.8 | 2.4 | 0.6 | 0.6 | 69 |
| HD284346 | 192 | 4.8 | 6.2 | 78 | 14.6 | 5.9 | 5.8 | 2.9 | 0.2 | 0.2 | 15 |
| HD33413 | 173 | 3.0 | 19.7 | 47 | 16.8 | 15.1 | 9.2 | 2.3 | 0.7 | 0.7 | 9 |
| 69 Ori | 199 | 7.7 | 19.3 | 591 | 17.0 | 22.6 | 3.7 | 2.5 | 0.7 | 0.7 | 78 |
| V1362 Tau | 176 | 1.3 | 18.2 | 53 | 18.8 | 13.7 | 9.2 | 1.4 | 0.5 | 0.5 | 14 |
| HD35187 | 160 | 3.9 | 25.8 | 65 | 22.4 | 17.9 | 10.7 | 5.6 | 0.7 | 0.7 | 7 |
| Tau | 156 | 22.2 | 22.1 | 354 | 15.4 | 23.4 | 7.7 | 1.9 | 1.0 | 1.0 | 72 |
| Component from | Group Classifications |
|---|---|
| Krolikowski et al. (2021) | from this workaaNumbers of stars are indicated in parentheses. |
| C1 | L1551 (38), T Tau (5), field star (1) |
| C2 | L1495/B209 (55) |
| C3 | L1517 (28), V1362 Tau (3), HD 33413 (1), field star (4) |
| C4 | L1517 (25), field star (1) |
| C5 | L1536 (32) |
| C6 | L1524/L1529/B215 (52), HD 28354 (14), L1495/B209 (2), L1527 (1), L1536 (1), 93 Tau (1), |
| Taurus member not assigned to a group (1) | |
| C7 | L1527 (22) |
| C8 | L1521/B213 (20), L1524/L1529/B215 (1) |
| C9 | 32 Ori (4), field star (2) |
| C10 | 32 Ori (3) |
| D1 | L1544 (12), V1362 Tau (8), HD 35187 (2), field star (2) |
| D2 | L1551 (20), L1558 (9), 32 Ori (1), 93 Tau (6), field star (19) |
| D3 | 93 Tau (16), L1524/L1529/B215 (3), L1495/B209 (2), field star (4) |
| D4 | L1495/B209 (10), L1524/L1529/B215 (10), L1521/B213 (8), L1536 (8), L1489/L1498 (6), B209N (6), |
| 93 Tau (4), 32 Ori (3), HD 28354 (2), Taurus member not assigned to a group (2), field star (19) |