2022
[1]\fnmT. N. \surTran
1]\orgdivDiv. Intelligent Medical Systems, \orgnameDKFZ, \orgaddress\countryGermany 2]\orgdivInterdisciplinary Endoscopy Center (IEZ), \orgnameUniversity Hospital Heidelberg,\orgaddress \countryGermany 3]\orgdivDepartment of Gastroenterology, Hepatology and Endocrinology, \orgnameRobert-Bosch Hospital (RBK), \countryGermany 4]\orgdivClinic for General Internal Medicine, Gastroenterology, Hepatology and Infectiology, Pneumology, \orgnameKlinikum Stuttgart, \orgaddress \countryGermany
Sources of performance variability in deep learning-based polyp detection
Abstract
Validation metrics are a key prerequisite for the reliable tracking of scientific progress and for deciding on the potential clinical translation of methods. While recent initiatives aim to develop comprehensive theoretical frameworks for understanding metric-related pitfalls in image analysis problems, there is a lack of experimental evidence on the concrete effects of common and rare pitfalls on specific applications. We address this gap in the literature in the context of colon cancer screening. Our contribution is twofold. Firstly, we present the winning solution of the Endoscopy Computer Vision Challenge (EndoCV) on colon cancer detection, conducted in conjunction with the IEEE International Symposium on Biomedical Imaging (ISBI) 2022. Secondly, we demonstrate the sensitivity of commonly used metrics to a range of hyperparameters as well as the consequences of poor metric choices. Based on comprehensive validation studies performed with patient data from six clinical centers, we found all commonly applied object detection metrics to be subject to high inter-center variability. Furthermore, our results clearly demonstrate that the adaptation of standard hyperparameters used in the computer vision community does not generally lead to the clinically most plausible results. Finally, we present localization criteria that correspond well to clinical relevance. Our work could be a first step towards reconsidering common validation strategies in automatic colon cancer screening applications.
keywords:
Validation, Evaluation, Metrics, Object detection, Surgical data science, Variability1 Introduction
Colorectal cancer is one of the most common cancer types, ranking second in females and third in males haggar2009colorectal . By detecting and subsequently resecting neoplastic polyps during screening colonoscopy, the risk of developing the disease can be reduced significantly. Research focuses on developing deep learning (DL) solutions for automated detection of polyps in colonoscopy videos fitting2022video ; Ali2022EndoCV21 ; Ali2022EndoCV22 ; Bernal2021giana21 ; Bernal2021giana1718 . However, to date, the metrics with which algorithms are validated receive far too little attention. These metrics are not only important for measuring scientific progress, but also for gauging a method’s potential for clinical translation. While previous work has highlighted general metric pitfalls in the broader context of classification, segmentation and detection Reinke2021CommonLO , we are not aware of any prior studies systematically analyzing common metrics in the context of polyp detection. Our underlying hypothesis was that reported performance values in polyp detection methods are largely misleading as they are sensitive to many validation design choices including (1) the choice of test set and (2) the chosen metric configurations (e.g. threshold for the localization criteria). Our contribution is twofold: Firstly, we present the winning solution of the Endoscopy Computer Vision Challenge (EndoCV) on colon cancer detection, conducted in conjunction with the IEEE International Symposium on Biomedical Imaging (ISBI) 2022. Secondly, based on publicly available challenge data, we demonstrate the sensitivity of commonly used metrics to a range of hyperparameters as well as the consequences of poor metric choices.
2 Methods
Here, we present the winning method of the EndoCV challenge on colon cancer detection, conducted in conjunction with ISBI 2022 (Sec. 2.1), and revisit common detection metrics including their hyperparameters (Sec. 2.2).
2.1 Object detection algorithm
We base our study on a state-of-the-art detection method, namely the winning entry yamlahi2022heterogeneous of the EndoCV 2022 polyp detection challenge Ali2022EndoCV22 .
Method overview: The method is illustrated in Fig. 1. A heterogeneous ensemble of YOLOv5-based models was trained. To this end, we split the training data into subsets. To avoid data leakage, the split was performed along each sequence ID. Originally, we created four folds for stratified four-fold cross-validation, but the final models were trained on only two of the four folds due to training and inference time restrictions. Furthermore, we trained each model either with light augmentation on EndoCV data only, heavy augmentation on EndoCV data only, or light augmentation on EndoCV data and external data (see yamlahi2022heterogeneous for details). Overall, this led to six ensemble members. The individual member predictions were merged using the weighted boxes fusion algorithm. As we observed a tendency towards oversegmentation, we added a postprocessing step to shrink the bounding boxes.
Implementation details: The models were trained for 20 epochs using a stochastic gradient descent optimizer, a learning rate of 0.1, and a complete Intersection over Union (CIoU) loss. The non-maximum suppression algorithm (NMS) was applied to each ensemble member individually with an Intersection over Union (IoU) threshold of 0.5. For the weighted boxes fusion algorithm hyperparameters, we chose an IoU threshold of 0.5, a skip box threshold of 0.02, and all models were weighted equally. During postprocessing, we shrank all bounding boxes with a confidence score higher than 0.4 by 2% of their size. We evaluated the ensemble a single time on our test data set.
2.2 Object detection metrics
Three metric-related design decisions are important when assessing performance of object detection algorithms MaierHein2022Metrics :
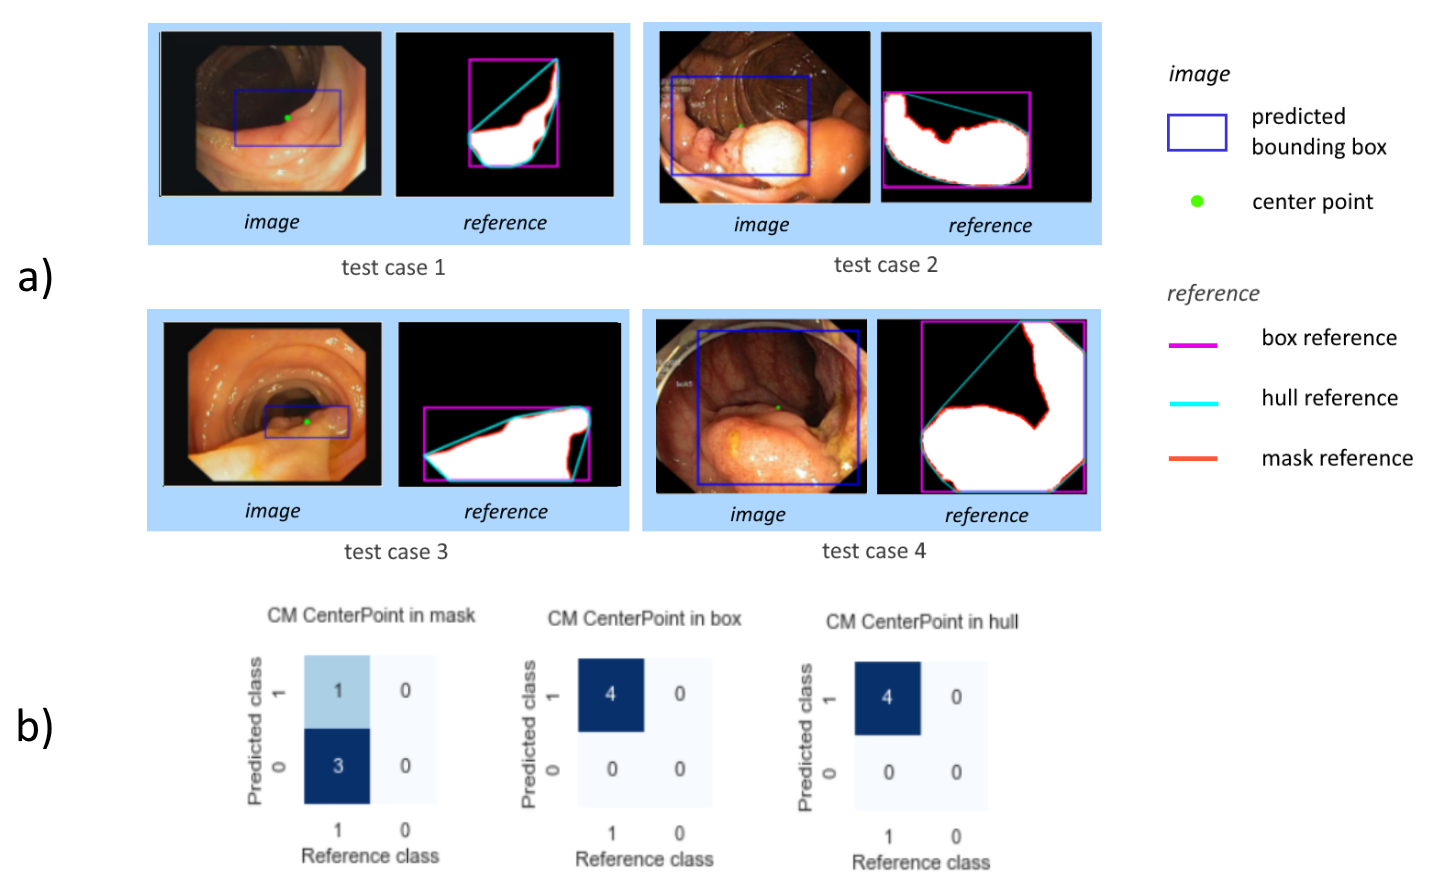
(1) Localization criterion: The localization criterion determines whether a predicted object spatially corresponds to one of the reference objects and vice versa by measuring the spatial similarity between prediction (represented by a bounding box, pixel mask, center point or similar) and reference object. It defines whether the prediction hit/detected (true positive) or missed (false positive) the reference. Any reference object not detected by the algorithm is defined as false negative. The localization criteria that were applied in this work comprise two groups, namely the point-based criteria and the overlap-based criteria (Fig. 2).
(2) Assignment strategy: As applying the localization criterion might lead to ambiguous matchings, such as two predictions being assigned to the same reference object, an assignment strategy needs to be chosen that determines how potential ambiguities are resolved. As multiple polyps in the same image are rather rare, an assignment strategy is not as relevant as in other applications. With respect to the metric configuration, we therefore focus on the localization criterion and the classification metrics.
(3) Classification metric: Based on the choice of localization criterion and assignment strategy, standard classification metrics can be computed at object level Reinke2021CommonLO . The most popular multi-threshold metric in object detection is Average Precision (AP) (Fig. 3).
As a foundation of this work, we determined common metrics in object detection challenges, along with their respective localization criterion and classification metric (Tab. 1).
| Localization criterion | Classification metric | |||||||
| EndoVis 2015 Bernal2017ComparativeVO | Point inside mask | PPV Sensitivity Overall/Average F1-score | ||||||
|
Point inside mask | PPV Sensitivity F1/F2-score Custom metrics | ||||||
|
|
|
||||||
| \botrule |
3 Experiments and Results
In this section, we investigate the sensitivity of popular classification metrics to the test set composition (Sec. 3.1) and the localization criterion (Sec. 3.2). We further assess the clinical value of commonly used metric configurations (Sec. 3.3).
3.1 Effect of test set
In the following, we quantitatively assess the performance variability resulting from the chosen test set, specifically from the target domain (i.e. the clinical validation center) and the distribution of polyp size.
Sensitivity to center: To show the variability of performance resulting from different test sets, we used data from six validation centers ali2021polypgen . Fig. 4 shows the performance of our object detection method (Sec. 2.1) according to commonly used metrics. These exhibit high variability between centers. For example, the AP ranges from [0.38, 0.65], which is notable, given that the AP of the top three submissions for EndoCV 2022 ranged from [0.12, 0.33].
Sensitivity to polyp size: Using the polyp size definitions introduced by the EndoCV 2021 challenge Ali2022EndoCV21 , we further calculated the AP scores from all six validation centers, stratified by polyp size (Tab. 2). A high variability can be observed, indicating that algorithm performance is highly affected by the distribution of polyp sizes.
| Metric | AP@0.5 | AP@[0.5:0.95] | n | |||||||||||||||||||
| Polyp size | small | medium | large | small | medium | large | ||||||||||||||||
| Center 1 | 0.24 | 0.48 | 0.73 | 0.14 | 0.33 | 0.55 | 256 | 99% | ||||||||||||||
| Center 2 | 0.10 | 0.58 | 0.85 | 0.04 | 0.42 | 0.70 | 301 | 90% | ||||||||||||||
| Center 3 | 0.16 | 0.64 | 0.91 | 0.10 | 0.47 | 0.72 | 457 | 99% | ||||||||||||||
| Center 4 | 0.14 | 0.33 | 0.59 | 0.06 | 0.27 | 0.43 | 227 | 64% | ||||||||||||||
| Center 5 | 0.19 | 0.39 | 0.59 | 0.12 | 0.26 | 0.42 | 208 | 99% | ||||||||||||||
| Center 6 | 0.00 | 0.52 | 0.89 | 0.00 | 0.39 | 0.67 | 88 | 94% | ||||||||||||||
|
|
|
|
|
|
|
1537 | 91% | ||||||||||||||
| \botrule | ||||||||||||||||||||||
To further evaluate how the IoU values relate to polyp size and polyp type and simultaneously account for the hierarchical structure of the data set, we fit a linear mixed effects model (R version 4.1.3, package lme4). In this model, polyp size (small, medium, or large) and polyp type (flat or protruded) were fixed effects, while data center, patient identifier (ID), and image ID were random effects. The results suggest that there are strong effects of polyp type and polyp size on the IoU values. In particular when the polyp is of a protruded as opposed to a flat type, the values of IoU are on average higher by a difference of 0.08 (conditional that the other predictors remain constant). When the polyp is of a medium or small size compared to a large size, the IoU values are lower by a difference of 0.05 and 0.28, respectively (conditional that the remaining predictors remain constant).
3.2 Effect of metric configuration
In the case of polyp detection, the goal of high sensitivity (not missing a polyp) is an indispensable priority. We therefore assess the effect of design choices related to the localization criterion on the decision whether a prediction is determined to be a true or false positive.
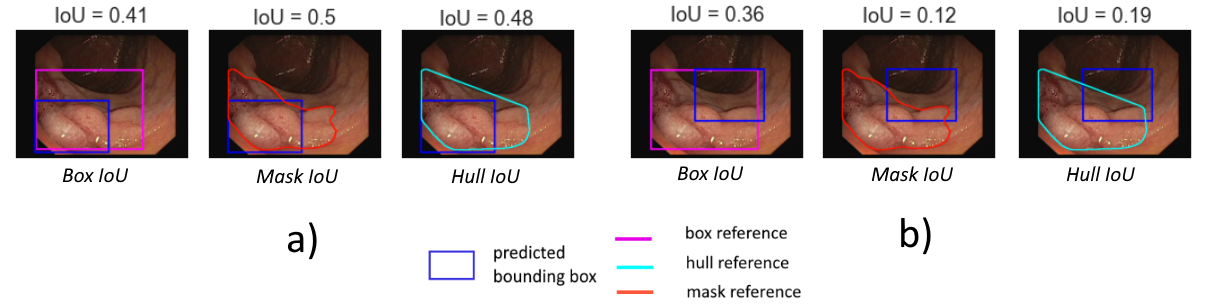
Figures 5 and 6 showcase the effect of the reference shape in point-based and overlap-based localization criteria, respectively, while Fig. 7 demonstrates the sensitivity of overlap-based criteria to different localization thresholds.
In the following, we provide experimental evidence for the showcased phenomena.
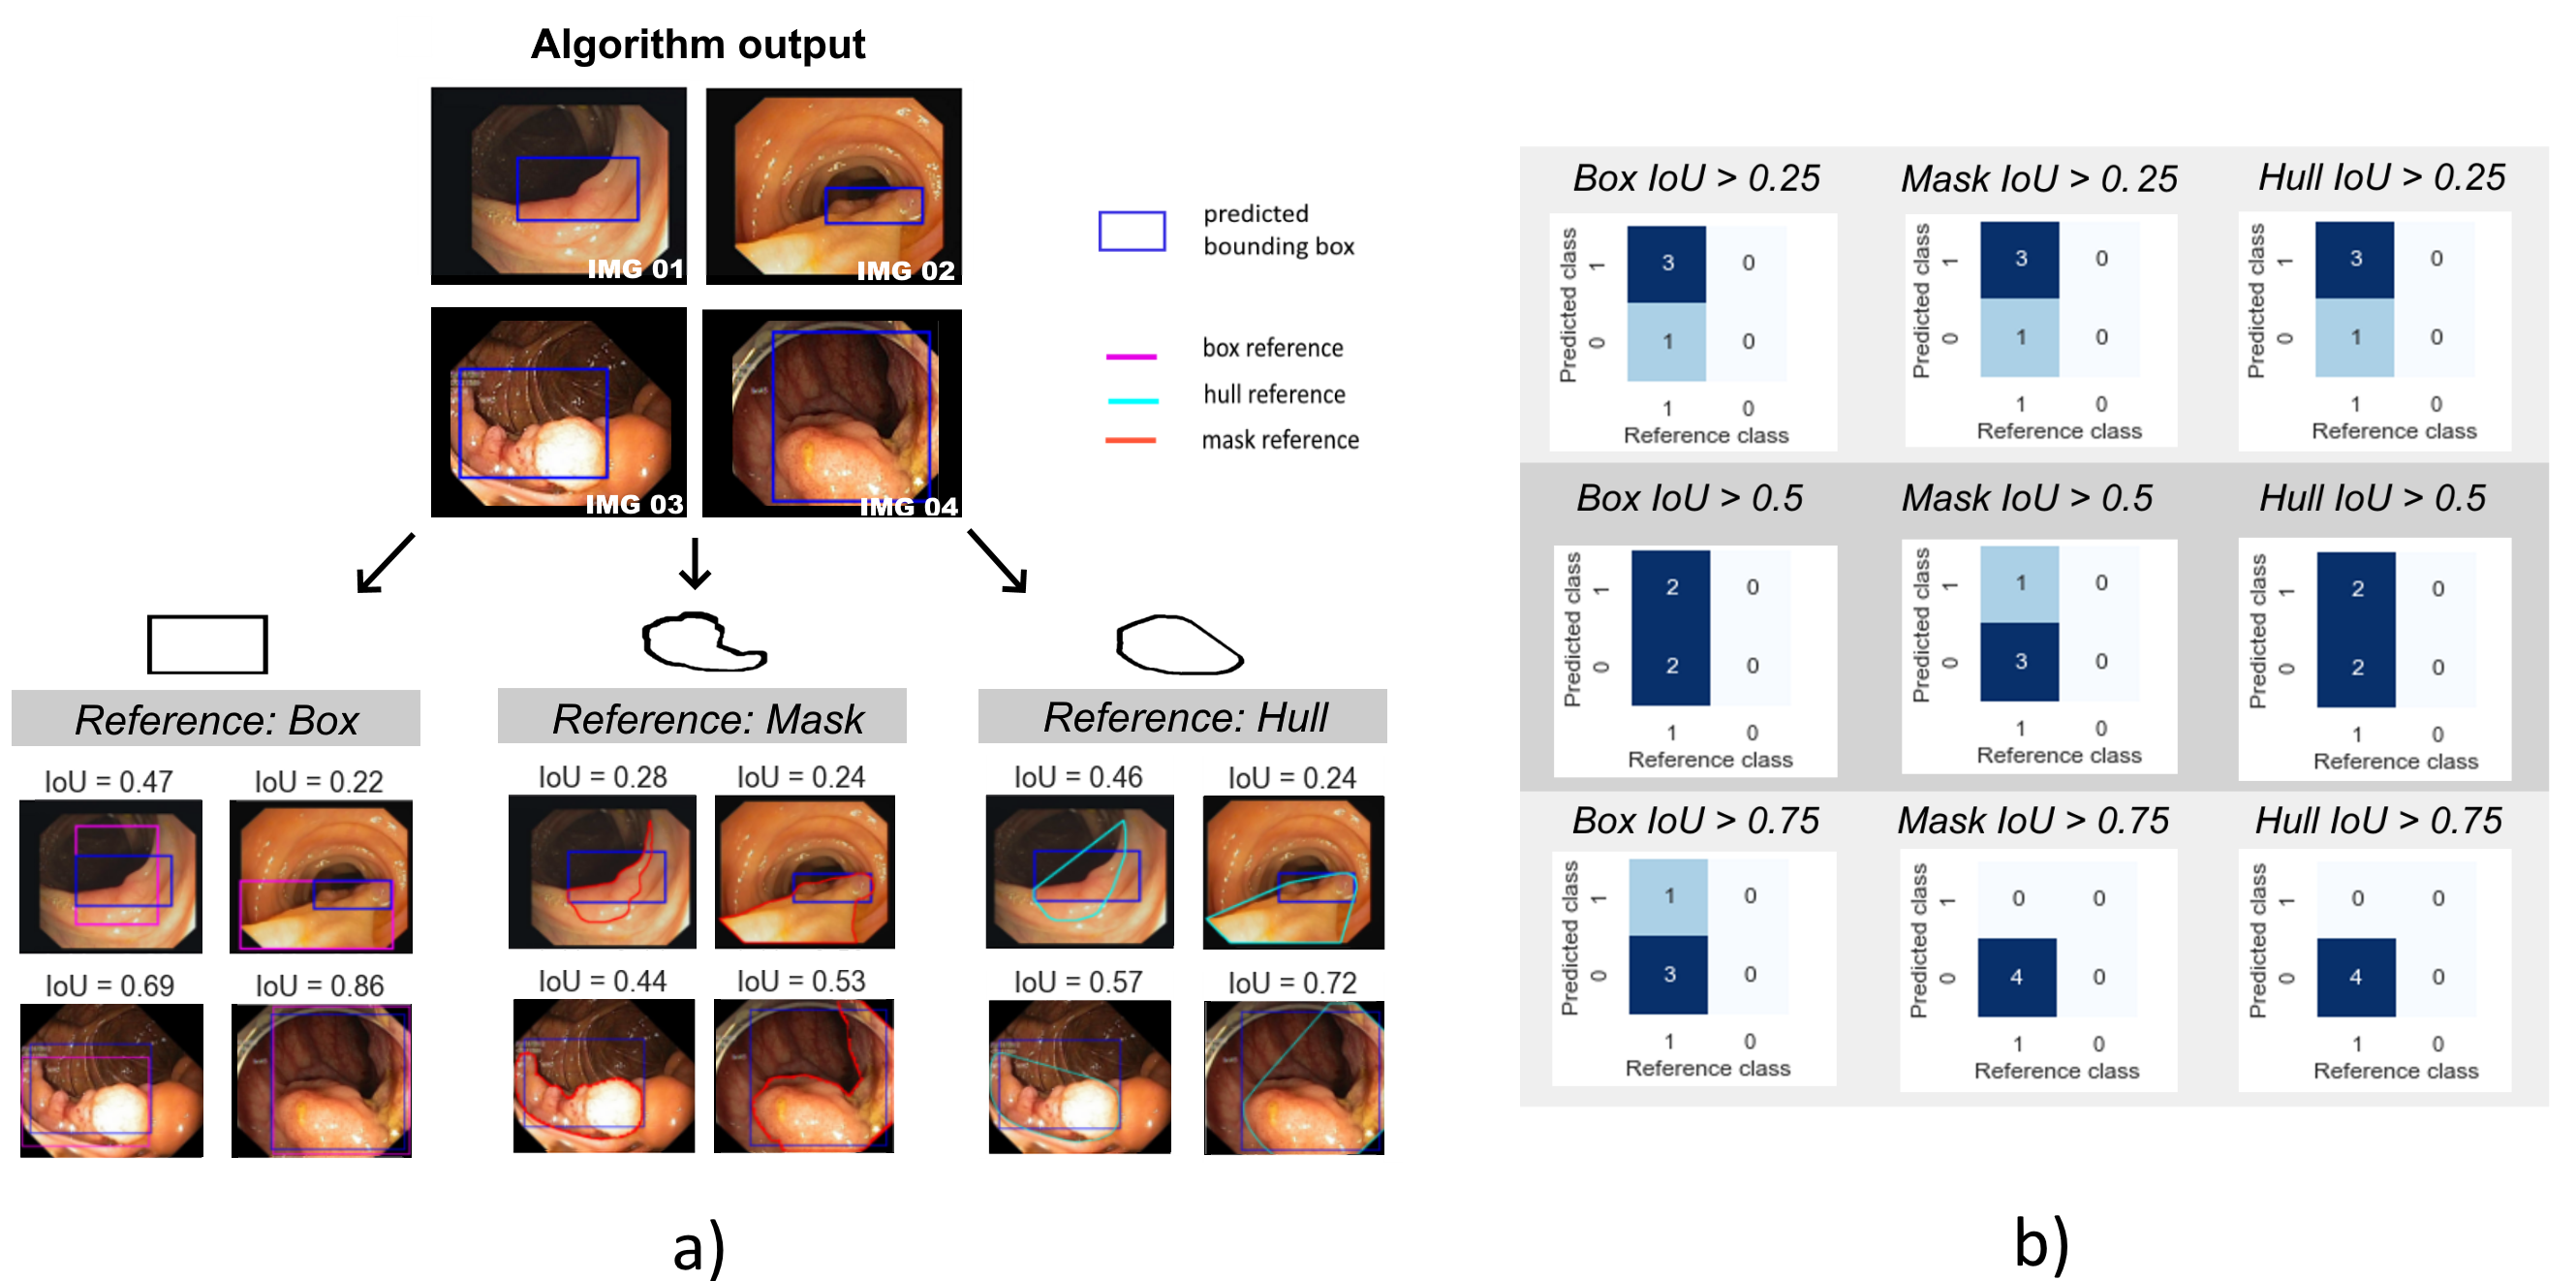
Sensitivity of the AP to the specific choice of overlap-based localization criterion: In this experiment, we investigated the AP scores using Box IoU, Mask IoU and Hull IoU criteria over a range of IoU thresholds [0.05:0.95]. The resulting curves are shown in Fig. 8a). We observe that the Mask IoU and Hull IoU-based AP scores are very similar; conversely, using Box IoU yielded overall higher AP, even at lower thresholds.
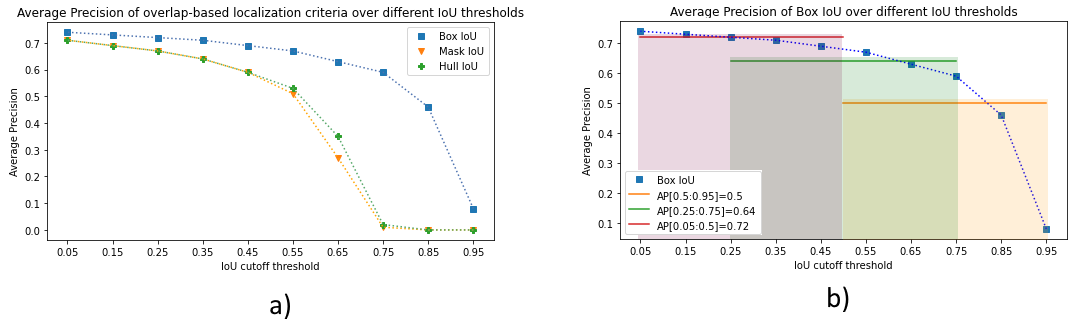
Sensitivity of the AP to the IoU range: We investigated the AP scores, using Box IoU as a criterion, over different IoU threshold ranges including the commonly used range of [0.5:0.95]. As shown in Fig. 8b), the AP scores on the commonly-used IoU range substantially differ from those on lower IoU ranges. Note that the corresponding AP for a point in mask criterion would be 0.73.
IoU vs. Point in Mask: Considering the clinical goal of prioritizing the localization of polyps more than their boundaries, we compared the values of the aggregated metrics Sensitivity, Positive Predictive Value (PPV), F1-Score, F2-Score and Average Precision using point-based localization criteria to the values obtained using Box IoU. The result is shown in Tab. 3.
Point inside reference criteria yield higher scores across all metrics compared to Box IoU over most IoU thresholds. This especially holds true for detection Sensitivity.
| Localization criterion | Box IoU=0.5 | Point inside Box | Point inside Mask | Point inside Hull |
|---|---|---|---|---|
| Sensitivity | 0.68 | 0.74 | 0.74 | 0.74 |
| PPV | 0.79 | 0.86 | 0.85 | 0.86 |
| F1-Score | 0.73 | 0.8 | 0.79 | 0.8 |
| F2-Score | 0.70 | 0.74 | 0.74 | 0.74 |
| AP | 0.66 | 0.73 | 0.73 | 0.73 |
| \botrule |
3.3 Reflection of domain interests
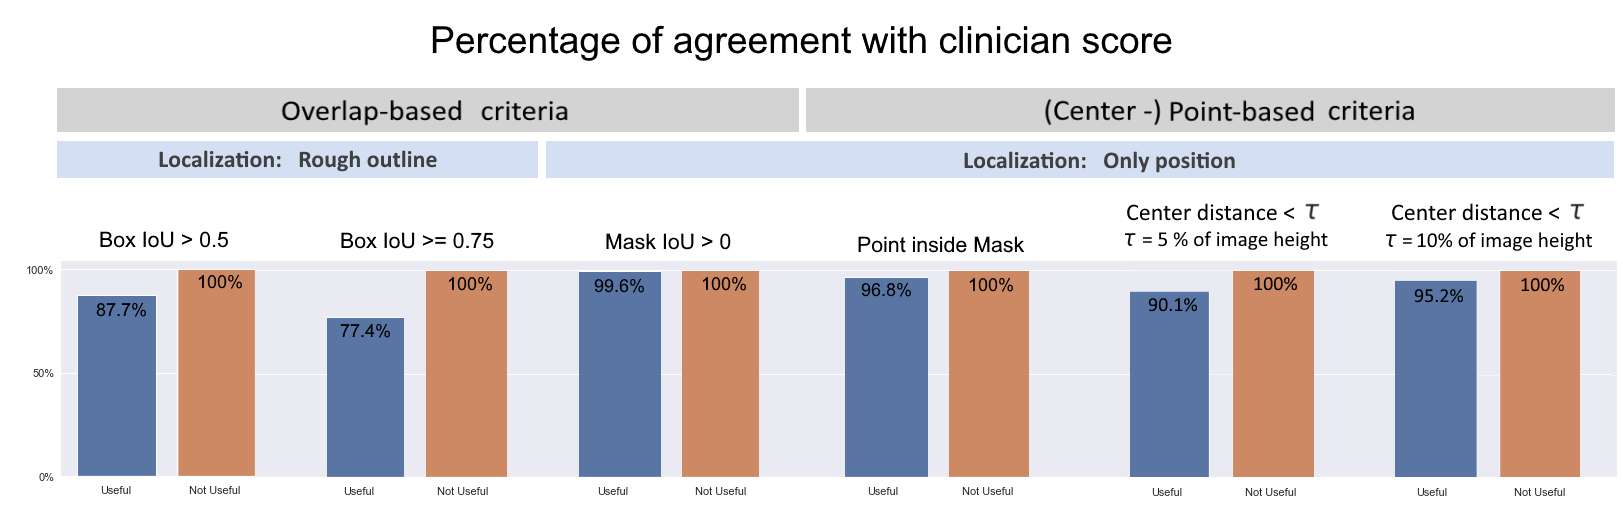
In the presence of many sources of variability depending on the metric configuration, we conducted an experiment to determine which configuration aligns most with the clinical goal. We presented colonoscopy images of over 300 patients with their predicted bounding boxes to three gastroenterologists, one with over five years and two with over ten years of experience, who rated the predicted boxes as (clinically) “useful” or “not useful”. Each clinician was responsible for one third of the images and each image was only rated once. In order to assess the agreement of certain metric configurations with the clinician score, we plotted the number of predictions that met the criterion as a fraction of the predictions rated as “useful”, as well as the number of predictions not meeting the criterion as a fraction of predictions rated as “not useful”. We applied overlap-based and point-based criteria and highlighted the localization granularity that they focus on (rough outline or only position). The result can be seen as a bar plot in Fig. 9. All predictions clinically rated as “not useful” were rejected by all localization criteria. Criteria that focus only on position yielded a higher agreement with the ”useful” score than those that localize based on overlap using rough outline.
4 Discussion
To our knowledge, we were the first to systematically investigate the variability of polyp detection performance resulting from various validation design choices. The following key insights can be derived from our experiments:
(1) Performance results are highly sensitive to various design choices: Our experiments clearly demonstrate that various validation design choices have a substantial effect on the performance computed for object detection algorithms according to popular metrics. These range from the choice of test set to the specific metric configuration used. While the effect of using different classification metrics may be increasingly well-understood MaierHein2022Metrics , we believe that common metrics, such as AP, are often regarded as black boxes and the effect of the various hyperparameters remains poorly understood. Our findings clearly suggest that hyperparameters – specifically the localization criterion and the corresponding threshold – should not indiscriminately be adopted from other work, but carefully be chosen to match the domain need.
(2) Common metric configurations do not reflect the clinical need: According to a usefulness assessment of polyp predictions from over 300 patients by three clinicians from different hospitals, commonly used localization criteria that are popular in the computer vision community do not reflect the clinical domain interest when deciding whether a prediction should be assigned a true positive or false positive. The community should therefore revisit the question of whether a good object detection method must necessarily yield a good outline of a polyp. Restricting the need to just localizing a polyp via its position (reflected by the requirement of , for example) might better approximate the clinical need and at the same time overcome problems resulting from suboptimal IoU thresholds.
(3) Common hyperparameters may be too restrictive: Our visual examples (Fig. 7) demonstrate that even fairly well-localized polyps feature an IoU below the commonly used threshold of 0.5, resulting in them being considered a miss even though a clinician might find the prediction useful. The community may therefore want to reconsider commonly used threshold ranges and use a broader range (see Fig. 8b)).
(4) Comparison of performance across datasets can be largely misleading: Our work finds that detection performance depends crucially on the polyp sizes. Hence, even if the prevalences of polyps across centers are similar, comparison of algorithm results can be largely misleading in case of different polyp size distributions.
The closest work to ours was recently presented by Ismail et al. ismail2021metrics outside the field of deep learning. They provide anecdotal evidence on the non-comparability of confusion matrices between different methods, but do not analyze common multi-threshold metrics such as AP or popular localization criteria that serve as the basis for popular classification metrics. Other related work focused on providing benchmarking data sets fitting2022video or showing limitations of metrics for clinical use cases outside the field of polyp detection Kofler2021AreWU ; Reinke2021CommonLO ; Gooding2018ComparativeEO .
A limitation of our study can be seen in the fact that we only used one object detection model. As a consequence, we are restricted to bounding boxes as predicted instances. On the other hand, the applied model was the winner of a very recent polyp detection challenge and can therefore be regarded as representative of the state of the art. Furthermore, almost all common object detection algorithms are based on predicting bounding boxes. Another limitation could be seen in the fact that we reported our findings only on a single data set ali2021polypgen . However, this data set comprises images from six centers and can therefore be seen as sufficiently representative for the scope of our research question. Finally, there are several other factors related to performance assessment that we did not prioritize in this work. These include the assignment strategy, the prevalence as well the confidence threshold in the case of counting metrics. Future work could hence explore the impact of these factors.
In conclusion, our study is the first to systematically demonstrate the sensitivity of commonly used performance metrics in deep learning-based colon cancer screening to a range of validation design choices. In showing clear evidence for the disparity between commonly used metric configurations and clinical needs, we hope to raise awareness for the importance of adapting validation in machine learning to clinical relevance in general, and spark the careful reconsideration of common validation strategies in automatic cancer screening applications in particular.
Declarations
Funding
This project was supported by a Twinning Grant of the German Cancer Research Center (DKFZ) and the Robert Bosch Center for Tumor Diseases (RBCT).
Competing interests
The authors have no relevant financial or non-financial interests to disclose.
Ethics approval
This work was conducted using public datasets of human
subject data made available by Ali2022EndoCV21 .
Consent to participate
Not applicable.
Consent for publication
Not applicable.
Availability of data and materials
Not applicable.
Code availability
Not applicable.
Authors’ contributions
All authors contributed and commented on previous versions of the manuscript. All authors read and approved the final manuscript.
References
- (1) Haggar, F., et al.: Colorectal cancer epidemiology: incidence, mortality, survival, and risk factors. Clin Colon Rect Surg. (2009) 10.1055/s-0029-1242458
- (2) Fitting, D., et al.: A video based benchmark data set (ENDOTEST) to evaluate computer-aided polyp detection systems. Scand J Gastroentero. (2022)10.1080/00365521.2022.2085059
- (3) Ali, S., et al.: Assessing generalisability of deep learning-based polyp detection and segmentation methods through a computer vision challenge. arXiv (2022) 10.48550/arXiv.2202.12031
- (4) Ali, S., et al.: Endoscopic computer vision challenges 2.0. (2022), https://endocv2022.grand-challenge.org/ Appl. Opt.2022-11-14
- (5) Bernal, J., et al.: Gastrointestinal Image ANAlysis (GIANA). (2021), https://giana.grand-challenge.org/ Appl. Opt.2022-11-15
- (6) Bernal, J., et al.: Polyp Detection in Colonoscopy Videos. Computer-Aided Analysis Of Gastrointestinal Videos. pp. 163-169 (2021)
- (7) Reinke, A., et al.: Common Limitations of Image Processing Metrics: A Picture Story. arXiv (2021) 10.48550/arXiv.2104.05642
- (8) Yamlahi, A., et al.: Heterogeneous model ensemble for polyp detection and tracking in colonoscopy. EndoCV@ISBI. (2022)
- (9) Maier-Hein, L., et al.: Metrics reloaded: Pitfalls and recommendations for image analysis validation. arXiv (2022) 10.48550/ARXIV.2206.01653
- (10) Bernal, J., et al.: Comparative Validation of Polyp Detection Methods in Video Colonoscopy: Results From the MICCAI 2015 Endoscopic Vision Challenge. IEEE T Med Imaging. (2017) 10.1109/TMI.2017.2664042
- (11) Ali, S., et al.: PolypGen: A multi-center polyp detection and segmentation dataset for generalisability assessment. arXiv (2021) 10.48550/arXiv.2106.04463
- (12) Lin, T., et al.: Microsoft coco: Common objects in context. European Conference On Computer Vision. pp. 740-755 (2014)
- (13) Ismail, R., et al.: On Metrics Used in Colonoscopy Image Processing for Detection of Colorectal Polyps. New Approaches For Multidimensional Signal Processing. pp. 137-151 (2021)
- (14) Kofler, F., et al.: Are we using appropriate segmentation metrics? Identifying correlates of human expert perception for CNN training beyond rolling the DICE coefficient. arXiv (2021) 10.48550/arXiv.2103.06205
- (15) Gooding, M., et al.: Comparative evaluation of autocontouring in clinical practice: A practical method using the Turing test. Med Phys. (2018)