Early results from GLASS-JWST. XIV: A spectroscopically confirmed protocluster 650 million years after the Big Bang
Abstract
We present the spectroscopic confirmation of a protocluster at behind the galaxy cluster Abell 2744 (hereafter A2744-z7p9OD). Using JWST NIRSpec, we find seven galaxies within a projected radius of 60 kpc. Although the galaxies reside in an overdensity around greater than a random volume, they do not show strong emission. We place 2- upper limits on the rest-frame equivalent width – Å. Based on the tight upper limits to the emission, we constrain the volume-averaged neutral fraction of hydrogen in the intergalactic medium to be (68 % CI). Using an empirical - relation for individual galaxies, we estimate that the total halo mass of the system is . Likewise, the line of sight velocity dispersion is estimated to be . Using an empirical relation, we estimate the present-day halo mass of A2744-z7p9OD to be , comparable to the Coma cluster. A2744-z7p9OD is the highest redshift spectroscopically confirmed protocluster to date, demonstrating the power of JWST to investigate the connection between dark-matter halo assembly and galaxy formation at very early times with medium-deep observations at hr total exposure time. Follow-up spectroscopy of the remaining photometric candidates of the overdensity will further refine the features of this system and help characterize the role of such overdensities in cosmic reionization.
1 Introduction
Hierarchical structure formation is one of the fundamental features of our standard cosmological model. The first overdensities to collapse and form stars and galaxies play a particularly important role in the evolution of the universe and cosmic reionization (Tegmark et al., 1997). Identifying and studying the sources associated with these first overdensities thus provides critical insights into the evolution of galaxies, the intergalactic medium, and the underlying dark matter scaffolding (e.g., Mo & White, 1996).
The clustering of sources around a luminous galaxy or quasar includes an expected excess of fainter companions, under a broad assumption that galaxy luminosity is correlated with the mass of the dark-matter host halo. Such early overdensities are thought to be the seeds of today’s galaxy clusters, and sites where galaxy formation and the evolution of the surrounding gas is progressing more rapidly compared to the mean of the universe. As such, the identification of galaxy over-densities at high redshift () has been of particular interest in the literature (e.g., Trenti et al., 2012; Castellano et al., 2016, 2018, 2022; Harikane et al., 2019; Tilvi et al., 2020; Hu et al., 2021; Endsley & Stark, 2022; Larson et al., 2022). Furthermore, galaxy overdensities serve as ideal laboratories for studying the ionization of neutral hydrogen around galaxy systems; the presence of a large ionizing bubble may boost the fraction of escaping photons, which otherwise are scattered and absorbed by surrounding neutral hydrogen (Miralda-Escudé, 1998; Dijkstra, 2014; Mason & Gronke, 2020, see also Trapp et al. 2022).
An excess of photometric sources behind the massive galaxy cluster Abell 2744 was discovered in deep HST images taken as part of the Hubble Frontier Fields program (Lotz et al., 2017) and has been extensively investigated since (Zheng et al., 2014; Atek et al., 2015; Ishigaki et al., 2016). Approximately a dozen photometrically-selected sources are distributed within a small region ( across), making it an extreme over-density, with (Ishigaki et al., 2016), where represents the excess of surface number density from the field average.
Spectroscopic follow-up of a number of those sources with VLT/X-Shooter, ALMA, and JWST/NIRISS has secured spectroscopic redshifts for three sources at (Laporte et al., 2017, 2019; Carniani et al., 2020; Roberts-Borsani et al., 2022a). Of particular interest is the Lyman-break galaxy, YD4, a photometrically-selected candidate member of the overdensity which revealed Lyman-, [O iii] 88 m at as well as the presence of dust in its proximity (Laporte et al., 2017, but see Sec. 4.4).
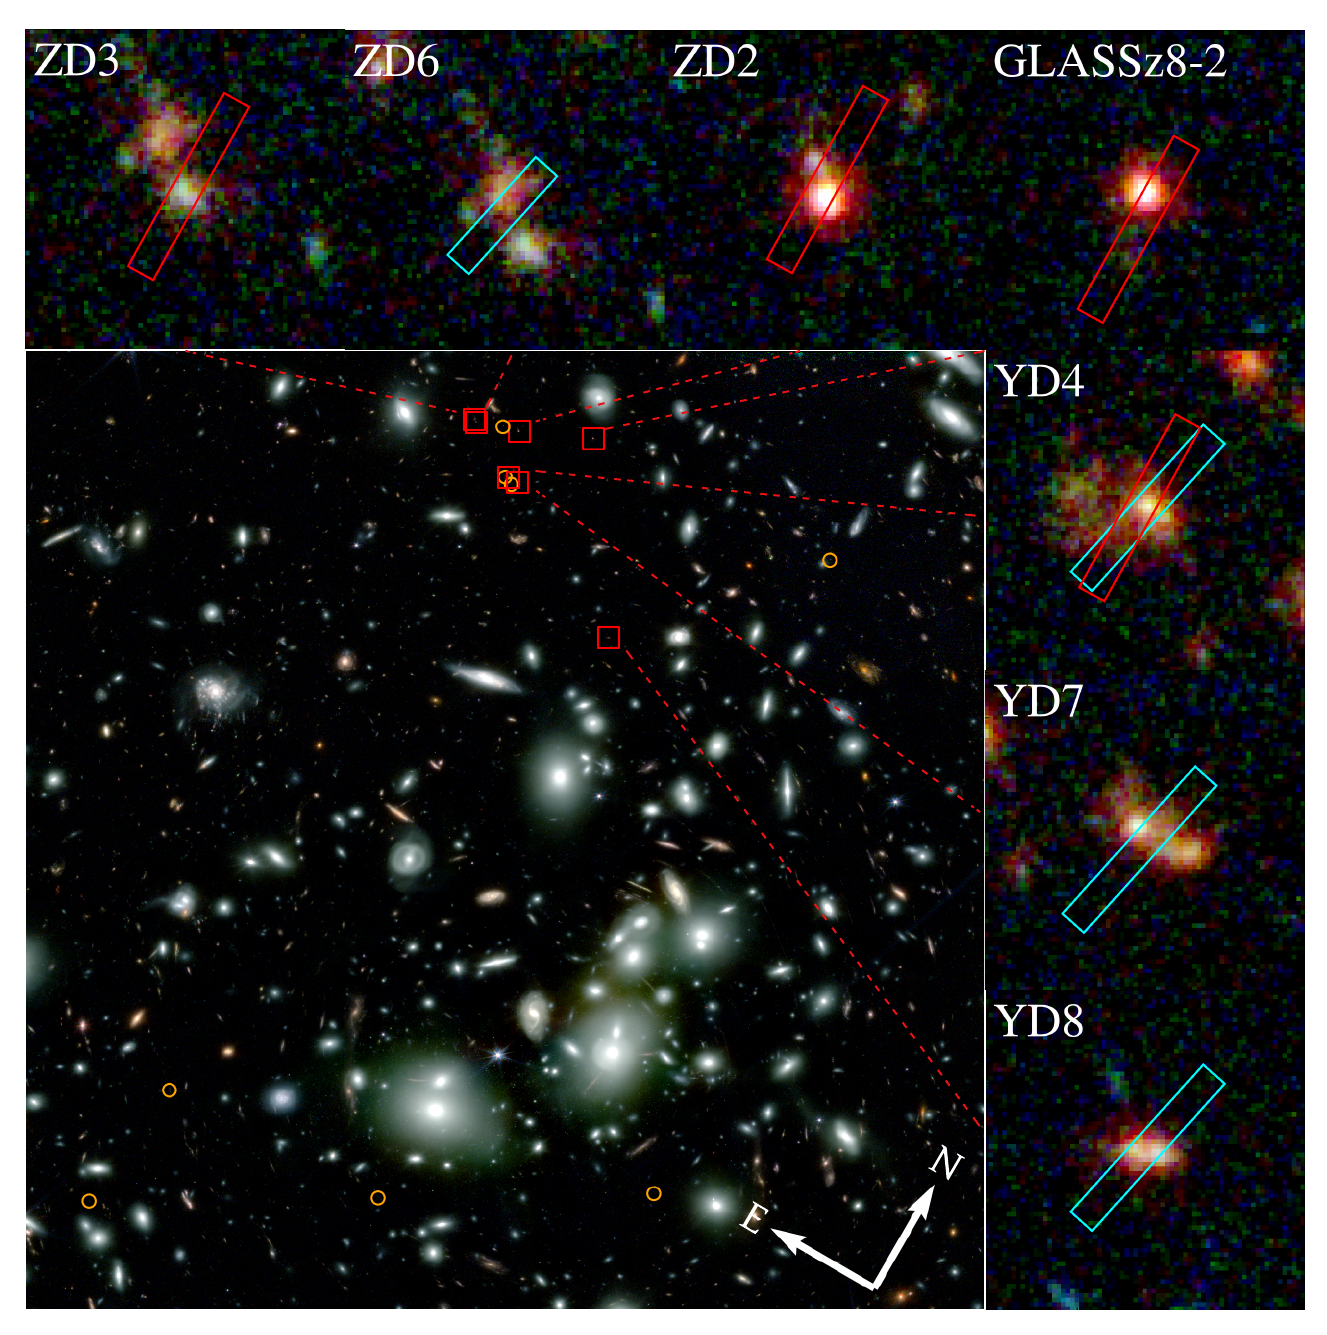
Here we report the spectroscopic follow-up and confirmation of the overdensity at (hereafter A2744-z7p9OD; Figure 1), through the detection of the [O iii]5007 line in seven member galaxies with JWST/NIRSpec. This result is consistent with the hypothesis that the galaxy confirmed by previous work at is in the background of the protocluster identified here, highlighting the importance of spectroscopic confirmation to establish membership and overdensity, accounting for chance alignment of galaxies sharing similar photometric redshifts.
The cluster field Abell 2744 is the primary target of the GLASS-JWST Early Release Science program (JWST-GO-1324; Treu et al., 2022; Roberts-Borsani et al., 2022a, P.I. Treu), and also part of the JWST Director Discretionary Time program (JWST-GO-2756; P.I. Chen; Roberts-Borsani et al., 2022b) to follow up the discovery of a magnified supernova at (Chen et al., 2022). The wavelength coverage –m afforded by the NIRSpec observations not only allows for redshift confirmations of the candidate members via a large suite of emission lines, but also provides insight into the visibility of from galaxies in an overdense region. The unique data set is complemented by deep JWST/NIRCam and ancillary HST images, allowing us to characterize the physical properties of the confirmed members and infer the early evolution of galaxies in such an extreme environment. Furthermore, a first estimate of the velocity dispersion of the protocluster can be derived based on the high-precision redshift measurements for individual members.
The paper is structured as follows: we present the data set in Sec. 2, followed by our spectroscopic and photometric analyses of the cluster members in Sec. 3. We characterize the system and infer the neutral fraction around the system in Sec. 4, and summarize our key conclusions in Sec. 5. Where relevant, we adopt the AB magnitude system (Oke & Gunn, 1983; Fukugita et al., 1996), cosmological parameters of , , , and the Chabrier (2003) initial mass function. Distances are in proper units unless otherwise stated.
| ID | R.A. | Decl. | mF150W | mF444W | Redshift | EW0()† | ||
|---|---|---|---|---|---|---|---|---|
| degree | degree | mag | mag | erg/s/cm2 | erg/s/cm2 | Å | ||
| YD4 | 3.6038544 | -30.3822365 | 26.5 | 25.6 | ||||
| YD7 | 3.6033909 | -30.3822289 | 26.4 | 25.8 | ||||
| ZD6 | 3.6065702 | -30.3808918 | 26.9 | 26.1 | ||||
| YD8 | 3.5960841 | -30.3858051 | 26.7 | 26.0 | ||||
| ZD2 | 3.6045184 | -30.3804321 | 26.2 | 25.2 | – | |||
| ZD3 | 3.6064637 | -30.3809624 | 26.7 | 26.6 | – | |||
| GLASSz8-2 | 3.6013467 | -30.3791904 | 26.5 | 25.4 |
Note. — † 2 rest-frame equivalent width of over Å (). equivalent width measurements of ZD2 and ZD3 are not available as the wavelength falls in the detector gap. Measurements here are not corrected for magnification. For those with not detected, flux limit (assuming Å for the line width) are presented.
2 Data
2.1 JWST/NIRSpec MSA observations
We base our primary analysis on data acquired through NIRSpec MSA observations in two programs, the GLASS-JWST Early Release Science Program (PID 1324, PI Treu; Treu et al., 2022) and a JWST DDT program (PID 2756, PI. W. Chen; Roberts-Borsani et al., 2022b). The GLASS-JWST observations were executed on November 10, 2022 with three spectral resolution configurations with three high-resolution gratings, G140H/F100LP, G235H/F170LP, and G395H/F290LP, which also provide total wavelength coverage of 0.81–5.14 m, at – . The on-source exposure time was 4.9 hours in each spectral configuration. The DDT NIRSpec observations were executed on October 23 2022, with the CLEAR filter+prism configuration, which provides continuous wavelength coverage of 0.6–5.3 m at –300 spectral resolution. The on-source exposure time was 1.23 hours.
For the MSA target selection, we started with the same source catalog for both programs. Specifically for the protocluster sources, /-dropout galaxies (hereafter ZDs and YDs, respectively) were included (4 in the DDT and 4 in GLASS-JWST), all within the vicinity of the overdensity (Zheng et al., 2014; Ishigaki et al., 2016) including the spectroscopically-confirmed galaxies YD4, GLASSZ8-1 (ZD2) and GLASSZ8-2 from Laporte et al. (2017) and Roberts-Borsani et al. (2022a), respectively. Considering the overlap between the two programs, a total of seven distinct protocluster targets were observed, but data was corrupted for one target due a non-nominal operation of a micro-shutter, leaving seven targets suitable for analysis. The choice of protocluster targets in each MSA was based on three primary factors, namely (i) the central pointing of the MSA, (ii) the position of the MSA ensuring no spectral overlap in the detector, and (iii) preferential selection of brighter objects to maximize the probability of emission line or continuum detections.
The data were reduced using the official STScI JWST pipeline (ver.1.8.2)111https://github.com/spacetelescope/jwst for Level 1 data products, and the msaexp222https://github.com/gbrammer/msaexp code for Level 2 and 3 data products, the latter of which is built on the STScI pipeline routines but also includes custom routines for additional corrections. Briefly, we begin our data reduction on the uncalibrated files with the Detector1Pipeline routine and the latest set of reference files (jwst_1014.pmap) to correct for detector-level artifacts and convert to count-rate images. We then utilize custom pre-processing routines from msaexp to correct for 1/ noise, identify and remove “snowballs”, and remove bias on an exposure-by-exposure basis, before running a number of STScI routines from the Spec2Pipeline to produce the final 2D cutout images. These include the AssignWcs, Extract2dStep, FlatFieldStep, PathLossStep, and PhotomStep routines to perform WCS registration, flat-fielding, pathloss corrections, and flux calibration. Background subtraction is performed locally using a three-shutter nod pattern before drizzling the resulting images onto a common grid. From there, we optimally extract the spectra via an inverse-variance weighted kernel, derived by summing the 2D spectrum along the dispersion axis and fitting the resulting signal along the spatial axis with a Gaussian profile by following the recipe of Horne (1986). We visually inspect all kernels to ensure spurious events are not included (or limited) where possible. The kernel then extracts the 1D spectrum along the dispersion axis.
2.2 Imaging data and photometry
Deep NIRCam images are available from DDT program (PID 2756; PI. W. Chen) and GO program UNCOVER (Bezanson et al., 2022), including F115W, F150W, F200W, F277W, F356W, F410M, and F444W filters. The imaging data are reduced in the same way as presented by Merlin et al. (2022), using the official STScI JWST pipeline, including the most recent version of the photometric zero points and reference files. Images are PSF-matched to the F444W filter for the flux estimates below.
To supplement our photometric wavelength coverage, we include ancillary Hubble Space Telescope data taken by several programs (Postman et al., 2012; Treu et al., 2015; Lotz et al., 2017; Steinhardt et al., 2020). The HST data have been uniformly re-reduced using Grizli (Brammer et al., 2022). The HST images are PSF-matched to the F160W filter instead of the NIRCam F444W. The choice was made because – despite their similar PSF FWHMs – there are significant differences in the PSF profile of the two different telescopes which make it challenging to obtain a satisfying convolution kernel. The remaining systematic offset in fluxes caused by this is corrected in the following process.
A photometric catalog is constructed following Morishita & Stiavelli (2022), using borgpipe (Morishita et al., 2021). Briefly, fluxes are estimated in the PSF-matched images with a aperture by using SExtractor (Bertin & Arnouts, 1996). Flux offsets between NIRCam and HST filters are corrected with a rescaling based on the mean offset between NIRCam F150W and a pseudo F150W filter derived for the same sources using the HST F140W and F160W fluxes, whose broad band filters straddle the NIRCam F150W. The correcting factor is found to be , which is consistent with Morishita & Stiavelli (2022).
Lastly, fluxes are scaled to a total flux by applying , where is FLUX_AUTO of SExtractor, measured for individual sources.
3 Analysis and Results
3.1 Spectroscopic analysis of candidates
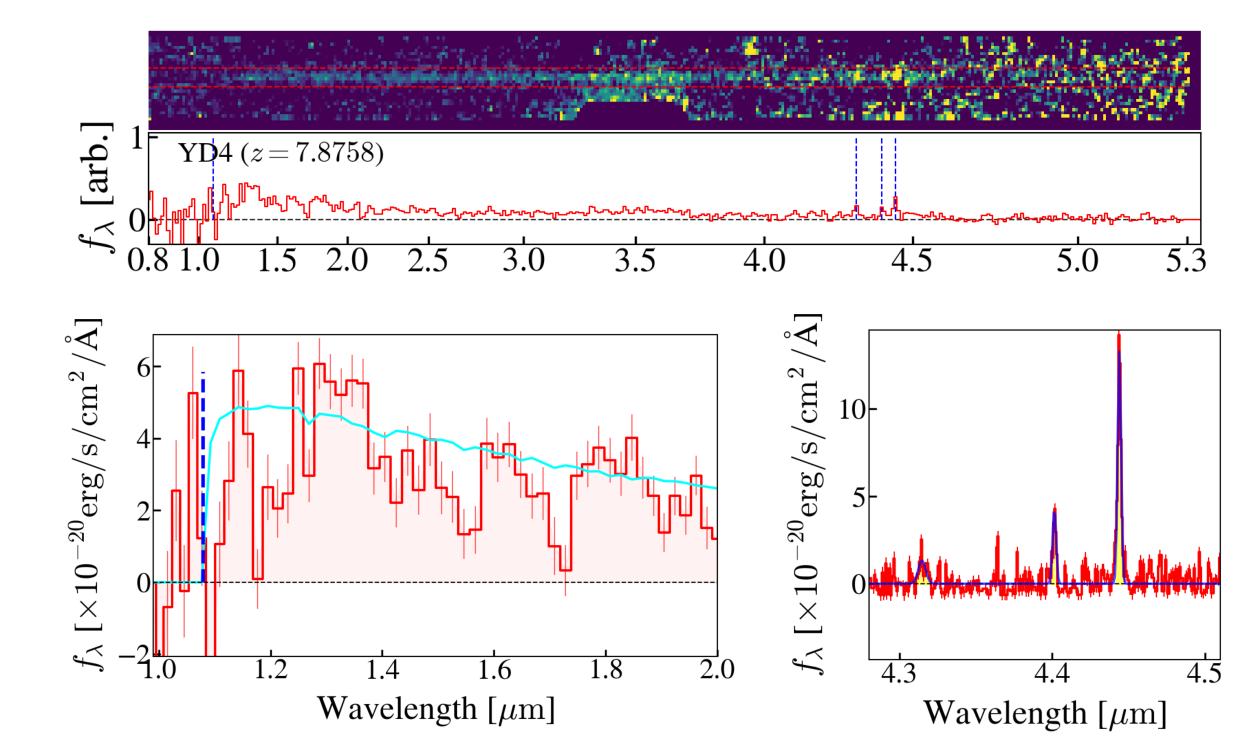
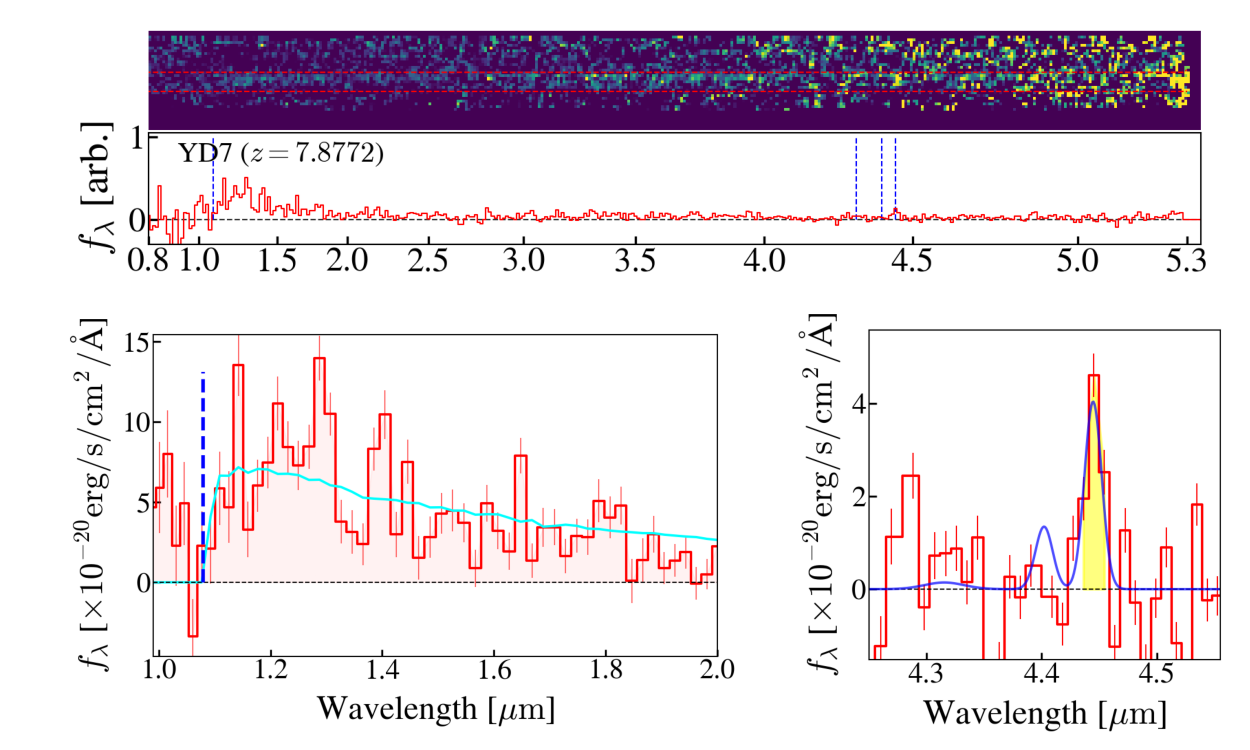
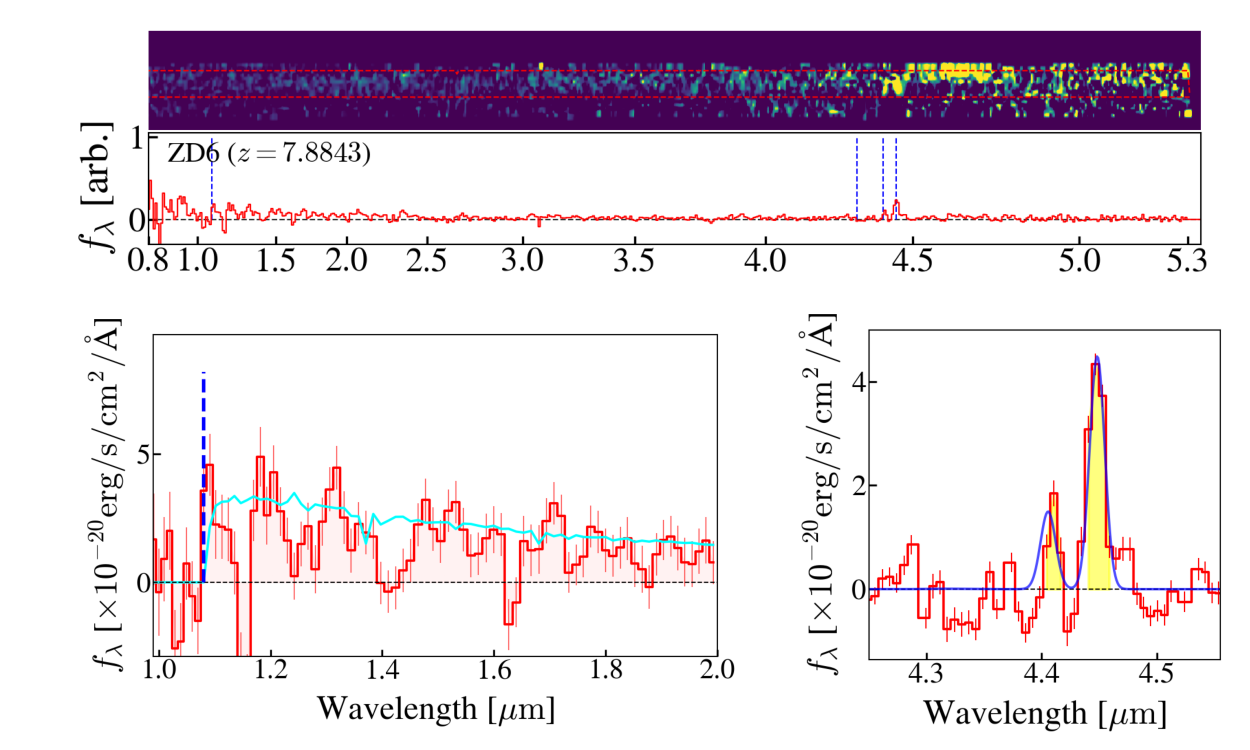
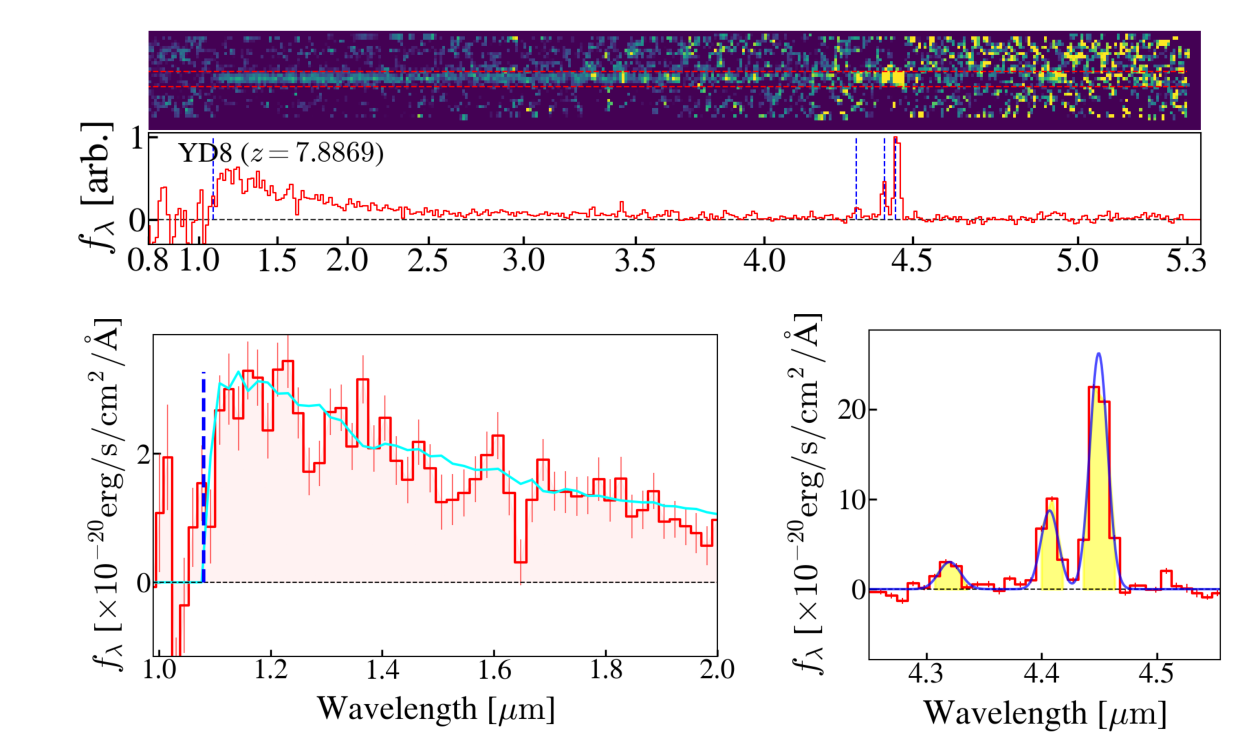
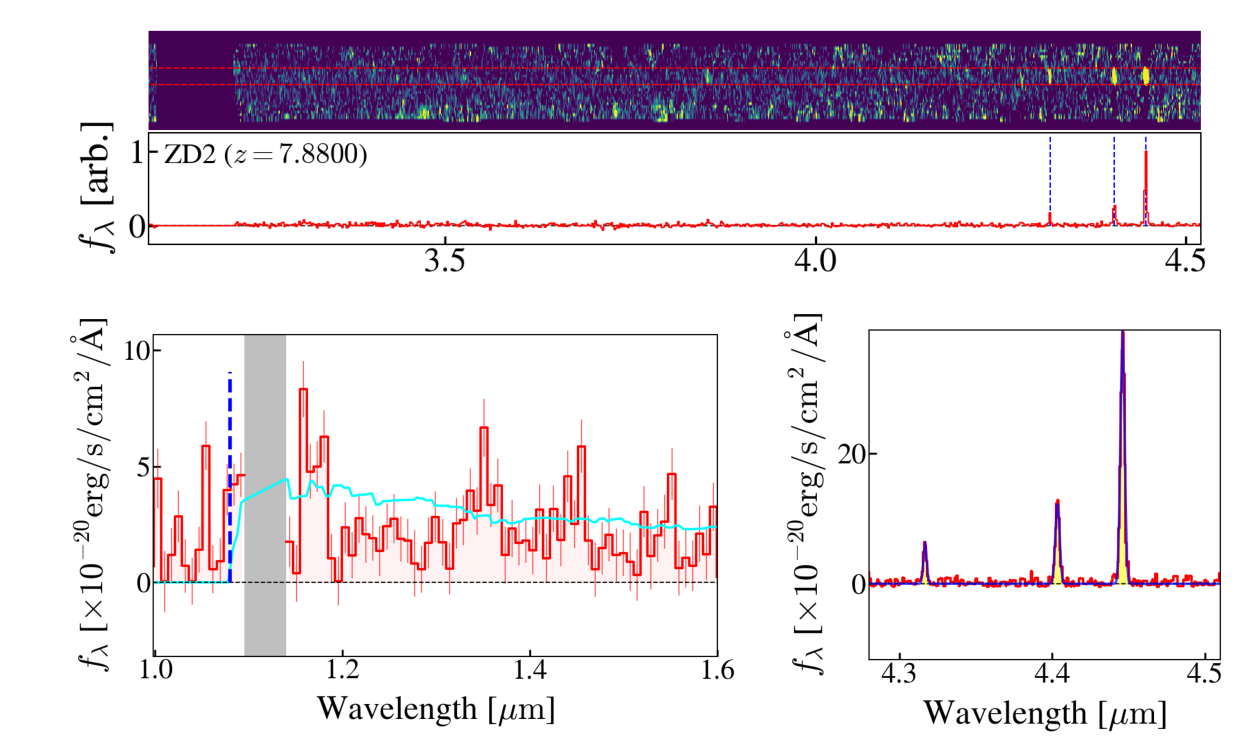
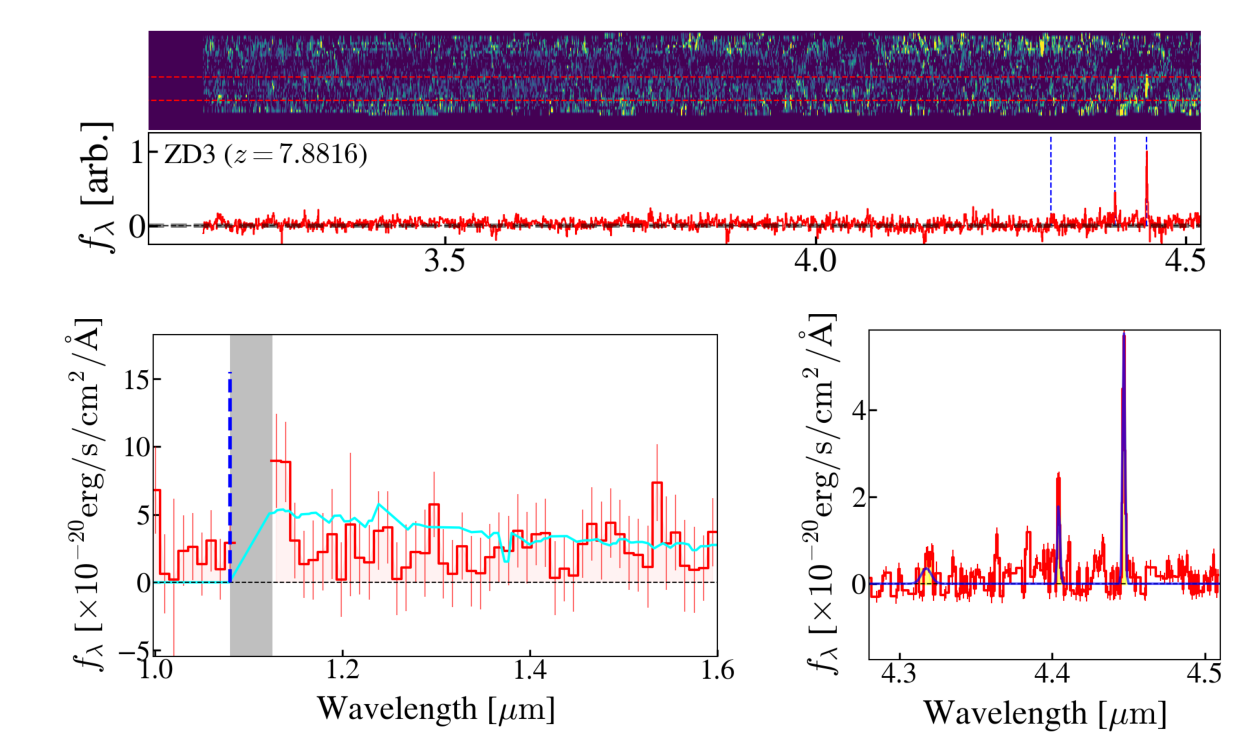
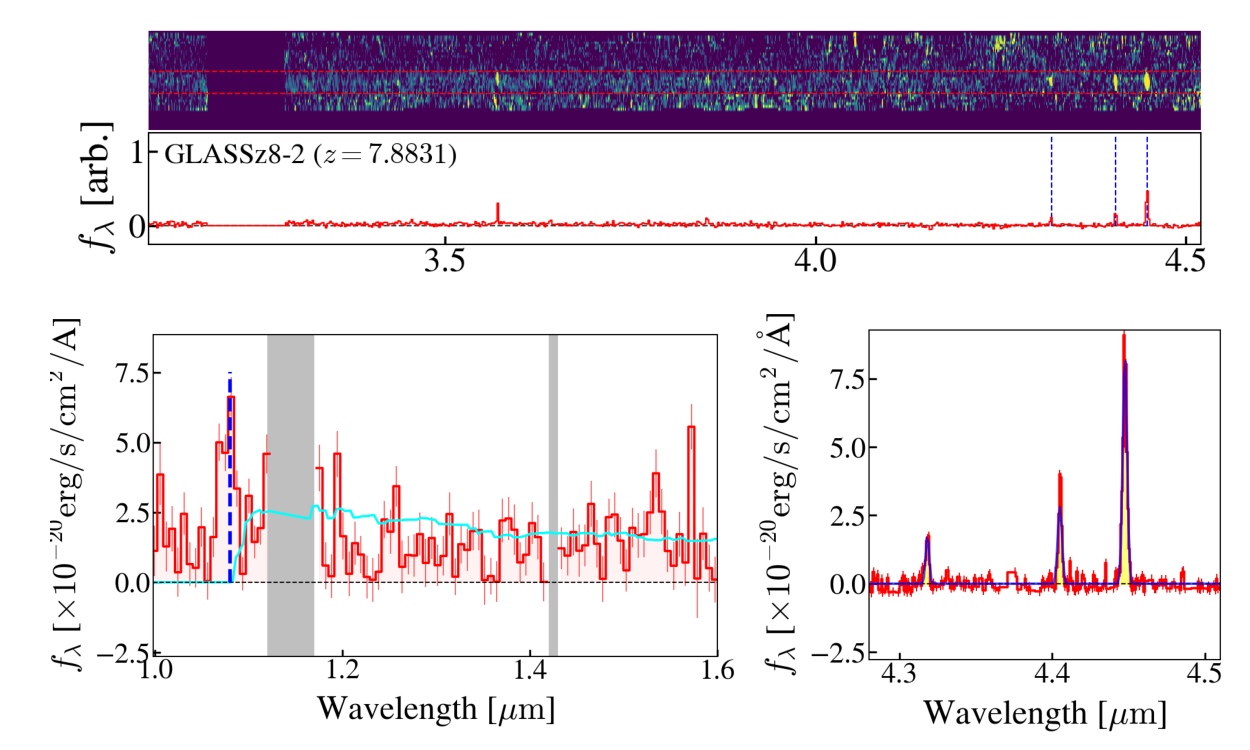
We present our spectroscopic analyses of the seven galaxies in our sample in Fig. 2, which shows the two-dimensional spectra and one dimensional extraction. Remarkably, all galaxies show clear [O iii] 5007 lines at m, and tentative , [O ii], and [Ne III] lines in a few galaxies (see Mascia et al. 2023 and Roberts-Borsani et al., in prep. for a dedicated analysis of the emission lines). Here we focus on redshift determinations using the [O iii] 4959,5007-doublet and line.
The redshift of each source is determined by fitting a three-component Gaussian to and the [O iii]-doublet after subtracting the underlying continuum. Before subtraction, we first scale the observed spectrum by matching the continuum level to the best-fit model, for slitloss and any remaining offset in absolute flux calibration. We use the wavelength range at 4-4.8 m while emission lines (i.e. and [O iii]) are masked. For continuum subtraction, we use a best-fit spectral energy distribution (SED) template derived with broadband photometry (Sec 3.2). We fix the line ratio of the [O iii]-doublet lines to 1:3 and set the width to a single parameter for the two components of the doublet. For , the amplitude and line width are set as free parameters. Including the redshift, we have five free parameters. The uncertainties and parameter posterior distribution functions are estimated by sampling the parameter space via emcee (Foreman-Mackey et al., 2013).
In order to assess the detection significance of and [O iii] emission, we estimate the noise level in the spectrum from 3.6–4.8 m. We measure total fluxes at various wavelengths integrated over (where is the best-fit Gaussian width of each emission line). We then compare the standard deviation of these fluxes (i.e., noise) with the emission lines integrated over around the central wavelength. This test indicates secure ( confidence) detections of [O iii]λ5007 in all seven photometric candidates that were targeted, along with [O iii]λ4959 in five and in three. The resulting line fluxes and spectroscopic redshifts are presented in Table 1. Total line fluxes are measured by integrating the best-fit gaussian component for each line when detected at . It is noted that the slit loss is corrected by multiplying a median ratio of the best-fit SED (Sec. 3.2) and the observed spectrum at 4.0-4.8 m after masking the wavelengths of and [O iii]-doublet lines. The line fluxes and spectroscopic redshifts are presented in Table 1.
For the four galaxies observed with the prism configuration (YD4, YD7, YD8, and ZD6) and one with the high-resolution grating (GLASSz8-2), we have spectroscopic coverage at the wavelength of , allowing us independent check of the inferred redshift measurements. Indeed, we confidently detect the break at the expected wavelength for the redshift derived above for all of the four galaxies (Fig. 2). For the other two galaxies (ZD2 and ZD3), while a small part of the wavelength range near falls in the detector gap, the break is still consistent with the inferred redshift.
3.2 Spectral energy distribution
We analyze the SED of the individual galaxies by using photometric data that covers 0.4–5 m. We use the SED fitting code gsf (Morishita et al., 2019), which allows flexible determinations of star formation histories in a non-parametric form, by finding an optimal combination of stellar and interstellar medium (ISM) templates. We generate templates of different ages, [1, 3, 10, 30, 100, 300] Myrs, and metallicities at an increment of 0.1, by using fsps (Conroy et al., 2009; Foreman-Mackey et al., 2014). A nebular component (emission lines and continuum) that is characterized by an ionization parameter is also generated by fsps (see also Byler et al., 2017) and added to the template after multiplication by an amplitude parameter. Dust attenuation and metallicity of the stellar templates are treated as free parameters during the fit, whereas the metallicity of the nebular component is fixed to the same value of the stellar component during the fitting process.
The posterior distribution function of the parameters is sampled by using emcee for iterations with the number of walkers set to 100. The final posterior is collected after excluding the first half of the realizations (known as burn-in). The resulting physical parameters are quoted as the median of the posterior distribution, along with the 16 th to 84 th percentile uncertainty ranges. The star-formation rate is calculated by averaging the last 100 Myr of the posterior star formation history. The inferred physical properties are presented in Table 2.
To supplement our characterization of the overdensity (Sec. 4.1), we include the remaining eight photometric candidates presented by Zheng et al. (2014, Fig. 1). As revealed by the spectroscopy, the confirmed sample consists both of ZDs and YDs. The ambiguity is likely due to the fact that the redshift of interest falls in the middle of the effective redshift ranges probed by the two color selections, which define and samples, respectively.
We fit the redshifts of the remaining photometric candidates with EAzY (Brammer et al., 2008). To exclude possible outliers, we only include those where the redshift uncertainty overlaps with . After this selection, we have nine photometric sources. The SEDs of the selected photometric sources are fitted as described above, with the redshift fixed to (Table 2).
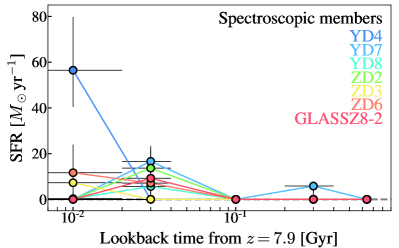
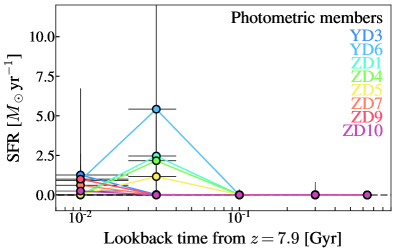
In Fig. 3, we show the derived star formation histories of the confirmed member galaxies and the phot- sample. All galaxies experience the peak of star formation in the last Myr. The exception is YD7, which formed about a half of the total mass at Myr prior to the observed redshift, making it a relatively old (with mass-weighted age Myr) and massive system.
Overdense regions are generally known as a place of accelerated evolution (e.g., Dressler, 1980; Thomas et al., 2010). It is thus of particular interest to investigate if there exists a luminous galaxy or quasar () in/near an overdense region at high redshift. The sources presented here are relatively faint in rest-frame UV, with UV absolute magnitude, , ranging from to mag. On the other hand, some of the sources have moderate dust attenuation ( mag). Among those, YD4 is the most significant case with , which is consistent with the detection in dust continuum at its position (Laporte et al., 2017, see also Sec. 4.4). We compare values for our sample to those of a reference field sample that consists of 13 photometric sources at from Leethochawalit et al. (2022). While the distribution of our sample is skewed toward higher , the shift is not statistically significant. We find no significant differences in other properties.
We note that spectroscopic data are not included in the SED fitting process above; despite, the predicted line fluxes of the best-fit SED model overall show good consistency with the values measured in Sec. 3.1. The only exception is YD8, where the observed flux is larger than what is predicted by the best-fit model for both and [O iii]. While detail investigation on this discrepancy is deferred to future work, we note that the emission line templates used here are optimized for standard stellar populations and do not include extreme components such as, e.g., AGN.
3.3 Direct Estimate of Ionizing Photon Efficiency
Having direct measurements of optical emission lines brings us not only solid redshift confirmation but also direct insight into ionizing properties of the ISM. One of such measurements is the ionizing photon production per unit UV luminosity, or ionizing photon efficiency,
| (1) |
where is the total ionizing photons of Lyman continuum and intrinsic UV luminosity density measured at rest-frame 1500 Å (e.g., Schaerer et al., 2016; Prieto-Lyon et al., 2022). The production efficiency is an important parameter, as the total ionizing output of galaxies can be simply parameterized (e.g., Madau et al., 1999; Robertson et al., 2013) as the product of and the fraction of ionizing photons which escape the interstellar medium into the intergalactic medium, . The direct measurement of is not available for the redshift range of interest since the luminosity in the optical hydrogen recombination lines is proportional to the number of LyC photons absorbed in the galaxy. As a proxy, we adopt the following formula:
| (2) |
The intrinsic UV luminosity density is inferred from the best-fit SED. We correct the measured flux for attenuation by using the dust attenuation from the same SED modeling and assuming (Shivaei et al., 2020). Using the two equations above, we derive the production rate of ionizing photons which did not escape the galaxy, . The median value for the five objects available for the measurement is erg Hz-1. The measurements for individual galaxies are reported in Table 2.
4 Discussion
4.1 Characterizing A2744-z7p9OD: Estimate of size, overdensity, mass, and velocity dispersion
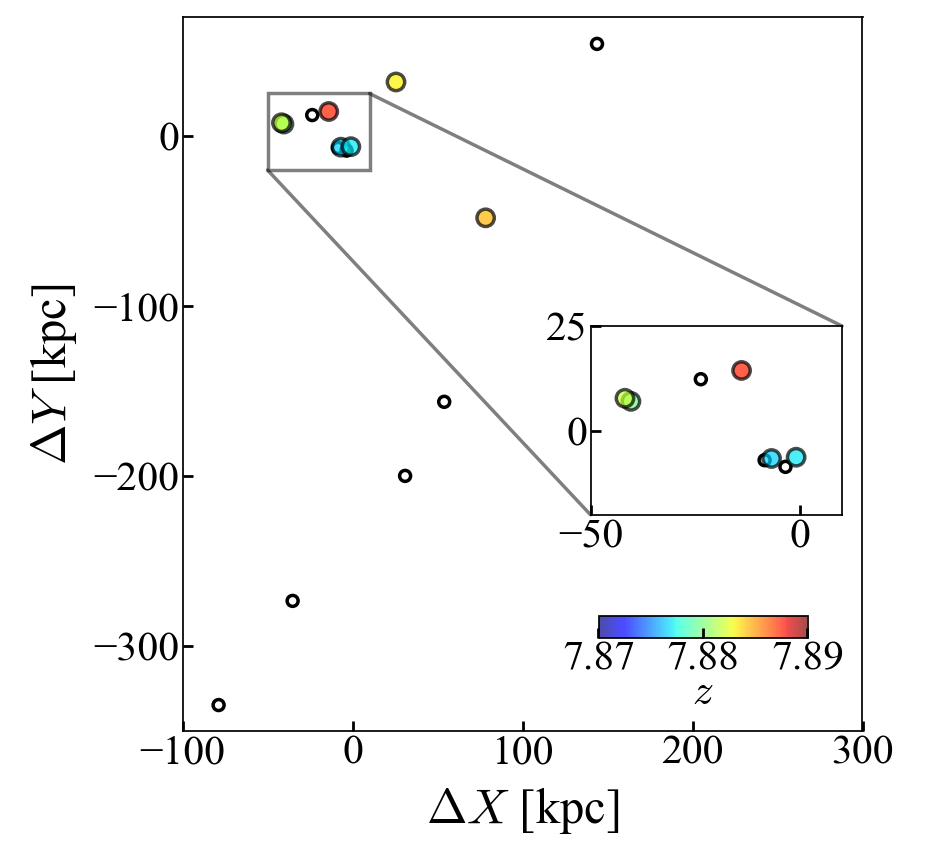
We first investigate the spatial distribution of the member galaxies in A2744-z7p9OD. We use an updated version of the lens model presented by Bergamini et al. (2022) - which includes the recent spectroscopic confirmation of a triply-imaged LBG (Roberts-Borsani et al., 2022b) in the field (Bergamini et al. in prep.) - to correct for the magnification by the foreground cluster. The two-dimensional distribution of our sources in physical units is shown in Fig. 4. After correcting for the lens magnification, we find that the confirmed sources are located within a circle of radius kpc in the source plane. The distribution on the sky is fairly elongated.
Based on the derived spatial distribution in the source plane, we estimate overdensity by including only spectroscopically confirmed members. For the field reference, we use the luminosity function at derived in Bouwens et al. (2021) and integrated it down to . Within a projected area of kpc (), we find , where the associated uncertainties reflect the 16–84 th percentile ranges of the luminosity function adopted. This gives an estimate of the overdensity . While our estimate is lower than the one derived by Ishigaki et al. (2016, ), they included eight galaxies (including photometric candidates that are not confirmed in our study) in the central smaller region (). Therefore, given that only the spectroscopic sample is included, our estimate is likely a conservative lower limit.
Secondly, we attempt to estimate the mass of the structure. Following previous work (e.g. Laporte et al., 2022), we can estimate the halo mass of the individual components from the halo-mass galaxy-luminosity relation. Using the relation derived by Mason et al. (2022), we infer that the brightest member of the overdensity (ZD2, ) lives in a halo. Summing the halo mass of all the confirmed members we obtain a lower limit to the total halo mass .
Lastly, we can take advantage of the spectroscopic data to obtain for the first time an estimate of the velocity dispersion of a protocluster at such high redshift. Given the small number of measured redshifts we adopt a simple Gaussian estimator and bootstrap method to derive the uncertainty (Beers et al., 1990), obtaining . We caution the reader that the estimate should be treated with a degree of caution since the system is likely not virialized, and that in computing this quantity we are assuming the spread in redshift with respect to the mean is due to motion as opposed to distance along the line of sight. Nevertheless, we report it to assist future theoretical investigations.
4.2 Estimating the Present-day Mass of A2744-z7p9OD
With seven members being spectroscopically confirmed, it is of extreme interest to estimate the present-day halo mass of a system like A2744-z7p9OD. We attempt to estimate the total cluster mass at by following the widely used formula
| (3) |
(e.g., Steidel et al., 1998; Chiang et al., 2013), where is the redshift-space distortion corrected comoving volume of the system, the mean matter density of the Universe, and the mass overdensity. The correction coefficient and are linked as
| (4) |
where is the bias parameter and galaxy overdensity (Sec. 4.1). By adopting the linear interpolation presented in Ouchi et al. (2018), we adopt the bias parameter at of the total halo mass . The correction coefficient is expressed as
| (5) |
where is a function of the mass density parameter, , at
| (6) |
By solving Eqs. 4 and 5, we obtain and for the galaxy overdensity measurement estimated in Sec 4.1. For the same area used in Sec 4.1 and the redshift interval , we estimate the comoving volume of A2744-z7p9OD to be cMpc3. By substituting this in Eq. 3, we obtain . This implies that A2744-z7p9OD would be expected on average to become a Coma-like system at , whereas is typically used as the threshold for a system to be called a “cluster” (e.g., Rosati et al., 2002; Overzier, 2016).
Another way of predicting the present-day mass is to find and compare with overdense systems like A2744-z7p9OD in a simulation. Here we look into the EAGLE 100 Mpc “Reference” simulation (Schaye et al., 2015). We first extract all galaxies in the simulation with at (), and trace them to their descendants. To limit our analysis to the likely analogs of A2744-z7p9OD, we trace overdense regions that have six or more galaxies in a spherical region of pkpc at (). At , the descendants of these 19 galaxies are hosted by halos in the mass range -, which is consistent with a model overdensity identified by Ishigaki et al. (2016) in their cosmological simulation. While this indicates that A2744-z7p9OD could evolve into a system at the lower bound of typical clusters or even a group, it should be noted that the upper side of the resulting mass distribution above is likely limited by the simulation volume, as there is no object with in the entire simulation box. Estimating a precise mass of the structure and its future evolution would require simulations with sufficient resolution and astrophysical detail to resolve individual galaxy components matched in luminosity or stellar mass, while simultaneously probing sufficient volumes, to include multiple structures of this kind to average out the expected stochasticity (Chiang et al., 2013), or mapping to a typical dark matter halo rarity then followed across cosmic time (Trenti et al., 2008). A dedicated study is beyond the scope of this paper and left for future work.
Our very first attempt of spectroscopic followup on the bright members in the core region already confirmed seven member galaxies at success rate. For further characterization of the confirmed overdensity, a sample of galaxies at larger extent would be required. The progenitors of massive clusters are typically spread over several Mpc and thus to robustly estimate the mass of the descendant one would require a survey covering a much larger area of the sky (e.g., Overzier et al., 2009; Contini et al., 2016). In fact, we found in the simulation that the mass distribution skews at a higher mass when the search region is defined by a larger radius ( pMpc) that contains more numerous galaxies ( or more).
4.3 On the absence of Lyman emission lines
The absence of strong emission provides insight into the intergalactic medium (IGM) properties surrounding the protocluster. None of our spectroscopically confirmed sources shows a clear line (Fig. 2). To quantify the non-detections, we estimate the upper limit on rest-frame equivalent widths of the line, EW0(), following Hoag et al. (2019a) and Morishita et al. (2020):
| (7) |
For we use the continuum model derived from our SED fitting analysis. We replace the non-detected flux with the limiting flux estimated over the instrumental resolution ( Å, or ) at the wavelength of . The resulting range of upper limits is –28 Å (; Table 1). The two galaxies (ZD2, ZD3) observed in the ERS programs are not available for the EW measument as the wavelength range of interest falls in the detector gap.
The lack of strong emission is perhaps not surprising given the redshift of the host galaxies, where inferences on the ionization state of the IGM find neutral fractions in excess of (Mason et al., 2019; Hoag et al., 2019b). From the measured EW limits of the four galaxies, and their absolute magnitudes, we estimate the volume-averaged neutral hydrogen fraction of IGM to be (at 68% CL) using the same methodology presented by Mason et al. (2018). This is consistent with previous work on the cosmic average, within the uncertainties (Mason et al., 2019). We note that this analysis assumes the observations are independent sightlines. A more realistic analysis including their correlation within the same physical region would likely recover a slightly lower limit, but is beyond the scope of this work. A larger number of spectroscopic measurements in the protocluster are needed to refine this limit and identify potential differences with regard to the cosmic average.
In such a highly neutral environment large ionized bubbles are expected to be extremely rare (e.g., Mesinger & Furlanetto, 2007). Even around regions of comparable overdensity containing sources of similar magnitude ranges, large reionization simulations predict median bubble sizes to be smaller than 1 pMpc where (Lu et al. in prep, using the Evolution of Structure reionization simulations, Mesinger et al. 2016). If the bubble size is below pMpc the redshift along the line of sight is not sufficient for to escape, and in fact transmission is at its line center (Mason & Gronke, 2020; Qin et al., 2021). Assuming a gaussian-shape emission line with velocity offset of from systemic of km s-1 (which is likely an overestimate in these low luminosity galaxies, Mason et al. 2018) and FWHM equal to the velocity offset, the total fraction of transmitted flux is expected to be for a 1 pMpc bubble and for a 0.75 Mpc bubble. Assuming the average EW for galaxies at from De Barros et al. (2017) as the “emitted” EW, we would thus expect to observe , after transmission through the IGM, with EW , below our detection threshold (Table 1).
We can verify our theoretical expectation by estimating the radius of an H ii region, , ionized by UV photons of a single galaxy using the equation in Haiman & Loeb (1997, also ):
| (8) | |||||
For simplicity, this equation assumes that the ionizing bubble is spherically symmetric and created by a single source at its center. We adopt a Case B recombination coefficient, cm3/s (Osterbrock, 1989), and ionizing photon escape fraction of and an IGM H i clumping factor (Shull et al., 2012; Robertson et al., 2013). For the ionizing photon production efficiency, we use those derived in Sec. 3.3 for those with flux measurements available. We adopt the median value for the remaining sample.
By using the derived star formation history and luminosity presented in Sec. 3.2, we estimate the bubble size for the spectroscopically confirmed individual sources and for the photometrically-selected sample identified in Sec. 3.2. The estimated bubble sizes are Mpc for most of the sample, due to the relatively low UV luminosity of the galaxies (Table 2). Given that their separation in the source plane is of order 60 pkpc, we also estimate the bubble size by considering the cumulative effect of all the confirmed sources as if they were colocated. Even in this case, we find it to be Mpc, i.e. insufficient to allow to escape. Even the inclusion of all photometric candidates is not significantly changing the estimate, as those are mostly fainter than the confirmed members (also see their individual estimates in Table 2).
In conclusion, our bubble size estimate is consistent with the non-detection of in our confirmed sources. By comparison, at slightly lower redshifts, Endsley & Stark (2022) estimated bubble sizes of –1.1 Mpc for UV-bright (– mag) galaxies at –6.9. was detected in nine out of ten galaxies, showing that both an overdense environment and sufficient ionizing photon flux is required to produce an ionized bubble large enough to allow significant transmission of photons (c.f. the comparison of Ly detections in UV-bright and fainter galaxies in Roberts-Borsani et al. 2022c).
4.4 Comparison with previous work
Our estimated lower limit of the mass of A2744-z7p9OD is comparable to those of previously known protoclusters and protoscluster candidates using similar methods, including the recently reported candidate behind the SMACS0723 cluster (Laporte et al., 2022), where two of the member candidates are spectroscopically confirmed to be . The real breakthrough of our observations, however, is the sheer number of spectroscopically confirmed redshift measurements, which allow us to establish secure membership to the protocluste and get a first estimate of the its velocity dispersion. This clearly provides a glimpse of the power of JWST to add unprecedented detail to studies of the progenitors of today’s large-scale structures.
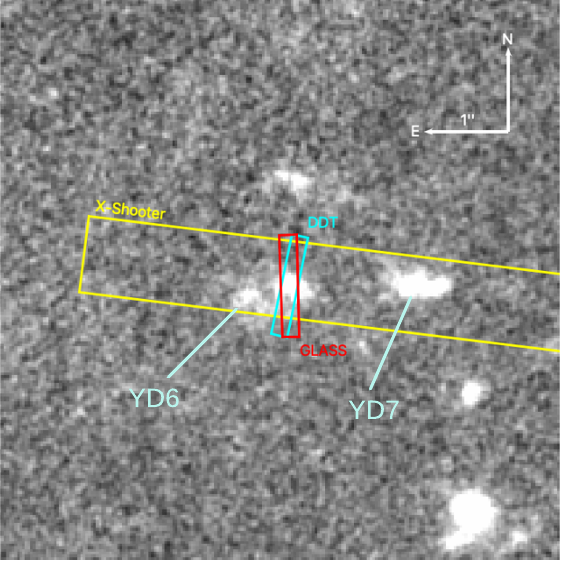
The spectroscopic redshift of A2744-z7p9OD is in agreement with previous photometric redshift estimates, but in apparent tension with the redshift reported for YD4 () based on and ALMA [C ii] 158 m and [O iii] 88 m emission (Laporte et al., 2017, 2019; Carniani et al., 2020). A likely explanation of the apparent tension is a line-of-sight superimposition of sources at similar redshifts. This is a common occurrence in the photometric identification of overdensities and should be kept in mind when considering protocluster candidates without spectroscopy. As shown in Figure 5, YD4 is close on the sky (separation ) to a secondary -dropout source (YD6; Zheng et al. 2014), which falls outside our NIRSpec spectroscopic apertures (in the GLASS and DDT observations) but lies within the VLT/X-Shooter long-slit and indistinguishable from YD4 at ALMA resolution (in the case of [C ii]). We hypothesize that the source detected at is actually in the background of the protocluster and likely associated with YD6 (estimated to be at Zheng et al., 2014). In fact, the [O iii] 88 m flux appears better centered on the fainter counterpart while the detection of dust appears associated with YD4 (see Figure 2 in Laporte et al. 2019), consistent with both the large dust quantity () and red UV slope () estimated for YD4 in Section 3.2 and the discrepant spectroscopic redshifts. More extensive spectroscopic coverage is needed to confirm the hypothesis.
| ID | SFR | § | ||||||||
|---|---|---|---|---|---|---|---|---|---|---|
| mag | / yr | Gyr | mag | pMpc | Hz/erg | |||||
| Spectroscopic sample | ||||||||||
| YD4 | ||||||||||
| YD7 | – | |||||||||
| ZD6 | – | |||||||||
| YD8 | ||||||||||
| ZD2 | ||||||||||
| ZD3 | ||||||||||
| GLASSZ8-2 | ||||||||||
| Photometric sample∗ | ||||||||||
| YD3 | – | |||||||||
| YD6 | – | |||||||||
| ZD1 | – | |||||||||
| ZD4 | – | |||||||||
| ZD5 | – | |||||||||
| ZD7 | – | |||||||||
| ZD9 | – | |||||||||
| ZD10 | – | |||||||||
Note. — †Median magnification of the lens model by Bergamini (in prep.), calculated at the position of the source. Measurements are associated with uncertainties. ‡HII bubble size, calculated with Eq. 8. §Ionizing photon production efficiency (Sec. 3.3). ∗Sources selected by Zheng et al. (2014) that were not observed in our NIRSpec programs. Only those with photometric redshift consistent with at are included. Redshift of the photometric sample is fixed to in the SED analysis. : Mass-weighted age calculated over the posterior star formation history. Star-formation rate is calculated by averaging the last 100 Myr of the posterior star formation history. All measurements are corrected for magnification.
5 Summary
In this work, we presented a JWST NIRSpec spectroscopic follow-up analysis of seven photometrically-selected members of a galaxy overdensity in the epoch of reionization at , leading to robust redshift measurements for all photometric candidates by detecting [O iii]λ5007 and other rest-frame optical lines. The spectroscopic confirmation of the member galaxies in the core region allowed us to estimate overdensity, , which characterizes A2744-z7p9OD one of the most extreme overdensities in the early universe, with a lower limit on its halo mass of . We also obtained a first estimate of the velocity dispersion of the system ( km s-1), which will aid to compare the observations to similar structures identified in cosmological numerical simulations. By using an empirical relation, we estimated the present-day halo mass of A2744-z7p9OD to be , comparable to the Coma cluster. Our analysis using a cosmological simulation suggests that spectroscopic confirmation of additional member galaxies at a further distance ( pMpc) will further secure the present-day mass estimate.
Our results clearly show the incredible potential of JWST to confirm redshifts thanks to the multiplexing capabilities afforded by the NIRSpec MSA. Remarkably, our study reports a success rate in identifying the redshifts of candidates at high independently of Ly, adding a further five confirmed sources to the literature. Crucially, we refined a previously reported spectroscopic redshift for YD4, suggesting line-of-sight superposition of two distinct sources. This work showcases JWST’s potential to open a window for determining the properties of galaxies in the early universe. In particular – upon the acquisition of a sufficient sample both in A2744-z7p9OD and field control sample at similar redshift – of particular interest for future progress will be the environmental dependence of physical properties of the sources, which we addressed in Sec. 3.2 for the present sample. In turn, this will help understand the role of galaxy clustering during cosmic reionization.
Acknowledgements
We thank Richard Ellis and Nicolas Laporte for useful conversations on the interpretation of the spectroscopic redshift of YD4. We thank the anonymous referee for their careful reading of the manuscript and constructive comments. Support for program JWST-ERS-1324 was provided by NASA through a grant from the Space Telescope Science Institute, which is operated by the Association of Universities for Research in Astronomy, Inc., under NASA contract NAS 5-03127. Some of the data presented in this paper were obtained from the Mikulski Archive for Space Telescopes (MAST) at the Space Telescope Science Institute. The specific observations analyzed can be accessed via https://doi.org/10.17909/bwwe-4a42 (catalog https://doi.org/10.17909/bwwe-4a42). KG acknowledges support from Australian Research Council Laureate Fellowship FL180100060. CM and TYL acknowledge support by the VILLUM FONDEN under grant 37459. The Cosmic Dawn Center (DAWN) is funded by the Danish National Research Foundation under grant DNRF140. This research is supported in part by the Australian Research Council Centre of Excellence for All Sky Astrophysics in 3 Dimensions (ASTRO 3D), through project number CE170100013. We acknowledges support from the INAF Large Grant 2022 “Extragalactic Surveys with JWST” (PI Pentericci). We acknowledge financial support from grants PRIN-MIUR 2017WSCC32 and 2020SKSTHZ.P MB acknowledges support from the Slovenian national research agency ARRS through grant N1-0238. YMB gratefully acknowledges funding from the Dutch Science Organisation (NWO) under Veni grant number 639.041.751. A.V.F. is grateful for financial support from the Christopher R. Redlich Fund and many individual donors. BM acknowledges support from Australian Government Research Training Program (RTP) Scholarships and the Jean E Laby Foundation. XW is supported by CAS Project for Young Scientists in Basic Research, Grant No. YSBR-062. RAW acknowledges support from NASA JWST Interdisciplinary Scientist grants NAG5-12460, NNX14AN10G and 80NSSC18K0200 from GSFC.
References
- Atek et al. (2015) Atek, H., Richard, J., Kneib, J.-P., et al. 2015, ApJ, 800, 18, doi: 10.1088/0004-637X/800/1/18
- Beers et al. (1990) Beers, T. C., Flynn, K., & Gebhardt, K. 1990, AJ, 100, 32, doi: 10.1086/115487
- Bergamini et al. (2022) Bergamini, P., Acebron, A., Grillo, C., et al. 2022, arXiv e-prints, arXiv:2207.09416. https://arxiv.org/abs/2207.09416
- Bertin & Arnouts (1996) Bertin, E., & Arnouts, S. 1996, A&AS, 117, 393
- Bezanson et al. (2022) Bezanson, R., Labbe, I., Whitaker, K. E., et al. 2022, arXiv e-prints, arXiv:2212.04026. https://arxiv.org/abs/2212.04026
- Bouwens et al. (2021) Bouwens, R. J., Oesch, P. A., Stefanon, M., et al. 2021, AJ, 162, 47, doi: 10.3847/1538-3881/abf83e
- Brammer et al. (2022) Brammer, G., Strait, V., Matharu, J., & Momcheva, I. 2022, grizli, 1.5.0, Zenodo, Zenodo, doi: 10.5281/zenodo.6672538
- Brammer et al. (2008) Brammer, G. B., van Dokkum, P. G., & Coppi, P. 2008, ApJ, 686, 1503, doi: 10.1086/591786
- Byler et al. (2017) Byler, N., Dalcanton, J. J., Conroy, C., & Johnson, B. D. 2017, ApJ, 840, 44, doi: 10.3847/1538-4357/aa6c66
- Carniani et al. (2020) Carniani, S., Ferrara, A., Maiolino, R., et al. 2020, MNRAS, 499, 5136, doi: 10.1093/mnras/staa3178
- Castellano et al. (2016) Castellano, M., Dayal, P., Pentericci, L., et al. 2016, ApJ, 818, L3, doi: 10.3847/2041-8205/818/1/L3
- Castellano et al. (2018) Castellano, M., Pentericci, L., Vanzella, E., et al. 2018, ApJ, 863, L3, doi: 10.3847/2041-8213/aad59b
- Castellano et al. (2022) Castellano, M., Pentericci, L., Cupani, G., et al. 2022, A&A, 662, A115, doi: 10.1051/0004-6361/202243348
- Chabrier (2003) Chabrier, G. 2003, PASP, 115, 763, doi: 10.1086/376392
- Chen et al. (2022) Chen, W., Kelly, P., Morishita, T., et al. 2022, Transient Name Server AstroNote, 166, 1
- Chiang et al. (2013) Chiang, Y.-K., Overzier, R., & Gebhardt, K. 2013, ApJ, 779, 127, doi: 10.1088/0004-637X/779/2/127
- Conroy et al. (2009) Conroy, C., Gunn, J. E., & White, M. 2009, ApJ, 699, 486, doi: 10.1088/0004-637X/699/1/486
- Contini et al. (2016) Contini, E., De Lucia, G., Hatch, N., Borgani, S., & Kang, X. 2016, MNRAS, 456, 1924, doi: 10.1093/mnras/stv2852
- De Barros et al. (2017) De Barros, S., Pentericci, L., Vanzella, E., et al. 2017, A&A, 608, A123, doi: 10.1051/0004-6361/201731476
- Dijkstra (2014) Dijkstra, M. 2014, PASA, 31, e040, doi: 10.1017/pasa.2014.33
- Dressler (1980) Dressler, A. 1980, ApJ, 236, 351, doi: 10.1086/157753
- Endsley & Stark (2022) Endsley, R., & Stark, D. P. 2022, MNRAS, 511, 6042, doi: 10.1093/mnras/stac524
- Foreman-Mackey et al. (2013) Foreman-Mackey, D., Hogg, D. W., Lang, D., & Goodman, J. 2013, PASP, 125, 306, doi: 10.1086/670067
- Foreman-Mackey et al. (2014) Foreman-Mackey, D., Sick, J., & Johnson, B. 2014, doi: 10.5281/zenodo.12157
- Fukugita et al. (1996) Fukugita, M., Ichikawa, T., Gunn, J. E., et al. 1996, AJ, 111, 1748, doi: 10.1086/117915
- Haiman & Loeb (1997) Haiman, Z., & Loeb, A. 1997, ApJ, 483, 21, doi: 10.1086/304238
- Harikane et al. (2019) Harikane, Y., Ouchi, M., Ono, Y., et al. 2019, ApJ, 883, 142, doi: 10.3847/1538-4357/ab2cd5
- Hoag et al. (2019a) Hoag, A., Bradač, M., Huang, K., et al. 2019a, ApJ, 878, 12, doi: 10.3847/1538-4357/ab1de7
- Hoag et al. (2019b) —. 2019b, ApJ, 878, 12, doi: 10.3847/1538-4357/ab1de7
- Horne (1986) Horne, K. 1986, PASP, 98, 609, doi: 10.1086/131801
- Hu et al. (2021) Hu, W., Wang, J., Infante, L., et al. 2021, Nature Astronomy, 5, 485, doi: 10.1038/s41550-020-01291-y
- Ishigaki et al. (2016) Ishigaki, M., Ouchi, M., & Harikane, Y. 2016, ApJ, 822, 5, doi: 10.3847/0004-637X/822/1/5
- Laporte et al. (2022) Laporte, N., Zitrin, A., Dole, H., et al. 2022, A&A, 667, L3, doi: 10.1051/0004-6361/202244719
- Laporte et al. (2017) Laporte, N., Ellis, R. S., Boone, F., et al. 2017, ApJ, 837, L21, doi: 10.3847/2041-8213/aa62aa
- Laporte et al. (2019) Laporte, N., Katz, H., Ellis, R. S., et al. 2019, MNRAS, 487, L81, doi: 10.1093/mnrasl/slz094
- Larson et al. (2022) Larson, R. L., Finkelstein, S. L., Hutchison, T. A., et al. 2022, ApJ, 930, 104, doi: 10.3847/1538-4357/ac5dbd
- Leethochawalit et al. (2022) Leethochawalit, N., Trenti, M., Santini, P., et al. 2022, arXiv e-prints, arXiv:2207.11135. https://arxiv.org/abs/2207.11135
- Lotz et al. (2017) Lotz, J. M., Koekemoer, A., Coe, D., et al. 2017, ApJ, 837, 97, doi: 10.3847/1538-4357/837/1/97
- Madau et al. (1999) Madau, P., Haardt, F., & Rees, M. J. 1999, ApJ, 514, 648, doi: 10.1086/306975
- Mascia et al. (2023) Mascia, S., Pentericci, L., Calabro’, A., et al. 2023, arXiv e-prints, arXiv:2301.02816, doi: 10.48550/arXiv.2301.02816
- Mason & Gronke (2020) Mason, C. A., & Gronke, M. 2020, MNRAS, 499, 1395, doi: 10.1093/mnras/staa2910
- Mason et al. (2022) Mason, C. A., Trenti, M., & Treu, T. 2022, arXiv e-prints, arXiv:2207.14808. https://arxiv.org/abs/2207.14808
- Mason et al. (2018) Mason, C. A., Treu, T., Dijkstra, M., et al. 2018, ApJ, 856, 2, doi: 10.3847/1538-4357/aab0a7
- Mason et al. (2019) Mason, C. A., Fontana, A., Treu, T., et al. 2019, MNRAS, 485, 3947, doi: 10.1093/mnras/stz632
- Merlin et al. (2022) Merlin, E., Bonchi, A., Paris, D., et al. 2022, ApJ, 938, L14, doi: 10.3847/2041-8213/ac8f93
- Mesinger & Furlanetto (2007) Mesinger, A., & Furlanetto, S. 2007, ApJ, 669, 663, doi: 10.1086/521806
- Mesinger et al. (2016) Mesinger, A., Greig, B., & Sobacchi, E. 2016, MNRAS, 459, 2342, doi: 10.1093/mnras/stw831
- Miralda-Escudé (1998) Miralda-Escudé, J. 1998, ApJ, 501, 15, doi: 10.1086/305799
- Mo & White (1996) Mo, H. J., & White, S. D. M. 1996, MNRAS, 282, 347, doi: 10.1093/mnras/282.2.347
- Morishita et al. (2021) Morishita, T., D’Amato, Q., Abramson, L. E., et al. 2021, ApJ, 908, 163, doi: 10.3847/1538-4357/abd800
- Morishita & Stiavelli (2022) Morishita, T., & Stiavelli, M. 2022, arXiv e-prints, arXiv:2207.11671. https://arxiv.org/abs/2207.11671
- Morishita et al. (2019) Morishita, T., Abramson, L. E., Treu, T., et al. 2019, ApJ, 877, 141, doi: 10.3847/1538-4357/ab1d53
- Morishita et al. (2020) Morishita, T., Stiavelli, M., Trenti, M., et al. 2020, ApJ, 904, 50, doi: 10.3847/1538-4357/abba83
- Oke & Gunn (1983) Oke, J. B., & Gunn, J. E. 1983, ApJ, 266, 713, doi: 10.1086/160817
- Osterbrock (1989) Osterbrock, D. E. 1989, Astrophysics of gaseous nebulae and active galactic nuclei
- Ouchi et al. (2018) Ouchi, M., Harikane, Y., Shibuya, T., et al. 2018, PASJ, 70, S13, doi: 10.1093/pasj/psx074
- Overzier (2016) Overzier, R. A. 2016, A&A Rev., 24, 14, doi: 10.1007/s00159-016-0100-3
- Overzier et al. (2009) Overzier, R. A., Guo, Q., Kauffmann, G., et al. 2009, MNRAS, 394, 577, doi: 10.1111/j.1365-2966.2008.14264.x
- Postman et al. (2012) Postman, M., Coe, D., Benítez, N., et al. 2012, ApJS, 199, 25, doi: 10.1088/0067-0049/199/2/25
- Prieto-Lyon et al. (2022) Prieto-Lyon, G., Strait, V., Mason, C. A., et al. 2022, arXiv e-prints, arXiv:2211.12548. https://arxiv.org/abs/2211.12548
- Qin et al. (2021) Qin, Y., Mesinger, A., Bosman, S. E. I., & Viel, M. 2021, MNRAS, 506, 2390, doi: 10.1093/mnras/stab1833
- Roberts-Borsani et al. (2022a) Roberts-Borsani, G., Morishita, T., Treu, T., et al. 2022a, ApJ, 938, L13, doi: 10.3847/2041-8213/ac8e6e
- Roberts-Borsani et al. (2022b) Roberts-Borsani, G., Treu, T., Chen, W., et al. 2022b, arXiv e-prints, arXiv:2210.15639. https://arxiv.org/abs/2210.15639
- Roberts-Borsani et al. (2022c) Roberts-Borsani, G., Treu, T., Mason, C., et al. 2022c, arXiv e-prints, arXiv:2207.01629. https://arxiv.org/abs/2207.01629
- Robertson et al. (2013) Robertson, B. E., Furlanetto, S. R., Schneider, E., et al. 2013, ApJ, 768, 71, doi: 10.1088/0004-637X/768/1/71
- Rosati et al. (2002) Rosati, P., Tozzi, P., Giacconi, R., et al. 2002, ApJ, 566, 667, doi: 10.1086/338339
- Schaerer et al. (2016) Schaerer, D., Izotov, Y. I., Verhamme, A., et al. 2016, A&A, 591, L8, doi: 10.1051/0004-6361/201628943
- Schaye et al. (2015) Schaye, J., Crain, R. A., Bower, R. G., et al. 2015, MNRAS, 446, 521, doi: 10.1093/mnras/stu2058
- Shivaei et al. (2020) Shivaei, I., Reddy, N., Rieke, G., et al. 2020, ApJ, 899, 117, doi: 10.3847/1538-4357/aba35e
- Shull et al. (2012) Shull, J. M., Harness, A., Trenti, M., & Smith, B. D. 2012, ApJ, 747, 100, doi: 10.1088/0004-637X/747/2/100
- Steidel et al. (1998) Steidel, C. C., Adelberger, K. L., Dickinson, M., et al. 1998, ApJ, 492, 428, doi: 10.1086/305073
- Steinhardt et al. (2020) Steinhardt, C. L., Jauzac, M., Acebron, A., et al. 2020, ApJS, 247, 64, doi: 10.3847/1538-4365/ab75ed
- Tegmark et al. (1997) Tegmark, M., Silk, J., Rees, M. J., et al. 1997, ApJ, 474, 1, doi: 10.1086/303434
- Thomas et al. (2010) Thomas, D., Maraston, C., Schawinski, K., Sarzi, M., & Silk, J. 2010, MNRAS, 404, 1775, doi: 10.1111/j.1365-2966.2010.16427.x
- Tilvi et al. (2020) Tilvi, V., Malhotra, S., Rhoads, J. E., et al. 2020, ApJ, 891, L10, doi: 10.3847/2041-8213/ab75ec
- Trapp et al. (2022) Trapp, A. C., Furlanetto, S. R., & Davies, F. B. 2022, arXiv e-prints, arXiv:2210.06504. https://arxiv.org/abs/2210.06504
- Trenti et al. (2008) Trenti, M., Santos, M. R., & Stiavelli, M. 2008, ApJ, 687, 1, doi: 10.1086/592037
- Trenti et al. (2012) Trenti, M., Bradley, L. D., Stiavelli, M., et al. 2012, ApJ, 746, 55, doi: 10.1088/0004-637X/746/1/55
- Treu et al. (2015) Treu, T., Schmidt, K. B., Brammer, G. B., et al. 2015, ApJ, 812, 114, doi: 10.1088/0004-637X/812/2/114
- Treu et al. (2022) Treu, T., Roberts-Borsani, G., Bradac, M., et al. 2022, ApJ, 935, 110, doi: 10.3847/1538-4357/ac8158
- Zheng et al. (2014) Zheng, W., Shu, X., Moustakas, J., et al. 2014, ApJ, 795, 93, doi: 10.1088/0004-637X/795/1/93