Viscous effects on nonlinear double tearing mode and plasmoid formation in adjacent Harris sheets
Abstract
In this paper, we study the effects of viscosity on the evolution of double tearing mode (DTM) in a pair of adjacent Harris sheets based on the resistive MHD model in the NIMROD code. Similar to the tearing mode in the conventional single Harris sheet, a transition is observed in the generation of both normal and monster plasmoids at . In the regime of DTM, normal plasmoids (small plasmoids) are generated along with monster plasmoid, whereas in the single tearing mode (STM) cases such a generation is not observed. When is above the critical value, the generation of monster plasmoid is halted. Correspondingly, in the regime, a quadrupolar flow advects along poloidal direction, but in regime this flow advection is inhibited.
pacs:
I Introduction
In space and fusion plasmas bierwage2005fast ; wang2011interlocking ; ishii2009plasma ; akramov2017non , double tearing modes (DTMs) and associated fast magnetic reconnection mechanisms have been subjects of broad interests in recent years. Double (multiple) current sheets are commonly observed in space plasma, such as in neighboring coronal helmet streamers dahlburg1995triple , the solar wind crooker1993multiple , and the solar corona mikic1988dynamical in general. The Earth’s bow shock schwartz1988active , for example, can trigger double, triple, or even multiple tearing modes yan1994tearing ; bowers2007spectral ; baty2017explosive . Reversed magnetic shear (RMS) are commonly formed in advanced scenarios of tokamak operations levinton1995improved , which can lead to the onset of double tearing modes on two adjacent rational surfaces with the same safety factor and the subsequent off-axis sawtooth oscillation or even disruption ishii2002structure ; wang2007fast ; janvier2011structure ; priest1985magnetohydrodynamics ; chang1996off . The magnetic reconfiguration caused by DTM has been extensively studied ishii2002structure ; ishii2003long ; wang2007fast ; wang2008shear , which is among the most significant aspects of DTM’s nonlinear evolution.
The linear growth rate of DTM for small distances between adjecent current sheets scales with the resistivity as . When the distance between them is larger, scaling becomes pritchett1980linear . In the nonlinear regime, the coupling in DTM would disrupt linearly stable tearing modes and ramp up the growth of magnetic islands ishii2002structure ; yu1996nonlinear ; persson1994nonlinear . Effects like anomalous electron viscosity, finite beta, and sheared toroidal flows can make DTMs more unstable furth1973tearing ; dong2003double ; held1999magnetohydrodynamic .
Many experts have studied the nonlinear effects of DTMs due to resistivity, shear flow, large guiding field, and current sheet spacing ma2017effect ; zhang2011nonlinear ; nemati2018unstable ; shen1998magnetic ; shen1998properties . During the nonlinear evolution of DTM, unstable long and thin current sheets can form as a result of the island’s interaction and breakup, leading to secondary islands zhang2011nonlinear or even tertiary islands nemati2016formation ; nemati2017dynamics , demonstrating the variety and complexity of physics in the high Lundquist number regime.
In recent studies nemati2016formation ; Guo2017 , multiple plasmoid formations were observed in the absence of viscosity in a simulation of multiple current sheet systems with high Lundquist number parameters. However, there has been limited study about viscosity effects on DTM nonlinear evolution. Minor electromagnetic perturbations may generate anomalous electron viscosity in tokamak plasmas konovalov2002transport . As a kind of dissipation effect, anomalous electron viscosity may also drive tearing mode instability, which is thought to be one of the possible causes of plasma disruption kaw1979tearing ; ahmad2021viscous ; ALI2015 ; ALI2019 . The electron viscosity tearing modes are one potential physical mechanism for the rapid saw-tooth disruption reported in experiments aydemir1990magnetohydrodynamic . In slab configuration plasmas, the linear features of DTMs owing to anomalous electron viscosity have also been stated dong2003double .
In this work, the resistive-viscous MHD model implemented in the NIMROD code sovinec2004nonlinear is utilized to systematically investigate the nonlinear evolution of DTM, focusing on the effect of viscosity on the formation and evolution of plasmoids. Normal plasmoids (small plasmoids) nemati2017dynamics along with the monster plasmoid appear in the regime, whereas in the regime only monster plasmoid appears. The plasmoid dynamics in our simulations are compared with previous studies He2015 ; Mao2021 .
The rest of the paper is organized as follows. In Sec. II, we briefly describe our simulation model. In Sec. III and IV, both linear and nonlinear simulation results are reported respectively. At the end in Sec. V, summary and discussion are presented.
II Simulation model and equilibrium
Our simulations are based on the single-fluid full MHD model implemented in the NIMROD sovinec2004nonlinear code. The below visco-resistive MHD model (1)–(4) equations used in our study are all non-dimensional.
| (1) |
| (2) |
| (3) |
| (4) |
where and are the plasma mass density, current density, pressure, specific heat ratio, velocity, number density, magnetic field, viscosity, and resistivity, respectively. The Boltzmann constant (k) has been absorbed into temperature. The particle mass density and number density are related through the mass per ion, and total temperature and pressure relate the ideal gas relation, = 2, considering rapid thermal equilibration and quasi-neutrality condition among electrons and ions. The initial equilibrium profiles for , and pressure are given below.
| (5) |
| (6) |
| (7) |
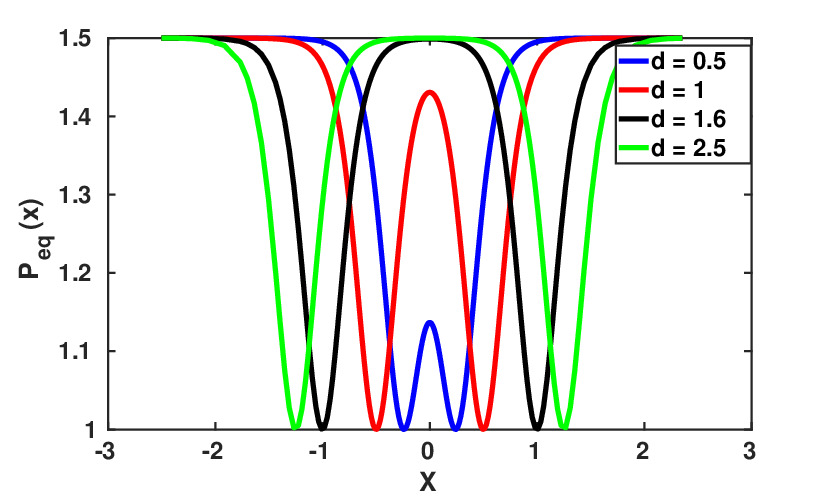
where the Cartesian coordinates are adopted. The equilibrium profiles of , and at different resonance surfaces are plotted in Fig. 1. Here controls the width of the profile, represents the half distance between the two adjacent current sheets, and we assume a uniform mass density . The magnetic field is normalized by the field magnitude at the edge of the Harris sheet, i.e. . The spatial normalization unit is the half distance between the two adjacent current sheets. The mass density is normalized by the field magnitude at the center of the current sheets. The normalization units for time, pressure, and velocity are , , and respectively. Also the adiabatic index and the heat flux is zero. In the above non-dimensional equations (1)–(4), both the viscosity and the resistivity are the normalized dimensionless parameters, with , and , where is the Lundquist number , , is the unnormalized dimensionless resistivity, and is the magnetic Prandtl number, is the unnormalized dimensionless viscosity, with .
The resistive MHD equations are solved in a rectangular domain of the form like . Note that the wave number is defined as with is the mode wave number along , and being the mode number. Periodic boundary conditions are imposed along the direction and all perturbations in direction are taken to vanish at the boundaries.
III Linear double tearing mode (DTM)
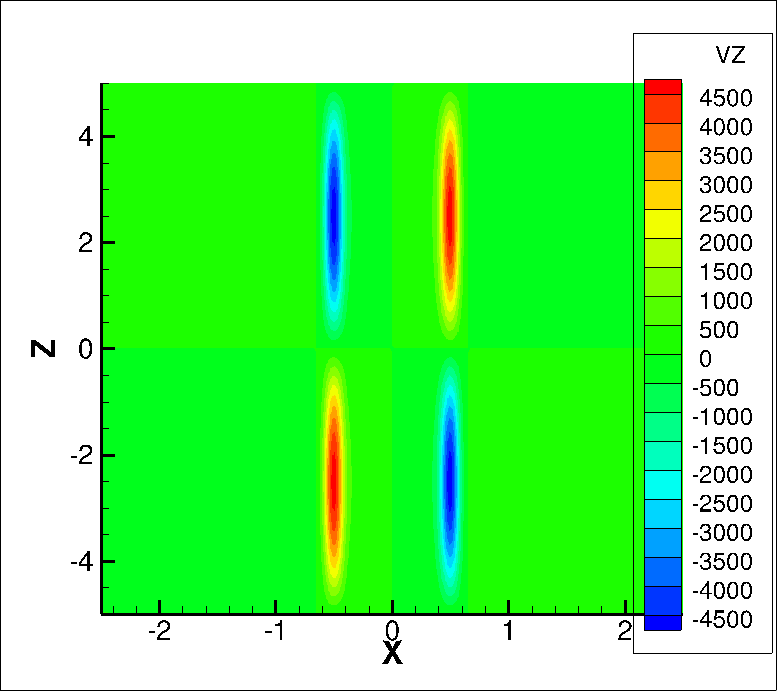
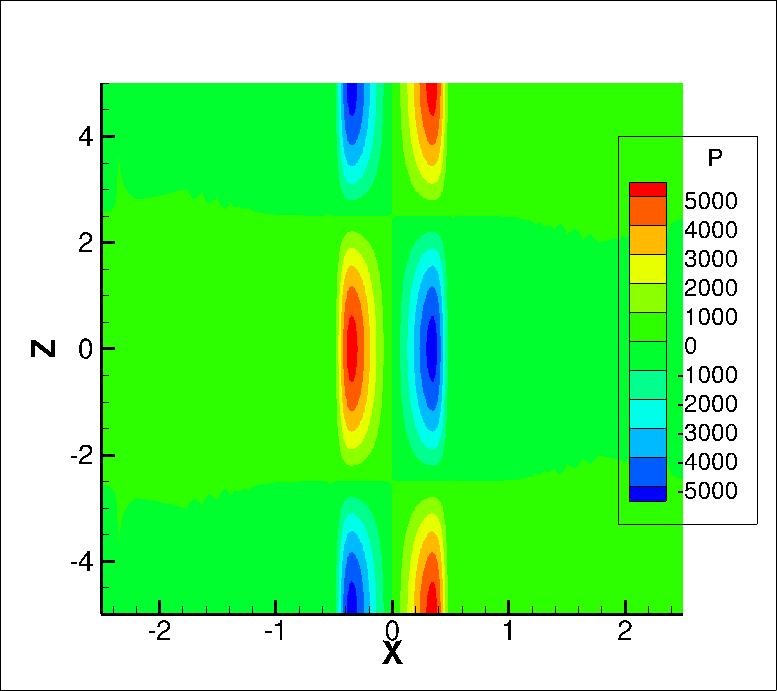
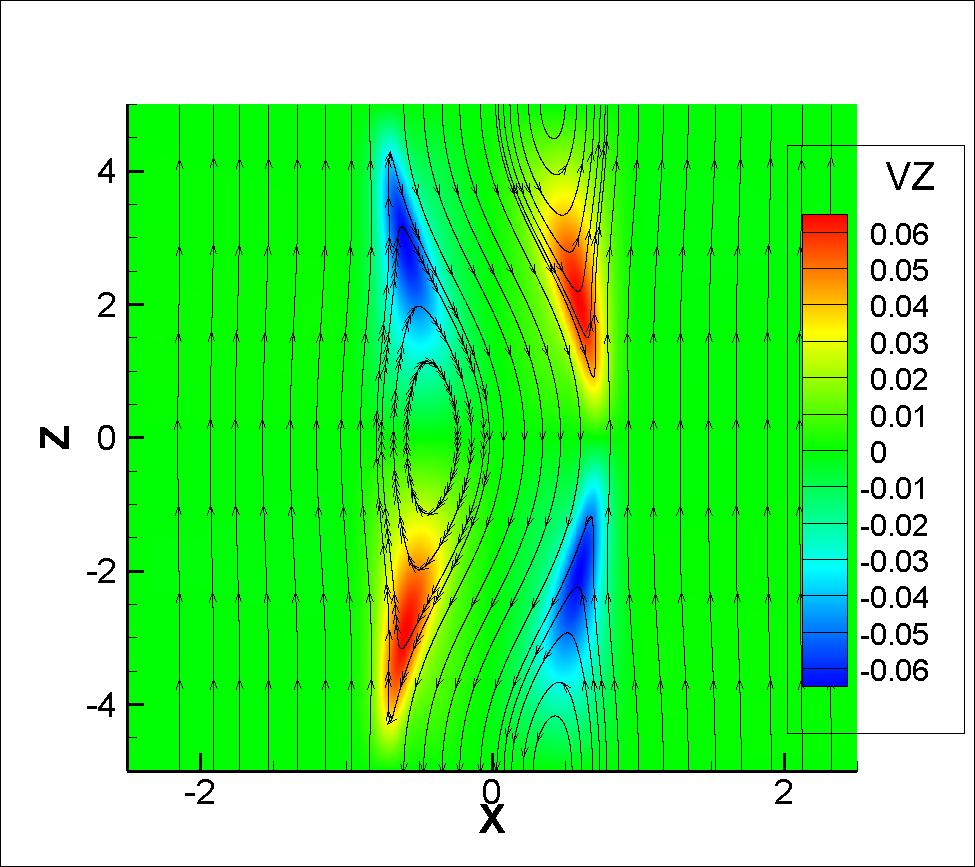
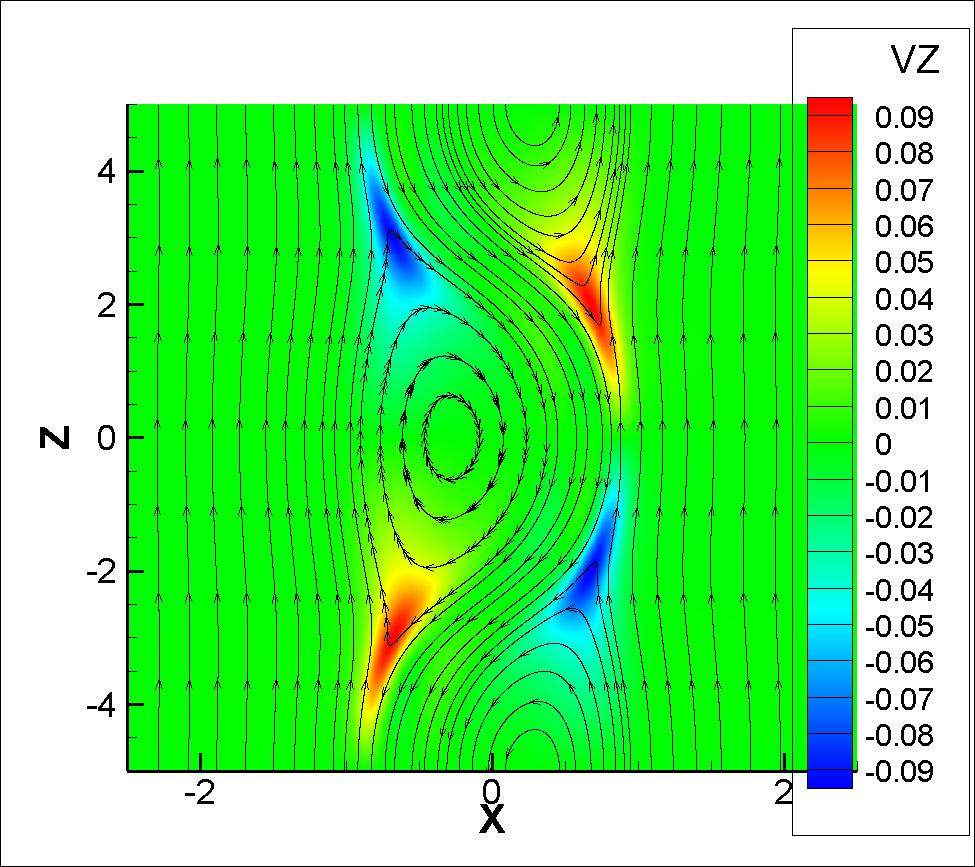
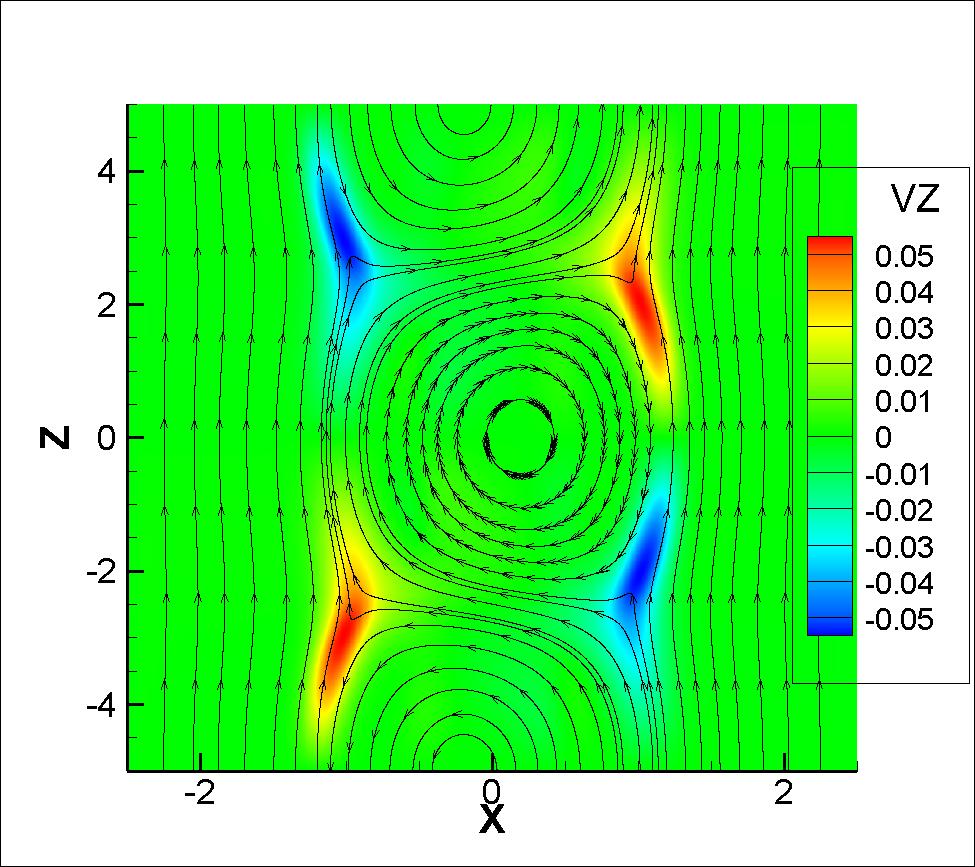
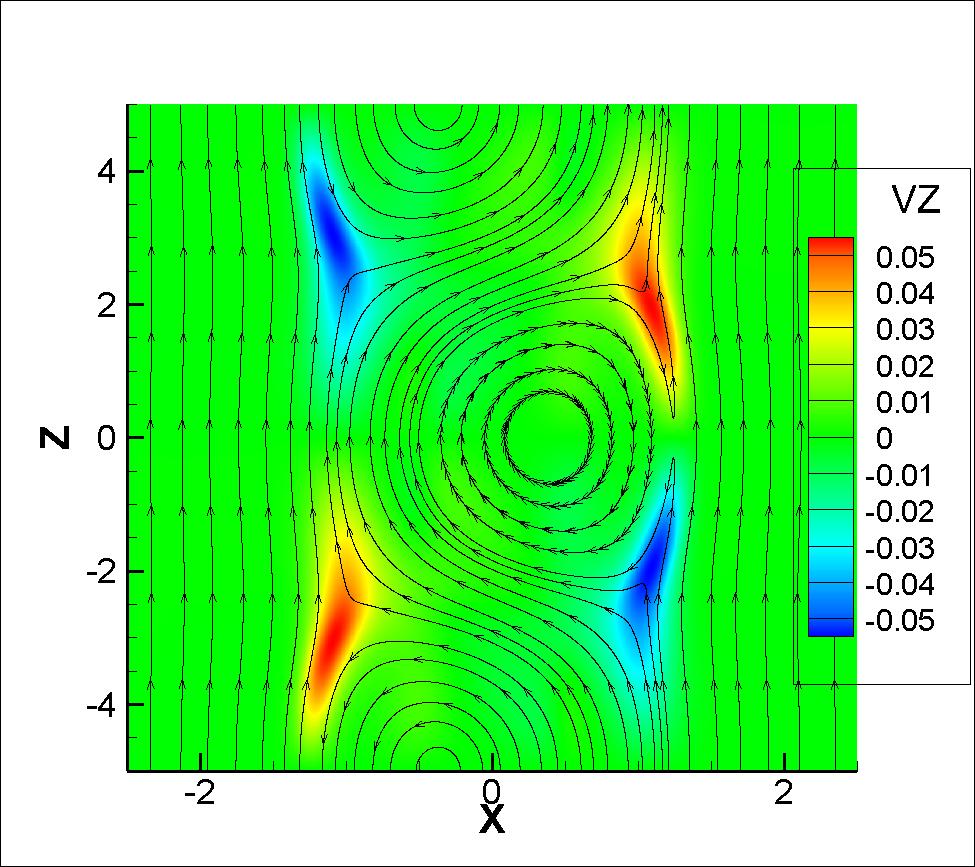
In Fig. 2, we have plotted contours of the linear mode structure for different fields at between the adjacent current sheets. We have performed these study just to make an overview and conclusion about a specific case to study the nonlinear dynamics for double tearing mode. As we know the reconnection greatly depends on quadrupolar flow cells. At large distances between the rational surfaces these quadrupolar flow cells partially advected in the poloidal direction. To analyze the nonlinear dynamics of double tearing mode, it is necessary to completely learn about these flow cells and the role of these cells in the generation of plasmoids. As a quadrupolar flow can be generated and/or destroyed outside the current sheet. Also this quadrupolar flow directly affected by the viscosity which surely influences the reconnection process.
In Fig. 3(a), growth rate is plotted as a function of for different distances between the adjacent current sheets. For a fixed distance between the current sheets, a good agreement with existing theory is found at small value of . But for large value of , it is observed that our results deviate from the existing theory coppi1976resistive . From Fig. 3(a), we can also conclude that for a highly unstable system the power of remains near to 0.33 which matches the scaling law for small distances between adjacent current sheets pritchett1980linear . In Fig. 3(b), for different within the range [0.5, 3], the parameter ( where is = ) is plotted as a function of the distances between the rational surfaces. The transition between the scaling for large and for small is clearly observed in previous studies Shu2013 . In our case, we have selected the anti-symmetric equilibrium, the change in the index is not matching as found in literature. As we increase the distance between the current sheets, the increases up to the distance , then it decreases quickly. This trend is different from the existing previous results. This maybe due to the fact that we are dealing with highly unstable system.
It is found [Fig. 4(a)], as the viscosity increases, the growth rate quickly slows down. The magnetic Prandtl number for typical fusion systems can be the order of 100. Also for a fixed value of distance between those rational surfaces, the growth rate shows a transition at . In regime, the effect of viscosity is negligible whereas in regime, the growth rate decreases sharply. The viscous scaling for our simulations at and are , and respectively. These scaling are very close to the theoretical scaling ofman1992double ; dong2003double . From Fig. 4(b), for a fixed Prandtl number, the growth rate decreases by increasing the distances between the current sheets or vice versa.
IV Nonlinear DTM and plasmoids
IV.1 Nonlinear DTM evolution
To study the effects on the nonlinear DTM evolution, one particular case having wave vector is selected. The viscosity is varied in the form of the Prandtl number in the range with the fixed resistivity and the current sheets spacing . 2D finite elements with a 5th order polynomial basis function in each 2D direction are used in our simulations to ensure numerical convergence [Fig. 5].
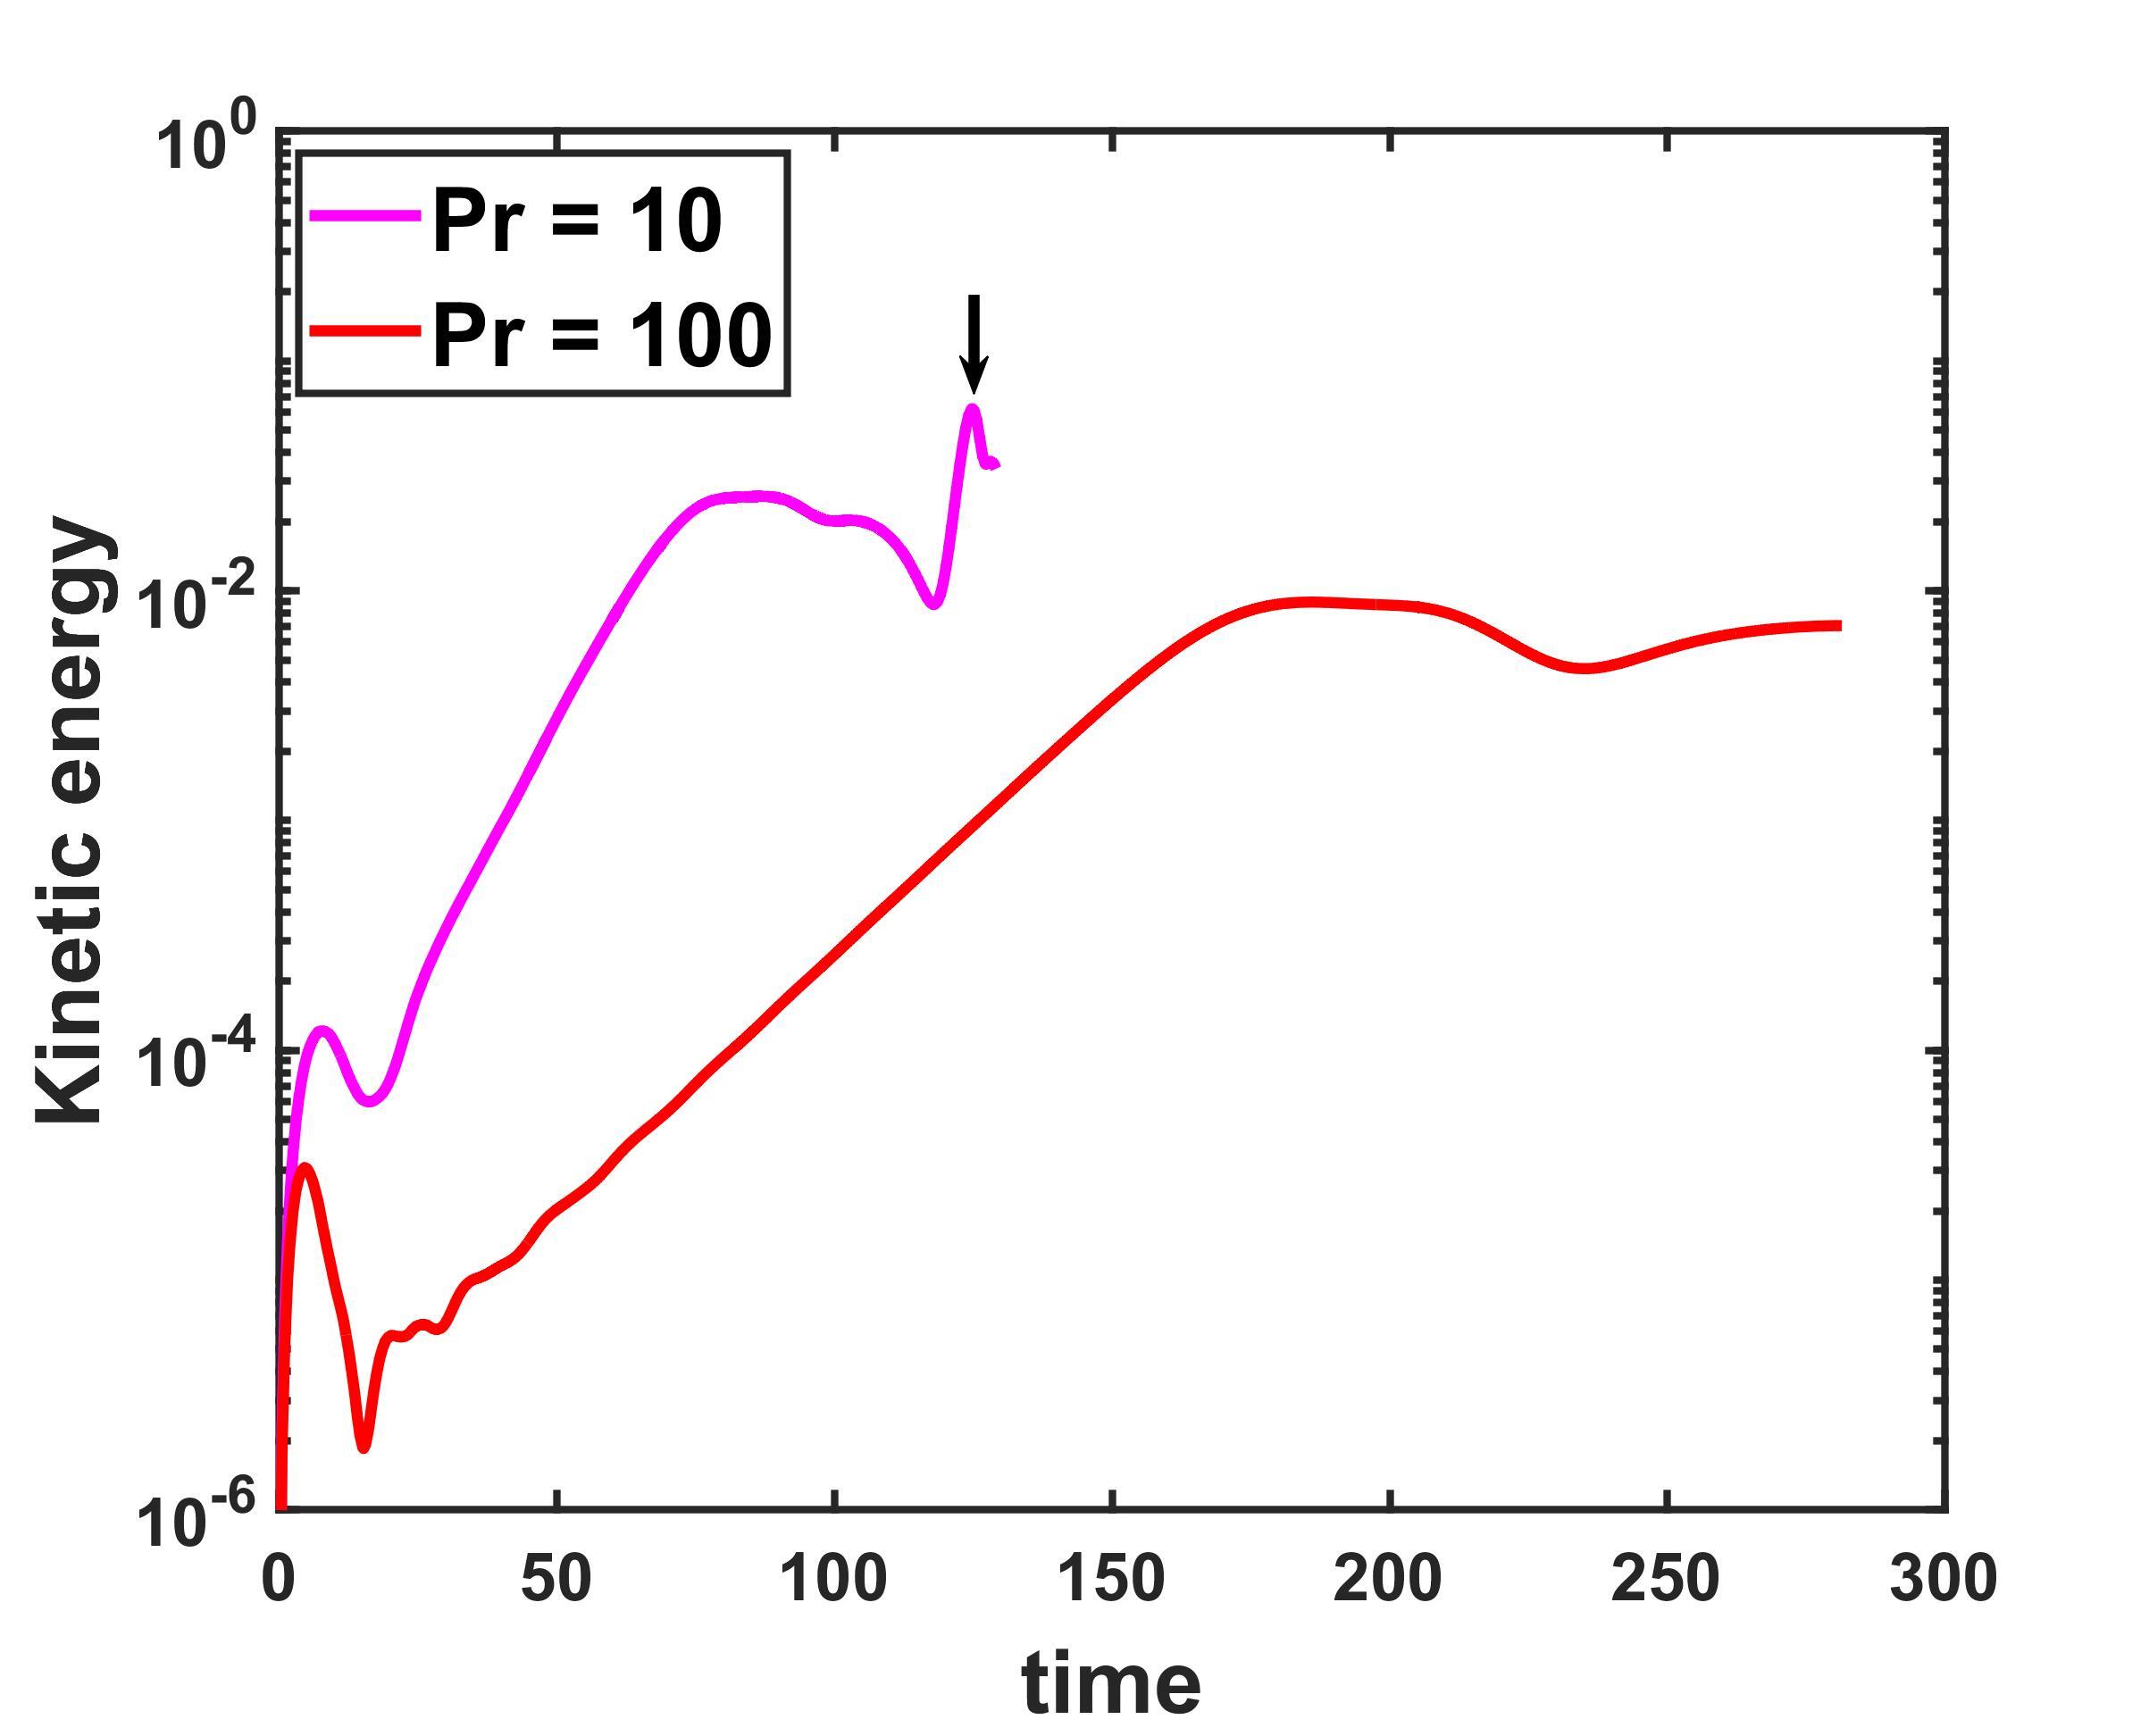
The time histories of the plasma kinetic energy for different values of Prandtl number are compared [Fig. 6], where the black arrows indicate the moments of monster plasmoids generation and the red arrows show the subsequent moments of the normal (small) plasmoid formation. In the case of , the kinetic energy grows very fast in the linear phase and reaches maximum very quickly due to the generation of normal plasmoids [Fig. 6(a)]. By increasing the Prandtl number, such as , the evolution of kinetic energy goes through four stages: an early linear growth phase, slow nonlinear Rutherford phase, fast flux-driven reconnection phase, and a decay phase. In results, by increasing the Prandtl number the early linear growth phase and the slow nonlinear Rutherford phase evolve for longer time. Also by increasing the , fast flux-driven reconnection phase becomes absent [Fig. 6(c)].
IV.2 Plasmoid formation
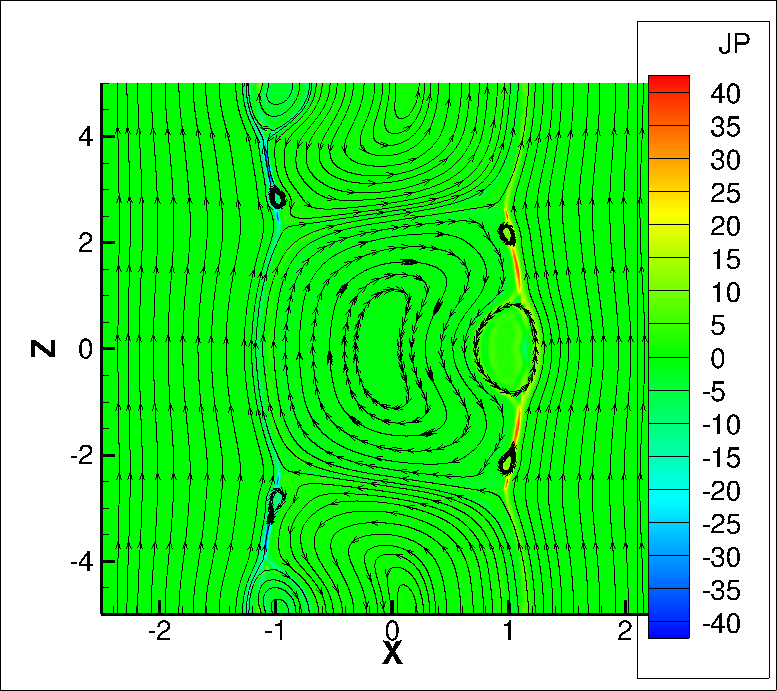
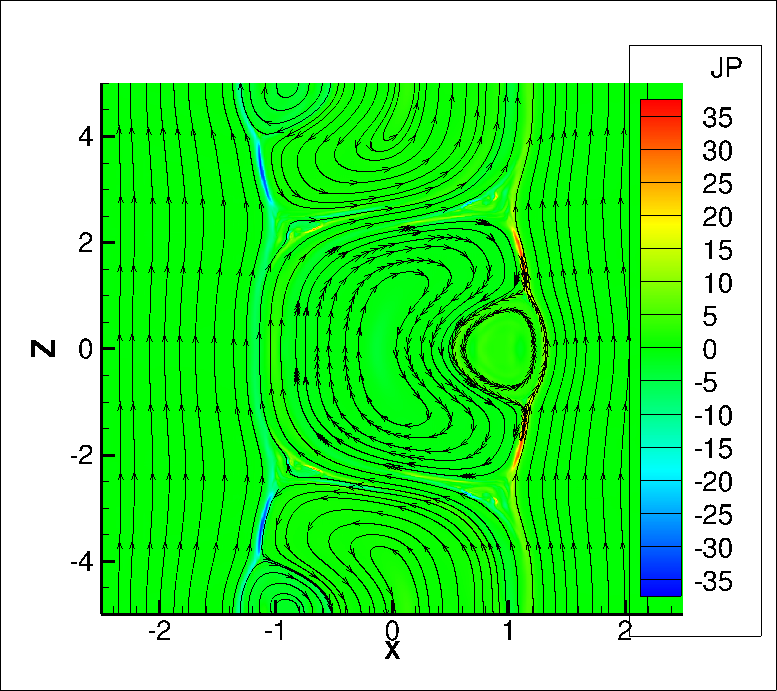
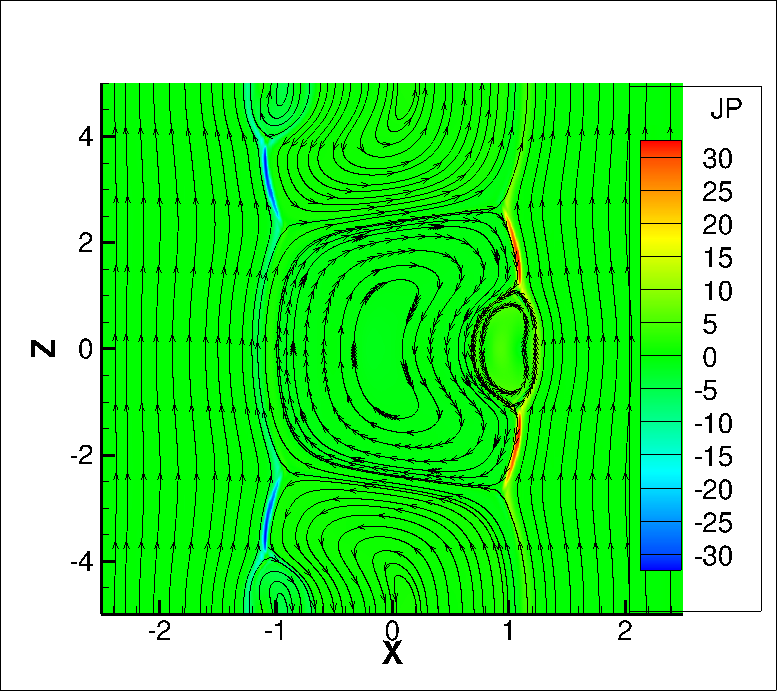
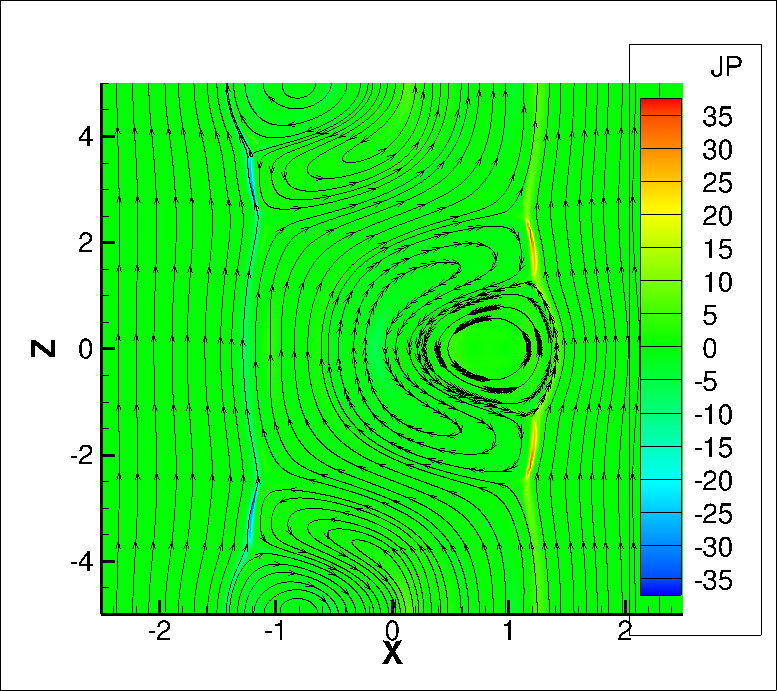
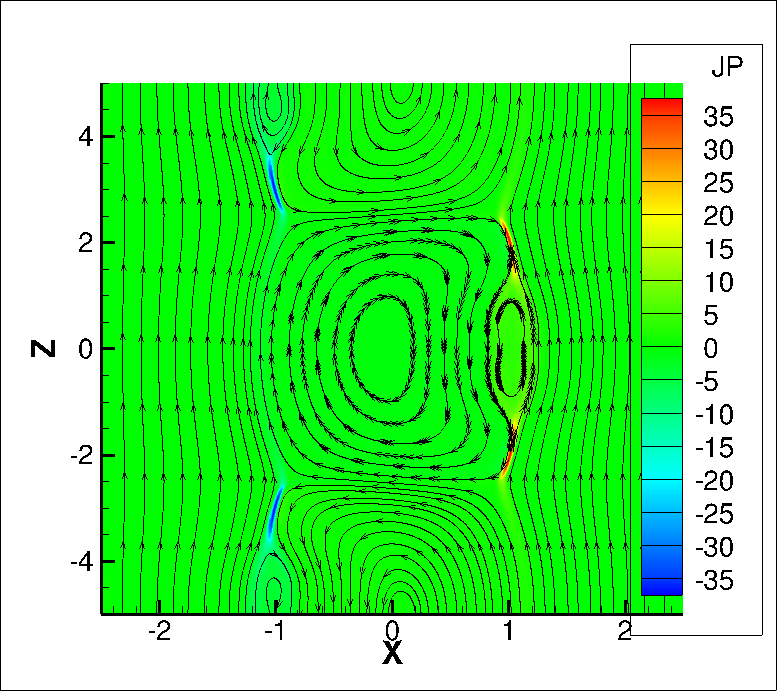
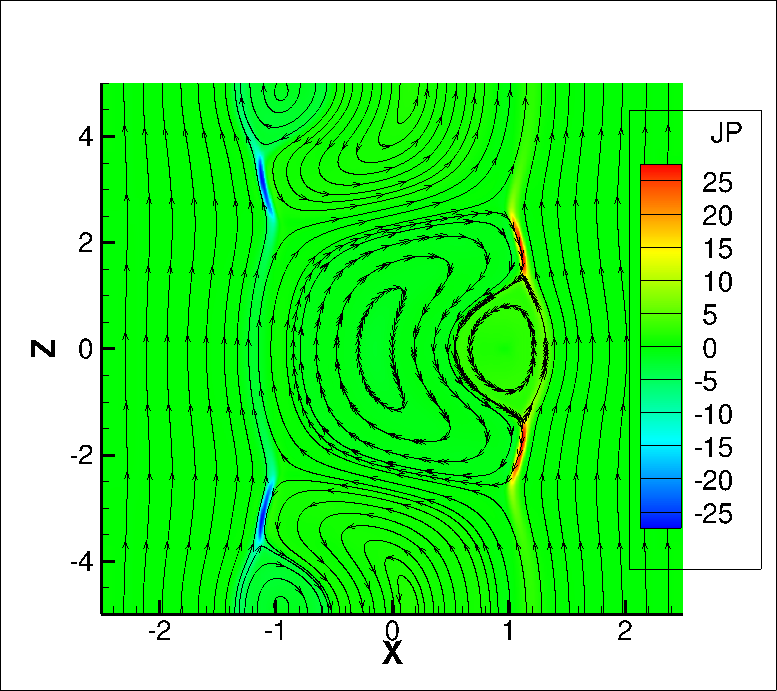
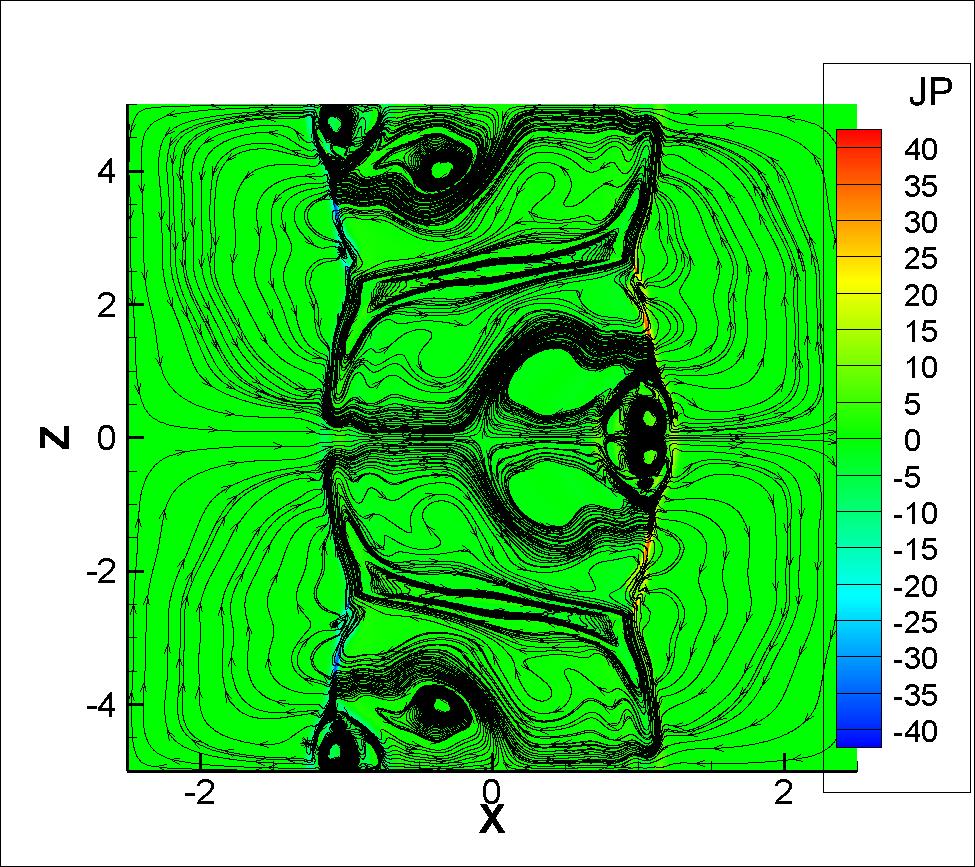
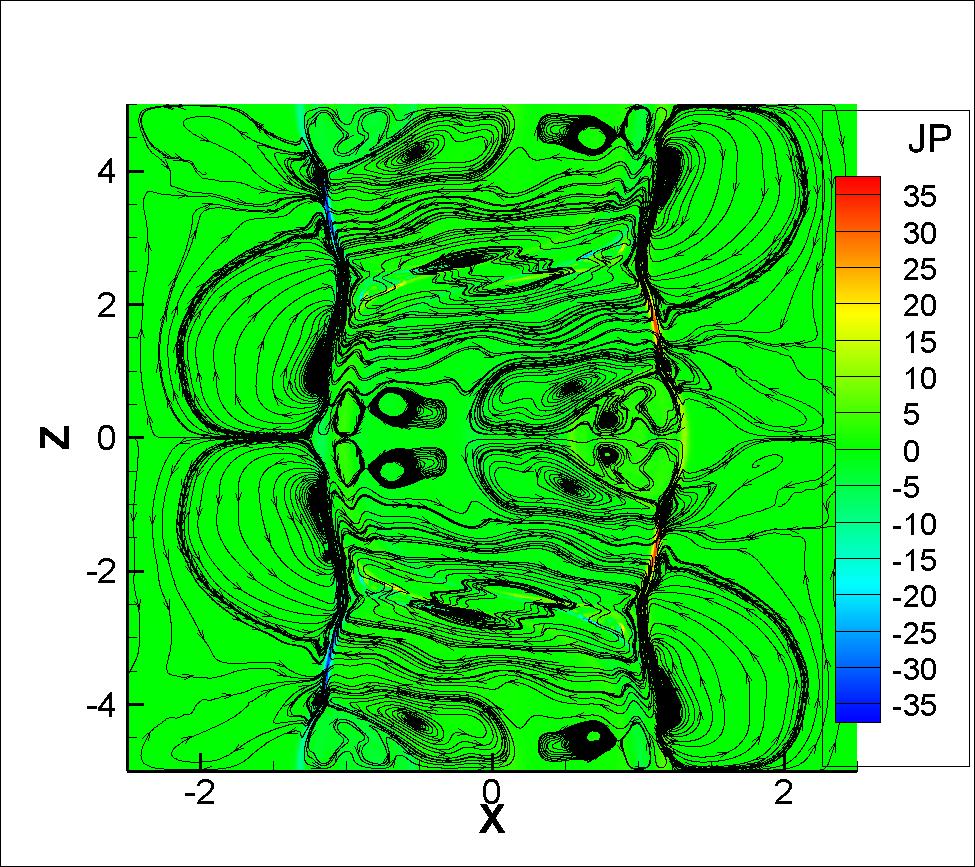
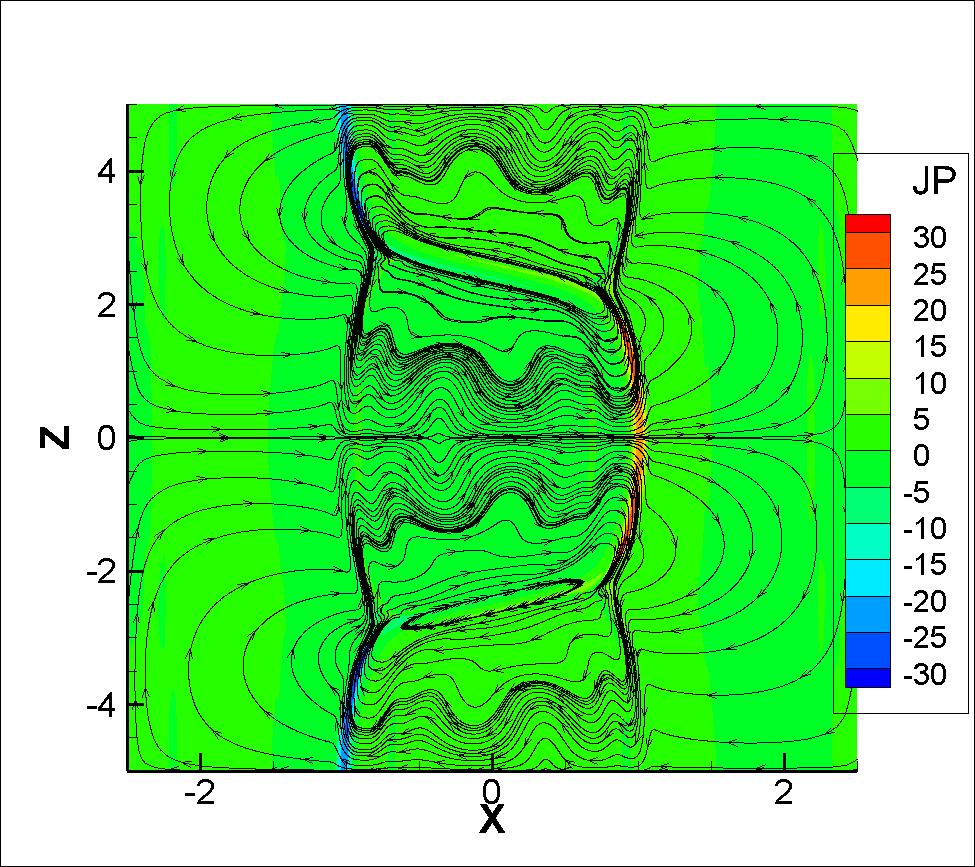
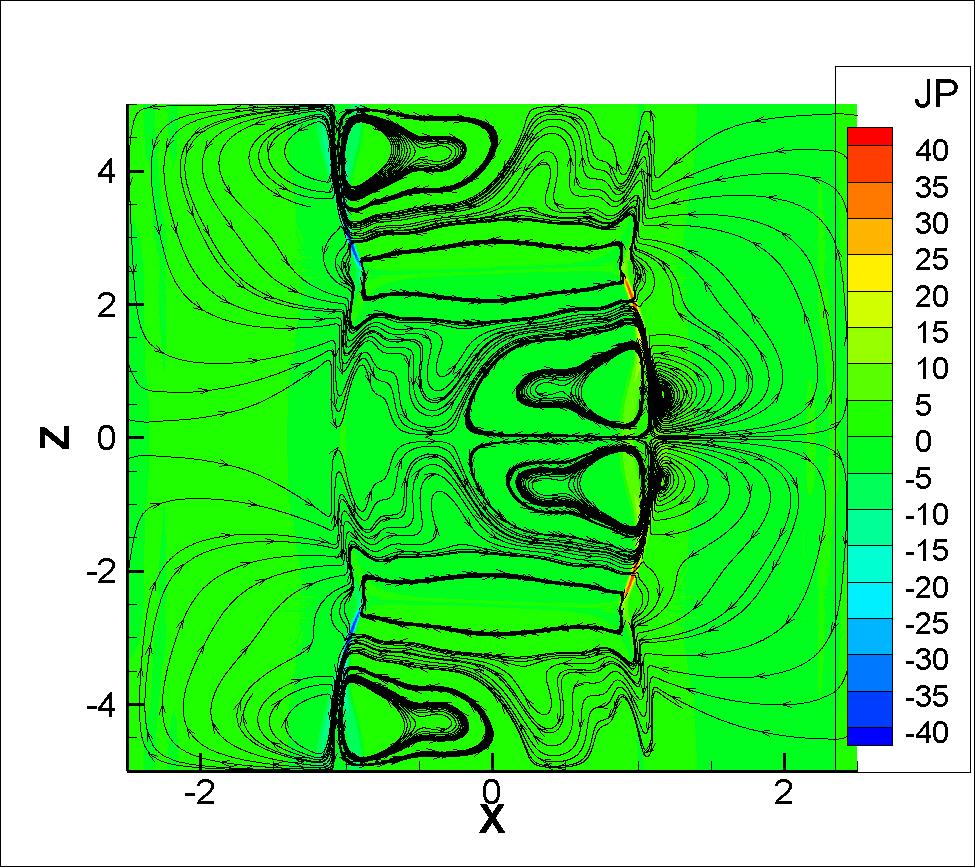
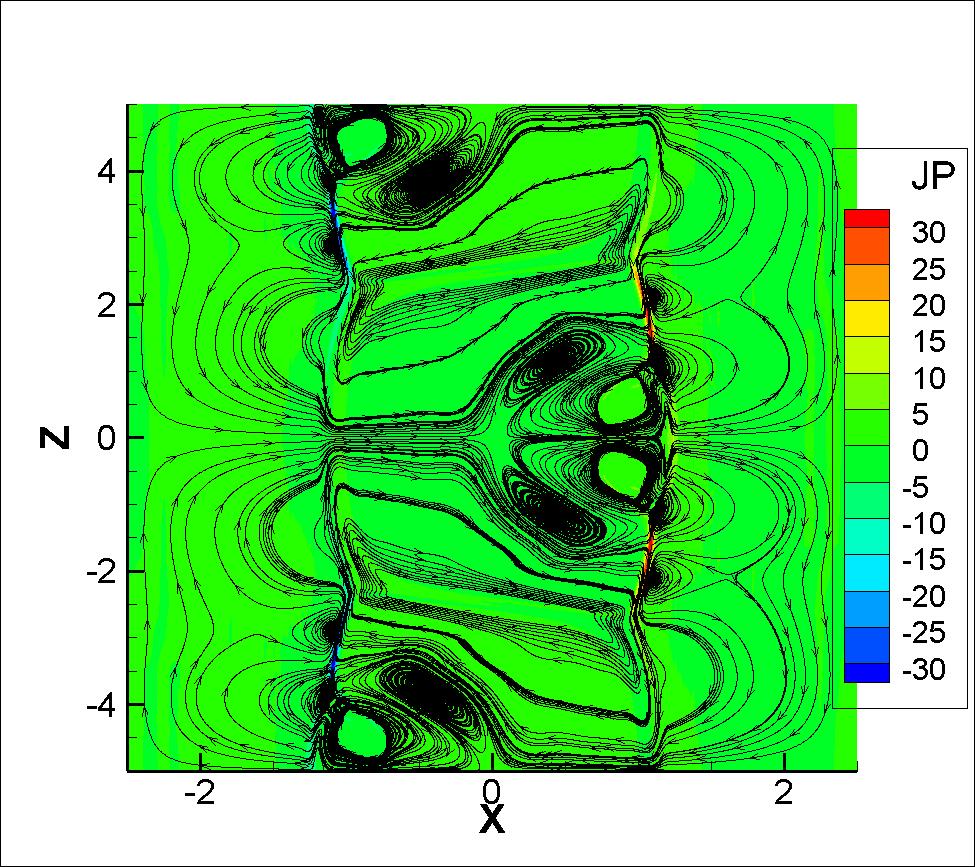
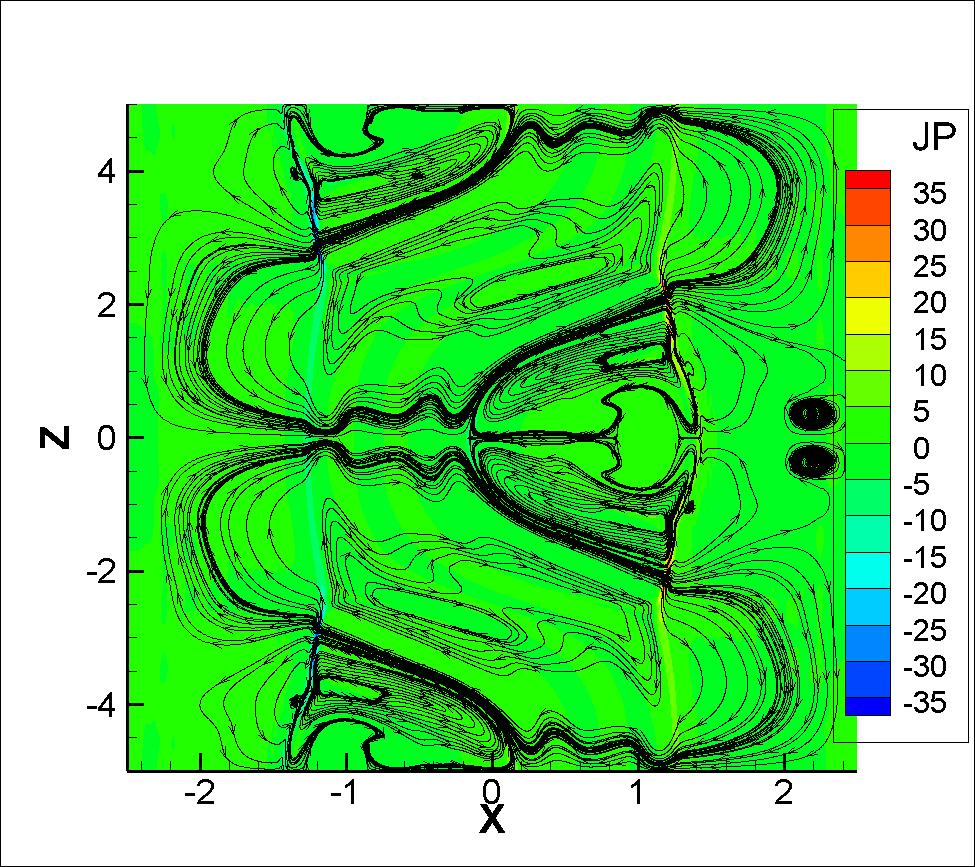
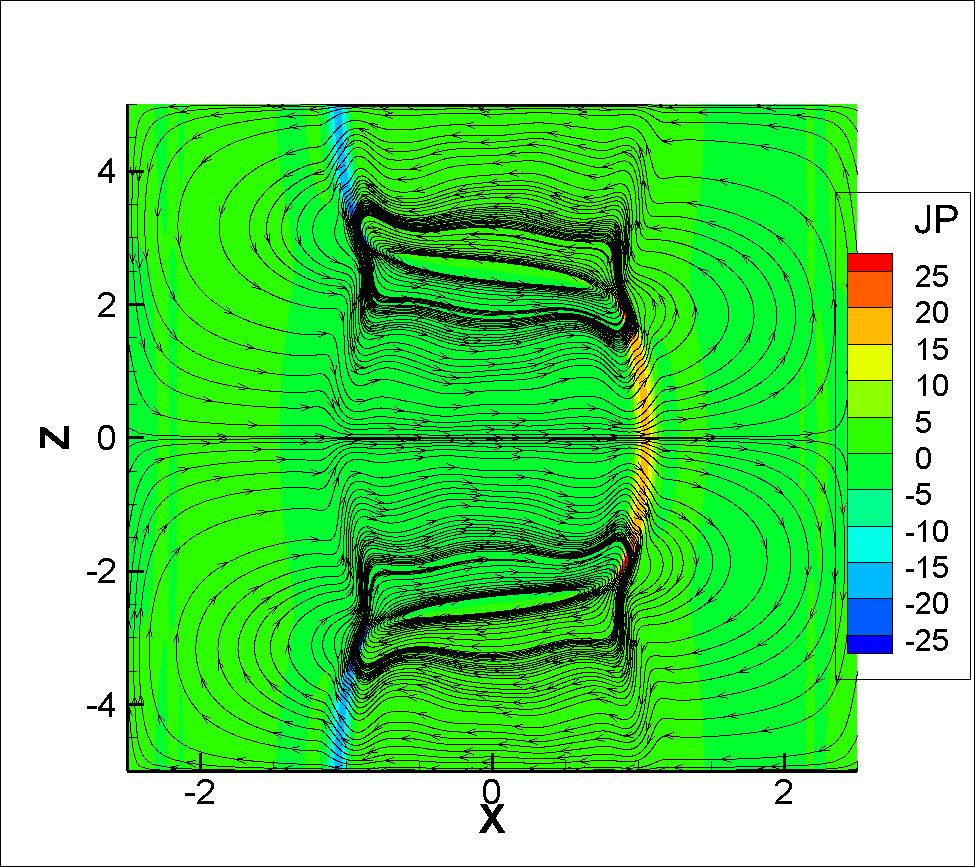
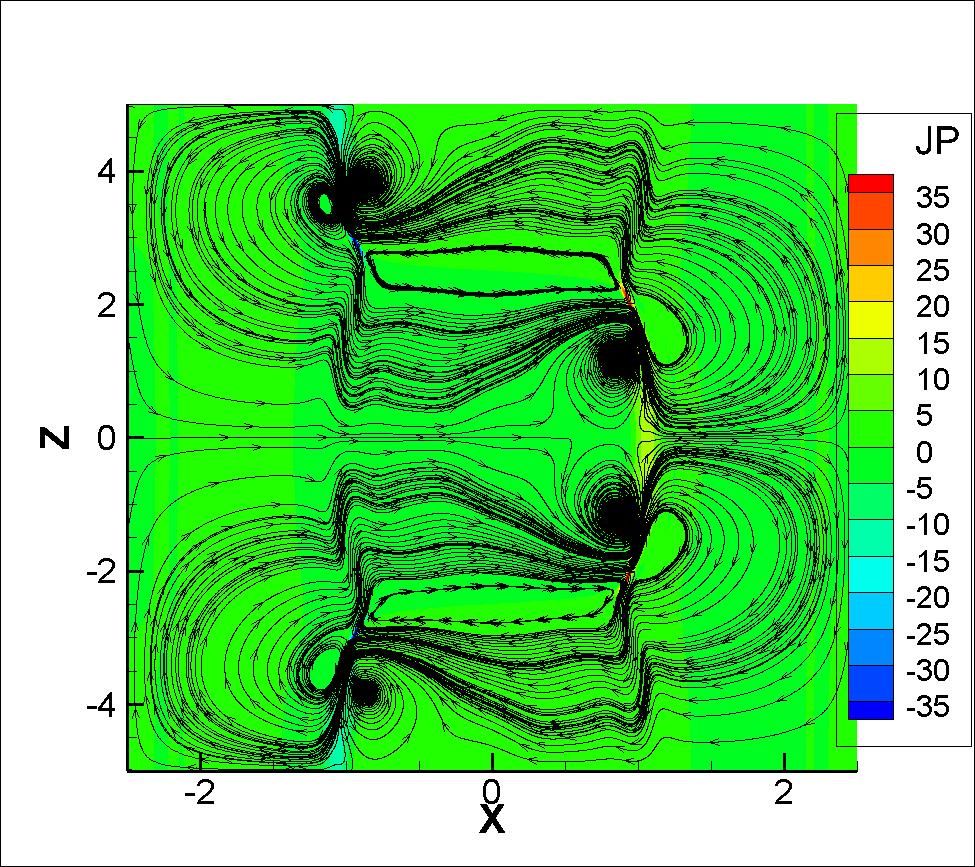
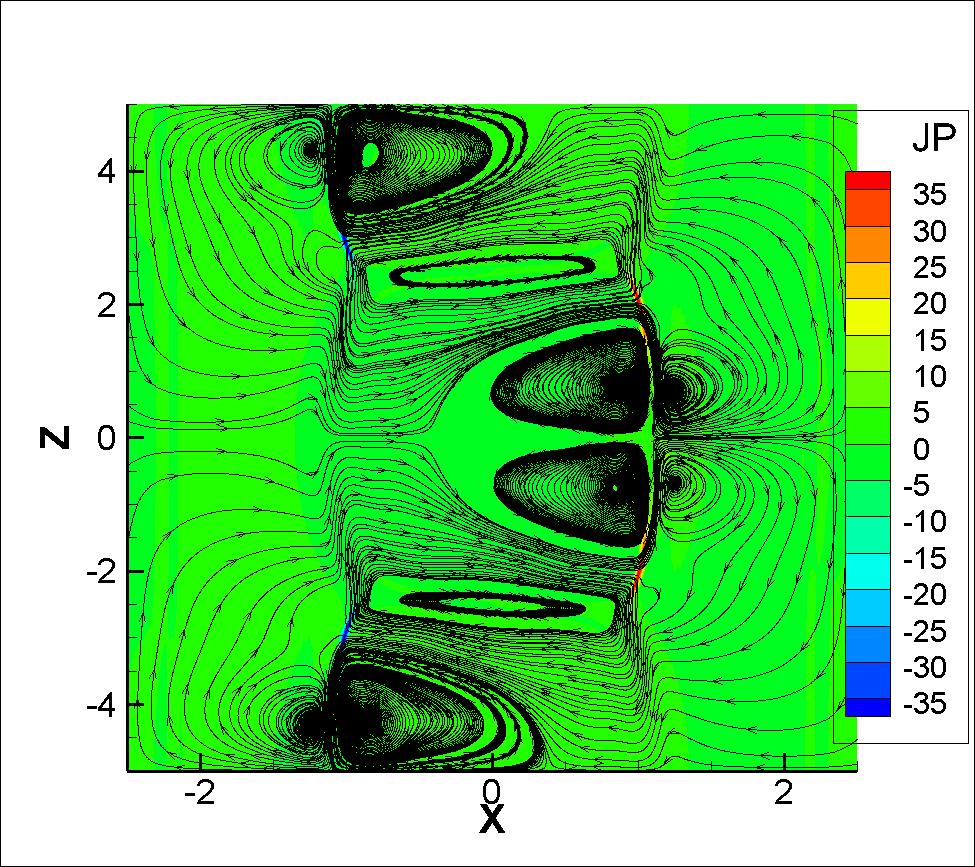
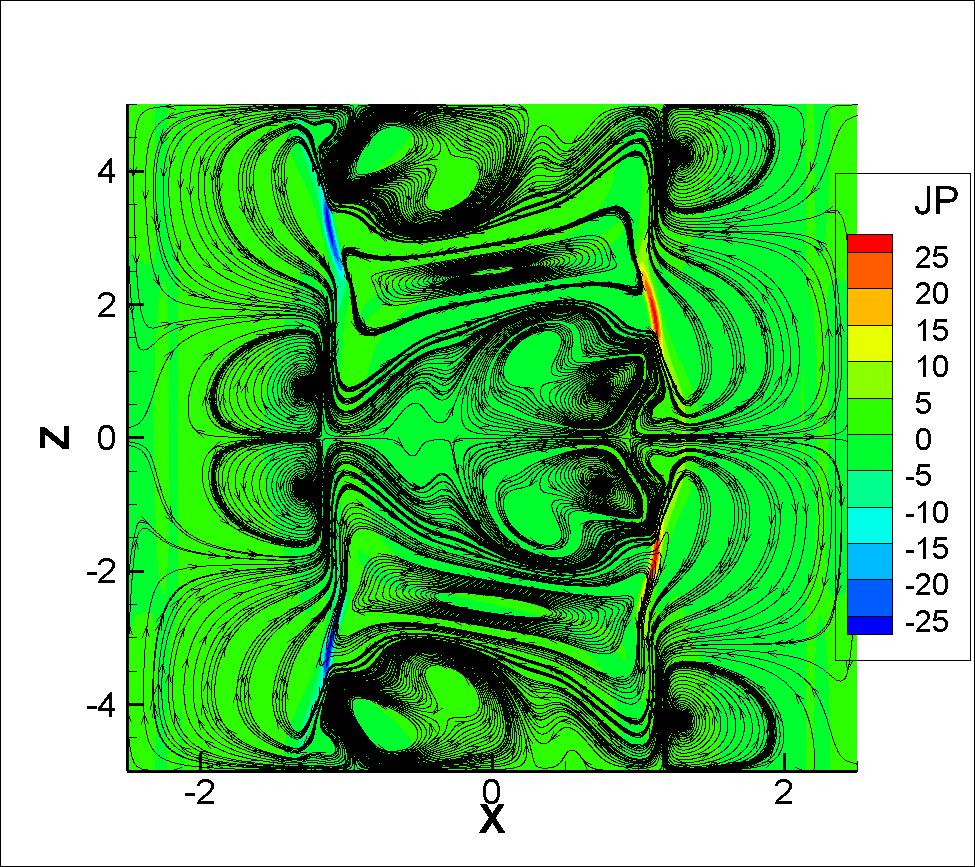
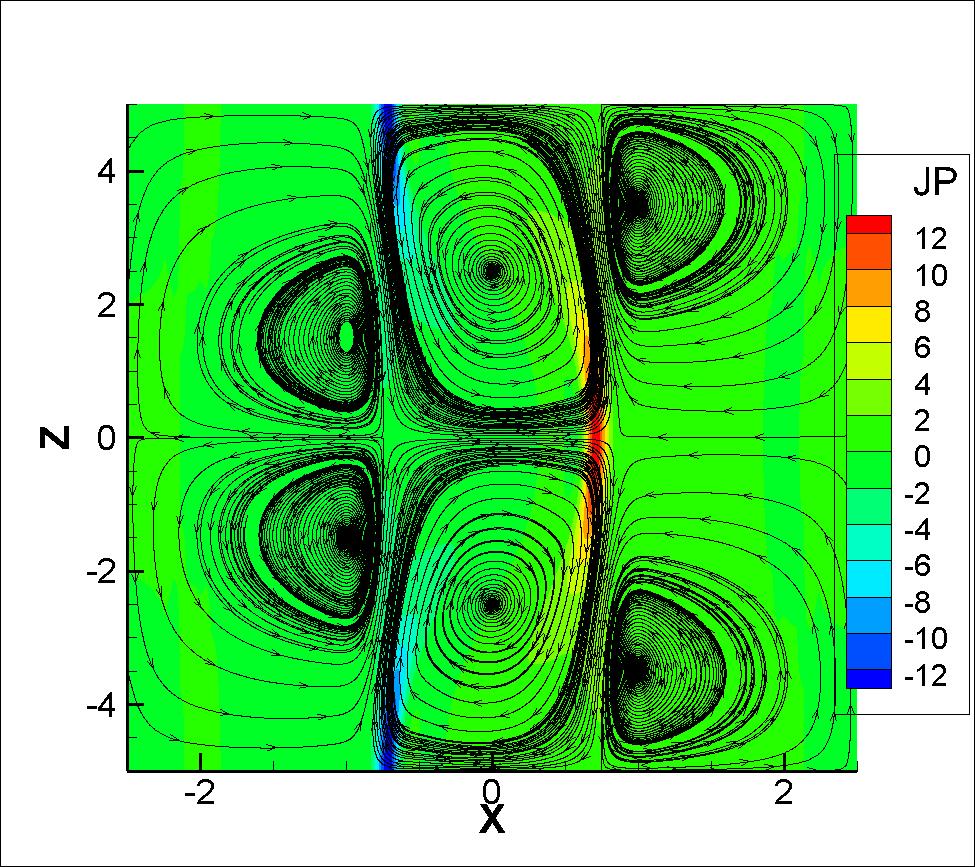
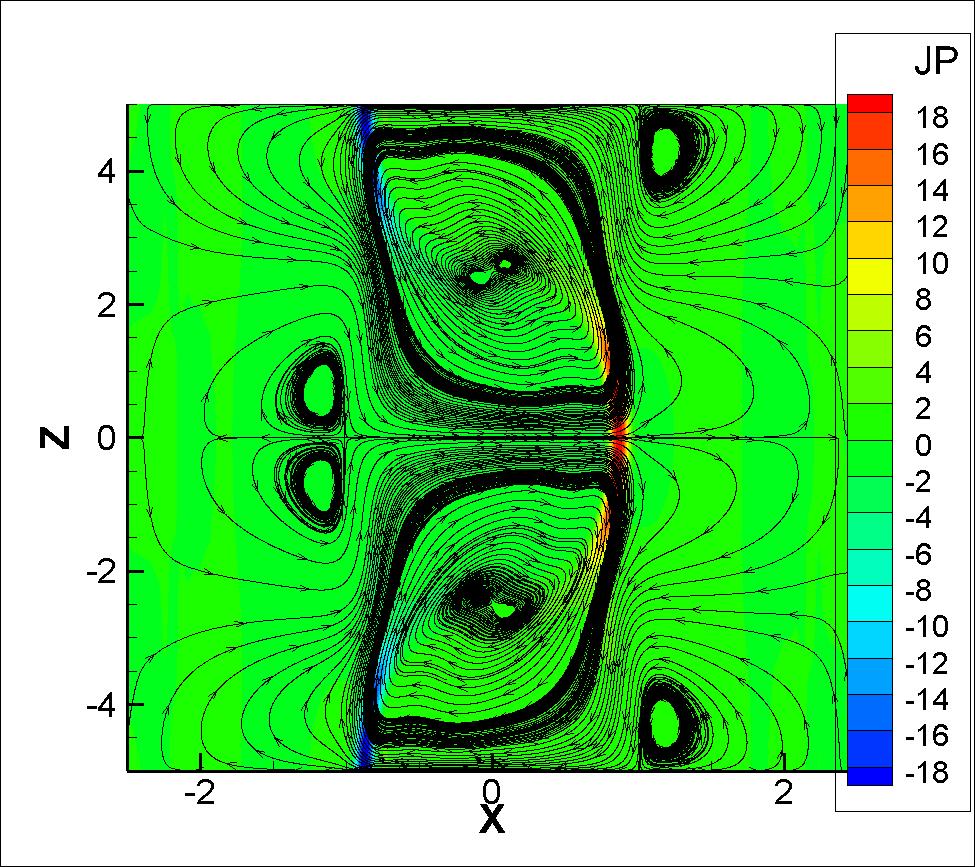
The reconnection rate and plasmoids generation in DTM is different as compared to the STM due to the different mechanisms involved. Comparison between and shows that the reconnection current sheet is much thinner and longer for [Fig. 7(a)]. Such a large aspect ratio current sheet is unstable to plasmoid creating tearing modes so that a monster plasmoid produces and grows in size in the middle of the current sheet [Fig. 7(b)]. The monster plasmoid constitutes a secondary instability that divides the primary current ribbon into two adjacent ones on either side of it. As the primary DTM island generated from the left current layer keeps moving, the pairs of subsidiary current sheets are squeezed greatly to become so thin that they also become unstable, each generating plasmoids, as shown in Fig. 7(c). During their growth, as shown in Fig. 7, all plasmoids in each current sheet coalesce with each other to form a monster plasmoid at the center of the current sheet [Fig. 7(d)]. This monster plasmoid becomes large enough and moves left, however it can curve and push the primary DTM island significantly. Hence it is inferred that such a secondary tearing instability on the DTM reconnection current ribbon leads to the fast growth of kinetic energy during t = 85 to 100 (Fig. 6).
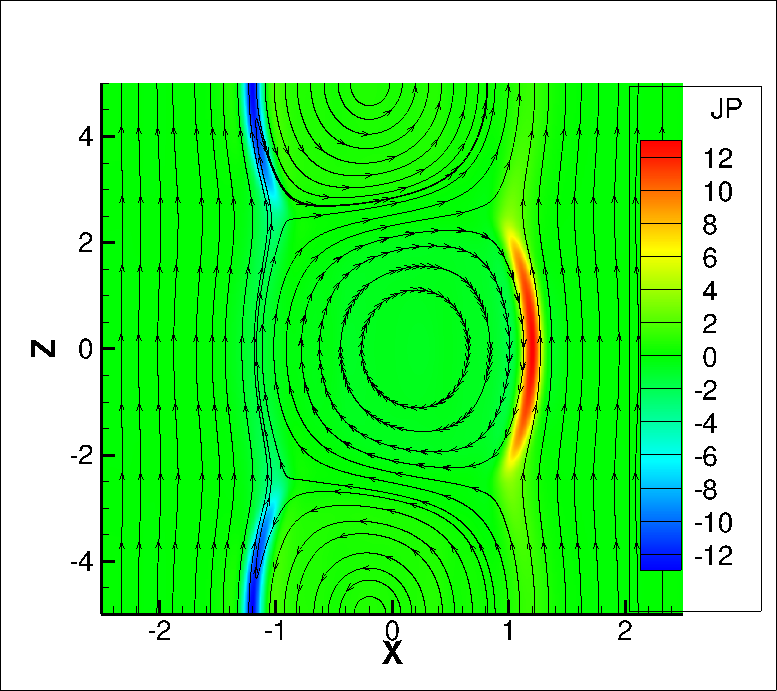
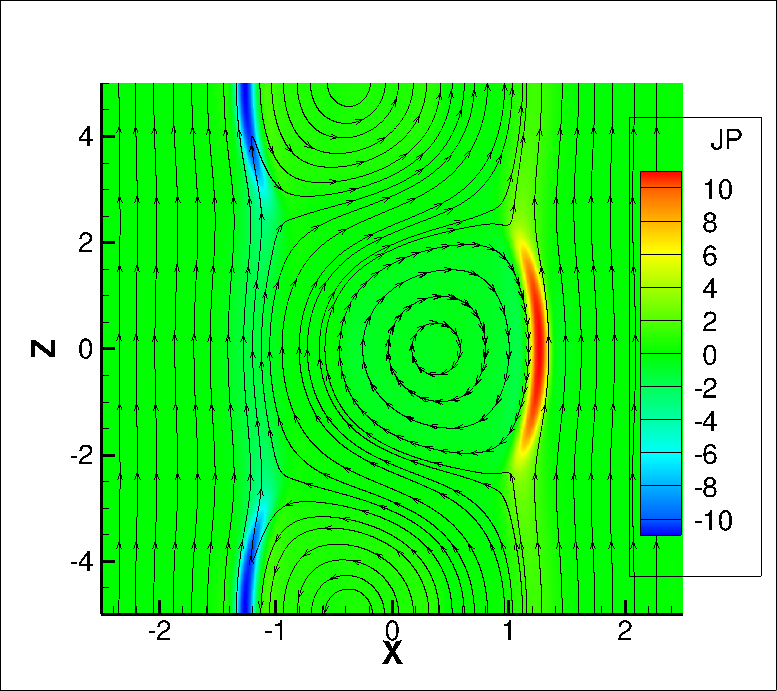
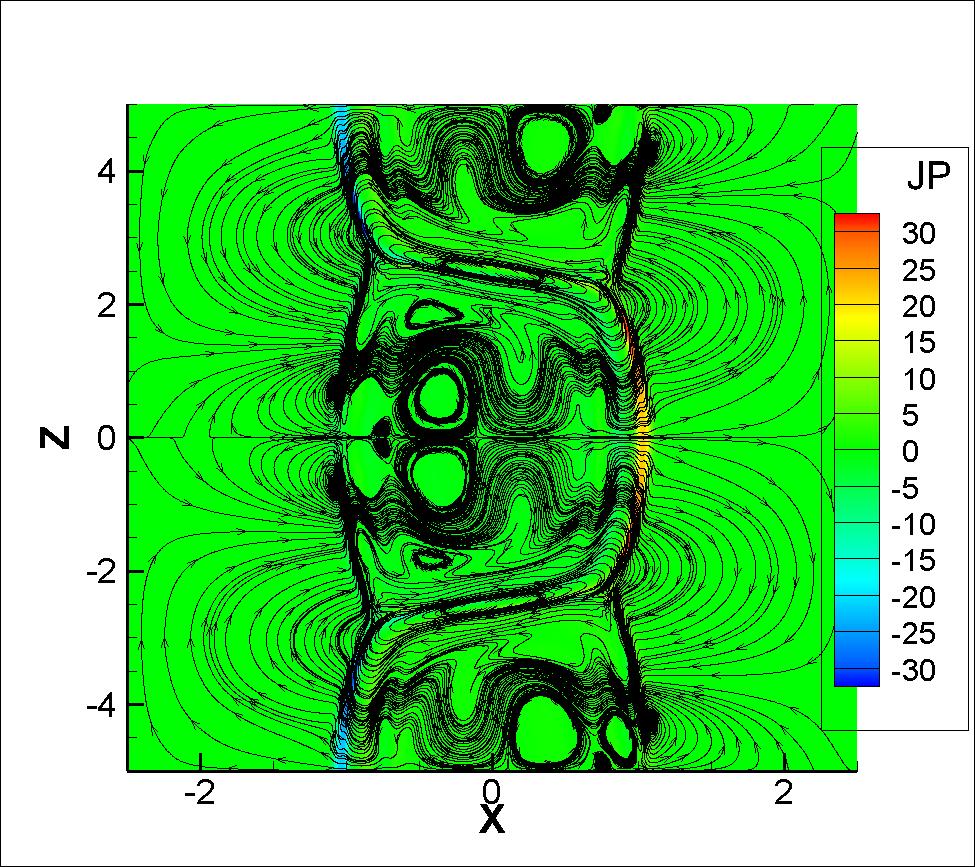
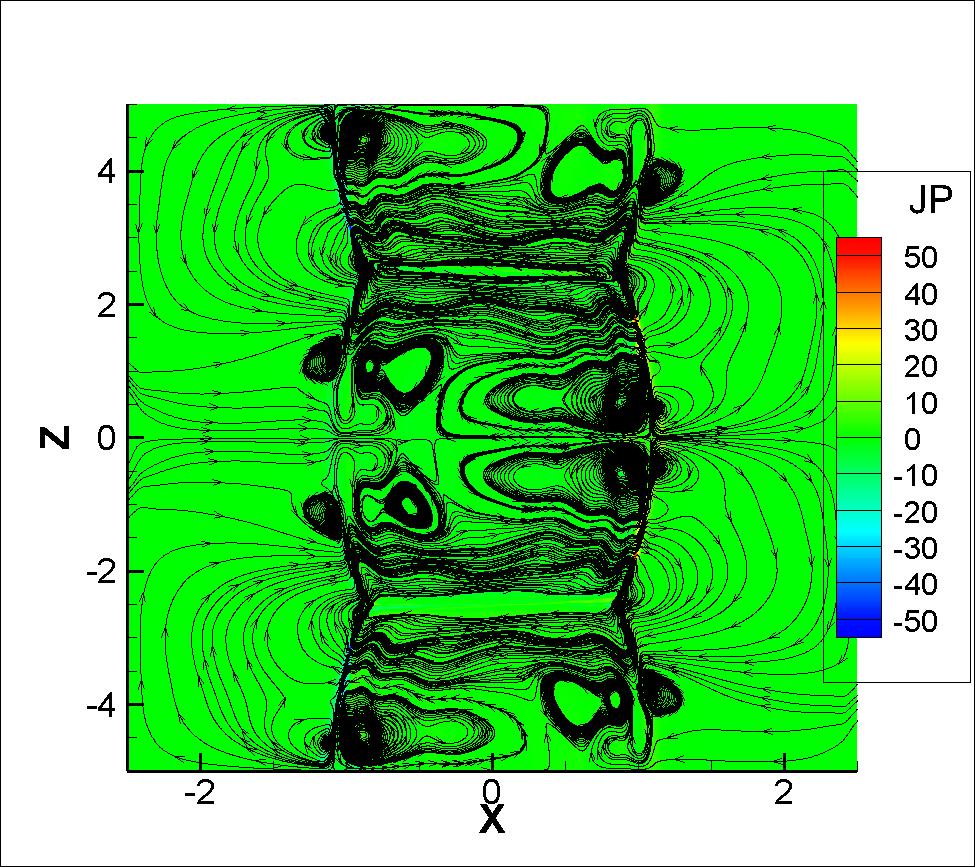
But as we increase the Prandtl number further, the possibility for the production of normal plasmoids decreases quickly because of the wider secondary current sheet. Figs. 8 and 9 show the 2D contours of current density and 2D magnetic field lines for the and the cases respectively. Due to magnetic reconnection, a thin and curving current sheet forms in the island [Figs. 8(a) and 9(a)]. In these cases we only observe the monster plasmoid, and the production of normal plasmoids was not found in these cases. Figs. 8 and 9 show that as the monster plasmoid becomes large enough and moves in the middle, it can curve and push the primary DTM island significantly. This current sheet finally disappears and the islands positions exchange as shown in Figs. 7(d), 8(d) and 9(d). It is also observed from Fig. 10 that for i.e. case there is no monster plasmoid formation (Fig. 10). This process shows the dissipation and damping nature of large viscosity. Finally the reconnection finishes and we get the straight field lines after the exhaustion of initial flux.
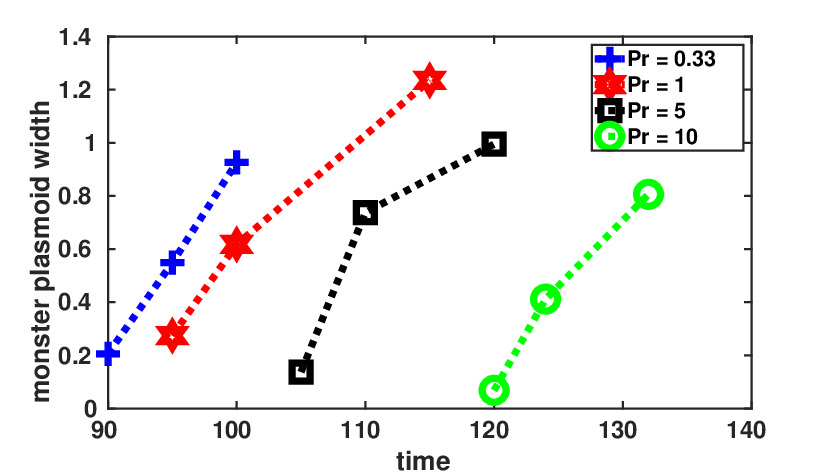
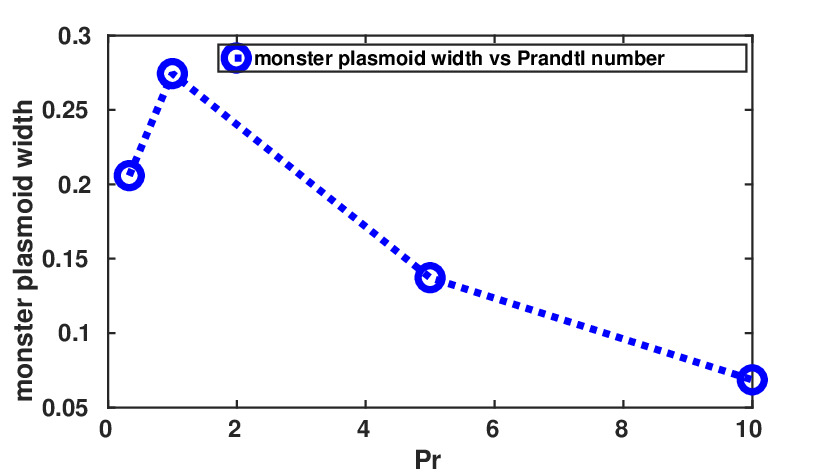
Fig. 11 shows the evolution of monster plasmoid for different cases and also summarizes the relationships among monster plasmoid width and numbers. At lower , as we increase the viscosity, the width of monster plasmoid increases sharply up to . The number also separates two regimes for the monster plasmoid width. In the regime, the width of plasmoid increases drastically with viscosity, whereas in the regime, the width of monster plasmoid decreases sharply with the viscosity. This behaviour of plasmoid dynamics with viscosity is interestingly matching with the linear and nonlinear reconnection dependence on viscosity in STM ali2014abrupt .
IV.3 Flow pattern and vortices
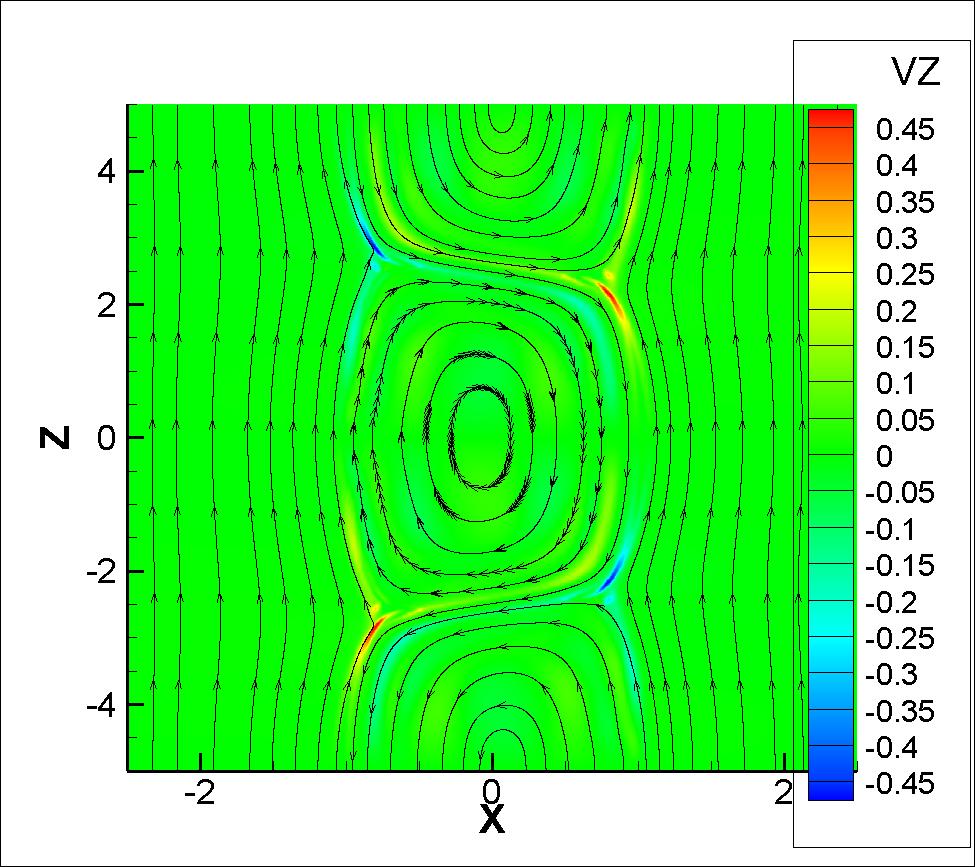
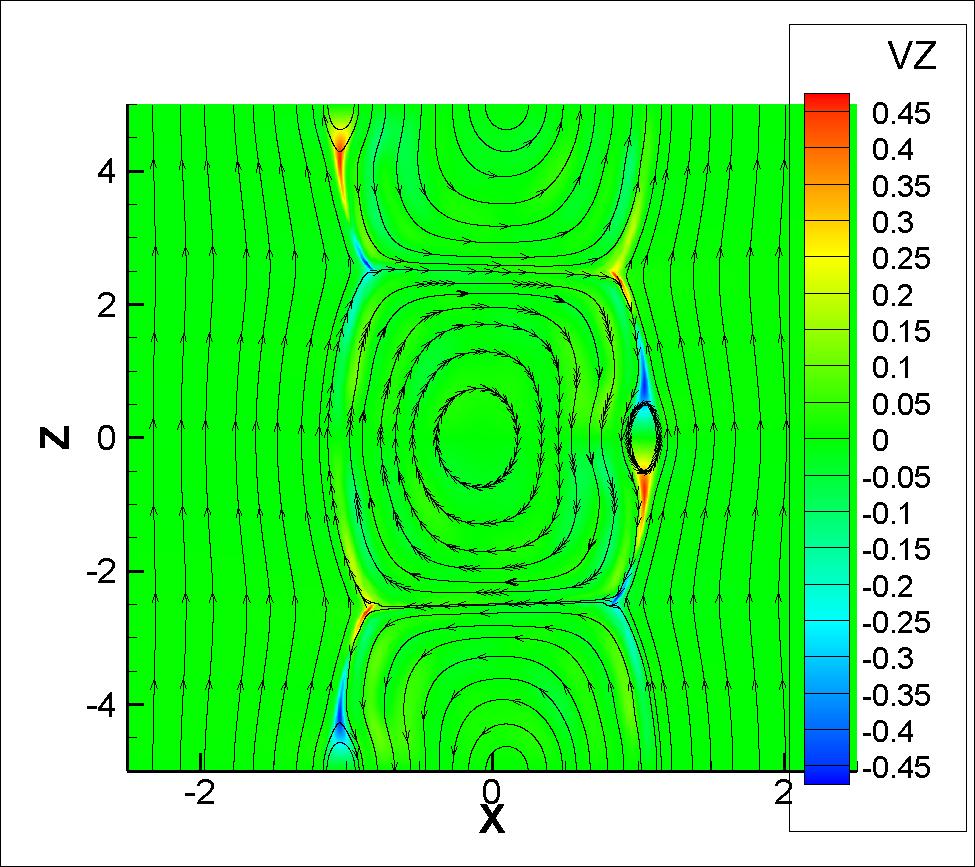
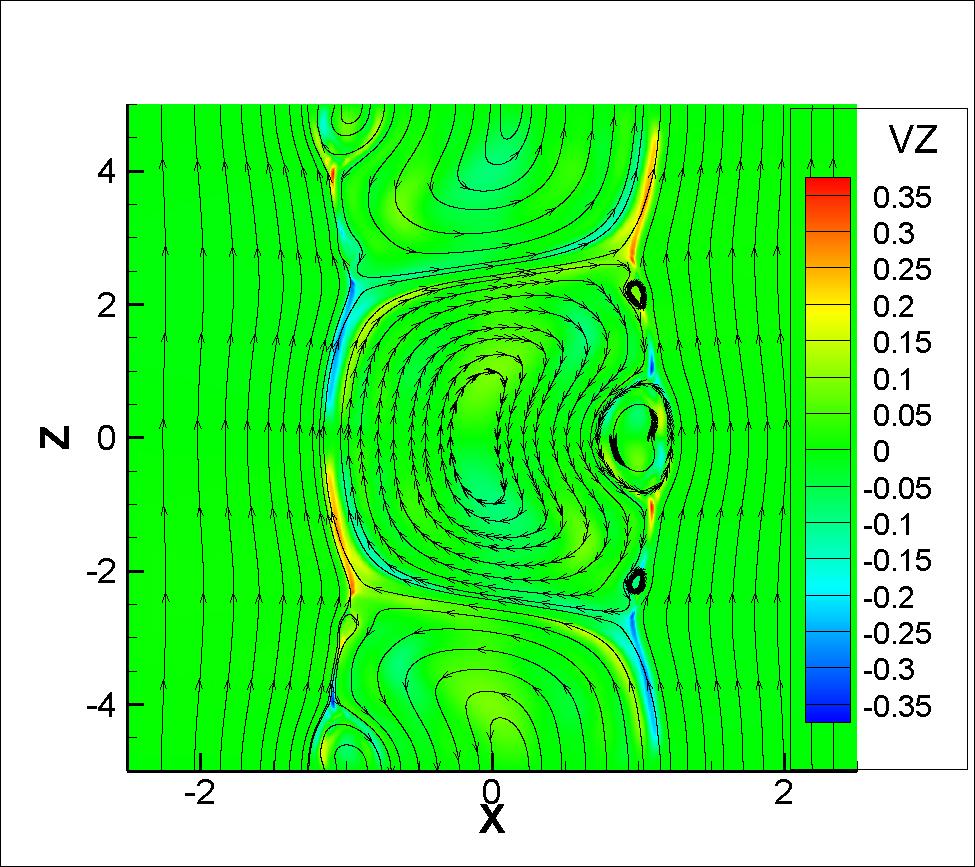
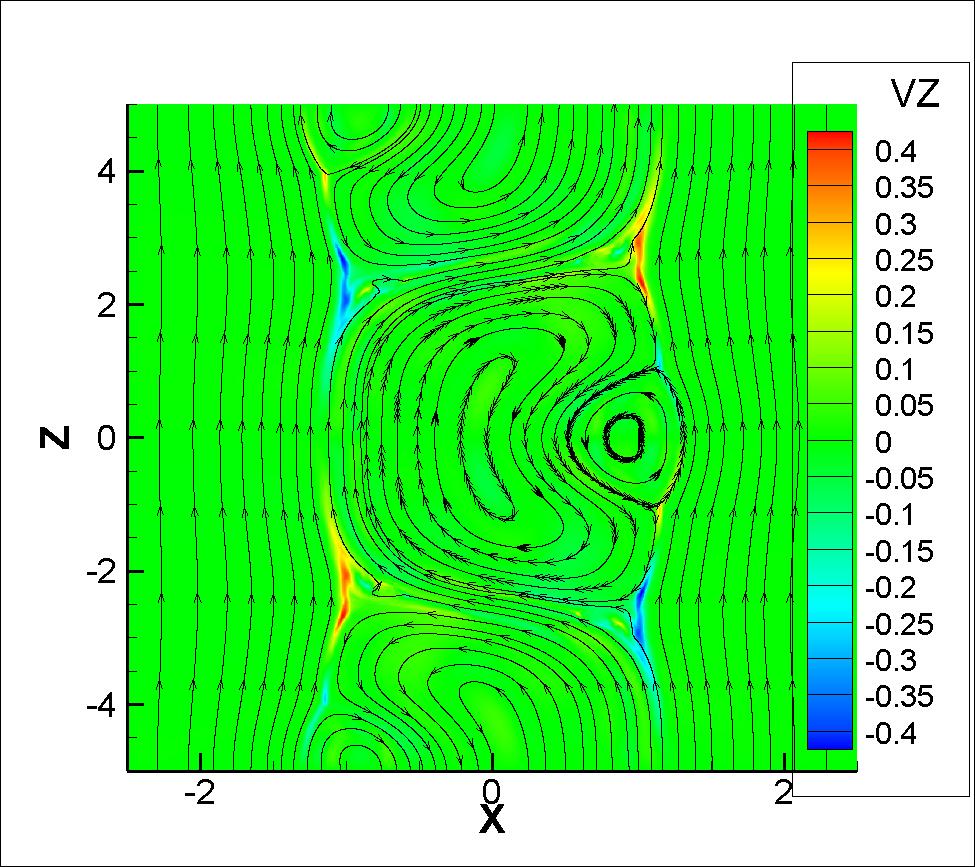
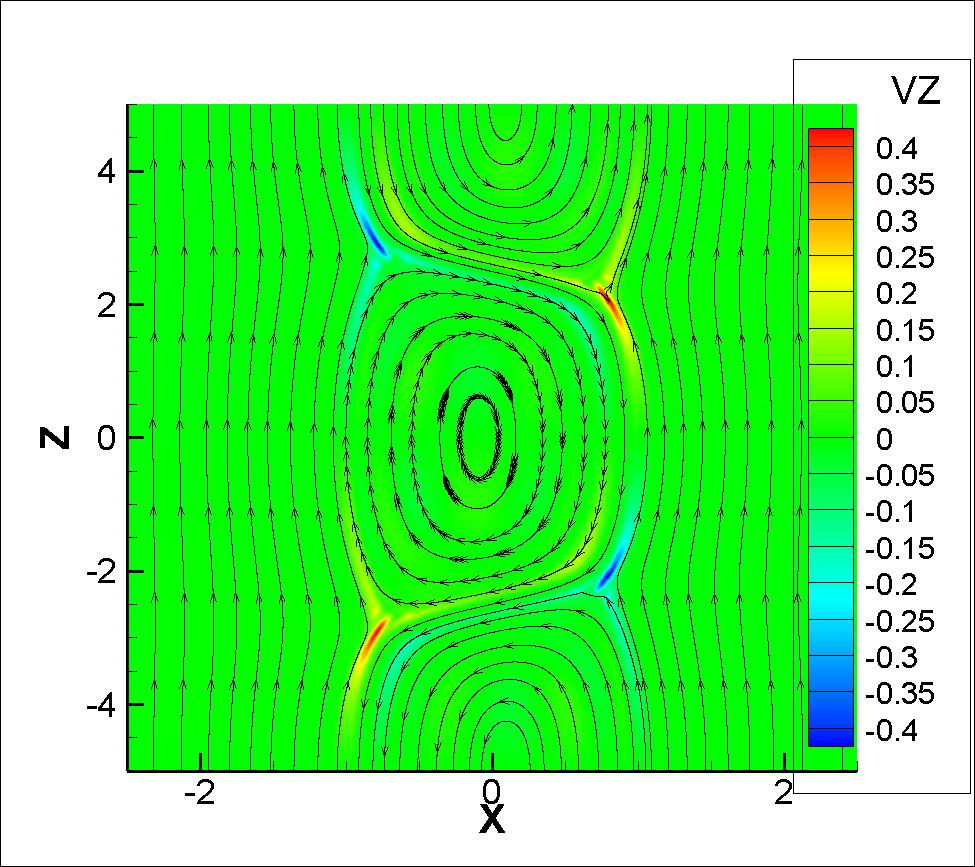
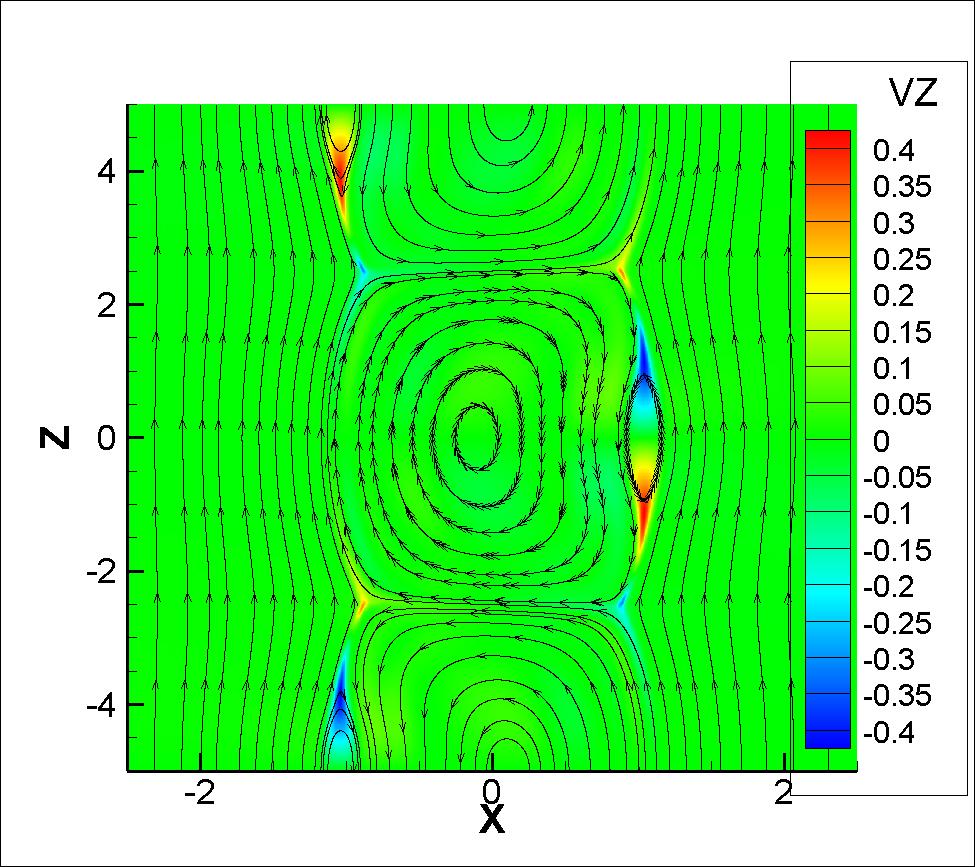
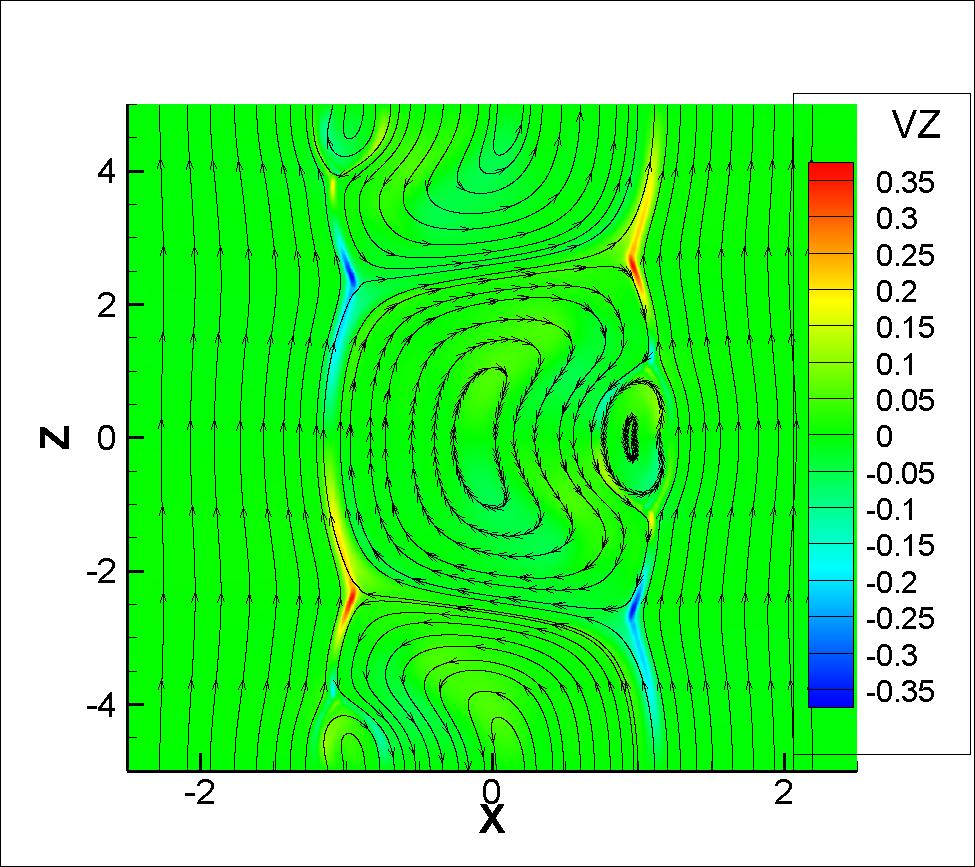
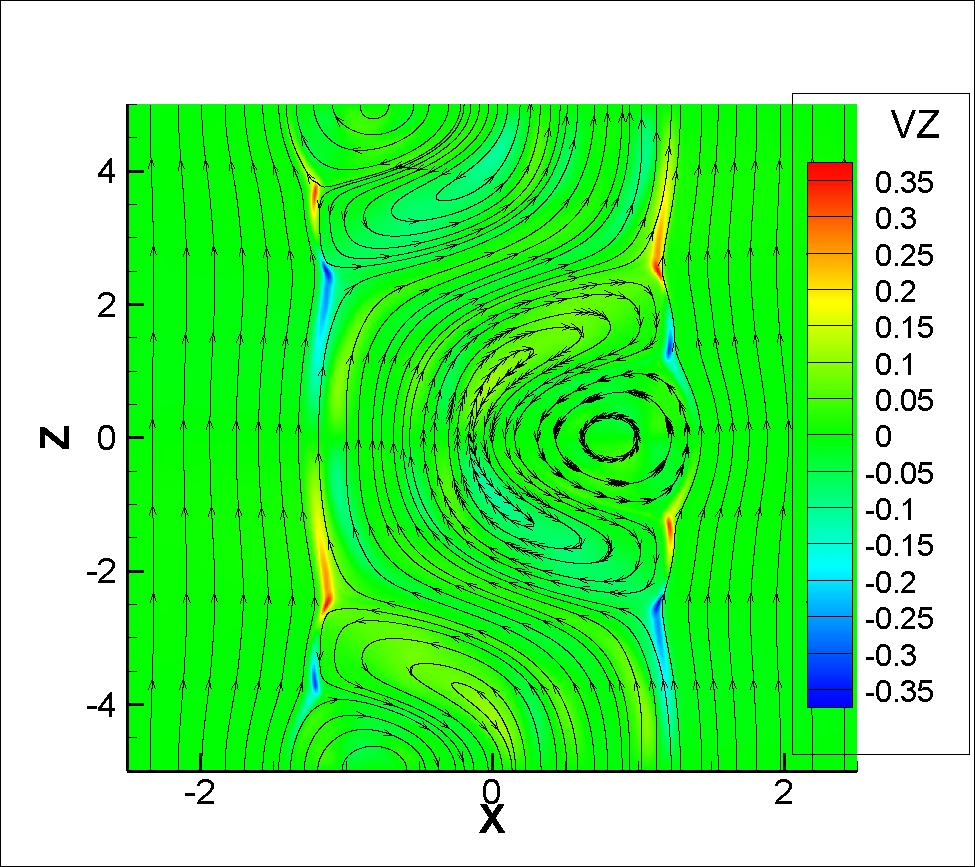
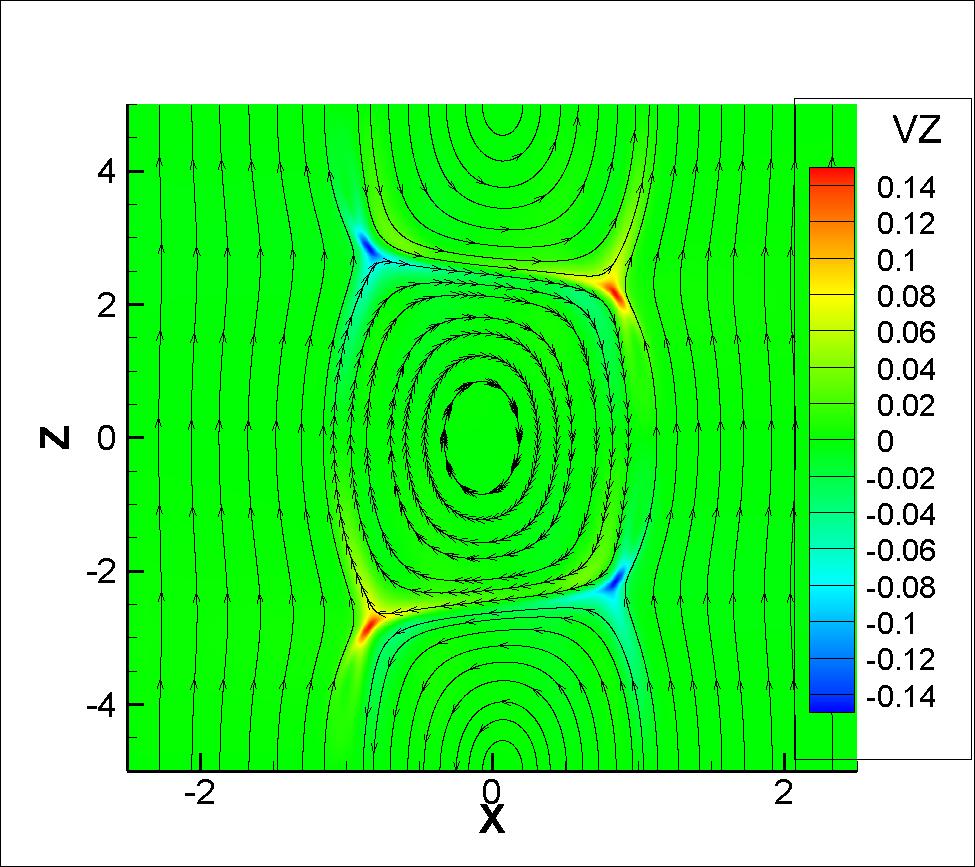
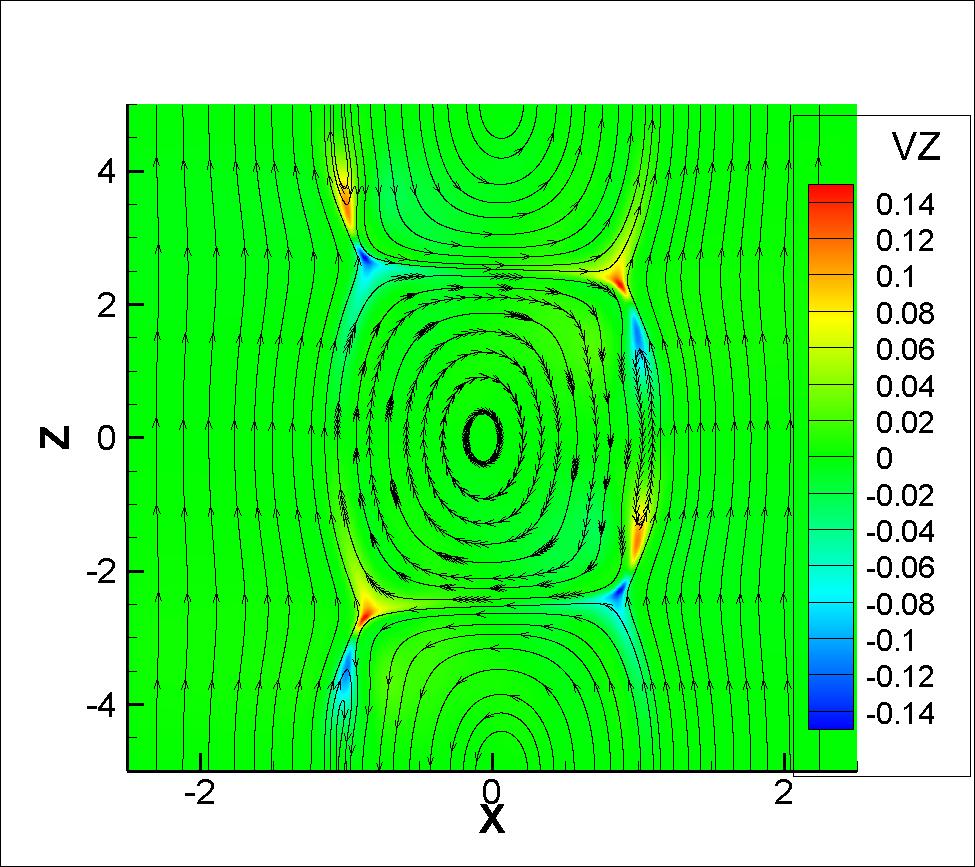
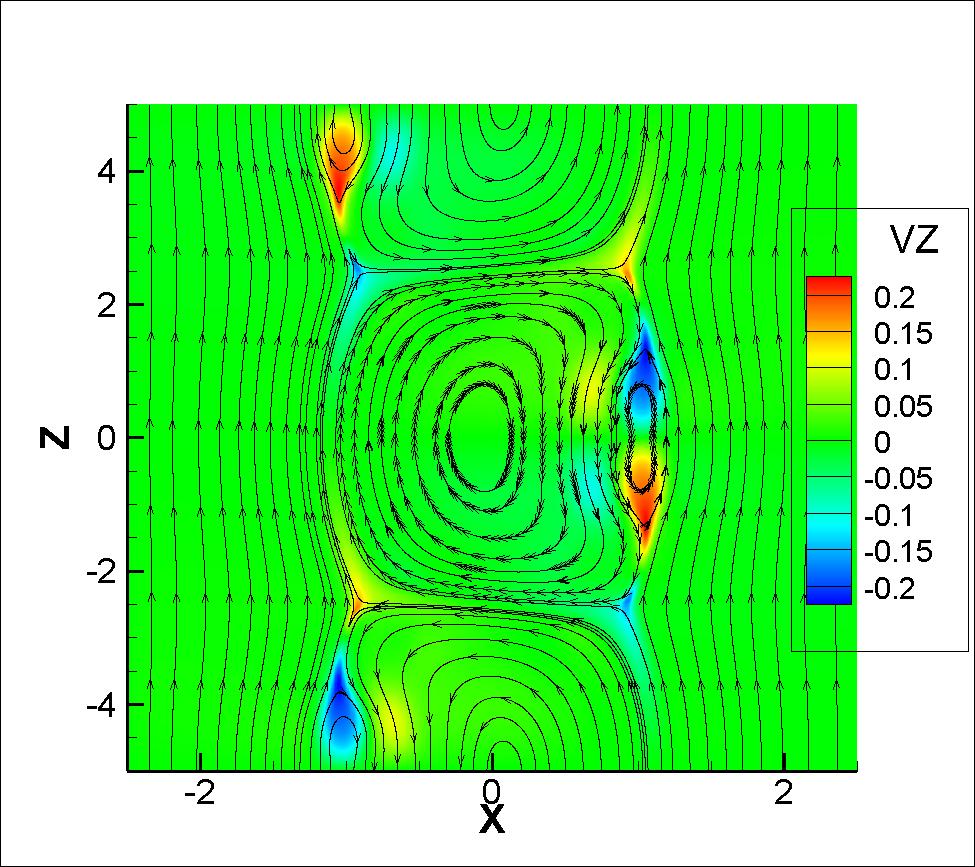
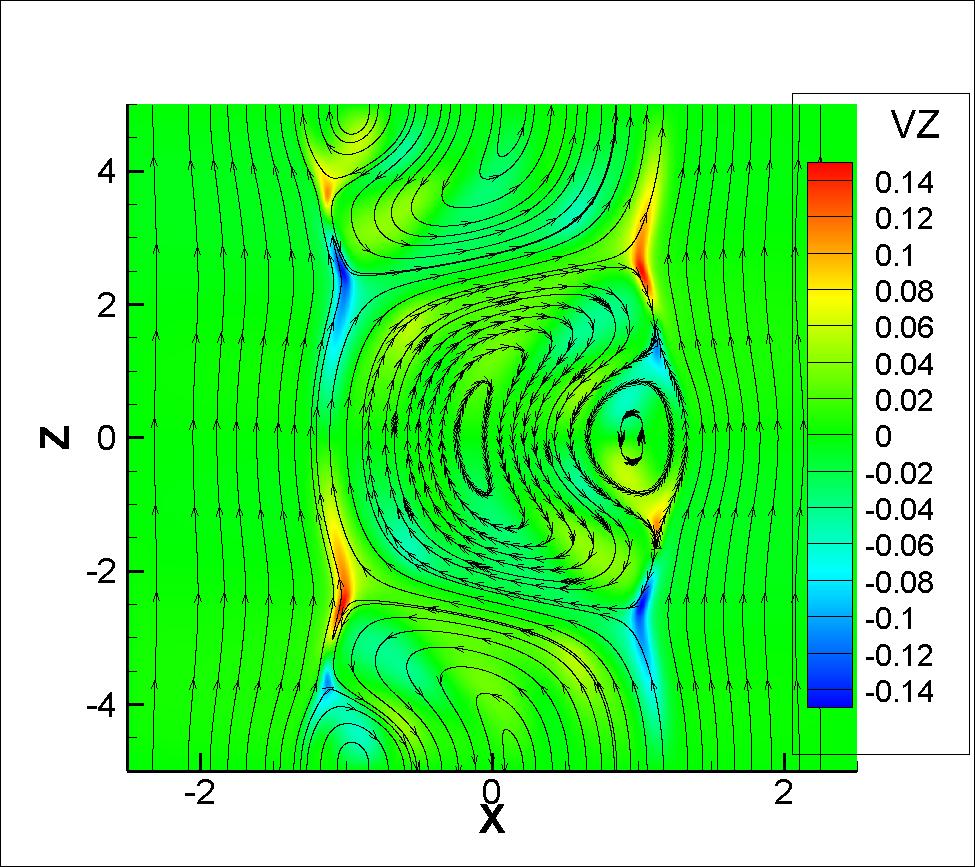
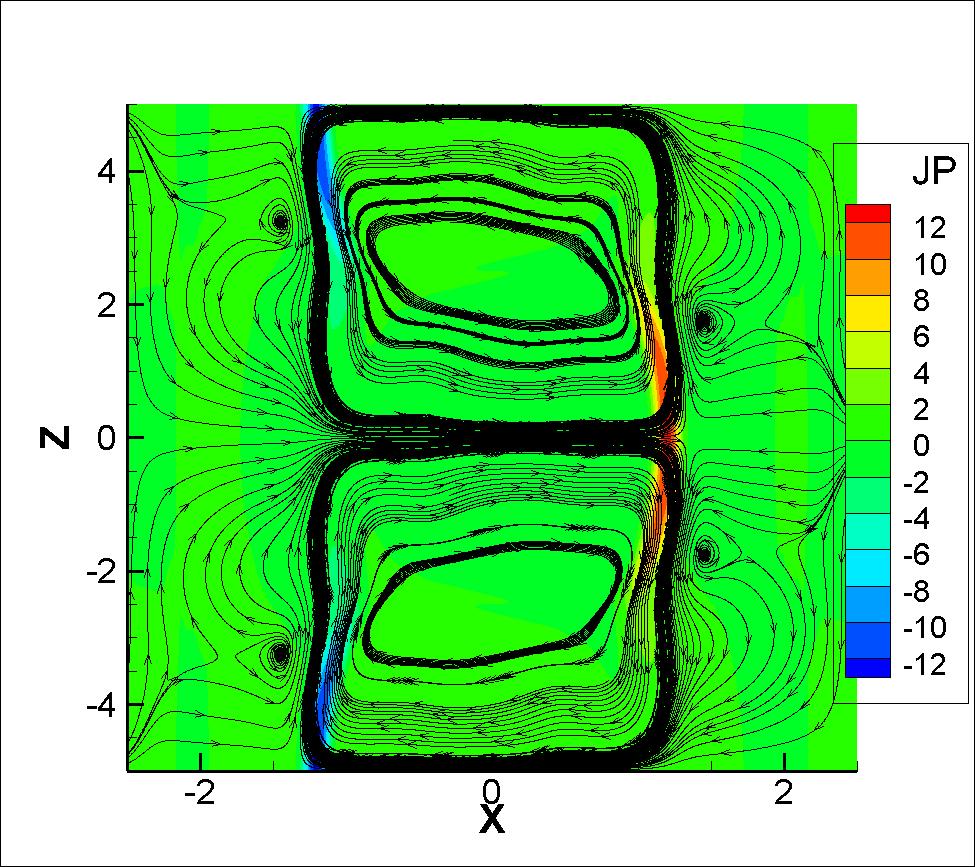
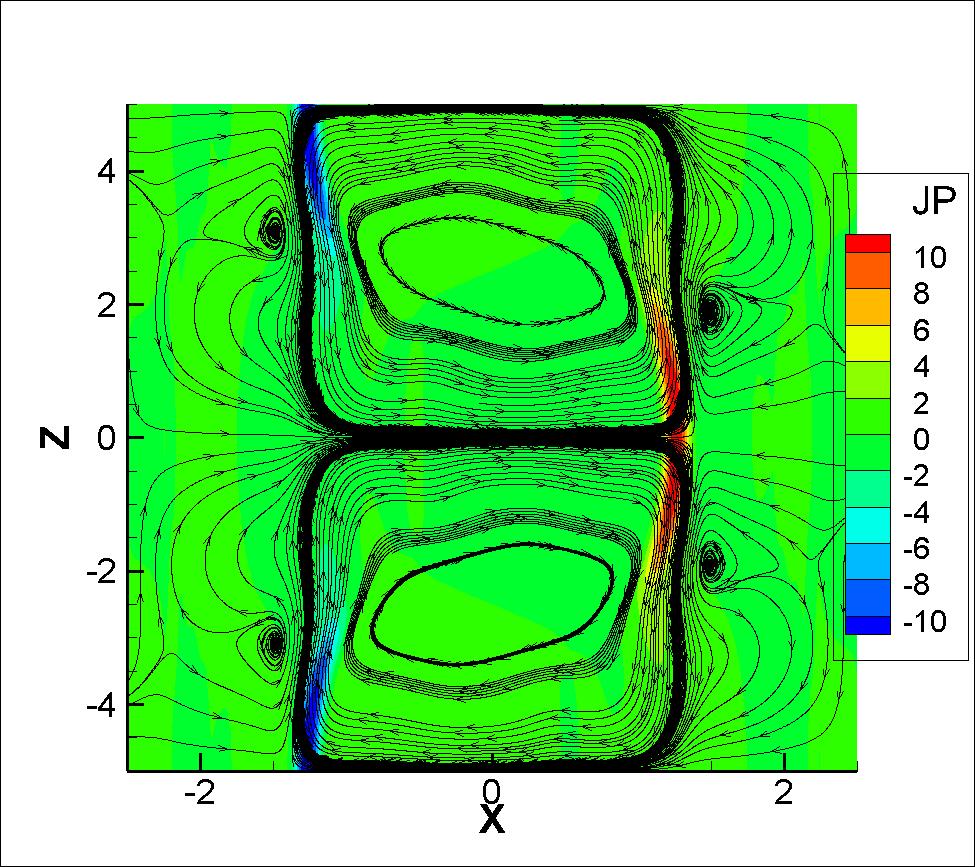
The flow pattern and vortex structure developed around the magnetic islands and plasmoids show unique features of DTM. The viscous effects on the flow pattern associated with the DTM and the corresponding plasmoid formation are also significant (Figs. 12-15).
In the early stages before the current sheet formation, the magnetic island width are so small that the plasma flows are limited inside of the separated islands. As the island width grows to a certain size, the plasma flows in the islands at the both current sheets merge together to form global vortices [Fig. 12(a)]. After the collapse of current sheet, thin and intensive shear flow layers form and are localized around the plasmoid on each resonant surface. The vortex structures and thin poloidal shear flow layers remain long after the merging of magnetic separatrices [Figs. 12(d) and 12(h)]. As we increase the viscosity up to 0.00028 (), the vortices formation becomes slower and larger in size. At larger viscosity, the reconnection and the production of intensive thin poloidal shear flow layers are more inhibited. This fact may contribute as a mechanism to the oscillating decay of kinetic energy at a considerably faster pace when and than when and .
V Summary
In this paper, we study the viscous effects on the dynamics of the DTM induced plasmoid formation using MHD simulations. The monster plasmoid first appears in the middle of the DTM current sheet when the kinetic energy reaches its first peak. Then, normal plasmoids appear for a small value of the , making the kinetic energy abruptly increase to a higher level. A transition is observed at for the generation of normal plasmoids, which is similar to the STM case. By increasing the distance between the rational surfaces or by decreasing the Prandtl number, the production of normal plasmoids increases or vice versa. Up to a certain critical value of , the production of monster plasmoid also halts. The overall magnetic and flow structures of DTM as well as the induced formation of plasmoids, are rather different from the STM case. At higher value, the DTM growth becomes slower, and the scales of the magnetic island, the plasmoid, and the flow vortices tend to be larger and more global. In future we plan on identifying the critical value of the quantitatively at which the generation of monster plasmoid becomes halted. Also we intend to explore the two-fluid and the 3D effects beyond this work next.
Acknowledgement
This research was supported by the National Magnetic Confinement Fusion Science Program of China (No.2019YFE03050004), National Natural Science Foundation of China (Grants Nos. 42130202, 41874190 and 51821005), U.S.DOE (Nos.DE-FG02-86ER53218 and DESC0018001), and the Fundamental Research Funds for the Central Universities at Huazhong University of Science and Technology (No.2019kfyXJJS193). We are grateful for the support from NIMROD team. This research used the computing resources from the Supercomputing Center of University of Science and Technology of China. The author Nisar Ahmad acknowledges the assistance from Dr. Haolong Li.
DATA AVAILABILITY
The supporting data regarding the findings of this study is available from the corresponding author upon reasonable request.
References
- (1) Bierwage A et al 2005 Phys. Plasmas 12 082504
- (2) Wang X-Q et al 2011 Phys. Plasmas 18 012102
- (3) Ishii Y 2009 Nucl. Fusion 49 085006
- (4) Akramov T and Baty H 2017 Phys. Plasmas 24 082116
- (5) Dahlburg R B and Karpen J T 1995 J. Geophys. Res. 100 23489
- (6) Crooker N U et al 1993 J. Geophys. Res. 98 9371
- (7) Mikic Z et al 1988 Astrophys. J. 328 830
- (8) Schwartz S J et al 1988 J. Geophys. Res. 93 11295
- (9) Yan M et al 1994 J. Geophys. Res. 99 8657
- (10) Bowers K and Li H 2007 Phys. Rev. Lett. 98 035002
- (11) Baty H 2017 Astrophys. J. 837 74
- (12) Levinton F M et al 1995 Phys. Rev. Lett. 75 4417
- (13) Ishii Y et al 2002 Phys. Rev. Lett. 89 205002
- (14) Wang Z X et al 2007 Phys. Rev. Lett. 99 185004
- (15) Janvier M et al 2011 Phys. Rev. Lett. 107 195001
- (16) Priest E R 1985 Rep. on Progress in Phy. 48 955
- (17) Chang Z et al 1996 Phys. Rev. Lett. 77 3553
- (18) Ishii Y et al 2003 Nucl. Fusion 43 539
- (19) Wang Z X et al 2008 Phys. Plasmas 15 082109
- (20) Pritchett P L et al 1980 Phys. Fluids 23 1368
- (21) Yu Q 1996 Phys. Plasmas 3 2898
- (22) Persson M and Dewar R L 1994 Phys. Plasmas 1 1256
- (23) Furth H P et al 1973 Phys. Fluids 16 1054
- (24) Dong J Q et al 2003 Phys. Plasmas 10 3151
- (25) Held E D et al 1999 Phys. Plasmas 6 837
- (26) Ma J et al 2017 Nucl. Fusion 57 126004
- (27) Zhang C L and Ma Z W 2011 Phys. Plasmas 18 052303
- (28) Nemati M J et al 2018 Phys. Plasmas 25 072119
- (29) Shen C et al 1998 Phys. Lett. A 249 87
- (30) Shen C and Li Z X 1998 Plasma Phys. Control. Fusion 40 1
- (31) Nemati M J et al 2016 Astrophys. J. 821 128
- (32) Nemati M J et al 2017 Astrophys. J. 835 191
- (33) Guo W et al 2017 Phys. Plasmas 24 032115
- (34) Konovalov S V et al 2002 Phys. Plasmas 9 4596
- (35) Kaw P K et al 1979 Phys. Rev. Lett. 43 1398
- (36) Ahmad N et al 2022 Plasma Sci. Technol. 24 015103
- (37) Ali A et al 2015 Phys. Plasmas 22 042102
- (38) Ali A and Zhu P 2019 Phys. Plasmas 26 052518
- (39) Aydemir A Y 1990 Phys. Fluids B 2 2135
- (40) Sovinec R C et al 2004 J. Comput. Phys. 195, 355.
- (41) He Z et al 2015 Phys. Scr. 90, 125603.
- (42) Mao A et al 2021 Plasma Sci. Technol. 23, 035103.
- (43) Coppi B et al 1976 Sov. J. Plasma Phys. 2 533
- (44) Wei L et al 2012 J. Plasma Phys. 78 663
- (45) Ofman L 1992 Phys. Fluids B 4 2751
- (46) Ali A et al 2014 Phys. Plasmas 21 052312


