Toward Expanding the Scope of Radiology Report Summarization to Multiple Anatomies and Modalities
Abstract
Radiology report summarization (RRS) is a growing area of research. Given the Findings section of a radiology report, the goal is to generate a summary (called an Impression section) that highlights the key observations and conclusions of the radiology study. However, RRS currently faces essential limitations. First, many prior studies conduct experiments on private datasets, preventing the reproduction of results and fair comparisons across different systems and solutions. Second, most prior approaches are evaluated solely on chest X-rays. To address these limitations, we propose a dataset (MIMIC-RRS) involving three new modalities and seven new anatomies based on the MIMIC-III and MIMIC-CXR datasets. We then conduct extensive experiments to evaluate the performance of models both within and across modality-anatomy pairs in MIMIC-RRS. In addition, we evaluate their clinical efficacy via RadGraph, a factual correctness metric.
1 Introduction
A radiology report is a document that provides information about the results of a radiology study. It usually includes a Findings section with key observations from the study and an Impression section with the radiologist’s overall conclusions. The latter is the most critical part of the report and is typically based on both the findings and the patient’s condition. It can be helpful to automate the process of generating the impression section because it can be time-consuming and prone to errors when done manually Bhargavan et al. (2009); Alexander et al. (2022). Recently, substantial progress has been made towards research on automated radiology report summarization (RRS) (Zhang et al., 2020; Ben Abacha et al., 2021; Hu et al., 2022).
However, the field of RRS faces several key limitations. First, the experimental results of many prior studies Zhang et al. (2018, 2020) are reported on private datasets, making it difficult to replicate results or compare approaches. Second, existing studies are mainly limited to a single modality (i.e., X-ray) and a single anatomy (i.e., chest) Zhang et al. (2020); Ben Abacha et al. (2021); Hu et al. (2021). In some cases, researchers omit to disclose the modality and anatomy of the radiology reports used for their experiments (Karn et al., 2022). Finally, recent models (Karn et al., 2022; Hu et al., 2022) present an increased complexity in architecture that offers only marginal improvements on the existing evaluation metrics for summarization. This further makes the replication of studies more difficult.
To address the aforementioned limitations, we construct a brand-new open-source dataset (named MIMIC-RRS) for radiology report summarization involving three modalities (X-ray, MRI, and CT) and seven anatomies (chest, head, neck, sinus, spine, abdomen, and pelvis). MIMIC-RRS is based on the MIMIC-CXR Johnson et al. (2019) and MIMIC-III (Johnson et al., 2016) datasets and introduces data from 12 new modality-anatomy pairs. As a result, we introduce a new setting for evaluating the generalization capabilities of RRS models across different modalities and anatomies.
In addition, we benchmark various pre-trained language models on MIMIC-RRS. Through extensive experiments within and across modality-anatomy pairs, we show that adopting an appropriate pre-trained model can achieve promising results comparable to previous studies. We also introduce a metric to evaluate factual correctness of generated summaries for any modality-anatomy pair.
2 Dataset Construction
In this section, we present the new MIMIC-RRS dataset designed for radiology report summarization across multiple modalities and anatomies. Comparisons with existing datasets are shown in Table 1. We detail the collection process and the dataset statistics in the following subsections.
| Dataset | Anatomy | Modality | Language | Number |
|---|---|---|---|---|
| Zhang et al. (2018) | Multiple | Multiple | English | 87,127 |
| Zhang et al. (2020) | Multiple | Multiple | English | 130,850 |
| RIH Zhang et al. (2020) | Multiple | Multiple | English | 139,654 |
| OpenI Demner-Fushman et al. (2016) | Chest | X-ray | English | 3,268 |
| MIMIC-CXR Johnson et al. (2019) | Chest | X-ray | English | 128,003 |
| PadChest Bustos et al. (2020) | Chest | X-ray | Spanish | 206,222 |
| MIMIC-RRS (ours) | Multiple | Multiple | English | 207,782 |
2.1 Data Collection
MIMIC-III
One of our main contributions is to generate RRS data from MIMIC-II involving distinct combinations of modalities (i.e., medical imaging techniques) and anatomies (i.e., body parts). To this end, we first select five of the most frequently-occurring modality-anatomy pairs in the pool of MIMIC-III reports: “CT Head”, “CT Spine”, “CT Chest”, “CT Abdomen-Pelvis” and “MR Head”. Note that we discard chest X-rays as they are included in the MIMIC-CXR dataset. In addition, we pick six modality-anatomy pairs that occur infrequently in MIMIC-III to serve as out-of-domain (OOD) test sets: “CT Neck”, “CT Sinus”, “MR Pelvis”, “MR Neck”, “MR Abdomen”, “MR Spine”. This set of pairs represents two types of OOD cases: (1) the modality has not been seen during training (one could train on CT neck and test on MR Neck), and (2) the anatomy has not been seen during training (for example, CT Sinus is the only “sinus” dataset).
For each report, we extract the findings and impression section. However, the findings section is not always clearly labeled as “findings". With the help of a board-certified radiologist, we identify alternate section headers that reference findings for each modality-anatomy pair. As an example, for CT head, findings may be referenced in reports with the section headings “non-contrast head ct", “ct head", “ct head without contrast", “ct head without iv contrast", “head ct", “head ct without iv contrast", or “cta head". We identify 537 candidate section headers that reference findings across our dataset. We also discarded reports where multiple studies are pooled in the same radiology report, leading to multiple intricate observations in the impression section111We release our candidate section headers as well as code to recreate the dataset from scratch (Appendix B).. Our resulting dataset consists of 79,779 selected reports across 11 modality-anatomy pairs.
MIMIC-CXR
MIMIC-CXR studies are chest X-ray examinations. We follow preprocessing steps reported in previous work Delbrouck et al. (2022b), and we only include reports with both a Findings and an Impression section. This yields 128,003 reports.
2.2 Data statistics
| CT Abd-pelv | CT Chest | CT Head |
| 15,989 | 12,786 | 31,402 |
| CT Spine | MR Head | CT Neck |
| 5,517 | 7,313 | 1,140 |
| CT Sinus | MR Spine | MR Abdomen |
| 1,267 | 2,821 | 1,061 |
| MR Neck | MR Pelvis | X-ray Chest |
| 230 | 253 | 128,003 |
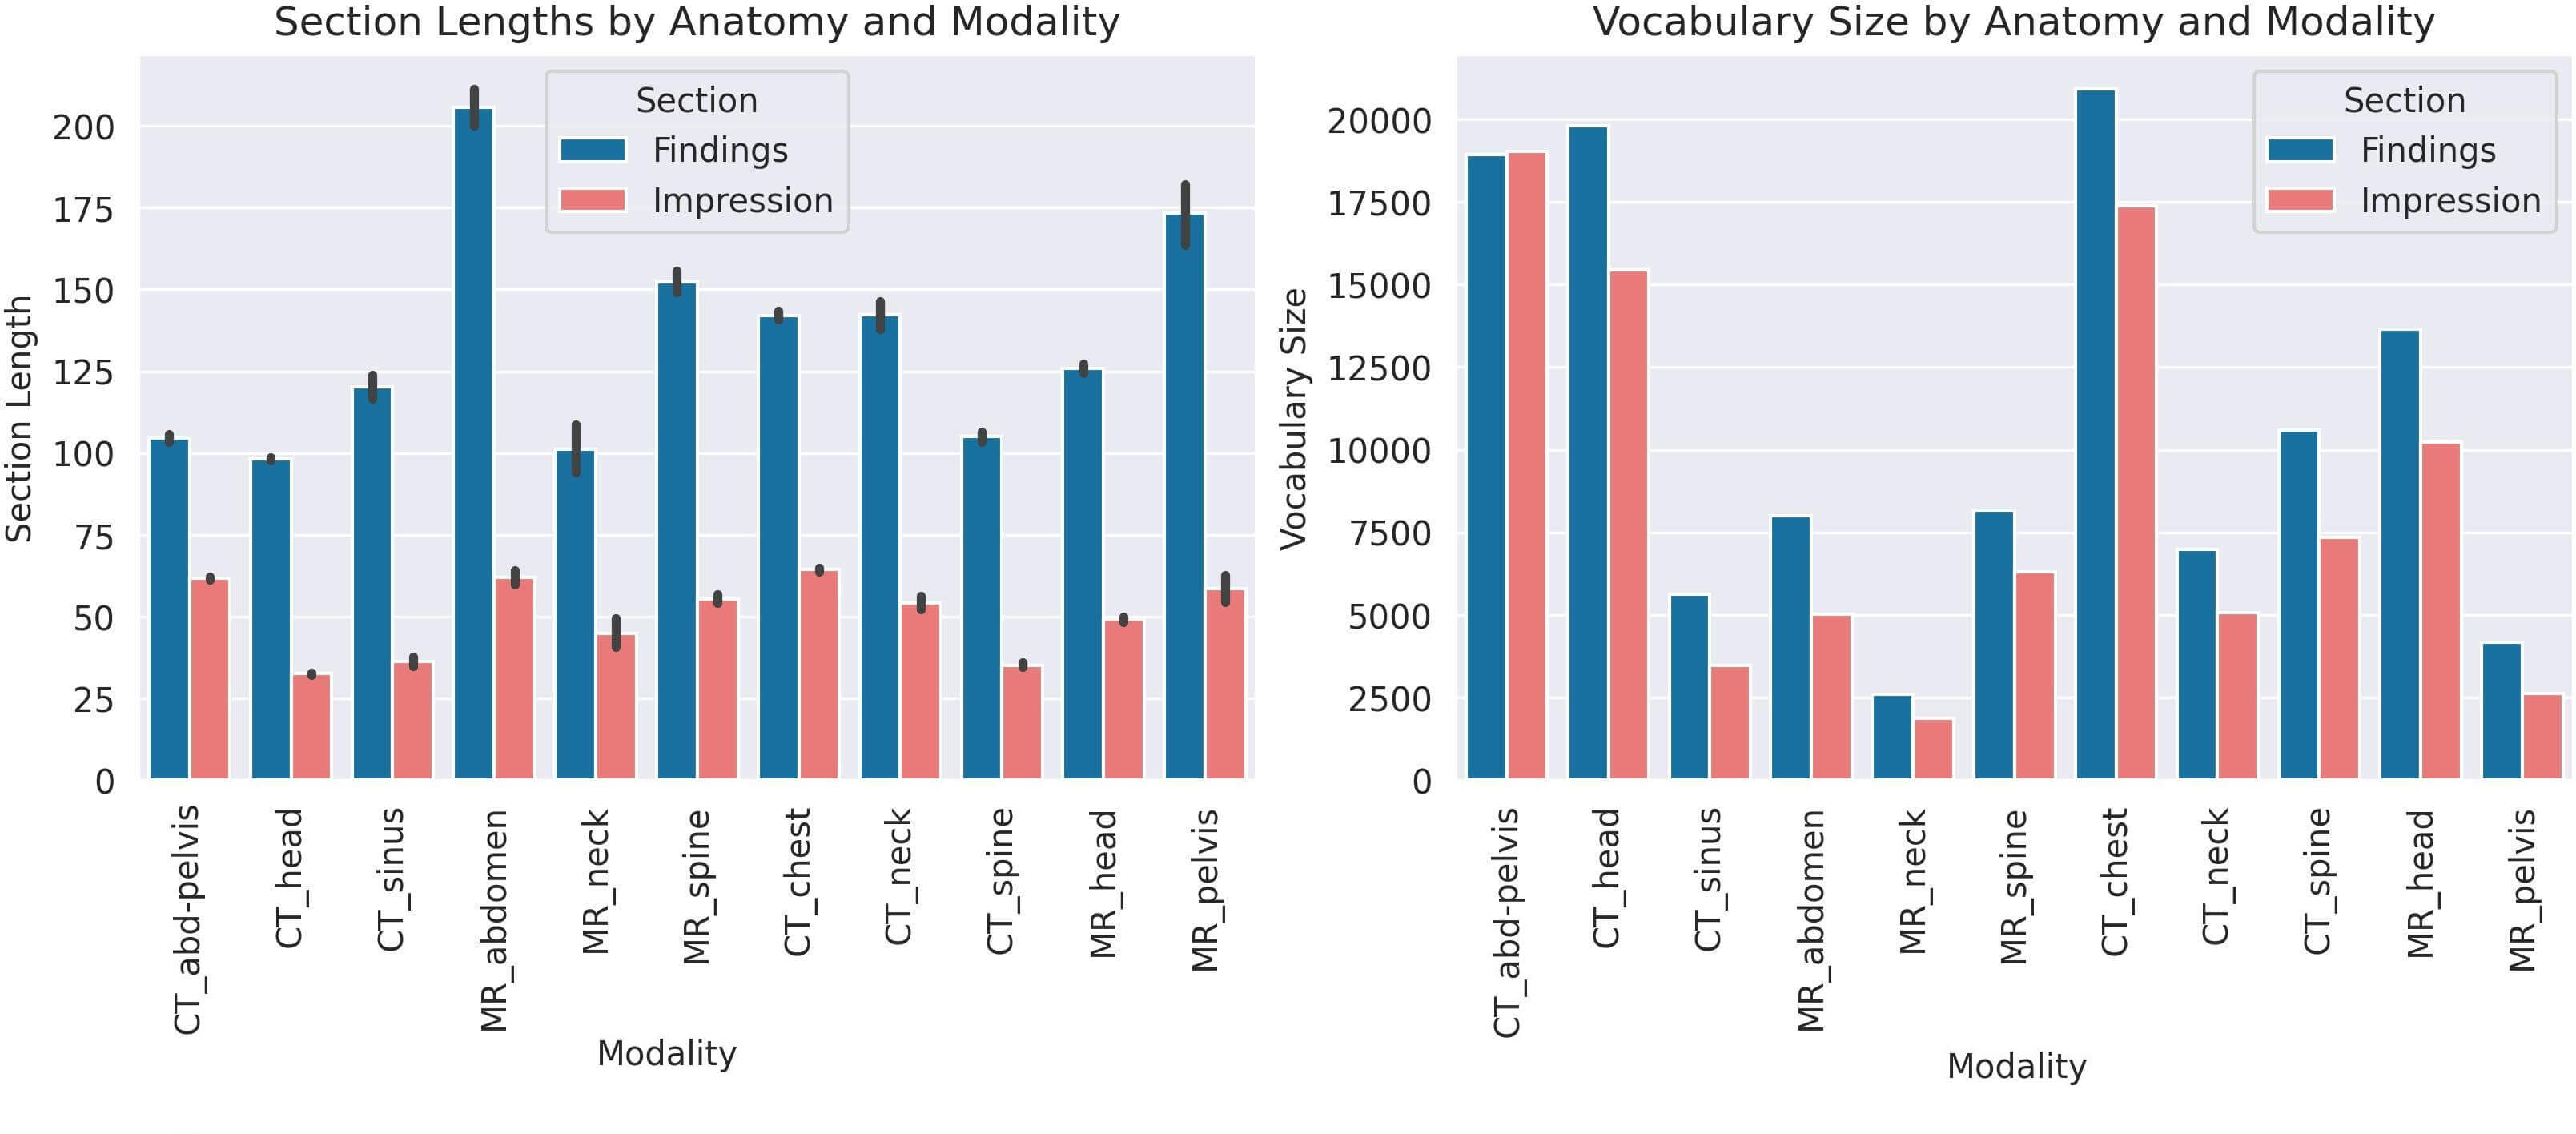
In total, there are 207,782 samples in the MIMIC-RRS dataset. The number of examples for each modality and anatomy is provided in Table 2. To further analyze this dataset, we report in Figure 1 the text lengths and vocabulary sizes associated with reports from each modality-anatomy pair. We find that for all modality-anatomy pairs, the findings section is significantly longer than the impression section (up to +315% for MR abdomen). Additionally, the findings sections of chest X-ray reports, which average only 49 words, are much shorter than reports from other modality-anatomy pairs. In contrast, MR Abdomen and MR Pelvis reports including findings sections that average 205 and 174 words, respectively. We see that CT Chest, CT Head, and CT Abdomen-Pelvis reports have a relatively large vocabulary size (given their sample size) with 20,909, 19,813, and 18,933 words. Surprisingly, the CT Abdomen-Pelvis impressions include a larger vocabulary than the findings. On the other hand, MR pelvis and MR abdomen impressions contain 36% and 37% fewer words than their corresponding findings, respectively.
We assign reports from the following modality-anatomy pairs to training, validation, and test sets due to their large sample sizes: “CT abdomen/pelvis”, “CT Chest”, “CT Neck”, “CT Spine”, “CT Head”, “MR Head”, and “X-ray Chest”. The remaining reports (i.e., “MR Pelvis”, “MR Spine”, “MR Neck”, “MR Abdomen”, and “CT Sinus”) are used for OOD test sets222We release data splits publicly so that future work can fairly compare new results..
3 Algorithmic Analysis
In this section, we conduct experiments to analyze the performance of different models on MIMIC-RRS. We provide three categories of analyses: in-modality-anatomy, cross-modality-anatomy, and clinical efficacy.
3.1 In-modality-anatomy
| Models | MR Head | CT Spine | CT Neck | CT Head | CT Chest | CT Abd/Pel | X-ray Chest | ||||||||||||||
|---|---|---|---|---|---|---|---|---|---|---|---|---|---|---|---|---|---|---|---|---|---|
| R1 | R2 | RL | R1 | R2 | RL | R1 | R2 | RL | R1 | R2 | RL | R1 | R2 | RL | R1 | R2 | RL | R1 | R2 | RL | |
| WGSum | - | - | - | - | - | - | - | - | - | - | - | - | - | - | - | - | - | - | 48.4 | 33.3 | 46.7 |
| AIG-CL | - | - | - | - | - | - | - | - | - | - | - | - | - | - | - | - | - | - | 51.0 | 35.2 | 46.7 |
| T5-S | 38.2 | 18.3 | 28.5 | 35.8 | 18.6 | 28.9 | 39.0 | 20.0 | 29.1 | 43.1 | 25.3 | 36.5 | 39.5 | 18.5 | 29.3 | 28.9 | 10.6 | 21.2 | 47.8 | 32.2 | 43.5 |
| BioBART-B | 42.4 | 21.2 | 32.0 | 47.8 | 27.9 | 40.0 | 40.4 | 19.6 | 29.3 | 46.0 | 27.4 | 38.9 | 41.4 | 19.1 | 30.3 | 33.1 | 12.5 | 23.2 | 49.6 | 33.8 | 45.3 |
| BioBART-L | 42.1 | 21.4 | 32.6 | 47.8 | 28.1 | 40.8 | 40.3 | 19.4 | 29.6 | 45.5 | 26.7 | 38.6 | 40.2 | 17.8 | 28.9 | 32.5 | 11.7 | 22.6 | 49.3 | 33.3 | 44.9 |
| BART-B | 42.0 | 21.5 | 32.1 | 49.0 | 29.7 | 41.6 | 41.4 | 20.9 | 30.2 | 46.4 | 28.1 | 39.5 | 41.6 | 19.5 | 30.6 | 33.1 | 12.9 | 23.6 | 51.0 | 34.9 | 46.4 |
| BART-L | 43.7 | 22.1 | 32.8 | 49.8 | 29.7 | 41.4 | 42.0 | 20.5 | 30.4 | 46.6 | 27.3 | 39.0 | 41.8 | 18.6 | 29.6 | 33.9 | 12.4 | 23.2 | 51.7 | 34.9 | 46.8 |
To benchmark the performance of different models on the proposed MIMIC-RRS dataset, we conduct experiments within each modality-anatomy pair (i.e., the training and test procedures are performed using only one modality-anatomy pair). We evaluate three types of pre-trained sequence-to-sequence models, namely T5 Raffel et al. (2020), BART Lewis et al. (2020), BioBART Yuan et al. (2022), and their variants.333We do not evaluate several pre-trained models (e.g., ClinicalBERT Alsentzer et al. (2019), BioClinicalBERT Alsentzer et al. (2019), and Clinical-T5 Lu et al. (2022)) that specialize in the clinical text since they were trained on the text from MIMIC-III, which overlaps with our dataset. The MIMIC-RRS test set is included in their pre-training data. Thus, we do not adopt them in our experiments to avoid potential data leakage and ensure a fair comparison. Results are reported in Table 3.
Several observations can be drawn from these experiments. First, simply adopting pre-trained sequence-to-sequence language models can achieve results comparable to previous state-of-the-art approaches designed for radiology summarization. Indeed, using BART-L as a backbone achieves the best performance, confirming the necessity of exploiting appropriate pre-trained language models. Secondly, the performances across different model types vary (i.e., BART-L/BART-B, BioBART-L/ BioBART-B). Yet, we notice that the number of training parameters matters; large models report the best results. According to our evaluations, the BART models achieve better results across all modality-anatomy pairs. Surprisingly, it is worth noting that the BioBART models do not achieve better results than BART, although BioBART is pre-trained on a biomedical corpus. One explanation could be that BioBART models are pre-trained on abstracts from PubMed, which are not within the same domain as radiology reports.
In summary, we note several key findings for future studies: (i) “Less is more”: starting from an appropriate backbone instead of designing complicated modules; (ii) the model size matters; (iii) the pre-training domain matters: knowledge from clinical notes or medical literature does not easily translate to radiology reports.
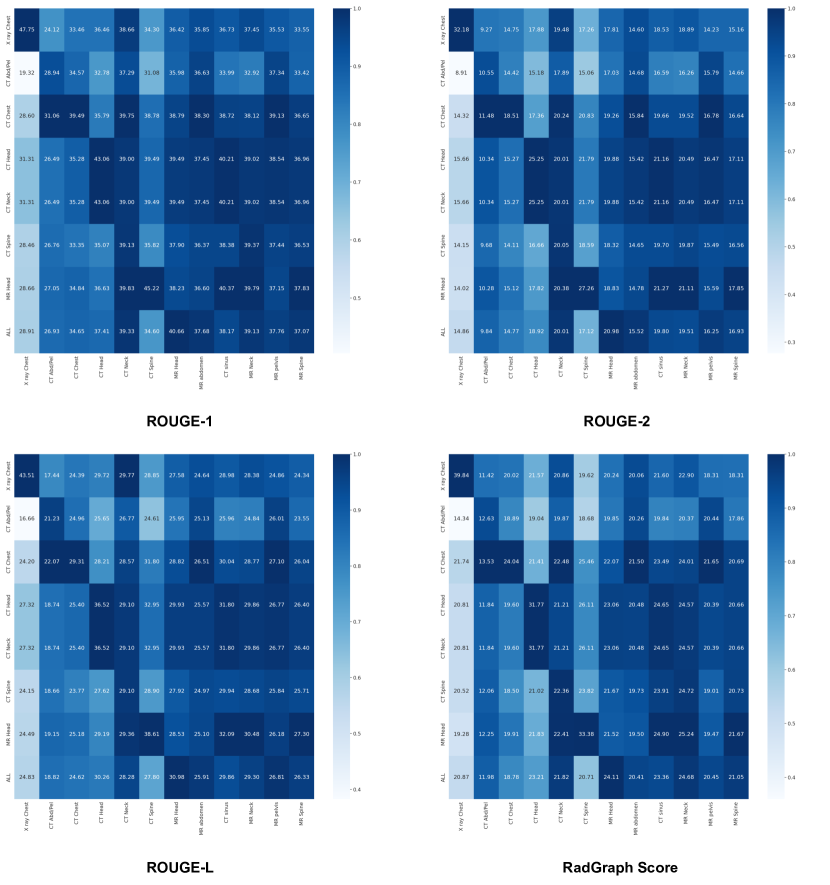
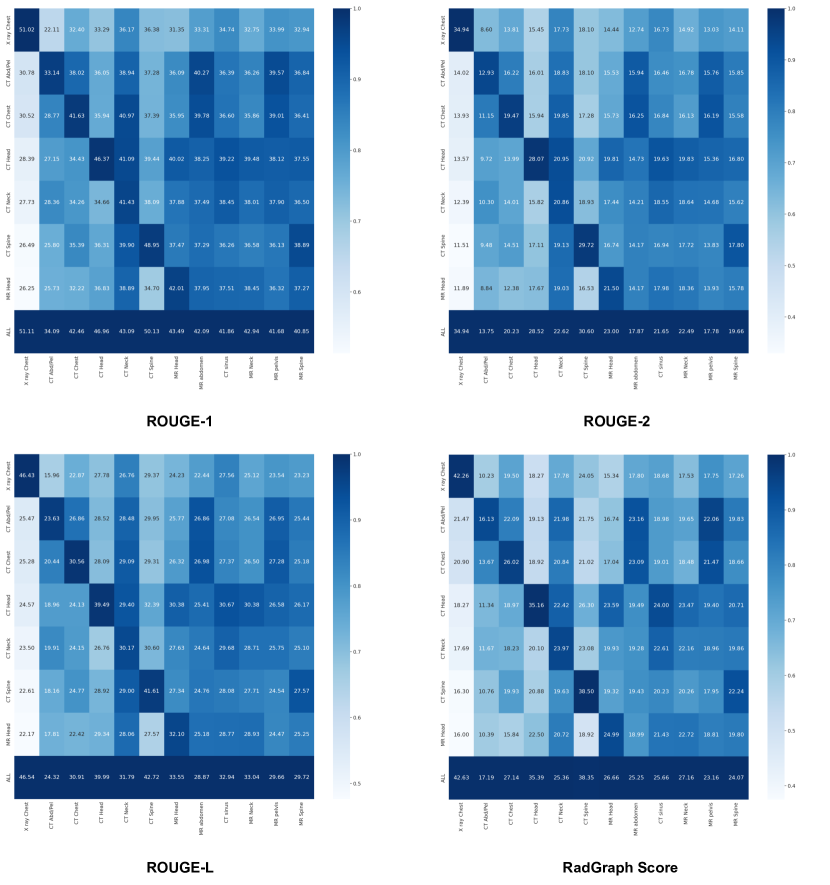
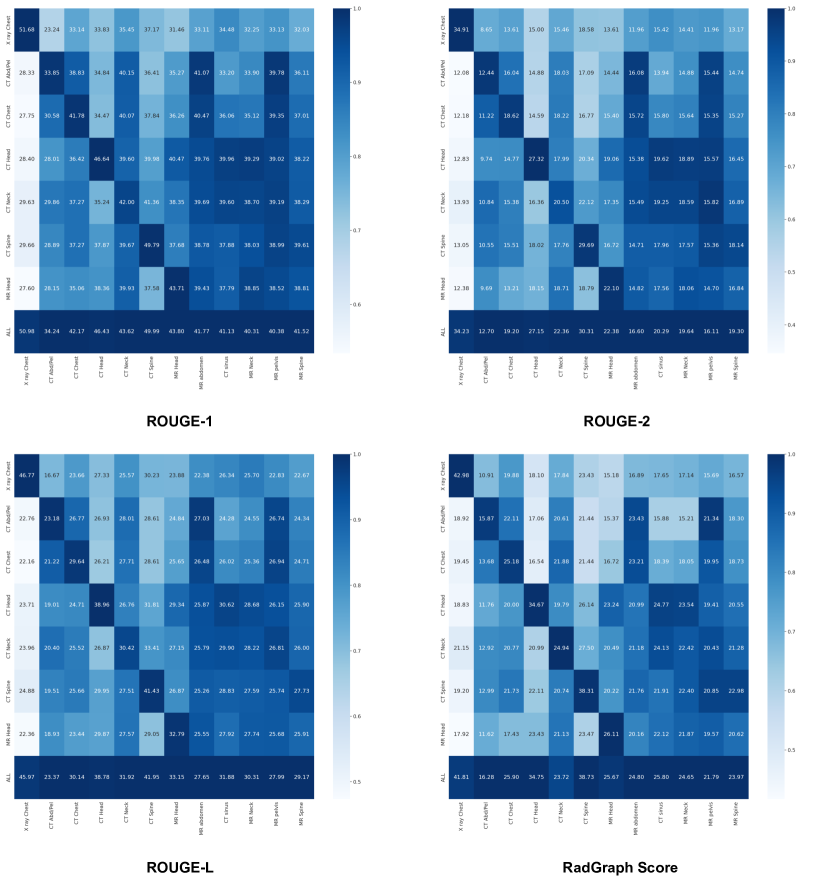
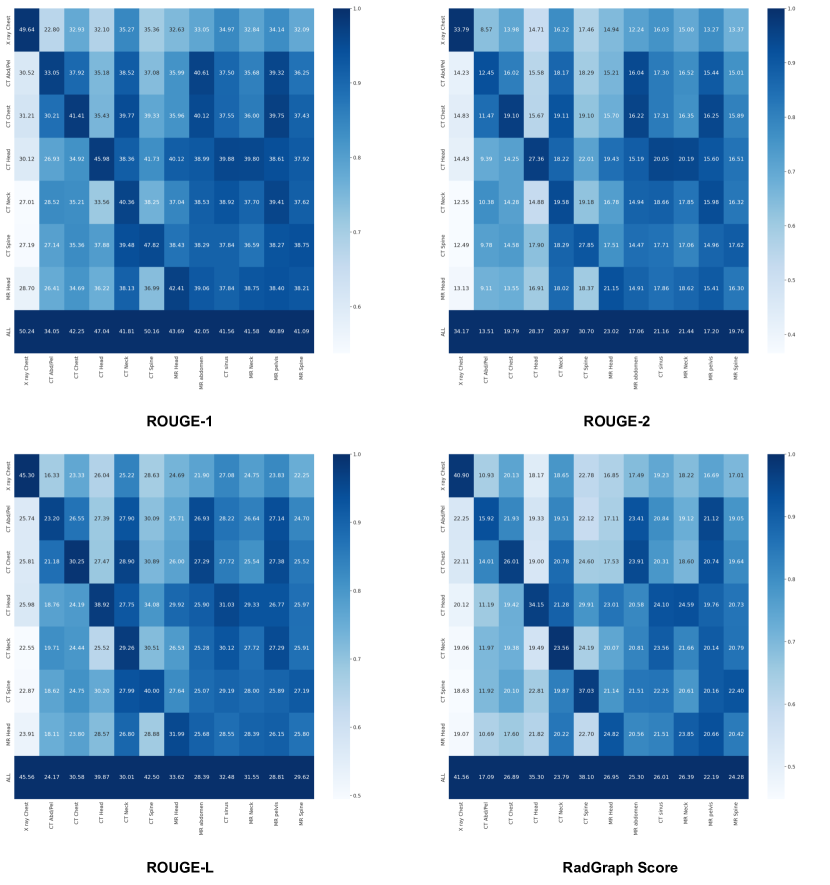
3.2 Cross-modality-anatomy
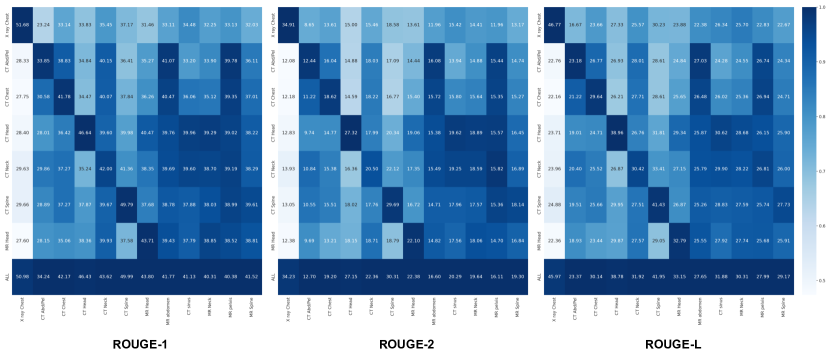
In this section, we conduct experiments across modality-anatomy pairs (i.e., models are trained on reports from a subset of modality-anatomy pairs and then evaluated on all pairs, including the OOD test sets). We report the cross-modality-anatomy scores in Figure 2. A few interesting observations can be made. First, there are some associations between different anatomies and modalities. For example, the model trained on “CT Head” can also achieve promising results on the “MR Head” set. Secondly, training the model with all the modality-anatomy pairs (denoted as ALL) achieves the best generalization, obtaining the best results across all modalities and anatomies including the OOD test sets. We leave further exploration of cross-modality-anatomy associations and zero-shot OOD transfer for future work.
3.3 Clinical-Efficacy
| T5-S | BioBART-B | BioBART-L | BART-B | BART-L | |
|---|---|---|---|---|---|
| MR Head | 21.5 | 24.8 | 25.3 | 25.0 | 26.1 |
| CT Spine | 23.8 | 37.0 | 37.0 | 38.5 | 38.3 |
| CT Neck | 21.2 | 23.6 | 23.6 | 24.0 | 24.9 |
| CT Head | 31.8 | 34.2 | 34.0 | 35.2 | 34.7 |
| CT Chest | 24.0 | 26.0 | 24.3 | 26.0 | 25.2 |
| CT Abd/Pel | 12.6 | 15.9 | 15.3 | 16.1 | 15.9 |
| X-ray Chest | 39.8 | 40.9 | 41.0 | 42.3 | 43.0 |
In addition to evaluating our systems using the ROUGE-1, ROUGE-2, and ROUGE-L metrics (Lin, 2004), we use a factual correctness metric to analyze clinical efficacy. Most prior works (Zhang et al., 2020; Smit et al., 2020; Hu et al., 2022) mainly use the F1CheXbert metric, an F1-score that evaluates the factual correctness of the generated impressions using 14 chest radiographic observations. Unfortunately, this metric is unsuitable for MIMIC-RRS, which contains reports from other modality-anatomy pairs beyond chest X-rays.
For this reason, instead of using F1CheXbert, we propose to use RadGraph Jain et al. (2021) to evaluate the clinical correctness of the generated impressions. RadGraph is a dataset containing board-certified radiologist annotations of radiology reports corresponding to 14,579 entities and 10,889 relations (Appendix A.1). We used the released pre-trained model to annotate our reports and asked one board-certified radiologist to subjectively validate that the printed entities of the RadGraph model on our data are correct (examples are shown in Table 5). After confirming the effectiveness of the model, we follow Delbrouck et al. (2022a) to compute the F1-RadGraph scores. The score evaluates the correctness of the generated named entities in the hypothesis impression compared to the ground-truth impression. We report these results in Table 4. It can be observed that the BART models can achieve the best performance with respect to clinical efficacy. The results are consistent with the ROUGE scores, further confirming the effectiveness of adopting BART as the backbone instead of designing complicated solutions.
4 Related Work
In this section, we discuss prior research related to the radiology report summarization task. The first attempt at automatic summarization of radiology findings into natural language impression statements was proposed by Zhang et al. (2018). Their contribution was to propose a first baseline on the task, using a bidirectional-LSTM as encoder and decoder. Importantly, they found that about 30% of the summaries generated from neural models contained factual errors. Subsequently, Zhang et al. (2020) proposed the CheXbert score to evaluate the factual correctness of the generated impression. They also used reinforcement learning to optimize the CheXbert score directly. Finally, both Hu et al. (2021) and Hu et al. (2022) used the Biomedical and Clinical English Model Packages in the Stanza Python NLP Library (Zhang et al., 2021) to extract medical entities. The former study used the entities to construct a Graph Neural Network, which was used as input in their summarization pipeline. In contrast, the latter study used the entities to mask the findings duringcontrastive pre-training.
We believe this paper is an original contribution to the aforementioned line of work. As instigated by Zhang et al. (2018), our goal is to release a new summarization corpus and baselines on new modalities and anatomies. We do so by releasing an RRS dataset with data from 11 new modality-anatomy pairs. In addition, we extend the work performed by Zhang et al. (2020) by proposing a new metric to evaluates the factual correctness and completeness of the generated impression, namely the RadGraph score. Finally, we improve on the work of Hu et al. (2021, 2022) in two ways: (1) we use semantic annotations from a pre-trained model trained using annotations from board-certified radiologists, as opposed to Stanza which leverages unsupervised biomedical and clinical text data; (2) we leverage relation annotations between entities, a feature that was not available in prior work.
5 Conclusion and Discussion
In this paper, we highlight and address several weaknesses associated with the radiology report summarization task. First, from a data perspective, we propose a publicly available dataset named MIMIC-RRS involving data samples from twelve modality-anatomy pairs, with 79,779 samples from MIMIC-III and 128,003 samples from MIMIC-CXR.
Second, we conducted more than 40 experiments and over 400 cross-modality-anatomy evaluations to benchmark the performance of different models. We show that instead of designing complicated modules, we can start from an appropriate backbone model such as BART.
Finally, we proposed an elegant and simple metric, F1-RadGraph, to evaluate the factual correctness of summaries generated for any modality and anatomy. In the future, we hope that our work broadens the scope of the radiology report summarization task and contributes to the development of reliable RRS models that generalize well to new anatomies and modalities.
Limitations
We note two limitations of our paper. First, our work does not extensively evaluate all the available pre-trained models that could be suitable for this task, e.g., ELECTRA Clark et al. (2020), BioLinkBERT Yasunaga et al. (2022), GatorTron Yang et al. (2022), RadBERT Yan et al. (2022), and PubMedBERT Gu et al. (2021). The aim of this work is not to report the strongest possible score but rather to address weaknesses of existing radiology report summarization studies (in terms of data and evaluation). Yet, we are confident our proposed solutions report a strong baseline for future work. Second, although F1-RadGraph seems like an appropriate metric to evaluate our new modalities and anatomies (and appears to be consistent with ROUGE scores), it has only been evaluated subjectively and not systematically.
Acknowledgments
Maya Varma is supported by graduate fellowship awards from the Department of Defense (NDSEG) and the Knight-Hennessy Scholars program at Stanford University.
References
- Alexander et al. (2022) Robert Alexander, Stephen Waite, Michael A Bruno, Elizabeth A Krupinski, Leonard Berlin, Stephen Macknik, and Susana Martinez-Conde. 2022. Mandating limits on workload, duty, and speed in radiology. Radiology, 304(2):274–282.
- Alsentzer et al. (2019) Emily Alsentzer, John Murphy, William Boag, Wei-Hung Weng, Di Jindi, Tristan Naumann, and Matthew McDermott. 2019. Publicly available clinical bert embeddings. In Proceedings of the 2nd Clinical Natural Language Processing Workshop, pages 72–78.
- Ben Abacha et al. (2021) Asma Ben Abacha, Yassine Mrabet, Yuhao Zhang, Chaitanya Shivade, Curtis Langlotz, and Dina Demner-Fushman. 2021. Overview of the MEDIQA 2021 shared task on summarization in the medical domain. In Proceedings of the 20th Workshop on Biomedical Language Processing, pages 74–85, Online. Association for Computational Linguistics.
- Bhargavan et al. (2009) Mythreyi Bhargavan, Adam H Kaye, Howard P Forman, and Jonathan H Sunshine. 2009. Workload of radiologists in united states in 2006–2007 and trends since 1991–1992. Radiology, 252(2):458–467.
- Bustos et al. (2020) Aurelia Bustos, Antonio Pertusa, Jose-Maria Salinas, and Maria de la Iglesia-Vayá. 2020. Padchest: A large chest x-ray image dataset with multi-label annotated reports. Medical image analysis, 66:101797.
- Clark et al. (2020) Kevin Clark, Minh-Thang Luong, Quoc V. Le, and Christopher D. Manning. 2020. ELECTRA: Pre-training text encoders as discriminators rather than generators. In ICLR.
- Delbrouck et al. (2022a) Jean-Benoit Delbrouck, Pierre Chambon, Christian Bluethgen, Emily Tsai, Omar Almusa, and Curtis P Langlotz. 2022a. Improving the factual correctness of radiology report generation with semantic rewards. arXiv preprint arXiv:2210.12186.
- Delbrouck et al. (2022b) Jean-benoit Delbrouck, Khaled Saab, Maya Varma, Sabri Eyuboglu, Pierre Chambon, Jared Dunnmon, Juan Zambrano, Akshay Chaudhari, and Curtis Langlotz. 2022b. ViLMedic: a framework for research at the intersection of vision and language in medical AI. In Proceedings of the 60th Annual Meeting of the Association for Computational Linguistics: System Demonstrations, pages 23–34, Dublin, Ireland. Association for Computational Linguistics.
- Demner-Fushman et al. (2016) Dina Demner-Fushman, Marc D Kohli, Marc B Rosenman, Sonya E Shooshan, Laritza Rodriguez, Sameer Antani, George R Thoma, and Clement J McDonald. 2016. Preparing a collection of radiology examinations for distribution and retrieval. Journal of the American Medical Informatics Association, 23(2):304–310.
- Gu et al. (2021) Yu Gu, Robert Tinn, Hao Cheng, Michael Lucas, Naoto Usuyama, Xiaodong Liu, Tristan Naumann, Jianfeng Gao, and Hoifung Poon. 2021. Domain-specific language model pretraining for biomedical natural language processing. ACM Transactions on Computing for Healthcare (HEALTH), 3(1):1–23.
- Hu et al. (2021) Jinpeng Hu, Jianling Li, Zhihong Chen, Yaling Shen, Yan Song, Xiang Wan, and Tsung-Hui Chang. 2021. Word graph guided summarization for radiology findings. In Findings of the Association for Computational Linguistics: ACL-IJCNLP 2021, pages 4980–4990, Online. Association for Computational Linguistics.
- Hu et al. (2022) Jinpeng Hu, Zhuo Li, Zhihong Chen, Zhen Li, Xiang Wan, and Tsung-Hui Chang. 2022. Graph enhanced contrastive learning for radiology findings summarization. In Proceedings of the 60th Annual Meeting of the Association for Computational Linguistics (Volume 1: Long Papers), pages 4677–4688.
- Jain et al. (2021) Saahil Jain, Ashwin Agrawal, Adriel Saporta, Steven Truong, Du Nguyen Duong, Tan Bui, Pierre Chambon, Yuhao Zhang, Matthew Lungren, Andrew Ng, Curtis Langlotz, Pranav Rajpurkar, and Pranav Rajpurkar. 2021. Radgraph: Extracting clinical entities and relations from radiology reports. In Proceedings of the Neural Information Processing Systems Track on Datasets and Benchmarks, volume 1.
- Johnson et al. (2019) Alistair EW Johnson, Tom J Pollard, Seth J Berkowitz, Nathaniel R Greenbaum, Matthew P Lungren, Chih-ying Deng, Roger G Mark, and Steven Horng. 2019. Mimic-cxr, a de-identified publicly available database of chest radiographs with free-text reports. Scientific data, 6(1):1–8.
- Johnson et al. (2016) Alistair EW Johnson, Tom J Pollard, Lu Shen, Li-wei H Lehman, Mengling Feng, Mohammad Ghassemi, Benjamin Moody, Peter Szolovits, Leo Anthony Celi, and Roger G Mark. 2016. Mimic-iii, a freely accessible critical care database. Scientific data, 3(1):1–9.
- Karn et al. (2022) Sanjeev Kumar Karn, Ning Liu, Hinrich Schütze, and Oladimeji Farri. 2022. Differentiable multi-agent actor-critic for multi-step radiology report summarization. In Proceedings of the 60th Annual Meeting of the Association for Computational Linguistics (Volume 1: Long Papers), pages 1542–1553.
- Lewis et al. (2020) Mike Lewis, Yinhan Liu, Naman Goyal, Marjan Ghazvininejad, Abdelrahman Mohamed, Omer Levy, Veselin Stoyanov, and Luke Zettlemoyer. 2020. Bart: Denoising sequence-to-sequence pre-training for natural language generation, translation, and comprehension. In Proceedings of the 58th Annual Meeting of the Association for Computational Linguistics, pages 7871–7880.
- Lin (2004) Chin-Yew Lin. 2004. Rouge: A package for automatic evaluation of summaries. In Text summarization branches out, pages 74–81.
- Lu et al. (2022) Qiuhao Lu, Dejing Dou, and Thien Nguyen. 2022. Clinicalt5: A generative language model for clinical text. In Findings of the Association for Computational Linguistics: EMNLP 2022, pages 5436–5443.
- Raffel et al. (2020) Colin Raffel, Noam Shazeer, Adam Roberts, Katherine Lee, Sharan Narang, Michael Matena, Yanqi Zhou, Wei Li, Peter J Liu, et al. 2020. Exploring the limits of transfer learning with a unified text-to-text transformer. J. Mach. Learn. Res., 21(140):1–67.
- Smit et al. (2020) Akshay Smit, Saahil Jain, Pranav Rajpurkar, Anuj Pareek, Andrew Y Ng, and Matthew Lungren. 2020. Combining automatic labelers and expert annotations for accurate radiology report labeling using bert. In Proceedings of the 2020 Conference on Empirical Methods in Natural Language Processing (EMNLP), pages 1500–1519.
- Yan et al. (2022) An Yan, Julian McAuley, Xing Lu, Jiang Du, Eric Y Chang, Amilcare Gentili, and Chun-Nan Hsu. 2022. Radbert: Adapting transformer-based language models to radiology. Radiology: Artificial Intelligence, 4(4):e210258.
- Yang et al. (2022) Xi Yang, Nima PourNejatian, Hoo Chang Shin, Kaleb E Smith, Christopher Parisien, Colin Compas, Cheryl Martin, Mona G Flores, Ying Zhang, Tanja Magoc, et al. 2022. Gatortron: A large clinical language model to unlock patient information from unstructured electronic health records. arXiv preprint arXiv:2203.03540.
- Yasunaga et al. (2022) Michihiro Yasunaga, Jure Leskovec, and Percy Liang. 2022. Linkbert: Pretraining language models with document links. In Association for Computational Linguistics (ACL).
- Yuan et al. (2022) Hongyi Yuan, Zheng Yuan, Ruyi Gan, Jiaxing Zhang, Yutao Xie, and Sheng Yu. 2022. Biobart: Pretraining and evaluation of a biomedical generative language model. In Proceedings of the 21st Workshop on Biomedical Language Processing, pages 97–109.
- Zhang et al. (2018) Yuhao Zhang, Daisy Yi Ding, Tianpei Qian, Christopher D Manning, and Curtis P Langlotz. 2018. Learning to summarize radiology findings. In Proceedings of the Ninth International Workshop on Health Text Mining and Information Analysis, pages 204–213.
- Zhang et al. (2020) Yuhao Zhang, Derek Merck, Emily Tsai, Christopher D Manning, and Curtis Langlotz. 2020. Optimizing the factual correctness of a summary: A study of summarizing radiology reports. In Proceedings of the 58th Annual Meeting of the Association for Computational Linguistics, pages 5108–5120.
- Zhang et al. (2021) Yuhao Zhang, Yuhui Zhang, Peng Qi, Christopher D Manning, and Curtis P Langlotz. 2021. Biomedical and clinical english model packages for the stanza python nlp library. Journal of the American Medical Informatics Association, 28(9):1892–1899.
Appendix A Details of RadGraph Scores
A.1 The Introduction of RadGraph
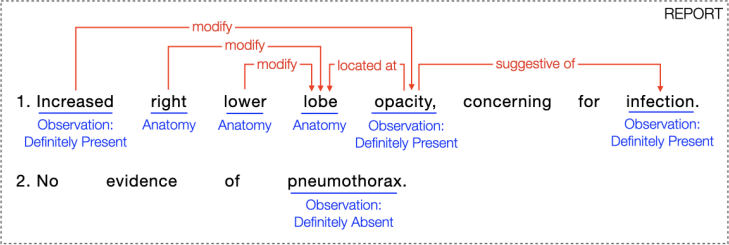
To design our new evaluation metric, we leverage the RadGraph dataset (Jain et al., 2021) containing board-certified radiologist annotations of chest X-ray reports, which correspond to 14,579 entities and 10,889 relations. RadGraph has released a PubMedBERT model (Gu et al., 2021) pre-trained on these annotations to annotate new reports. An example of annotation can be seen in Figure 3. Before moving on to the next section, we quickly describe the concept of entities and relations:
Entities
An entity is defined as a continuous span of text that can include one or more adjacent words. Entities in RadGraph center around two concepts: Anatomy and Observation. Three uncertainty levels exist for Observation, leading to four different entities: Anatomy (ANAT-DP), Observation: Definitely Present (OBS-DP), Observation: Uncertain (OBS-U), and Observation: Definitely Absent (OBS-DA).
Relations
A relation is defined as a directed edge between two entities. Three levels exist: Suggestive Of (., .), Located At (., .), and Modify (., .).
A.2 Metric Computation
Using the RadGraph annotation scheme and pre-trained model, we designed an F-score style reward that measures the factual consistency and completeness of the generated impression (also called hypothesis impression) compared to the reference impression.
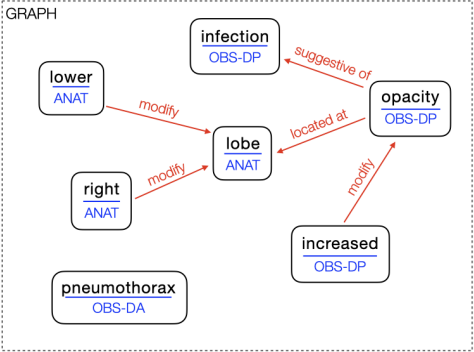
To do so, we treat the RadGraph annotations of an impression as a graph with the set of nodes containing the entities and the set of edges the relations between pairs of entities. The graph is directed, meaning that the edge . An example is depicted in Figure 4. Each node or edge of the graph also has a label, which we denote as for an entity (for example “OBS-DP" or “ANAT") and for a relation (such as “modified" or “located at").
To design our RadGraph score, we focus on the nodes and whether or not a node has a relation in . For a hypothesis impression , we create a new set of triplets . The value is if , otherwise. In other words, a triplet contains an entity, the entity label, and whether or not this entity has a relation. We proceed to construct the same set for the reference report and denote this set .
Finally, our score is defined as the harmonic mean of precision and recall between the hypothesis set and the reference set , giving a value between and . As an illustration, the set , and of the graph in Figure 4 are shown as follows:
mild, fluid, overload, overt, pulmonary, edema
(mild,overload), (overload, fluid), (edema, pulmonary)
(mild, obs-dp, 1), (fluid, obs-dp, 0), (overload, obs-dp, 1), (overt, obs-da, 0), (pulmonary, anat-dp, 0), (edema, obs-da, 1)
Appendix B Code and Data Release
Our research has been carried out using the ViLMedic library (Delbrouck et al., 2022b). Our code is available at https://github.com/jbdel/vilmedic. This link is anonymized and complies with the double-blind review process. More specifically, we release the code of the RadGraph score as well as the training of our baseline. We also release the script to download, pre-process, and split the radiology reports of the MIMIC-III database as per our experiments. To download the MIMIC-III database, researchers are required to formally request access via a process documented on the MIMIC website. There are two key steps that must be completed before access is granted: (i) the researcher must complete a recognized course in protecting human research participants, including Health Insurance Portability and Accountability Act (HIPAA) requirements. (ii) the researcher must sign a data use agreement, which outlines appropriate data usage and security standards, and forbids efforts to identify individual patients.
Appendix C More Results
We present the results (including four metrics, i.e., ROUGE-1, ROUGE-2, ROUGE-L, and RadGraph scores) of all the experiments on Figure 5-9 for further research in this field. We also show the output of RadGraph (for entities) on a few samples of our new dataset in Table 5.
| CT Spine | CT Sinus | MR Neck | MR Head |
![[Uncaptioned image]](/html/2211.08584/assets/images/CT_sinus.png) |
![[Uncaptioned image]](/html/2211.08584/assets/images/mr_neck.png) |
![[Uncaptioned image]](/html/2211.08584/assets/images/mr_head.png) |

Appendix D Ethics Statement
The MIMIC-CXR and MIMIC-III datasets are de-identified to satisfy the US Health Insurance Portability and Accountability Act of 1996 (HIPAA) Safe Harbor requirements. Protected health information (PHI) has been removed. Therefore, the ethical approval statement and the need for informed consent were waived for the studies on this database, which was approved by the Massachusetts Institute of Technology (Cambridge, MA) and Beth Israel Deaconess Medical Center (Boston, MA). This research was conducted in accordance with the Declaration of Helsinki, describing the ethical principles of medical research involving human subjects.