Observation of self-patterned defect formation in atomic superfluids
– from ring dark solitons to vortex dipole necklaces
Abstract
Unveiling nonequilibrium dynamics of solitonic and topological defect structures in a multidimensional nonlinear medium is a current frontier across diverse fields. One of the quintessential objects is a ring dark soliton (RDS), whose dynamics are expected to display remarkable interplay between symmetry and self-patterned topological defect formation from a transverse (snake) instability, but it has thus far evaded full experimental observations. Here, we report an experimental realization of RDS generation in a two-dimensional atomic superfluid trapped in a circular box. By quenching the confining box potential, we observe an RDS emitted from the edge and its peculiar signature in the radial motion. As an RDS evolves, we observe transverse modulations at discrete azimuthal angles, which clearly result in a patterned formation of a circular vortex dipole array. Through collisions of the vortex dipoles with the box trap, we observe vortex unbinding, vortex pinning to the edge, and emission of rarefaction pulses. Our box-quench protocol opens a new way to study multidimensional dark solitons, structured formation of topological defects, and potentially the dynamics of ordered quantum vortex matter.
Vortices and dark solitons are fundamental defect structures that appear in nonlinear physics at all scales, from superfluids and nonlinear optics to cosmic fluids. They play critical roles in understanding the dynamics and microscopic characteristics of the hosting medium. A quantized vortex emerges as a result of a topologically protected singularity with a phase winding. In quantum gases, beginning with seminal experiments with dynamical optical imprinting techniques Matthews et al. (1999), vortices are also produced by injecting angular momentum through stirring Madison et al. (2000); Abo-Shaeer et al. (2001); Kwon et al. (2015); Seo et al. (2017); Gauthier et al. (2019); Johnstone et al. (2019). Several other techniques have been discovered Bland et al. (2023). While most experiments have excited disordered vortices with equal or both circulations or a vortex lattice of the same charges Madison et al. (2000); Abo-Shaeer et al. (2001), few-vortex structures with engineered flow patterns were realized only recently Kwon et al. (2021); Hernández-Rajkov et al. (2023). A dark soliton, on the other hand, features a phase jump across a nontopological defect in the wave function, and is discovered primarily through phase Burger et al. (1999); Denschlag et al. (2000); Ku et al. (2016), density Dutton et al. (2001); Ginsberg et al. (2005), or state Anderson et al. (2001); Becker et al. (2008) engineering techniques or by matter-wave interference Weller et al. (2008); Shomroni et al. (2009); Chang et al. (2008). By driving a quantum gas through a continuous phase transition, both vortices and solitonic defects are found to form spontaneously via the Kibble-Zurek mechanism Weiler et al. (2008); Freilich et al. (2010); Lamporesi et al. (2013); Chomaz et al. (2015); Ko et al. (2019), indicating their complementary roles in a universal defect formation process.
Remarkably, in two or three dimensions, dark solitons are fundamentally connected to highly ordered vortex states of complex phase patterns through an intrinsic instability Kevrekidis and Frantzeskakis (2004), where a self-amplifying transverse modulation can fragment a stripe (or plane) of phase defect into an ordered array of vortex and antivortex (line or ring) pairs. This fascinating process, called transverse instability (TI), has been under heavy investigation in diverse fields for decades Kivshar and Pelinovsky (2000), including quantum gas experiments Anderson et al. (2001); Dutton et al. (2001); Shomroni et al. (2009); Becker et al. (2013); Donadello et al. (2014); Ku et al. (2016). In previous experimental studies, however, vortices were often observed as disordered decay products of dark solitons. Self-patterned, ordered vortex dipole arrays have never been clearly visualized.
Controlling soliton generations and its instability could open a doorway towards forming complex vortex structures that are arduous to reach artificially. In a two-dimensional (2D) quantum fluid, an interesting example emerges from a ring dark soliton (RDS) Kivshar and Yang (1994) that manifests as a circular dark stripe formed under rotational symmetry. An RDS does not disperse due to the balance between self-defocusing and wave dispersion Kivshar and Luther-Davies (1998); Frantzeskakis (2010), similarly to straight counterparts, and it naturally exhibits radial oscillations while varying its profile. Breaking the rotational symmetry of an RDS feeds TI Kivshar and Pelinovsky (2000); Toikka and Suominen (2013). This results in elusive formation of a vortex dipole “necklace”, which consists of a circular array of vortex-antivortex pairs Theocharis et al. (2003). Remarkably, such ordered vortices with alternating charges may exhibit a variety of many-body dynamics, including persistent revivals of structures Pietilä et al. (2006); Shomroni et al. (2009); Toikka and Suominen (2013) and clusterization Crasovan et al. (2002); Möttönen et al. (2005); Pietilä et al. (2006); Cawte et al. (2021), which do not occur in disordered vortex matter Gauthier et al. (2019); Johnstone et al. (2019). Moreover, structured vortex matter can melt under significant perturbation and may eventually lead to chaos or turbulence Novikov (1975); Toikka et al. (2013); Cawte et al. (2021).
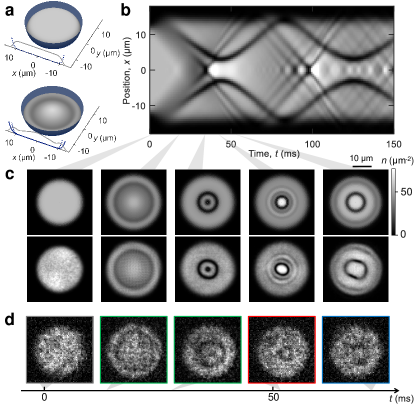
While RDS-like dark waves were previously engineered via phase imprinting in nonlinear optics Baluschev et al. (1995); Dreischuh et al. (2002) or have emerged from shock-wave emissions in atomic or polaritonic condensates Hoefer et al. (2006); Dominici et al. (2015) and optics Wan et al. (2007), one central question concerning this study is whether self-patterned solitonic and topological defect formation via an RDS can be controlled and clearly observed. Here, we show that a box-confined superfluid serves as a perfect arena Navon et al. (2021). RDS formation can be realized in a box trap with a sharp wall, whose width is comparable to or smaller than the superfluid healing length. The edge profile of a superfluid can be viewed as a density defect [Fig. 1(a), top panel]. A quench-down of the potential height or an interaction quench-up would effectively cause shrinkage of the defect because the edge of the superfluid expands outwards (bottom panel). This dynamics forces the edge to emit dark solitons to conserve atom number, an effect that has recently been discussed in a case of an interaction quench-up with a perfect wall Halperin and Bohn (2020). The mechanism is similar to an interaction quench that splits a full dark soliton as described in Refs. Gamayun et al. (2015); Franchini et al. (2015). An alternative interpretation of this edge effect is self-interference Ruostekoski et al. (2001), where an expanding superfluid bounces off the wall, and the interference between the bulk and the reflected flow induces phase slips, thus forming dark solitons. This effect should occur in quenched nonlinear systems with sharp boundaries—a -dimensional shell wave could form from a -dimensional system, which is difficult to achieve with existing engineering techniques Burger et al. (1999); Denschlag et al. (2000); Ku et al. (2016); Dutton et al. (2001); Ginsberg et al. (2005); Anderson et al. (2001); Becker et al. (2008); Weller et al. (2008); Shomroni et al. (2009); Chang et al. (2008).
In this article, we report the first observation of self-patterned defect formation in a box-confined 2D superfluid. We demonstrate spontaneous RDS formation and unveil its radial dynamics with a symmetry-breaking TI at discrete azimuthal angles. We visualize structured fragmentation of an RDS into a necklace of vortex dipoles. The observed vortex dipole structures include not only weakly bound vortex-antivortex pairs but also coalesced vortex cores and rarefaction pulses. They are subject to collisions, interactions with the boundary, and annihilation, potentially showing rich nonequilibrium dynamics of quantized 2D vortex matter.
Our experimental scheme is illustrated in Fig. 1(a). A 2D circular box is enclosed by a ring-shaped repulsive wall that has an approximate Gaussian radial profile ( width m). The box confines a homogeneous 2D superfluid, with negligible thermal components, formed by cesium atoms with an initial bulk density and prepared at a fixed coupling constant , which leads to a long healing length m convenient for in situ defect measurements (Appendix A). The chemical potential is nK, where is the reduced Planck constant, is the atomic mass, and is the Boltzmann constant. At time , the height of the wall potential is quenched from to . Because of the much-reduced repulsion from the Gaussian wall, the superfluid would expand outwards, forcing the boundary to emit a ring-shaped dark wave.
One signature of an RDS is its radial collapse dynamics, described by a wave function that is essentially identical to a 1D dark soliton in the radial coordinate Kivshar and Yang (1994), , where is a time-dependent radius. The depth controls the radial velocity and the characteristic width , where is the sound speed. Unlike linear dark solitons, the depth of an RDS does not remain constant but acquires an adiabatic radial dependence to conserve its energy (Appendix B),
| (1) |
where and are the initial conditions. Both radial speed and width also pick up their radial dependences accordingly. For a shrinking RDS, the maximum depth can be reached at a minimum radius . At this point, the radial motion would come to a complete stop, followed by expansion Kivshar and Yang (1994). For a shallower or smaller RDS with , it could collapse into a single defect.
Numerical evaluation of a GPE (Appendix C) supports RDS emission from this quench protocol. As shown in Figs. 1(b) and 1(c), initially two distinct RDSs can be seen to emerge from the edge of the wave function. A slower-moving, darker ring shrinks until it reaches the maximum depth and a minimum radius. The ring then rebounds and expands radially. Another shallower, faster-moving ring appears to collapse at the center but would emerge again as an expanding ring. Both RDSs are later reflected off the box wall as discussed in the case of 1D solitons Sciacca et al. (2017), exhibiting bouncing dynamics periodically. These box-trapped RDSs cross each other multiple times with preserved shapes, and appear to be long-lived if rotational symmetry is not explicitly broken. However, they radiate additional shallow RDSs after collapsing at the box center, when the radial motion becomes nonadiabatic.
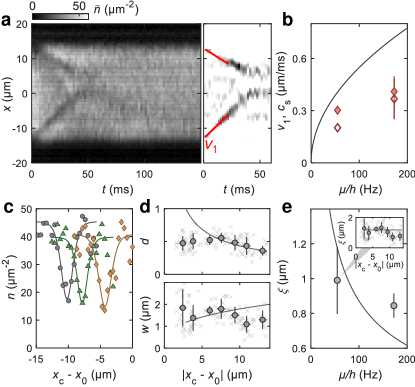
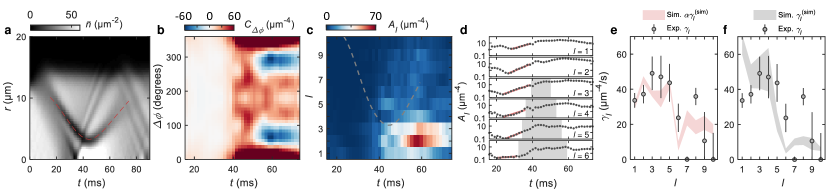
We experimentally confirm RDS emission from in situ images of box-quenched superfluids. Figure 1(d) shows qualitative correspondences between single-shot experiment density profiles and GPE results. A prominent dark ring is clearly visible within ms until a minimum radius is reached. The line cut density [Fig. 2(a)] averaged over different experimental shots clearly shows the dark ring’s radial bouncing dynamics. A less visible, shallower dark wave is found to cross near the box center at ms, similar to the GPE result [Fig. 1(b)].
Initial radial velocities of the darker () rings are shown in Fig. 2(b). Wave speeds from samples with a larger chemical potential, but with the same quench protocol, are plotted for comparison. All measured velocities are significantly lower than the sound speed. We note that there is an anisotropy in the observed wave velocities across the box center. This originated from an azimuthal variation in the wall width, which is due to aberration in our optical potential, and this gives a slight anisotropy in the soliton depth and radial velocity as well. As a result, the dark ring center appears to be drifting slightly in the box, with at ms. For all quoted positions in the following analyses, the shift has been corrected.
The observed radial dynamics can be compared with predictions based on Eq. (1) and the measured initial conditions. From the initial wave velocity () and ring radius m measured at , the dark ring is expected to reach a minimum radius , agreeing well with our observation approximately . To compare the entire density evolution with expectations, we fit the detected ring density dips [Fig. 2(c)] with and extract the width as well as depth versus position of the defect center in panel (d). We compare the relationship in panel (e). The results are consistent with predictions assuming a perfectly unperturbed RDS, except that the measured depth stops increasing with decreasing ring size at a radius of less than or around m. We attribute this reduced contrast to an instability developing in the dark ring, as we now discuss.
An RDS becomes unstable when the rotational symmetry is broken Toikka and Suominen (2013), which, in experiment, occurs in the presence of thermal and quantum fluctuations or with an azimuthal variation in the generating box potential. An RDS would suffer transverse modulations from self-amplifying noise. This is clearly visible in our experiments especially when the dark ring reaches the minimum radius, as seen in Fig. 1(d). By seeding initial fluctuations in an otherwise smooth GPE wave function (Appendix C), qualitatively similar density perturbations are observed in Fig. 1(c).
Interestingly, TI is intrinsically coupled to an RDS’s radial motion. For a dark soliton stripe with finite length , it is known that TI manifests as sinusoidal “snaking” density modulations along the stripe, with discrete wave numbers () limited by the transverse width Ma et al. (2010). In an RDS, this sets a radius-dependent limit,
| (2) |
Therefore, high-frequency modulations stop growing as an RDS shrinks. Around the minimum radius, only the most unstable mode(s) with could continue to be amplified, until the RDS fragments into around pieces with angular separation .
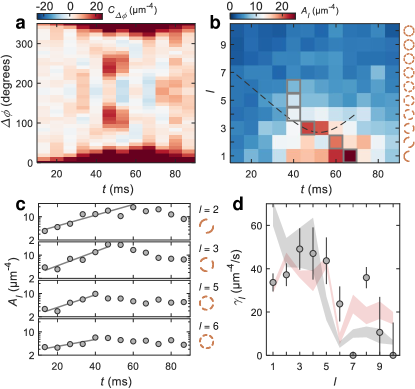
To visualize this dynamics, in Fig. 3(a) we plot the angular density-density correlation function in the dark ring, , where is the atomic density near the measured ring position , and () denotes ensemble (azimuthal) averaging. After a long enough time while the dark ring approaches its minimum radius, we observe very strong angular correlations at and angles, corresponding to . This mode appears to create radial distortions of a triangular shape, as exemplified by the single-shot images in the second column of Fig. 4(a). Interestingly, as the dark ring continues to evolve (), a new correlation pattern develops at around angle, that is, for ; see the images in the third column of Fig. 4(a).
To observe this mode competition more clearly, we measure the Fourier spectrum by evaluating . As shown in Fig. 3(b), instability develops mostly within , whose amplitudes are exponentially amplified as shown in panel (c). Figure 3(d) plots the initial growth rate for each mode, quantitatively reproduced by the GPE simulations detailed in Appendix F. In the experiments, the mode is the most unstable with the largest growth rate. At ms, however, the growth of high-frequency modes becomes arrested by the shrinking radius. The onset of growth suppression roughly follows the estimation given by Eq. (2), until the minimum ring radius is reached; see panel (b). Beyond ms, and 2 modes continue to increase until , when becomes large enough to break the expanding dark ring. In real space, this corresponds to fragmentation of pieces with angular separation as evidenced in our observations.
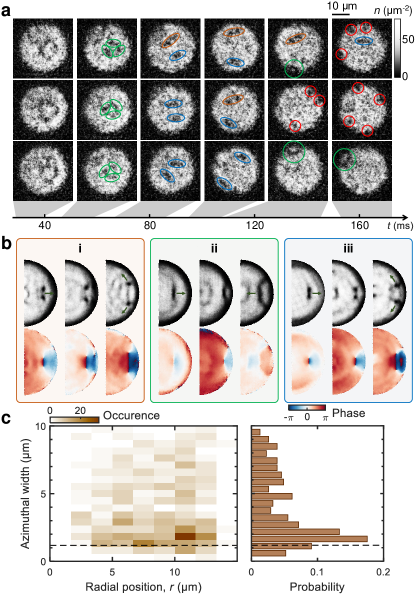
We identify these self-structured fragments as vortex dipoles Theocharis et al. (2003) in which the vortex-antivortex distance is linked to the speed and the incompressible kinetic energy of the flow . Remarkably, we observe a variety of vortex dipole structures in experiment and in GPE simulations as well [Fig. 4(b)]; many of these structures were classified in Refs. Jones and Roberts (1982); Jones et al. (1986). One type of defect is referred to as a weakly bound vortex dipole, appearing when the flow has a larger energy. It features two well-separated cores and phase singularities as shown in (i). A second type of defect is the rarefaction pulse shown in (ii), which shows a phase step without vorticities and propagates at a velocity closer to the sound speed. It emerges as a local density minimum weakly connected to other defects in the bulk or at the boundary. A third type, which we observe most frequently, is somewhat in between the first two. Its energy is large enough to preserve two phase vorticities but too small to separate their cores. It can be seen as an isolated density defect with an elongated width () and is identified as a bounded dipole as in (iii). Oftentimes, the second and the third types of defects are referred to as coalesced vortices Kwon et al. (2014) or Jones-Roberts solitons Meyer et al. (2017).
In Fig. 4(a), due to shot-to-shot fluctuations in atomic density (see also Appendix E), observed density defects exhibit various shapes as discussed above. Three rarefaction pulses (green ovals) that are weakly linked in a triangular shape are often found at . Pairs of bounded vortex dipoles (blue ovals) are most frequently identified immediately after an RDS fragments. Weakly bound dipoles (brown ovals) sometimes appear, potentially due to stronger snaking modulations and a larger flow energy to separate the cores. At longer times, many isolated vortices (red circles) are found near the edge of the box, presumably exhibiting similar orbital dynamics as seen in Ref. Neely et al. (2010). Detailed identification algorithms of density defects can be found in Appendixes D and E.
A clear distinction of vortex dipoles can be visualized from their interaction with the wall potential, where the density gradient induces an inward force on both the vortex and the antivortex and this triggers the Magnus effect. A vortex dipole would decelerate and unbind upon hitting the wall as shown in (i) and (iii) of Fig. 4(b). The unbound vortices appear pinned to the superfluid boundary and move along the rim with opposite circulation. If, instead, a rarefaction pulse is incident upon the wall, it forms an arclike defect structure, as shown in (ii), eventually breaking into a reflecting rarefaction pulse, and occasionally also two vortices pinned to the boundary with opposite circulations. These rarefaction arcs are evidenced by defects marked with large green circles in Fig. 4(a). Long after all vortex dipoles have interacted with the wall, we identify a high probability for observing vortexlike density defects (azimuthal size ) near the boundary m, as shown in Fig. 4(c). Other defects at m have a wide spread of azimuthal widths (). They are likely rarefaction pulses, rebounded dipoles, or colliding defects in the bulk.
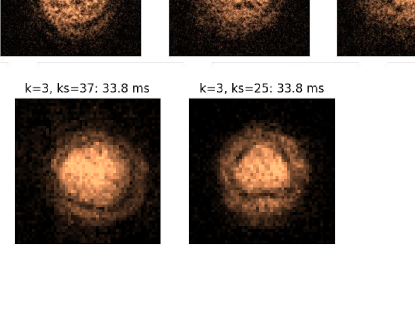
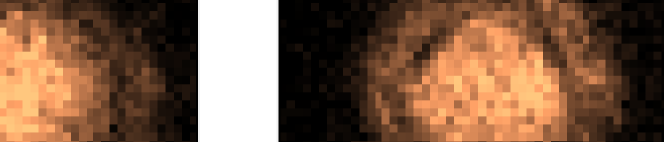
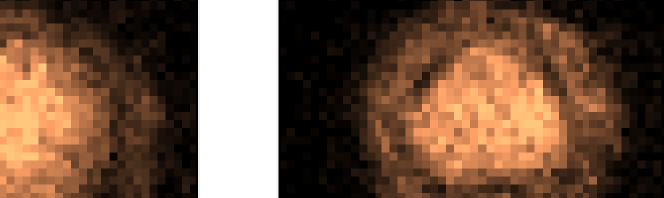
We have demonstrated in situ images of self-structured density defects. This enables directly probing self-patterning dynamics in a superfluid for the first time. To further enhance visualization of vortex dipole necklaces, we can extinguish the horizontal trap confinement and image after a long time-of-flight (TOF) expansion in 2D; see Fig. 5. We note that these structures continue to evolve during the expansion. Here, we use a smaller box to increase the initial density, chemical potential, and thus the TOF expansion rate. Vortex cores in vortex dipole necklaces dramatically expand during TOF due to much-reduced healing length, clearly visible in panel (a). As dipoles propagate towards the boundary, their core size further increases due to reduced background density. We have also observed or bounded dipoles (b) and rarefaction pulses (c), identified based on their widths and connections with adjacent defects. Faster moving RDSs can also be seen near the boundary of expanded superfluids.
In summary, we observed very rich nonequilibrium dynamics and self-patterning with RDSs that emerged purely from a box quench. Both () and ordered () vortex dipole necklaces have been observed in Figs. 4 and 5, respectively. Even higher-order can be created with either a larger bulk chemical potential (for shorter-scale most unstable modes) or larger initial short-scale density perturbations (Appendix C). Our quench experiment demonstrates a new tool to generate dark solitons in versatile forms as well as ordered quantum vortex matter in a uniform box trap Navon et al. (2021). By incorporating box quenches together with interaction tuning using a Feshbach resonance, multiple RDSs Du et al. (2022); Niu and Gao (2023) and vortex dipole necklaces may be generated in one sample, thus creating complex vortex matter. It may be possible to trap a stationary RDS Theocharis et al. (2003) and further control its stability by applying a radial potential when Ma et al. (2010); Wang et al. (2015). By incorporating nondestructive imaging Serafini et al. (2017), our work can be extended to study inverted TI Toikka and Suominen (2013), persistent revivals and clusterization Crasovan et al. (2002); Möttönen et al. (2005); Pietilä et al. (2006); Cawte et al. (2021) of ordered vortex dipoles, and may open new ways to explore spontaneous clustering Simula et al. (2014); Billam et al. (2014); Kanai and Guo (2021) in 2D vortex matter.
Acknowledgments
We thank Eli Halperin, Qi Zhou, Samuel Alperin, Chih-Chun Chien, and Sergei Khlebnikov for discussions. This work is supported in part by the W. M. Keck Foundation, the NSF (Grant # PHY-1848316), and the DOE QuantISED program through the Fermilab Quantum Consortium.
Appendix A Preparation of a 2D superfluid
The detailed experimental apparatus is given in Ref. Chen and Hung (2020) with an updated objective lens (numerical aperture of approximately ). We begin the preparation of a Bose-Einstein condensate (BEC) of cesium atoms confined in an optical dipole trap with a horizontal (vertical) trap frequency of about (about ) through an evaporative cooling procedure. The -wave scattering length is then gradually decreased to a small value via a Feshbach resonance Chin et al. (2010), where is the Bohr radius. The BEC is then loaded into a 2D box potential. The vertical confinement of the box is provided by a single node of a repulsive standing-wave potential with periodicity. The measured vertical trap frequency in the node is (), deep in the 2D regime, where is the Boltzmann constant, nK is the temperature, is the chemical potential, and the reduced Plank constant. The atoms populate the vibrational ground state in the vertical trap with a harmonic oscillator length , where is the atomic mass. The horizontal confinement is arbitrarily configured via a blue-detuned light () patterned with a digital mirror device and projected through the objective lens. In this work, we use a circular box with an inner radius of approximately and a width of approximately . We obtain in situ density distributions of 2D gases by performing absorption imaging through the same objective lens and recording the image on a CCD camera. The image resolution is about . The atomic surface density is calibrated using a similar scheme as discussed in Ref. Hung (2011). The typical initial density is at a fixed 2D interaction strength . Shortly after the box potential height is quenched to the final strength (nK), the bulk density reduces to and remains roughly constant throughout the subsequent evolution, presumably due to the initial finite atom spilling over the box wall. The resulting healing length is , larger than our image resolution. This allows us to resolve individual vortices with spacing comparable to or smaller than the healing length. Note that in situ imaging of vortices has been demonstrated using a dark-field imaging technique Wilson et al. (2015) and, most recently, using high-resolution absorption imaging Kwon et al. (2021); Fletcher et al. (2021).
Appendix B Wave function and radial dynamics of a ring dark soliton
An RDS is a quasistationary solution of the time-dependent 2D Gross-Pitaevskii equation (GPE),
| (3) |
Assuming rotational symmetry, the wave function of a perfect RDS only has radial dependence. To good approximation, it can be written as
| (4) |
where is the radial position of the density defect, its depth, its radial velocity, and its characteristic width. Here, the background density , the healing length , the sound speed , and the chemical potential are the bulk properties of the superfluid. The radial motion , width , and depth are all related to each other; fixing one parameter completely determines the other two. A faster-(slower-)moving soliton would have a shallower (deeper) depth and a broader (narrower) density profile.
This radial wave function is essentially the dark soliton solution in 1D, except that it is perturbed by the Laplace term in the 2D GPE. A consequence of this perturbation is that slowly evolves as the radius of an RDS changes Kivshar and Yang (1994). The dynamics of an RDS differs from that of a 1D dark soliton. In particular, the soliton depth follows the relation
| (5) |
where and are the initial depth and radius of the RDS, determined at time . This additional equation further relates with . The depth increases (decreases) as the RDS shrinks (expands), and the width and radial velocity change accordingly.
An explanation for this radius-dependent dynamics is from energy conservation. As discussed in Ref. Brazhnyi et al. (2006), the energy of a 1D dark soliton is . For a dark soliton stripe in 2D, is the linear energy density. In a uniform medium, the total energy of an RDS is . For an adiabatic evolution with conserved RDS total energy, one must have , thus leading to the same result obtained from the perturbation theory Kivshar and Yang (1994).
Appendix C Time-dependent GPE simulation
We perform 2D GPE simulations Antoine and Duboscq (2014, 2015) to obtain numerical evidence of RDS emission in our quench protocol. The initial ground-state wave function is confined in a repulsive wall potential of the form
| (6) |
where is the trap strength, the box radius, and the experimentally calibrated width of the wall. In the time-dependent GPE, the trap strength is quenched from nK to the final value nK, and we evaluate the subsequent dynamics of the wave function. We note that, in the experiment, the wall has a radial Gaussian profile of finite width instead of the semi-infinite form taken in the GPE simulation. The former is responsible for finite atom spilling after the potential is quenched down. The results shown in Fig. 1 are calculated using atom number matching that of the initial experimental condition. While we have obtained qualitative one-to-one agreement of RDS emission and its subsequent evolution, the exact timing cannot be fully matched. The emitted RDS tends to move faster in the GPE simulation, and we have increased by about to increase the quench contrast, which slows down the RDS velocity. The slower RDS dynamics observed in the experiment may be due to finite atom spilling right after the quench, which leads to a lower sound speed and thus a lower RDS velocity.
To take into account density fluctuations in a superfluid, we imprint phase noise in the initial GPE wave function to simulate phonon excitations. Given an initial temperature (nK), we calculate the phonon populations according to the Bose-Einstein distribution plus zero-point fluctuations,
| (7) |
where is the Bogoliubov phonon dispersion relation. We populate random Bogoliubov phonon excitations in the ground-state wavefunction, with statistical amplitude variance in each mode matching . We then evolve the wave function in the time-dependent GPE. We have also taken into account total atom number fluctuations in the experiment, and performed a series of GPE calculations with . Given the range of temperature and atom number fluctuations, we numerically observe RDS fragmentation into necklaces of weakly bound vortex dipoles, tightly bound dipoles, or rarefaction pulses. Representative results are plotted in Fig. 4(b). Most of the necklaces consist of a chain of vortex dipoles or rarefaction pulses. Increasing the atom number or interaction strength , necklaces can be observed.
Appendix D Soliton detection algorithm
To obtain the position and size of an RDS, we measure mean density line cuts typically averaged over realizations equal to or greater than 5. By convolving the line cuts with a Gaussian kernel of a width around the healing length , we obtain a scale-space representation that suppresses features smaller than . A Laplacian of this convolution generates positive features for intensity minima, which correspond to the mean locations of dark stripes. These procedures are applied to the density line cuts obtained at different times to visualize the evolution of dark stripe locations, as shown in the right panel of Fig.2(a). We then extract the stripe speed and location. We perform the same analysis to averaged density line cuts along the axis, . With this information obtained from the mean line cuts along the two axes, we predict the time-dependent center and radius of RDSs in single-shot images; see red areas in Fig. 6. For the analysis of instability in RDSs (see Fig. 3) we use single-shot density profiles averaged in the radial interval .
Appendix E Vortex detection algorithm
At later times () after the box quench, an RDS breaks into vortices. They are detected using a scheme similar to a vortex image processing algorithm Rakonjac et al. (2016). For each single-shot in situ image [Fig. 7(b)], we calculate the residual [Fig. 7(c)] from the mean density profile [Fig. 7(a)] averaged over many experimental shots. We then apply a Laplacian of the Gaussian filter to enhance those defect structures having characteristic length scales of about . Then, we obtain defect positions marked by circles in Fig. 6(b). We note that the analysis is restricted to defects having nearly zero local density () to avoid spurious detections. Detected defects have a large variation in the azimuthal width, while the radial spread is comparable with around . The azimuthal width and position of each detected defect are analyzed as shown in Fig. 4(c).
Appendix F Pattern formation dynamics in GPE simulation
A series of GPE simulations with initially seeded random fluctuations are analyzed according to the presented data in Fig. 3 for further understanding the pattern formation by snaking instability in RDSs. We first determine the mean radius of generated RDSs and its motion from a radial density profile [Fig. 8(a)], averaged over multiple runs. We then analyze the angular density-density correlation function , where () represents the sample (azimuthal) average and is the azimuthal density at . As shown in Fig. 8(b), the simulated is consistent with the observation [Fig. 3(a) in the main text]. The RDSs have no significant modulation in their azimuthal density at early times, less than or around . However, at a later time when approaches its minimal value, exhibits strong angular correlation at and , corresponding necklace formation. At even later times, the angular correlation at ( mode) becomes comparable to the ones at and , resulting in the competition among those unstable modes.
In Fig. 8(c), we plot the dynamics of the Fourier spectrum, defined as . It marks the increase of the modulation amplitude only for lower angular frequency modes due to the finite instability band ; the mode dominates at , while approaches as the RDS shrinks. At , the and modes eventually display comparable amplitudes. This dynamics naturally appears in shrinking RDSs, supporting our experimental observation of mode competition dynamics in Figs. 3 (b) and 3(c). The detailed dynamics of is plotted in Fig. 8(d). We find that the amplifications in the prohibited band are incompletely terminated at . This can potentially be attributed to the contribution from adjacent RDSs [see panel (a)] or the evolution of phonon fluctuations that may not be sensitively detected in the experiment. Additionally, in the simulation, one can see a continuous reduction in at the early stage during which the wave function expands while solitary waves develop. Note that starts to grow once RDSs form.
Figures 8(e) and 8(f) compare the experimental data , as shown in Fig. 3(d), with the early-time growth rate , obtained from exponential fits as in Fig. 8(d). In Fig. 8(e), the observed exponential growth within is well reproduced by the simulation, except for an overall scaling constant adjusted to match the data, indicating that the observed rate is roughly 6 times lower than that in the simulation. We believe the slower rate observed in the experiment is due to the systematic effect of finite resolution of our imaging system and image noise, for example, photon shot noise, which adds to each measured Fourier amplitude an offset of about . We find that the offset can effectively reduce the fitted growth rates. To see those systematic effects, we convolute the GPE data with finite resolution and add the measured offsets to the GPE simulated amplitudes . We refit the growth rate and indeed find that it agrees well with experimentally determined values, as shown in Fig. 8(f).
References
- Matthews et al. (1999) M. R. Matthews, B. P. Anderson, P. Haljan, D. Hall, C. Wieman, and E. A. Cornell, Vortices in a Bose-Einstein condensate, Phys. Rev. Lett. 83, 2498 (1999).
- Madison et al. (2000) K. W. Madison, F. Chevy, W. Wohlleben, and J. Dalibard, Vortex formation in a stirred Bose-Einstein condensate, Phys. Rev. Lett. 84, 806 (2000).
- Abo-Shaeer et al. (2001) J. R. Abo-Shaeer, C. Raman, J. M. Vogels, and W. Ketterle, Observation of vortex lattices in Bose-Einstein condensates, Science 292, 476 (2001).
- Kwon et al. (2015) W. J. Kwon, S. W. Seo, and Y.-i. Shin, Periodic shedding of vortex dipoles from a moving penetrable obstacle in a Bose-Einstein condensate, Phys. Rev. A 92, 033613 (2015).
- Seo et al. (2017) S. W. Seo, B. Ko, J. H. Kim, and Y.-i. Shin, Observation of vortex-antivortex pairing in decaying 2D turbulence of a superfluid gas, Scientific Reports 7, 4587 (2017).
- Gauthier et al. (2019) G. Gauthier, M. T. Reeves, X. Yu, A. S. Bradley, M. A. Baker, T. A. Bell, H. Rubinsztein-Dunlop, M. J. Davis, and T. W. Neely, Giant vortex clusters in a two-dimensional quantum fluid, Science 364, 1264 (2019).
- Johnstone et al. (2019) S. P. Johnstone, A. J. Groszek, P. T. Starkey, C. J. Billington, T. P. Simula, and K. Helmerson, Evolution of large-scale flow from turbulence in a two-dimensional superfluid, Science 364, 1267 (2019).
- Bland et al. (2023) T. Bland, G. Lamporesi, M. J. Mark, and F. Ferlaino, Vortices in dipolar Bose-Einstein condensates, arXiv preprint arXiv:2303.13263 (2023).
- Kwon et al. (2021) W. Kwon, G. Del Pace, K. Xhani, L. Galantucci, A. Muzi Falconi, M. Inguscio, F. Scazza, and G. Roati, Sound emission and annihilations in a programmable quantum vortex collider, Nature 600, 64 (2021).
- Hernández-Rajkov et al. (2023) D. Hernández-Rajkov, N. Grani, F. Scazza, G. Del Pace, W. Kwon, M. Inguscio, K. Xhani, C. Fort, M. Modugno, F. Marino, et al., Universality of the superfluid Kelvin-Helmholtz instability by single-vortex tracking, arXiv preprint arXiv:2303.12631 (2023).
- Burger et al. (1999) S. Burger, K. Bongs, S. Dettmer, W. Ertmer, K. Sengstock, A. Sanpera, G. V. Shlyapnikov, and M. Lewenstein, Dark solitons in Bose-Einstein condensates, Phys. Rev. Lett. 83, 5198 (1999).
- Denschlag et al. (2000) J. Denschlag, J. E. Simsarian, D. L. Feder, C. W. Clark, L. A. Collins, J. Cubizolles, L. Deng, E. W. Hagley, K. Helmerson, W. P. Reinhardt, et al., Generating solitons by phase engineering of a Bose-Einstein condensate, Science 287, 97 (2000).
- Ku et al. (2016) M. J. H. Ku, B. Mukherjee, T. Yefsah, and M. W. Zwierlein, Cascade of solitonic excitations in a superfluid Fermi gas: From planar solitons to vortex rings and lines, Phys. Rev. Lett. 116, 045304 (2016).
- Dutton et al. (2001) Z. Dutton, M. Budde, C. Slowe, and L. V. Hau, Observation of quantum shock waves created with ultra-compressed slow light pulses in a Bose-Einstein condensate, Science 293, 663 (2001).
- Ginsberg et al. (2005) N. S. Ginsberg, J. Brand, and L. V. Hau, Observation of hybrid soliton vortex-ring structures in Bose-Einstein condensates, Phys. Rev. Lett. 94, 040403 (2005).
- Anderson et al. (2001) B. Anderson, P. Haljan, C. Regal, D. Feder, L. Collins, C. W. Clark, and E. A. Cornell, Watching dark solitons decay into vortex rings in a Bose-Einstein condensate, Phys. Rev. Lett. 86, 2926 (2001).
- Becker et al. (2008) C. Becker, S. Stellmer, P. Soltan-Panahi, S. Dörscher, M. Baumert, E.-M. Richter, J. Kronjäger, K. Bongs, and K. Sengstock, Oscillations and interactions of dark and dark–bright solitons in Bose–Einstein condensates, Nature Physics 4, 496 (2008).
- Weller et al. (2008) A. Weller, J. P. Ronzheimer, C. Gross, J. Esteve, M. K. Oberthaler, D. J. Frantzeskakis, G. Theocharis, and P. G. Kevrekidis, Experimental observation of oscillating and interacting matter wave dark solitons, Phys. Rev. Lett. 101, 130401 (2008).
- Shomroni et al. (2009) I. Shomroni, E. Lahoud, S. Levy, and J. Steinhauer, Evidence for an oscillating soliton/vortex ring by density engineering of a Bose–Einstein condensate, Nature Physics 5, 193 (2009).
- Chang et al. (2008) J. J. Chang, P. Engels, and M. A. Hoefer, Formation of dispersive shock waves by merging and splitting Bose-Einstein condensates, Phys. Rev. Lett. 101, 170404 (2008).
- Weiler et al. (2008) C. N. Weiler, T. W. Neely, D. R. Scherer, A. S. Bradley, M. J. Davis, and B. P. Anderson, Spontaneous vortices in the formation of Bose-Einstein condensates, Nature 455, 948 (2008).
- Freilich et al. (2010) D. Freilich, D. Bianchi, A. Kaufman, T. Langin, and D. Hall, Real-time dynamics of single vortex lines and vortex dipoles in a Bose-Einstein condensate, Science 329, 1182 (2010).
- Lamporesi et al. (2013) G. Lamporesi, S. Donadello, S. Serafini, F. Dalfovo, and G. Ferrari, Spontaneous creation of Kibble-Zurek solitons in a Bose-Einstein condensate, Nature Physics 9, 656 (2013).
- Chomaz et al. (2015) L. Chomaz, L. Corman, T. Bienaimé, R. Desbuquois, C. Weitenberg, S. Nascimbene, J. Beugnon, and J. Dalibard, Emergence of coherence via transverse condensation in a uniform quasi-two-dimensional Bose gas, Nature communications 6, 1 (2015).
- Ko et al. (2019) B. Ko, J. W. Park, and Y.-i. Shin, Kibble-Zurek universality in a strongly interacting Fermi superfluid, Nature Physics 15, 1227 (2019).
- Kevrekidis and Frantzeskakis (2004) P. G. Kevrekidis and D. J. Frantzeskakis, Pattern forming dynamical instabilities of Bose–Einstein condensates, Modern Physics Letters B 18, 173 (2004).
- Kivshar and Pelinovsky (2000) Y. S. Kivshar and D. E. Pelinovsky, Self-focusing and transverse instabilities of solitary waves, Physics Reports 331, 117 (2000).
- Becker et al. (2013) C. Becker, K. Sengstock, P. Schmelcher, P. Kevrekidis, and R. Carretero-González, Inelastic collisions of solitary waves in anisotropic Bose–Einstein condensates: sling-shot events and expanding collision bubbles, New Journal of Physics 15, 113028 (2013).
- Donadello et al. (2014) S. Donadello, S. Serafini, M. Tylutki, L. P. Pitaevskii, F. Dalfovo, G. Lamporesi, and G. Ferrari, Observation of solitonic vortices in Bose-Einstein condensates, Phys. Rev. Lett. 113, 065302 (2014).
- Kivshar and Yang (1994) Y. S. Kivshar and X. Yang, Ring dark solitons, Phys. Rev. E 50, R40 (1994).
- Kivshar and Luther-Davies (1998) Y. S. Kivshar and B. Luther-Davies, Dark optical solitons: physics and applications, Physics reports 298, 81 (1998).
- Frantzeskakis (2010) D. Frantzeskakis, Dark solitons in atomic Bose–Einsteincondensates: from theory to experiments, Journal of Physics A: Mathematical and Theoretical 43, 213001 (2010).
- Toikka and Suominen (2013) L. A. Toikka and K.-A. Suominen, Snake instability of ring dark solitons in toroidally trapped Bose–Einstein condensates, Phys. Rev. A 87, 043601 (2013).
- Theocharis et al. (2003) G. Theocharis, D. J. Frantzeskakis, P. G. Kevrekidis, B. A. Malomed, and Y. S. Kivshar, Ring dark solitons and vortex necklaces in Bose–Einstein condensates, Phys. Rev. Lett. 90, 120403 (2003).
- Pietilä et al. (2006) V. Pietilä, M. Möttönen, T. Isoshima, J. A. M. Huhtamäki, and S. M. M. Virtanen, Stability and dynamics of vortex clusters in nonrotated Bose-Einstein condensates, Phys. Rev. A 74, 023603 (2006).
- Crasovan et al. (2002) L.-C. Crasovan, G. Molina-Terriza, J. P. Torres, L. Torner, V. M. Pérez-García, and D. Mihalache, Globally linked vortex clusters in trapped wave fields, Phys. Rev. E 66, 036612 (2002).
- Möttönen et al. (2005) M. Möttönen, S. M. M. Virtanen, T. Isoshima, and M. M. Salomaa, Stationary vortex clusters in nonrotating Bose-Einstein condensates, Phys. Rev. A 71, 033626 (2005).
- Cawte et al. (2021) M. Cawte, M. Reeves, and A. Bradley, Neutral vortex necklace in a trapped planar superfluid, Journal of Low Temperature Physics 202, 310 (2021).
- Novikov (1975) E. Novikov, Dynamics and statistics of a system of vortices, Zh. Eksp. Teor. Fiz 68, 2 (1975).
- Toikka et al. (2013) L. Toikka, O. Kärki, and K. Suominen, Creation and revival of ring dark solitons in an annular Bose–Einstein condensate, Journal of Physics B: Atomic, Molecular and Optical Physics 47, 021002 (2013).
- Baluschev et al. (1995) S. Baluschev, A. Dreischuh, I. Velchev, S. Dinev, and O. Marazov, Generation and evolution of two-dimensional dark spatial solitons, Phys. Rev. E 52, 5517 (1995).
- Dreischuh et al. (2002) A. Dreischuh, D. Neshev, G. G. Paulus, F. Grasbon, and H. Walther, Ring dark solitary waves: Experiment versus theory, Phys. Rev. E 66, 066611 (2002).
- Hoefer et al. (2006) M. A. Hoefer, M. J. Ablowitz, I. Coddington, E. A. Cornell, P. Engels, and V. Schweikhard, Dispersive and classical shock waves in Bose-Einstein condensates and gas dynamics, Phys. Rev. A 74, 023623 (2006).
- Dominici et al. (2015) L. Dominici, M. Petrov, M. Matuszewski, D. Ballarini, M. De Giorgi, D. Colas, E. Cancellieri, B. Silva Fernández, A. Bramati, G. Gigli, et al., Real-space collapse of a polariton condensate, Nature communications 6, 1 (2015).
- Wan et al. (2007) W. Wan, S. Jia, and J. W. Fleischer, Dispersive superfluid-like shock waves in nonlinear optics, Nature Physics 3, 46 (2007).
- Navon et al. (2021) N. Navon, R. P. Smith, and Z. Hadzibabic, Quantum gases in optical boxes, Nature Physics 17, 1334 (2021).
- Halperin and Bohn (2020) E. J. Halperin and J. L. Bohn, Quench-produced solitons in a box-trapped Bose-Einstein condensate, Phys. Rev. Research 2, 043256 (2020).
- Gamayun et al. (2015) O. Gamayun, Y. V. Bezvershenko, and V. Cheianov, Fate of a gray soliton in a quenched Bose-Einstein condensate, Phys. Rev. A 91, 031605 (2015).
- Franchini et al. (2015) F. Franchini, A. Gromov, M. Kulkarni, and A. Trombettoni, Universal dynamics of a soliton after an interaction quench, Journal of Physics A: Mathematical and Theoretical 48, 28FT01 (2015).
- Ruostekoski et al. (2001) J. Ruostekoski, B. Kneer, W. P. Schleich, and G. Rempe, Interference of a Bose-Einstein condensate in a hard-wall trap: From the nonlinear Talbot effect to the formation of vorticity, Phys. Rev. A 63, 043613 (2001).
- Sciacca et al. (2017) M. Sciacca, C. F. Barenghi, and N. G. Parker, Matter-wave dark solitons in boxlike traps, Phys. Rev. A 95, 013628 (2017).
- Ma et al. (2010) M. Ma, R. Carretero-González, P. G. Kevrekidis, D. J. Frantzeskakis, and B. A. Malomed, Controlling the transverse instability of dark solitons and nucleation of vortices by a potential barrier, Phys. Rev. A 82, 023621 (2010).
- Jones and Roberts (1982) C. A. Jones and P. H. Roberts, Motions in a Bose condensate. IV. Axisymmetric solitary waves, Journal of Physics A: Mathematical and General 15, 2599 (1982).
- Jones et al. (1986) C. Jones, S. Putterman, and P. Roberts, Motions in a Bose condensate. V. Stability of solitary wave solutions of non-linear Schrödinger equations in two and three dimensions, Journal of Physics A: Mathematical and General 19, 2991 (1986).
- Kwon et al. (2014) W. J. Kwon, G. Moon, J.-y. Choi, S. W. Seo, and Y.-i. Shin, Relaxation of superfluid turbulence in highly oblate Bose-Einstein condensates, Phys. Rev. A 90, 063627 (2014).
- Meyer et al. (2017) N. Meyer, H. Proud, M. Perea-Ortiz, C. O’Neale, M. Baumert, M. Holynski, J. Kronjäger, G. Barontini, and K. Bongs, Observation of two-dimensional localized Jones-Roberts solitons in Bose-Einstein condensates, Phys. Rev. Lett. 119, 150403 (2017).
- Neely et al. (2010) T. W. Neely, E. C. Samson, A. S. Bradley, M. J. Davis, and B. P. Anderson, Observation of vortex dipoles in an oblate Bose-Einstein condensate, Phys. Rev. Lett. 104, 160401 (2010).
- Du et al. (2022) R. Du, J.-C. Xing, B. Xiong, J.-H. Zheng, and T. Yang, Quench dynamics of Bose–Einstein condensates in boxlike traps, Chinese Physics Letters 39, 070304 (2022).
- Niu and Gao (2023) Z.-X. Niu and C. Gao, Dynamical nonlinear excitations induced by interaction quench in a two-dimensional box-trapped Bose-Einstein condensate, arXiv preprint arXiv:2303.08972 (2023).
- Wang et al. (2015) W. Wang, P. G. Kevrekidis, R. Carretero-González, D. J. Frantzeskakis, T. J. Kaper, and M. Ma, Stabilization of ring dark solitons in Bose-Einstein condensates, Phys. Rev. A 92, 033611 (2015).
- Serafini et al. (2017) S. Serafini, L. Galantucci, E. Iseni, T. Bienaimé, R. N. Bisset, C. F. Barenghi, F. Dalfovo, G. Lamporesi, and G. Ferrari, Vortex reconnections and rebounds in trapped atomic Bose-Einstein condensates, Physical Review X 7, 021031 (2017).
- Simula et al. (2014) T. Simula, M. J. Davis, and K. Helmerson, Emergence of order from turbulence in an isolated planar superfluid, Phys. Rev. Lett. 113, 165302 (2014).
- Billam et al. (2014) T. P. Billam, M. T. Reeves, B. P. Anderson, and A. S. Bradley, Onsager-kraichnan condensation in decaying two-dimensional quantum turbulence, Phys. Rev. Lett. 112, 145301 (2014).
- Kanai and Guo (2021) T. Kanai and W. Guo, True mechanism of spontaneous order from turbulence in two-dimensional superfluid manifolds, Phys. Rev. Lett. 127, 095301 (2021).
- Chen and Hung (2020) C.-A. Chen and C.-L. Hung, Observation of universal quench dynamics and Townes soliton formation from modulational instability in two-dimensional Bose gases, Phys. Rev. Lett. 125, 250401 (2020).
- Chin et al. (2010) C. Chin, R. Grimm, P. Julienne, and E. Tiesinga, Feshbach resonances in ultracold gases, Rev. Mod. Phys. 82, 1225 (2010).
- Hung (2011) C.-L. Hung, In situ probing of two-dimensional quantum gases (The University of Chicago, 2011).
- Wilson et al. (2015) K. E. Wilson, Z. L. Newman, J. D. Lowney, and B. P. Anderson, In situ imaging of vortices in Bose-Einstein condensates, Phys. Rev. A 91, 023621 (2015).
- Fletcher et al. (2021) R. J. Fletcher, A. Shaffer, C. C. Wilson, P. B. Patel, Z. Yan, V. Crépel, B. Mukherjee, and M. W. Zwierlein, Geometric squeezing into the lowest landau level, Science 372, 1318 (2021).
- Brazhnyi et al. (2006) V. A. Brazhnyi, V. V. Konotop, and L. P. Pitaevskii, Dark solitons as quasiparticles in trapped condensates, Phys. Rev. A 73, 053601 (2006).
- Antoine and Duboscq (2014) X. Antoine and R. Duboscq, GPELab, a Matlab toolbox to solve Gross–Pitaevskii equations I: Computation of stationary solutions, Computer Physics Communications 185, 2969 (2014).
- Antoine and Duboscq (2015) X. Antoine and R. Duboscq, GPELab, a Matlab toolbox to solve Gross-Pitaevskii equations II: Dynamics and stochastic simulations, Computer Physics Communications 193, 95 (2015).
- Rakonjac et al. (2016) A. Rakonjac, A. L. Marchant, T. P. Billam, J. L. Helm, M. M. H. Yu, S. A. Gardiner, and S. L. Cornish, Measuring the disorder of vortex lattices in a Bose-Einstein condensate, Phys. Rev. A 93, 013607 (2016).