Disentangling lattice and electronic instabilities in the excitonic insulator candidate Ta2NiSe5 by nonequilibrium spectroscopy
Abstract
Ta2NiSe5 is an excitonic insulator candidate showing the semiconductor/semimetal-to-insulator (SI) transition below = 326 K. However, since a structural transition accompanies the SI transition, deciphering the role of electronic and lattice degrees of freedom in driving the SI transition has remained controversial. Here, we investigate the photoexcited nonequilibrium state in Ta2NiSe5 using pump-probe Raman and photoluminescence (PL) spectroscopies. The combined nonequilibrium spectroscopic measurements of the lattice and electronic states reveal the presence of a photoexcited metastable state where the insulating gap is suppressed, but the low-temperature structural distortion is preserved. We conclude that electron correlations play a vital role in the SI transition of Ta2NiSe5.
Many-body interactions in quantum materials are one of the main drivers of exotic ground states, such as Mott insulators, superconductors, and density waves. In narrow-gap semiconductors or semimetals, the Coulomb interaction between electrons and holes may lead to a spontaneous formation of excitons. These excitons are expected to condense and give rise to an unconventional insulating ground state called excitonic insulator [1, 2, 3, 4, 5]. Among the various excitonic insulator candidate materials, Ta2NiSe5 (TNS) is a prototypical example because it has a small, possibly vanishing, direct band gap [6, 7] and has no instability at finite wave-vector such as charge density wave order. With decreasing temperature, TNS exhibits a semiconductor/semimetal-to-insulator (SI) transition below the transition temperature = 326 K [8, 9], which has been associated with an excitonic insulator transition due to electronic correlations. This scenario is supported by the band flattening observed in angle-resolved photoemission spectroscopy (ARPES) [6, 7, 10, 11], and the opening of a large gap in optical spectra [9, 12, 13, 14]. Furthermore, the key role of electronic correlations in driving SI transition is supported by various theoretical studies [15, 16, 17, 18, 14], and by the observation of critical charge fluctuations near the SI transition by Raman scattering [19, 20, 21].
However, assessing the origin of the SI transition is complicated by the accompanying structural transition from a high-temperature orthorhombic phase to low-temperature monoclinic phase [8]. It has been argued that the monoclinic structural distortion induces the hybridization of the conduction and valence bands, resulting in the insulator gap opening [22, 23, 24]. In this scenario, the lattice degrees of freedom play a decisive, possibly dominant, role in the phase transition [25, 26, 27]. To date, the respective roles of electronic and lattice degrees of freedom in the SI phase transition of TNS remain an open question.
To investigate the origin of the SI transition in TNS, pump-probe spectroscopy is a promising technique because it can in principle, resolve the origin of the insulating gap using the inherently different timescales of the electronic and the lattice degrees of freedom [28, 29, 30]. For TNS, previous pump-probe experiments focused on the photoexcited dynamics of the insulating gap using time-resolved reflectivity [31, 32, 33, 34, 35] and Angle-Resolved Photo-Emission Spectroscopy (ARPES) [36, 37, 38, 39, 40, 41, 42, 43]. However, these measurements have yielded conflicting results, and how the nonequilibrium dynamics of the insulating gap correlates with the monoclinic distortion has not been clarified. Thus, a nonequilibrium approach that can simultaneously probe the insulating gap and the monoclinic distortion is desirable to resolve the origin of the SI transition of TNS.
In this letter, we report pump-probe Raman scattering and photoluminescence (PL) experiments performed with the aim of investigating both the structural symmetry breaking and the insulating gap dynamics of TNS following a destabilizing sub-picosecond optical pulse. Polarization-resolved transient Raman phonon spectra unambiguously demonstrate that the structural symmetry remains in the low-temperature monoclinic phase a few picoseconds after photoexcitation. In the electronic sector, we show that the SI transition is marked by the emergence of an emission peak which is activated by the opening of the insulating gap below . In the pump-probe spectrum, the PL emission intensity is suppressed to its equilibrium value at 300 K, indicating a photo-induced gap closing. Remarkably, the quenched emission signal persists at least 18 ps after the pump, signifying a metastable state with a collapsed gap but a robust monoclinic distortion. Our results indicate that the monoclinic distortion plays a marginal role in the opening of the insulating gap, leading us to conclude that the SI transition in TNS is electronic-driven.
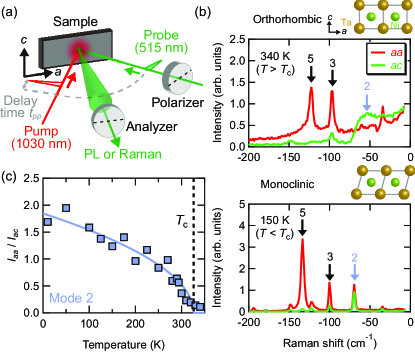
The schematic of the pump-probe Raman and PL experiments is illustrated in Fig. 1(a). The 1030-nm pump and 515-nm probe pulses are polarized along the -axis of the sample. The analyzer sets the polarization of the measured Raman or PL spectra to the -axis ( geometry) or -axis ( geometry). For the pump-probe Raman measurements, we tailored the probe pulse at 514.5 nm with a spectral width of 9 cm-1, resulting in a time resolution of 2.5 ps, while that in the pump-probe PL measurements was 700 fs. The details of the sample fabrication and experimental method are described in the Supplemental material (SM) [44]. Complementary equilibrium Raman and PL measurements were performed using the emission lines of an Ar/Kr laser and several solid-state lasers (see SM).
In Fig. 1(b), we present the equilibrium anti-Stokes Raman spectra using a continuous wave (CW) 514.5-nm laser. Here the choice to display the anti-Stokes spectrum is motivated by the comparison with the time-resolved Raman data discussed below (see also [44]). In the high-temperature orthorhombic phase at 340 K (the upper panel), the and geometries probe phonons with and representations, respectively (see also [44] for the complete temperature dependence of the Raman spectra and a discussion of Raman phonon selection rules in TNS). The equilibrium Raman phonon spectra agree with previously published results [45, 19, 20]. Hereafter, we will focus on three dominant phonon modes labeled 2, 3, and 5 following previous notations [19]). Of particular interest is the mode-2 phonon which corresponds to a monoclinic shearing motion of the Ta atoms and displays the most evident fingerprints of the structural transition. Above , the mode-2 phonon is observed only in the geometry as expected for a phonon. It exhibits a significant broadening which was previously ascribed to a strong electron-phonon coupling [19, 20, 21]. Below at 150 K (lower panel of Fig. 1(b)), the mode-2 phonon sharpens and becomes activated in the spectra because the and representations are no longer distinct in the low-temperature monoclinic phase [46, 19, 44]. Figure 1(c) plots the mode-2 phonon intensity ratio between the and geometry as a function of temperature. The ratio displays an increase below and is well fitted by ( is the fitting parameter), demonstrating that it serves as a reporter of the monoclinic distortion below .

Having established that the mode-2 phonon probes the structural symmetry breaking below , we now describe the pump-probe Raman results. All the pump-probe measurements were performed at the spot temperature of 150 K, estimated using the probe-only Stokes-anti-Stokes relation for the mode-5 phonon [44, 46]. Figure 2(a) shows the transient anti-Stokes spectra with the incoming pump fluence of 1.7 mJ/cm2 measured at selected pump-probe delay time . As described in SM, the anti-Stokes spectra above cm-1 are blocked by the edge filter and not shown [44]. Corresponding Stokes spectra were also measured, but with a higher energy cut-off which hinders the mode-2 phonon [44]. Upon photoexcitation for the geometry, the mode-2 and mode-3 phonon intensities increase, whereas the mode-5 phonon intensity decreases. As discussed in the SM, these behaviors result from a combination of pump-induced increases in the phonon population and pump-induced changes in the phonon Raman response [44].

The mode-2 phonon intensity ratio as a function of is summarized in Fig. 2(b). For the largest fluence, a significant weakening of the monoclinic distortion during the first few picoseconds is observed. It is followed by a recovery to a metastable value close to the equilibrium value at 150 K after 15 ps. Interestingly, for all the measured delay times and all the pump fluences, remains finite, indicating a preserved monoclinic distortion. While we cannot discard the possibility that the structural symmetry switches to the high-temperature orthorhombic phase during the first few picoseconds due to the limited time resolution, this result evidences that at least after = 5 ps, the structural symmetry remains in the low-temperature monoclinic phase at all fluences.
Next, we investigate the spectra at higher Raman shifts. Figure 3(a) shows the temperature-dependence of the equilibrium Raman spectra using a CW laser wavelength of . Above , the spectrum displays a broad peak that gains considerable intensity upon cooling below . As shown in Fig. S2(a) of the SM, the position of the peak, when plotted in terms of Raman shift, significantly depends on the CW laser wavelength . Instead, it coincides when plotted as a function of the emitted photon energy, demonstrating that the observed peak is not a Raman but a PL process, where the photoexcited electron-hole pairs first relax before recombining by emitting a photon, as schematically shown in Fig. 3(b). We note that our measurement and its associated interpretation contradict an earlier report where the peak in the insulating phase was assigned to an electronic Raman process across the insulating gap [20]. The peak emission energy, 1.9 eV, is significantly larger than the insulating-gap energy 160 meV reported in previous optical spectroscopy measurements [9, 12, 13, 14], indicating that the PL process does not correspond to recombination across the insulating gap. We assign it to non-thermalized "hot" PL [47] where excited high-energy conduction band electrons recombine with holes in the top-most valence band before fully thermalizing (or equivalently, low-energy valence band holes recombine with electrons in the lowest conduction band, as depicted in Fig. 3(b)). The enhanced PL emission below is assigned to the opening of the insulating gap, which quenches non-radiative recombination processes involving phonon emission, thus significantly increasing the efficiency of PL radiative processes [48].

Transient PL spectra at 150 K with the incident pump fluence of 1.6 mJ/cm2 are shown in Fig. 4(a). Right after the pump pulse ( 2 ps), the PL intensity shows an overall increase, while it decreases after = 2 ps. We attribute the initial enhancement of the PL intensity to pump-induced excess holes/electrons in the valence/conduction band, which increase the occupancy factors governing the PL process [48]. It could also be linked to a pump-induced transient increase of the insulating gap as reported in the previous pump-probe ARPES measurements [36, 41]. Remarkably, the initial increase is followed by a substantial reduction of the PL intensity, which sustains up to 18 ps. Fig. 4(b) shows that the PL spectra at selected delays after 3.5 ps is almost identical to the probe-only spectrum at 300 K. This is further illustrated by the transient PL integrated area, which falls slightly below that of the 300 K equilibrium spectra over the whole time window, with hardly any time dependence from 3.5 ps to at least 18 ps (Fig. 4(c)), suggesting a metastable state with a collapsed insulating gap. Crucially, since the pump-probe Raman results displayed in Fig. 2(b) demonstrate that the crystal remains in the low-temperature monoclinic phase over the same time window, we can conclude that the monoclinic structural distortion plays a marginal role in the insulating-gap formation below . Our results thus support a leading role for electron correlations in establishing the insulating phase.
We now discuss the possible origins of the observed metastable state. Within an excitonic insulator picture, the metastable state can be ascribed to the photoexcited carriers, which screen the Coulomb interaction and prevent the reformation of excitons as proposed in [36, 43]. Another possibility is a structural change, distinct from the monoclinic one, which would significantly weaken the electronic instability responsible for the insulating gap. Indeed, recent mean-field calculations with a realistic electronic band structure of TNS suggest that an electronically driven insulating phase is only realized in a rather narrow parameter space of on-site and inter-site Coulomb interactions, thus making it highly susceptible to even small changes in the lattice structure [23, 27].
In fact, fingerprints of metastable structural changes are observed in the transient Raman phonon spectra. In particular, the intensity and peak position of the mode-5 phonon do not relax to the values in equilibrium even at = 59 ps, as shown in Fig. 2(a). The shift in the mode-5 phonon energy presented in Fig. S5(c) is sizable ( 3 cm-1 at = 59 ps) and cannot be ascribed to a transient heating effect since the temperature of the mode-5 phonon relaxes within 10 ps (Fig. S5(g)). We note that the mode-5 phonon belongs to the symmetry preserving the representation in the orthorhombic phase. It involves mostly Se and Ni atomic motions perpendicular to the Ta/Ni chain direction and not the shearing motion of the Ta atoms responsible for the monoclinic phase [40]. The observed phonon shift may be indicative of a slight lattice distortion that stabilizes the observed gapless metastable state. Time-resolved X-ray or electron diffraction measurements using a similar pump fluence regime are desirable to confirm this scenario.
In summary, our combined pump-probe Raman and PL spectroscopic measurements on TNS reveal the presence of a long-lived metastable state with a collapsed insulating gap, but a preserved monoclinic lattice distortion. These results lead us to conclude that the insulating-gap formation cannot be explained solely by the structural distortion, and hence that electron correlations play a leading role. The transient Raman phonon data suggest that a pump-induced lattice distortion, distinct from the monoclinic one, might be responsible for the pump-induced metastable state.
We acknowledge Alaska Subedi for fruitful discussions. ANR (Agence Nationale de la Recherche) and CGI (Commissariat Général à l’Investissement) are acknowledged for their financial support of this work through Labex SEAM (Science and Engineering for Advanced Materials and devices), ANR-10-LABX-0096 and ANR-18-IDEX-0001. This work was also supported by a DIM SIRTEQ grant from Ile-de-France region and an Emergence grant from IDEX Université Paris Cité.
References
- Mott [1961] N. F. Mott, The Philosophical Magazine: A Journal of Theoretical Experimental and Applied Physics 6, 287 (1961).
- Cloizeaux [1965] J. D. Cloizeaux, J. Phys. Chem. Solids 26, 259 (1965).
- Jérome et al. [1967] D. Jérome, T. M. Rice, and W. Kohn, Phys. Rev. 158, 462 (1967).
- Kohn [1967] W. Kohn, Phys. Rev. Lett. 19, 439 (1967).
- Halperin and Rice [1968] B. I. Halperin and T. M. Rice, Rev. Mod. Phys. 40, 755 (1968).
- Wakisaka et al. [2009] Y. Wakisaka, T. Sudayama, K. Takubo, T. Mizokawa, M. Arita, H. Namatame, M. Taniguchi, N. Katayama, M. Nohara, and H. Takagi, Phys. Rev. Lett. 103, 026402 (2009).
- Wakisaka et al. [2012] Y. Wakisaka, T. Sudayama, K. Takubo, T. Mizokawa, N. L. Saini, M. Arita, H. Namatame, M. Taniguchi, N. Katayama, M. Nohara, and H. Takagi, J. Supercond. Nov. Magn. 25, 1231 (2012).
- Di Salvo et al. [1986] F. J. Di Salvo, C. H. Chen, R. M. Fleming, J. V. Waszczak, R. G. Dunn, S. A. Sunshine, and J. A. Ibers, J. less-common met. 116, 51 (1986).
- Lu et al. [2017] Y. F. Lu, H. Kono, T. I. Larkin, A. W. Rost, T. Takayama, A. V. Boris, B. Keimer, and H. Takagi, Nat. Commun. 8, 14408 (2017).
- Seki et al. [2014] K. Seki, Y. Wakisaka, T. Kaneko, T. Toriyama, T. Konishi, T. Sudayama, N. L. Saini, M. Arita, H. Namatame, M. Taniguchi, N. Katayama, M. Nohara, H. Takagi, T. Mizokawa, and Y. Ohta, Phys. Rev. B 90, 155116 (2014).
- Fukutani et al. [2021] K. Fukutani, R. Stania, C. Il Kwon, J. S. Kim, K. J. Kong, J. Kim, and H. W. Yeom, Nat. Phys. 17, 1024 (2021).
- Larkin et al. [2017] T. I. Larkin, A. N. Yaresko, D. Pröpper, K. A. Kikoin, Y. F. Lu, T. Takayama, Y. L. Mathis, A. W. Rost, H. Takagi, B. Keimer, and A. V. Boris, Phys. Rev. B 95, 195144 (2017).
- Larkin et al. [2018] T. I. Larkin, R. D. Dawson, M. Höppner, T. Takayama, M. Isobe, Y. L. Mathis, H. Takagi, B. Keimer, and A. V. Boris, Phys. Rev. B 98, 125113 (2018).
- Sugimoto et al. [2018] K. Sugimoto, S. Nishimoto, T. Kaneko, and Y. Ohta, Phys. Rev. Lett. 120, 247602 (2018).
- Kaneko et al. [2013] T. Kaneko, T. Toriyama, T. Konishi, and Y. Ohta, Phys. Rev. B 87, 035121 (2013).
- Ejima et al. [2014] S. Ejima, T. Kaneko, Y. Ohta, and H. Fehske, Phys. Rev. Lett. 112, 026401 (2014).
- Sugimoto et al. [2016] K. Sugimoto, T. Kaneko, and Y. Ohta, Phys. Rev. B 93, 041105 (2016).
- Yamada et al. [2016] T. Yamada, K. Domon, and Y. Ōno, J. Phys. Soc. Japan 85, 053703 (2016).
- Kim et al. [2021] K. Kim, H. Kim, J. Kim, C. Kwon, J. S. Kim, and B. J. Kim, Nat. Commun. 12, 1969 (2021).
- Volkov et al. [2021] P. A. Volkov, M. Ye, H. Lohani, I. Feldman, A. Kanigel, and G. Blumberg, npj Quantum Mater. 6, 52 (2021).
- Ye et al. [2021] M. Ye, P. A. Volkov, H. Lohani, I. Feldman, M. Kim, A. Kanigel, and G. Blumberg, Phys. Rev. B 104, 045102 (2021).
- Nakano et al. [2018] A. Nakano, T. Hasegawa, S. Tamura, N. Katayama, S. Tsutsui, and H. Sawa, Phys. Rev. B 98, 045139 (2018).
- Mazza et al. [2020] G. Mazza, M. Rosner, L. Windgätter, S. Latini, H. Hubener, A. J. Millis, A. Rubio, and A. Georges, Phys. Rev. Lett. 124, 197601 (2020).
- Watson et al. [2020] M. D. Watson, I. Marković, E. A. Morales, P. Le Fèvre, M. Merz, A. A. Haghighirad, and P. D. C. King, Phys. Rev. Res. 2, 013236 (2020).
- Zenker et al. [2014] B. Zenker, H. Fehske, and H. Beck, Phys. Rev. B 90, 195118 (2014).
- Subedi [2020] A. Subedi, Phys. Rev. Mater. 4, 083601 (2020).
- Windgätter et al. [2021] L. Windgätter, M. Rösner, G. Mazza, H. Hübener, A. Georges, A. J. Millis, S. Latini, and A. Rubio, npj Comput. Mater. 7, 210 (2021).
- Hellmann et al. [2012] S. Hellmann, T. Rohwer, M. Kalläne, K. Hanff, C. Sohrt, A. Stange, A. Carr, M. M. Murnane, H. C. Kapteyn, L. Kipp, M. Bauer, and K. Rossnagel, Nat. Commun. 3, 1069 (2012).
- Giannetti et al. [2016] C. Giannetti, M. Capone, D. Fausti, M. Fabrizio, F. Parmigiani, and D. Mihailovic, Advances in Physics 65, 58 (2016).
- Lloyd-Hughes et al. [2021] J. Lloyd-Hughes, P. M. Oppeneer, T. P. dos Santos, A. Schleife, S. Meng, M. A. Sentef, M. Ruggenthaler, A. Rubio, I. Radu, M. Murnane, X. Shi, H. Kapteyn, B. Stadtmüller, K. M. Dani, F. H. da Jornada, E. Prinz, M. Aeschlimann, R. L. Milot, M. Burdanova, J. Boland, T. Cocker, and F. Hegmann, J. Phys. Condens. Matter 33, 353001 (2021).
- Mor et al. [2018] S. Mor, M. Herzog, J. Noack, N. Katayama, M. Nohara, H. Takagi, A. Trunschke, T. Mizokawa, C. Monney, and J. Stähler, Phys. Rev. B 97, 115154 (2018).
- Werdehausen et al. [2018] D. Werdehausen, T. Takayama, M. Höppner, G. Albrecht, W. Rost Andreas, Y. Lu, D. Manske, H. Takagi, and S. Kaiser, Sci. Adv. 4, eaap8652 (2018).
- Bretscher et al. [2021] H. M. Bretscher, P. Andrich, P. Telang, A. Singh, L. Harnagea, A. K. Sood, and A. Rao, Nat. Commun. 12, 1699 (2021).
- Liu et al. [2021] Q. M. Liu, D. Wu, Z. A. Li, L. Y. Shi, Z. X. Wang, S. J. Zhang, T. Lin, T. C. Hu, H. F. Tian, J. Q. Li, T. Dong, and N. L. Wang, Nat. Commun. 12, 2050 (2021).
- Miyamoto et al. [2022] T. Miyamoto, M. Mizui, N. Takamura, J. Hirata, H. Yamakawa, T. Morimoto, T. Terashige, N. Kida, A. Nakano, H. Sawa, and H. Okamoto, J. Phys. Soc. Japan 91, 023701 (2022).
- Mor et al. [2017] S. Mor, M. Herzog, D. Golez, P. Werner, M. Eckstein, N. Katayama, M. Nohara, H. Takagi, T. Mizokawa, C. Monney, and J. Stahler, Phys. Rev. Lett. 119, 086401 (2017).
- Okazaki et al. [2018] K. Okazaki, Y. Ogawa, T. Suzuki, T. Yamamoto, T. Someya, S. Michimae, M. Watanabe, Y. Lu, M. Nohara, H. Takagi, N. Katayama, H. Sawa, M. Fujisawa, T. Kanai, N. Ishii, J. Itatani, T. Mizokawa, and S. Shin, Nat. Commun. 9, 4322 (2018).
- Tang et al. [2020] T. Tang, H. Wang, S. Duan, Y. Yang, C. Huang, Y. Guo, D. Qian, and W. Zhang, Phys. Rev. B 101, 235148 (2020).
- Baldini et al. [2020] E. Baldini, A. Zong, D. Choi, C. Lee, M. H. Michael, L. Windgaetter, I. I. Mazin, S. Latini, D. Azoury, B. Lv, et al., arXiv preprint arXiv:2007.02909 (2020).
- Suzuki et al. [2021] T. Suzuki, Y. Shinohara, Y. Lu, M. Watanabe, J. Xu, K. L. Ishikawa, H. Takagi, M. Nohara, N. Katayama, H. Sawa, M. Fujisawa, T. Kanai, J. Itatani, T. Mizokawa, S. Shin, and K. Okazaki, Phys. Rev. B 103, L121105 (2021).
- Golez et al. [2021] D. Golez, S. K. Dufresne, M.-J. Kim, F. Boschini, H. Chu, Y. Murakami, G. Levy, A. K. Mills, S. Zhdanovich, and M. Isobe, arXiv preprint arXiv:2112.06298 (2021).
- Saha et al. [2021] T. Saha, D. Golež, G. De Ninno, J. Mravlje, Y. Murakami, B. Ressel, M. Stupar, and P. R. Ribič, Phys. Rev. B 103, 144304 (2021).
- Mor et al. [2022] S. Mor, M. Herzog, C. Monney, and J. Stähler, Prog. Surf. Sci. , 100679 (2022).
- [44] See Supplemental Material for the details of the experimental setup, data analysis, and the additional data .
- Kim et al. [2020] M.-J. Kim, A. Schulz, T. Takayama, M. Isobe, H. Takagi, and S. Kaiser, Phys. Rev. Res. 2, 042039(R) (2020).
- [46] W. Hayes and R. Loudon, Scattering of Light by Crystals, Dover Books on Physics.
- Yu and Cardona [2001] P. Yu and M. Cardona, Fundamentals of Semiconductors, Advanced Text in Physics (Springer, 2001).
- Fox [2010] M. Fox, Optical Properties of Solids, Oxford Master Series in Physics (OUP Oxford, 2010).