XGAPS: a sub-arcsecond cross-match of Galactic Plane Surveys
Abstract
We present a sub-arcsecond cross-match of Gaia Data Release 3 (DR3) against the INT Galactic Plane Surveys (IGAPS) and the United Kingdom Infrared Deep Sky Survey (UKIDSS). The resulting cross-match of Galactic Plane Surveys (XGAPS) provides additional precise photometry (, , , , H, , and ) to the Gaia photometry. In building the catalogue, proper motions given in Gaia DR3 are wound back to match the epochs of the IGAPS constituent surveys (INT Photometric HSurvey of the Northern Galactic Plane, IPHAS, and the UV-Excess Survey of the northern Galactic plane, UVEX) and UKIDSS, ensuring high proper motion objects are appropriately cross-matched. The catalogue contains 33,987,180 sources. The requirement of parallax detection for every included source means that distances out to 1–1.5 kpc are well covered. In producing XGAPS we have also trained a Random Forest classifier to discern targets with problematic astrometric solutions. Selection cuts based on the classifier results can be used to clean colour-magnitude and colour-colour diagrams in a controlled and justified manner, as well as producing subsets of astrometrically reliable targets. We provide XGAPS as a 111 column table. Uses of the catalogue include the selection of Galactic targets for multi-object spectroscopic surveys as well as identification of specific Galactic populations.
keywords:
catalogues – surveys – parallaxes – proper motions – stars:emission-line – Galaxy: stellar content1 Introduction
The European Space Agency’s Gaia mission (Gaia Collaboration et al. 2016) Early Data Release 3 (EDR3) provides photometry in the , and bands, as well as precise astrometry and parallax measurements for over 1.5 billion sources (Gaia Collaboration et al. 2021a; Lindegren et al. 2021a; Fabricius et al. 2021; Lindegren et al. 2021b). Although the absolute number of sources is comparable to Gaia Data Release 2 (DR2; Gaia Collaboration et al. 2018; Lindegren et al. 2018; Arenou et al. 2018; Riello et al. 2018; Luri et al. 2018), the astrometric and photometric precision has drastically improved thanks to a 3-fold increase in the celestial reference sources and longer data collection baseline (22 vs 34 months), as well as an updated and improved processing pipeline (Lindegren et al. 2021a). This quantity and quality is defining a new standard for Galactic studies. The more recent Gaia Data Release 3 (DR3) augments EDR3 by providing additional information on some detected targets such as variability indicators, radial velocity, binary star information, as well as low-resolution spectra for >200 million sources (e.g. Babusiaux et al. 2022; Eyer et al. 2022; Frémat et al. 2022; Gaia Collaboration et al. 2022a; De Angeli et al. 2022).
The INT/WFC Photometric H Survey of the Northern Galactic Plane (IPHAS; Drew et al. 2005) is the first comprehensive digital survey of the northern Galactic disc (), covering a Galactic longitude range of . The IPHAS observations are obtained using the Wide Field Camera (WFC) at the prime focus of the 2.5m Isaac Newton Telescope (INT) on La Palma, Spain. IPHAS images are taken through three filters: a narrow-band H, and two broad-band Sloan and filters. The UV-Excess Survey of the northern Galactic Plane (UVEX; Groot et al. 2009) has covered the same footprint as IPHAS using the same WFC on the INT in the two broad-band Sloan and filters as well as a Sloan -like filter. Exposures are set to reach an -band depth of in both surveys. Pipeline data reduction for both surveys is handled by the Cambridge Astronomical Survey Unit (CASU). Further details on the data acquisition and pipeline reduction can be found in Drew et al. (2005), Groot et al. (2009) and González-Solares et al. (2008). A defining feature of both these surveys are the quasi-contemporaneous observations of each filter set so as to recover reliable colour information for sources without the contributing effects of variability on timescales longer than minutes. This same characteristic is also shared by the Gaia mission. Recently Monguió et al. (2020) has produced the IGAPS merged catalogue of IPHAS and UVEX observations, while Greimel et al. (2021) provides the IGAPS images. Additionally to merging the sources observed by both IPHAS and UVEX, a global photometric calibration has been performed on IGAPS, which resulted in photometry being internally reproducible to 0.02 magnitudes (up to magnitudes of , depending on the band) for all except the band. Furthermore, this 174-column catalogue provides astrometry for both the IPHAS and UVEX observations as well as the observation epoch, which allows to perform a precise cross-match with Gaia given the proper motion information provided. The astrometric solution of IGAPS is based on Gaia DR2. Although no per source errors are available, the astrometric solution yields typical astrometric errors in the band of 38mas.
The United Kingdom Infrared Deep Sky Survey (UKIDSS; Lawrence et al. 2007) is composed of five public surveys of varying depth and area coverage which began in May 2005. UKIDSS uses the Wide Field Camera (WFCAM, see Casali et al. 2007) on the United Kingdom Infrared Telescope (UKIRT). All data is reduced and calibrated at the Cambridge Astronomical Survey Unit (CASU) using a dedicated software pipeline and are then transferred to the WFCAM Science Archive (WSA; Hambly et al. 2008) in Edinburgh. There, the data are ingested and detections in the different passbands are merged. The UKIDSS Galactic Plane Survey (GPS; Lucas et al. 2008) is one of the five UKIDSS public surveys. UKIDSS GPS covers most of the northern Galactic plane in the , and filters for objects with declination less than 60 degrees, and contains in excess of a billion sources. We use in this work UKIDSS/GPS Data Release 11 (DR11). Similarly to IGAPS, no per source errors are available, but the astrometric solution of UKIDSS based on Gaia DR2 yields a typical astrometric error of 90 mas.
Scaringi et al. (2018) described and provided a sub-arcsecond cross-match of Gaia DR2 against IPHAS. The resulting value-added catalogue provided additional precise photometry for close to 8 million sources in the northern Galactic plane in the , , and H bands. This paper describes a sub-arcsecond cross-match between Gaia/DR3, IGAPS and UKIDSS GPS. Similarly to Scaringi et al. (2018) this cross-match of northern Galactic plane surveys (XGAPS) takes into account the different epochs of observations of all surveys and the Gaia astrometric information (including proper motions) to achieve sub-arcsecond precision when cross-matching the various surveys. XGAPS provides photometry in up to 9 photometric bands (, , , , H, , , , , and ) for 33,987,180 sources. XGAPS also provides a quality flag indicating the reliability of the Gaia astrometric solution for each source, which has been inferred through the use of Random Forests (Breiman 2001). Section 2 describes our cross-matching procedure, including the preliminary selection cuts applied to all datasets. Section 3 describes the machine learning model (using Random Forests) to train and select sources from the XGAPS catalogue which can be considered to have reliable Gaia astrometry, while Section 4 describes a potential application for selecting blue-excess sources for spectroscopic follow-up. Finally conclusions are drawn in Section 5, and the catalogue format is summarised in the appendix.
2 Cross-matching Gaia with IGAPS and UKIDSS
The aim of XGAPS is to cross-match all sources detected in IGAPS (either IPHAS or UVEX) to Gaia DR3, and as a second step cross-match those sources to UKIDSS. The cross match is restricted to sources with a significant Gaia DR3 parallax detection and IGAPS sources identified as being stellar-like.
2.1 Selection cuts
Before the cross-match some selection cuts are applied to the master catalogues.
From Gaia DR3 only objects satisfying the following are selected:
-
•
Are within an area slightly larger than the IGAPS footprint ( and )
-
•
Have a signal-to-noise -band detection above 3 (phot_g_mean_flux_over_error>3);
-
•
Have a signal-to-noise parallax measurement above 3 (parallax_over_error>3).
This results in 41,572,231 sources. For reference, the removal of the two signal-to-noise limits would result in 240,725,104 Gaia DR3 sources within the IGAPS footprint. The parallax signal-to-noise limit ensures distances up to 1–1.5 kpc are well covered.
Because IGAPS is already a merge between IPHAS and UVEX, the selection cuts are applied to the individual surveys. For IPHAS detections, sources are retained only if the , and H detections are not flagged as either saturated, vignetted, contaminated by bad pixels, flagged as noise-like, or truncated at the edge of the CCD. For UVEX the same cut as IPHAS is applied to the , , detections with the additional constraint that detections are not located in the degraded area of the -band filter. Of the 295.4 million sources in IGAPS, 212,378,160 are retained through the IPHAS selection cuts and 221,495,812 are retained through the UVEX ones.
Finally the UKIDSS Galactic Plane Survey Point Source Catalogue contains 235,696,744 sources within and (no selection cuts applied). These three master catalogues will form the basis of XGAPS.
2.2 Proper motion corrections and cross-matching
To minimise mismatches between the Gaia DR3 and IGAPS, as well as recovering fast moving objects, it is important to take into account the proper motion of targets and reference epoch of all observations. Gaia DR3 provides proper motion for all systems satisfying the required quality cuts, and have astrometric measurements quoted to epoch J2016 for all sources. Because of the survey design, IGAPS does not provide proper motion information for targets, but does provide the epoch of observation for all targets individually.
Ideally, for precise cross-matching between the catalogues, the Gaia astrometry would have to be propagated to the IGAPS epoch of observation for each source individually before cross-matching is performed. This approach becomes unfeasible when considering large data tables. The approach used instead is similar to that used by Scaringi et al. (2018), but modified for IGAPS. The first step is to separate the merged IGAPS catalogue back into its IPHAS and UVEX constituents. This is because the epoch of observation is different between the two surveys. The next step is to separate the split IPHAS/UVEX catalogues into monthly batches based on the start of the -band observation obtained for each individual IPHAS or UVEX detection separately. Because of the observing strategy of both IPHAS and UVEX, which sequentially observe all bands immediately following each other, we take the epoch of a particular target to be the start of the -band observation as being representative of all other observations for that target. This ensures that the epoch-corrected positional uncertainty of the Gaia catalogue is relativity small even for high proper motion objects. For example, the recomputed Gaia coordinates for an object with an extreme proper motion of ”/year should be at worst ” off the IGAPS position (if the epoch used was wrong by half a month).
Each corresponding IPHAS and UVEX monthly batch is then cross-matched with the master Gaia DR3 catalogue after having recomputed the Gaia astrometry to the mid-point epoch for each month. We then select the best positional closest Gaia DR3 match in the sky within a generous 1” of a given IPHAS or UVEX entry. This results in a cross-match for each month and for each of the two IPHAS and UVEX surveys individually. Overall, 34,252,452 sources from IGAPS find a counterpart within Gaia DR3. These are split into 32,138,484 sources with detections in both IPHAS and UVEX, 1,562,330 sources with IPHAS-only detections, and 551,638 sources with UVEX-only detections. Inevitably there will be duplicated entries where multiple IPHAS or UVEX sources will have matched to the same Gaia DR3 source. These duplicate matches (265,272 of them) are removed by first concatenating all matched sources from the monthly batches for both IPHAS and UVEX together, and then performing an internal cross-match based solely on the unique Gaia DR3 source ID. Where multiple entries are encountered, preference is given, in order, to (i) sources that have both IPHAS and UVEX observation and (ii) have the smallest sky separation between the respective IPHAS/UVEX entry and Gaia DR3. At this stage the only duplicate entries present are those already flagged by Gaia DR3. These sources are retained, but can be easily removed at a later stage if required. The final number of sources in the XGAPS catalogue is 33,987,180.
Having obtained a sub-arcsecond cross-match between IGAPS and Gaia DR3 the next step is to cross-match these with the UKIDSS GPS point source catalogue. A similar procedure is performed, where the UKIDSS data is first split into monthly batches based on the epoch of observation. These monthly batches are then cross-matched to the 33+ million sources based on the epoch corrected Gaia DR3 sky positions, resulting in 21,240,420 pairs. Duplicate UKIDSS matches (48 of them) are removed based on the Gaia DR3 source ID as previously done with the IGAPS cross-match, retaining the closest UKIDSS match to the corresponding Gaia source. Thus the total number of cross-matched UKIDSS sources is 21,240,381. It is important to note that although all sources in XGAPS will have Gaia DR3 information as well as either IPHAS or UVEX (or both), not all will necessarily have a UKIDSS counterpart.
The selection cuts described in Section 2 may introduce a number of mismatches between the IGAPS catalogues and the epoch-corrected Gaia catalogue. These miss-matches may arise due to crowding in the Galactic plane, and can be mostly attributed to the selection on phot_g_mean_flux_over_error>3. A more detailed analysis of this effect has already been discussed in Scaringi et al. (2018). What was found is an upper limit of 0.1% on the fraction of mismatches associated with their selection cut of phot_g_mean_flux_over_error>5 in some of the most crowded regions of the Galactic plane mostly affecting the faintest sources. For XGAPS it is expected that the number of miss-matches is even lower than the 0.1% miss-match fraction quoted in Scaringi et al. (2018) as the selection cut now includes many more Gaia sources. The next section also introduces an additional quality flag that can be used to further clean erroneous matches and/or targets that have spurious astrometric solutions.
3 Cleaning XGAPS with Random Forests
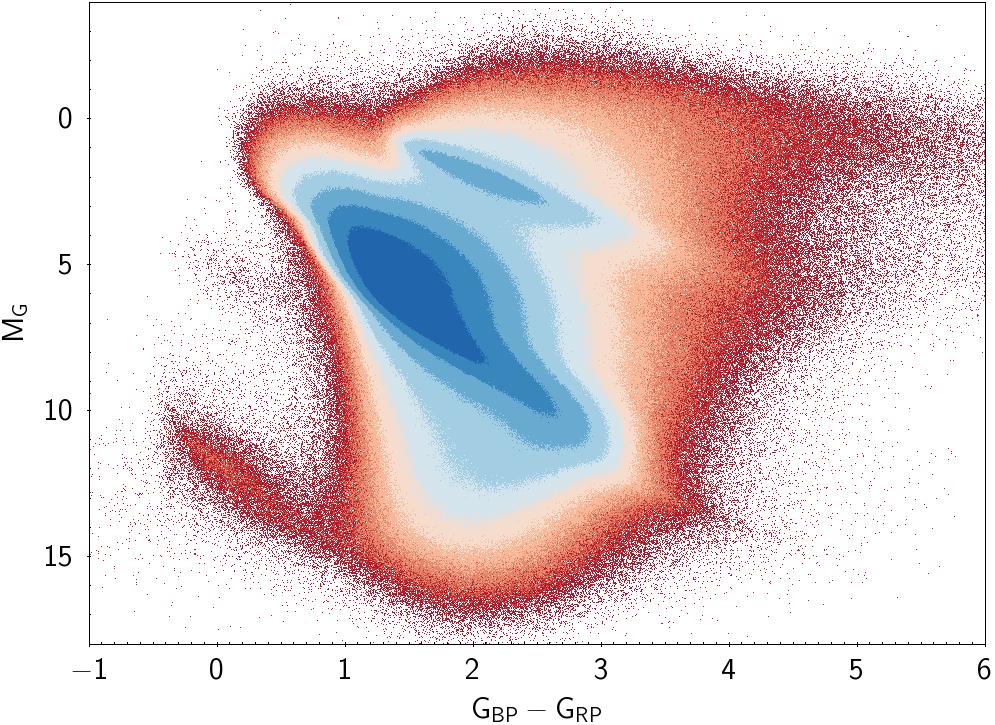
The left panel of Fig. 1 shows colour-magnitude diagram (CMD) using the Gaia-based colours for all cross-matched targets as described in Section 2. The distances used to convert apparent to absolute magnitudes have been inferred via , where and are the absolute and apparent magnitudes respectively, and the parallax in milliarcseconds provided by Gaia DR3. Lindegren et al. (2021b) provide a correction to the measurements to correct for the zero point bias. This correction is not applied here, and neither is extinction, but users of XGAPS can do so through the available code provided by Lindegren et al. (2021b).
As can be seen from the left panel of Fig. 1 both CMDs appear to be “polluted” by spurious sources. This is particularly evident in the regions between the main sequence and white dwarf tracks, where a low population density of sources is expected. Similar contamination can also be observed in different colour combination CMD plots. Spurious astrometric solutions from Gaia can be due to a number of reasons. One of the major causes that produce such spurious parallax measurements is related to the inclusion of outliers in the measured positions. In Gaia DR3 this is more likely to occur in regions of high source density (as is the case in the Galactic plane) or for close binary systems (either real or due to sight line effects) which have not been accounted for. The dependence of spurious parallax measurements on other measured quantities in Gaia DR3 is not straight forward to disentangle, and CMDs cannot be easily cleaned through the use of empirical cuts on the available Gaia DR3 parameters.
Several methods attempting to identify spurious astrometric sources have been explored in the literature. Scaringi et al. (2018) defined both a “completeness” and “purity” parameter that can be used to clean the resulting CMDs from the previous cross-match between Gaia DR2 and IPHAS. More recently, Gaia Collaboration et al. (2021b) employed a machine learning classifier based on Random Forests to identify spurious astrometric measurements in the 100 pc sample of Gaia EDR3. In both cases, a negative parallax sample had been used to infer common properties of spurious astrometric sources. This was then generalised and applied to the positive parallax sources to identify spurious measurements.
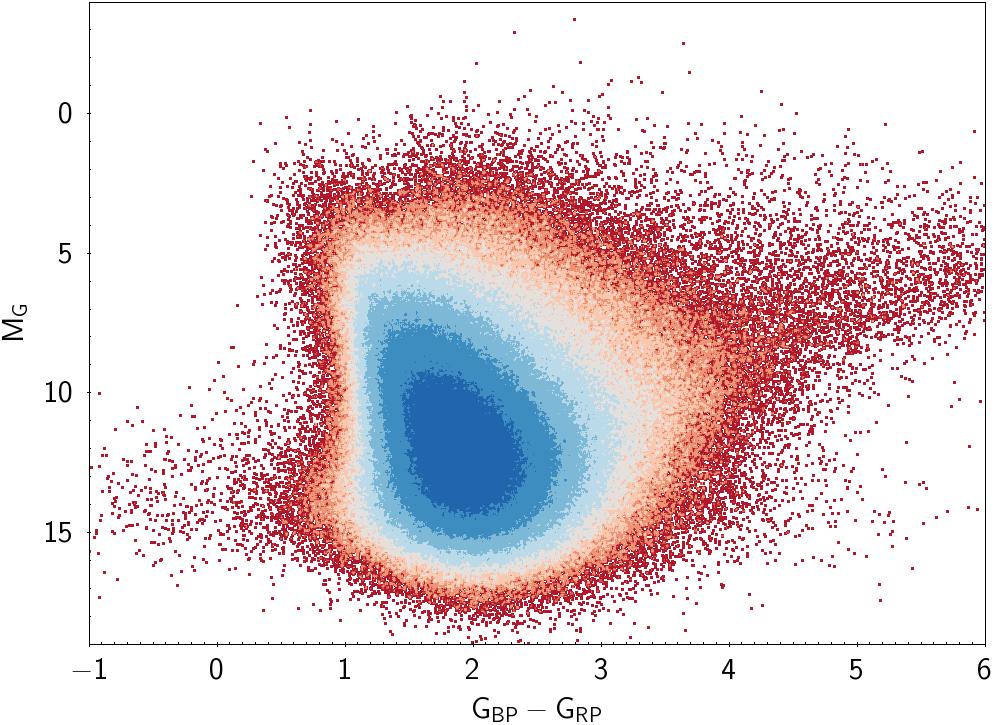
A classifier will only be as good at generalising a given set of properties as the provided training set allows. Here a Random Forest classifier is also used to clean XGAPS from the contamination of bad astrometric measurements. To explore this further, the same cross-matching method as described in Section 2 is performed using as a master Gaia catalogue of all sources satisfying the same quality cuts as described in Section 2.1 but inverting the parallax signal-to-noise selection criteria to be less than (parallax_over_error<-3). This produces a total of 1,034,661 sources after the cross-matching with the IGAPS catalogue has been performed. The right panel of Fig. 1 shows the Gaia CMD of the recovered negative parallax “mirror sample” after having parsed through the same cross-matching pipeline as all other XGAPS sources. To obtain “absolute magnitudes” for sources the absolute value of the negative parallax has been used. It is clear from comparing both panels of Fig. 1 that the suspiciously spurious parallax sources and negative parallax sources occupy similar regions of the CMDs. This in turn suggests that the same systematic measurement challenges are affecting both these samples, even though there is no clear parameter combination cut from the Gaia astrometric measurements that can be used to exclude spurious sources.
In a similar way to what has been adopted in Gaia Collaboration et al. (2021b) to remove spurious sources, a Random Forest (Breiman 2001) is trained through the use of XGAPS data to classify all million entries into two categories (good vs. bad astrometric solutions) purely based on astrometric quantity and quality indicators provided by Gaia DR3 and augmented by astrometric indicators resulting from XGAPS. To achieve this a reliable training set of both categories is required. Because XGAPS sources are found in the crowded Galactic plane, and because these sources may suffer from specific systematic errors, a training/testing set is constructed from XGAPS data alone. The good astrometric solution set is compiled by selecting all sources in XGAPS which have a parallax signal-to-noise measurement above 5. This results in 19,242,307 good astrometric solution sources used for training. Although some bad parallax measurement sources may be expected to have a parallax signal-to-noise measurement above 5, it is reasonable to assume that a small fraction of sources will fall into this category. The bad astrometric training sources are compiled through the use of the ”negative parallax mirror sample”, for which the CMD is shown in the right panel of Fig. 1. This is obtained by selecting sources with a parallax signal-to-noise measurement below , resulting in 250,069 sources. In total, the set of good and bad astrometric solution targets is 19,492,876. The testing set is created by randomly selecting 20% of the lowest populated class (50,113 from the bad astrometric sources), and randomly selecting the same number of sources from the other class. All remaining sources are used as a training set.
The classification model consists of a trained Random Forest (Breiman 2001) using a total of 26 predictor variables listed in Table 1 which are purely astrometry based. Each decision tree in the Random Forest is grown using 5 randomly chosen predictor variables, and each tree is grown to their full length. Surrogate splits when creating decision trees are used to take into account missing variables in some of the training samples. Each tree is grown by resampling targets, with replacement, in the training sample while keeping the total number of training samples per tree the same as the total number of targets used for training. Because the number of good astrometric training sources is much larger than the bad astrometric sources, each tree is grown using all bad astrometric sources (200,456 after having removed the testing set), and randomly under-sampling the same number of good training sources. This ensures that there is a balance between the two classes for each grown tree. These resampling techniques ensure that each tree is grown using a different subset of the training set and related predictors, which in turn avoids the Random Forest from overtraining (Breiman 2001). In total, the Random Forest consists of 1001 decision trees. Final source classifications are assigned by the largest number of trees that classified the source as a particular class. The vote ratio between the two classes is also retained in the XGAPS catalogue. We have further attempted to establish the relative predictor importance for each of the 26 predictors used. This is achieved through the same classifier methodology described. However, for computational time purposes, the predictor importance values only are obtained by growing each tree using the same good training sources (200,456 randomly selected from the entire population) rather than resampling these for each individual tree. The resulting predictor importance using the out-of-bag samples during training is included in Table 1.
| Predictor Name | Predictor Importance |
|---|---|
| pmra | 11.68 |
| pmdec | 9.07 |
| bMJD_separation_UVEX | 4.30 |
| bMJD_separation_IPHAS | 4.26 |
| ipd_frac_multi_peak | 4.06 |
| ipd_gof_harmonic_amplitude | 3.61 |
| astrometric_n_good_obs_al | 2.67 |
| astrometric_n_obs_al | 2.65 |
| scan_direction_mean_k1 | 2.53 |
| parallax_error | 2.42 |
| scan_direction_mean_k2 | 2.24 |
| scan_direction_mean_k3 | 2.22 |
| ruwe | 1.96 |
| astrometric_excess_noise_sig | 1.84 |
| astrometric_gof_al | 1.81 |
| astrometric_excess_noise | 1.74 |
| pmdec_error | 1.70 |
| redChi2 | 1.64 |
| scan_direction_strength_k1 | 1.57 |
| astrometric_sigma5d_max | 1.50 |
| ipd_frac_odd_win | 1.49 |
| scan_direction_mean_k4 | 1.49 |
| astrometric_n_bad_obs_al | 1.42 |
| astrometric_chi2_al | 1.36 |
| pmra_error | 1.33 |
| astrometric_n_obs_ac | 0.27 |
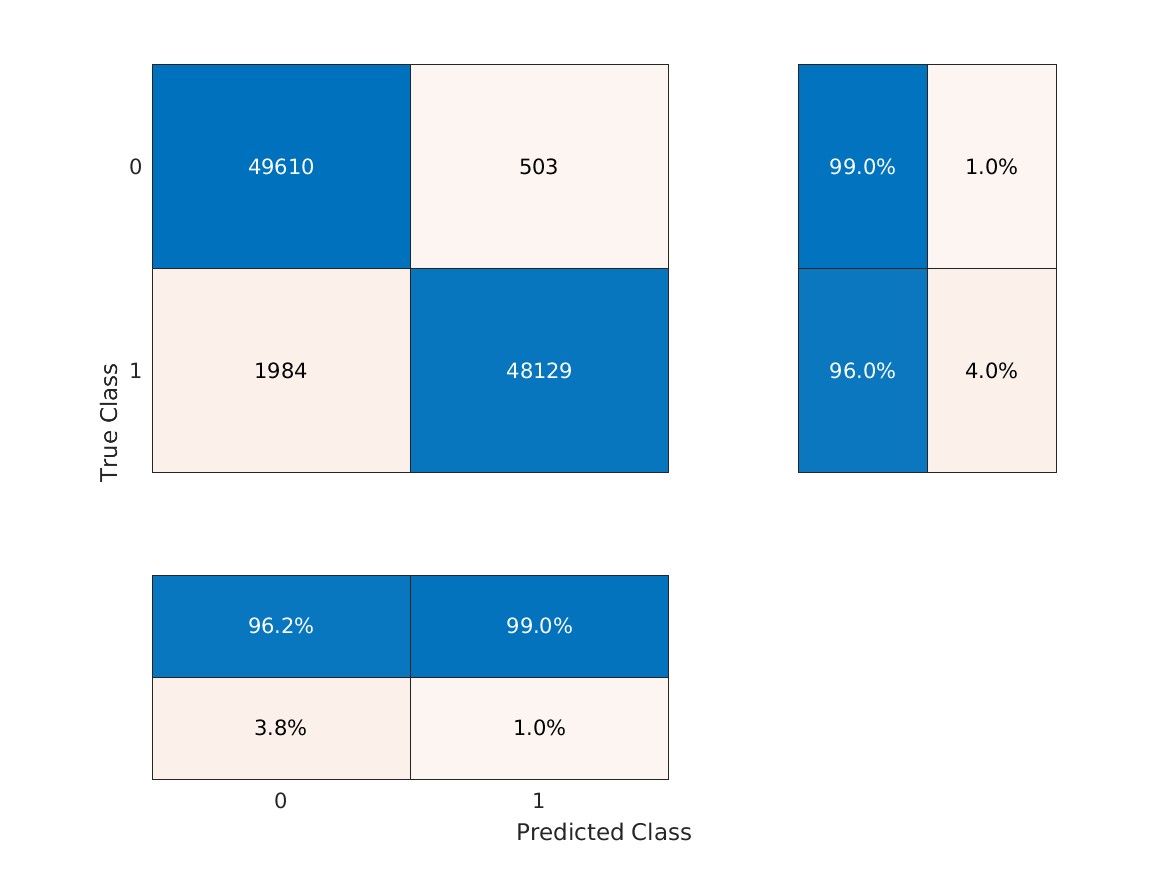
The Random Forest is robust against variations in the number of trees or candidate predictors, as altering these did not produce substantially different results as evaluated on the test set. It is important to note that although the bad training sources can be considered to be the result of bonafide spurious astrometric measurements, some systems in the good training set are expected to have been mislabeled by the training set selection criteria. Thus when inspecting the Random Forest classification accuracy on the testing set only sources with misclassified labels from the bad astrometric sources should be considered, and these should provide a lower limit on the true accuracy of the classifier. The final result on the testing set is summarised by the confusion matrix shown in Figure 2. Overall 1984 sources are classified as bad sources owning a parallax signal-to-noise measurement above 5. More importantly, 503 out of 50,113 bad astrometric sources (1.0%) have been mislabeled, and these should provide the lower limit on the accuracy of the classifier.
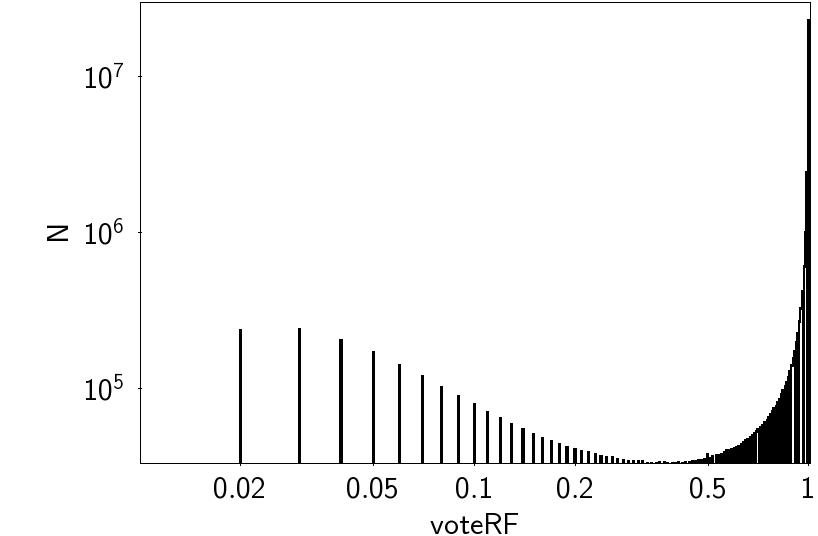
Having trained the classification model, all million sources in XGAPS are parsed through the Random Forest classifier and receive an associated vote (see Fig. 3) from each tree and an associated flag with the predicted classification. Sources are classified as good astrometric sources if more than 50% of individual trees in the Random Forest classifier have classified them as such, and are assigned a flag in the catalogue of flagRF=1. If this is not achieved, the source flags are set to flagRF=0. This results in 30,927,929 (91%) targets with flagRF=1 and 3,059,251 (9%) with flagRF=0.
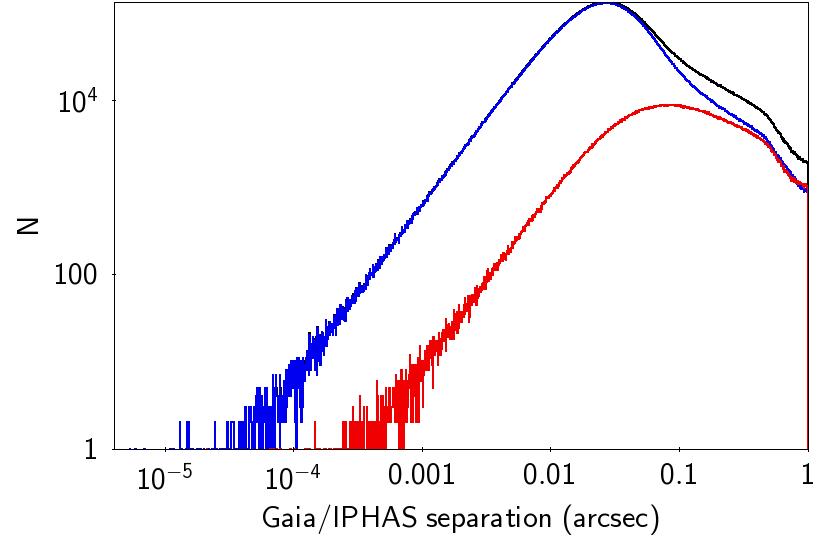
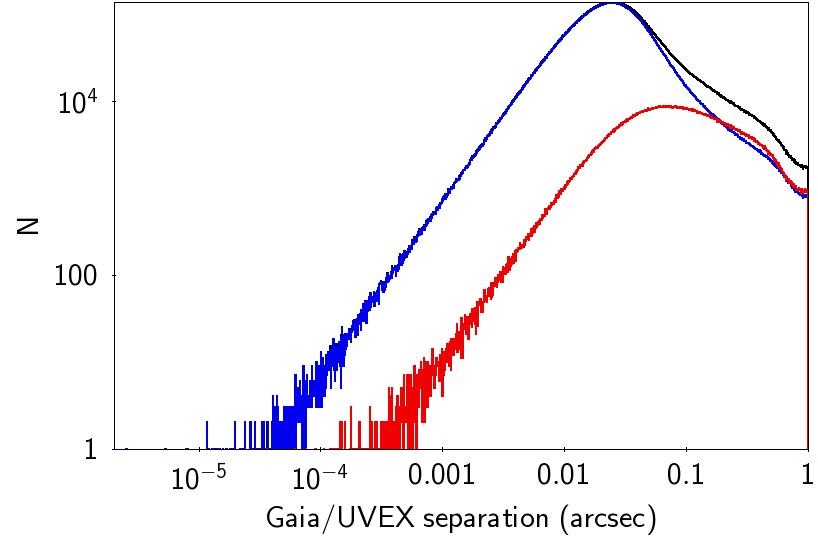
Fig. 4 shows the angular separation between the individual IPHAS and UVEX matches to the epoch-corrected Gaia DR3 sources. The bulk of the population finds an angular separation of about 0.02 arcseconds, but there exists an additional component of sources evident at larger separations. Although these sources have found their correct match between Gaia and both IPHAS and UVEX, the larger angular separation may in fact be attributed to poor astrometry in Gaia DR3. Shown in the same figure are also the distribution of the good vs. bad astrometric sources as classified using the trained Random Forest. It is clear that the classifier has been able to separate those sources with relatively large angular separation when compared to the bulk of the population.
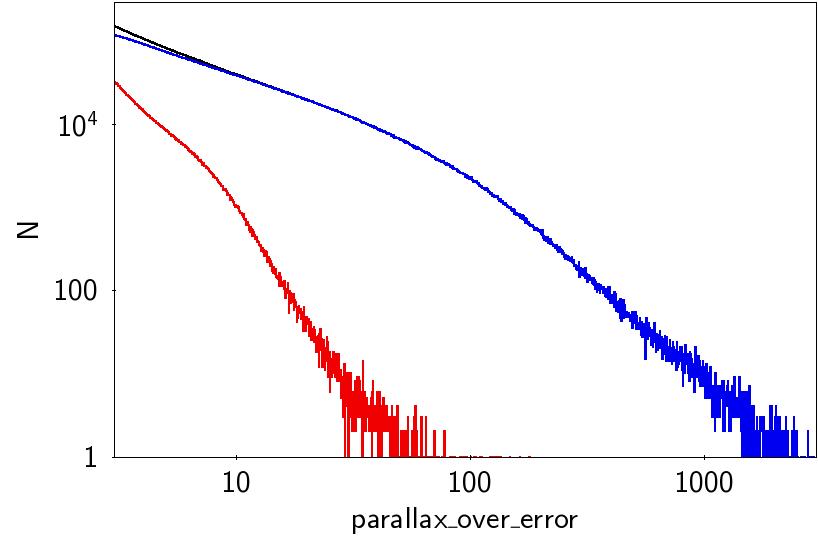
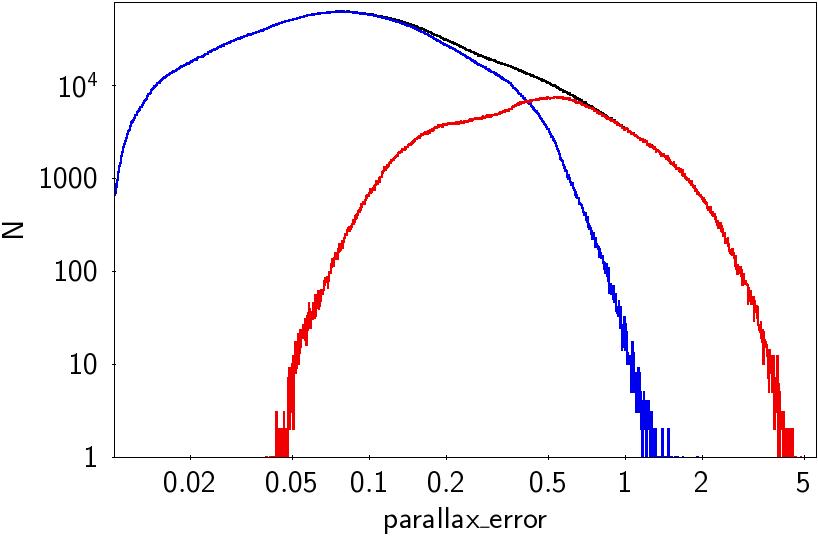
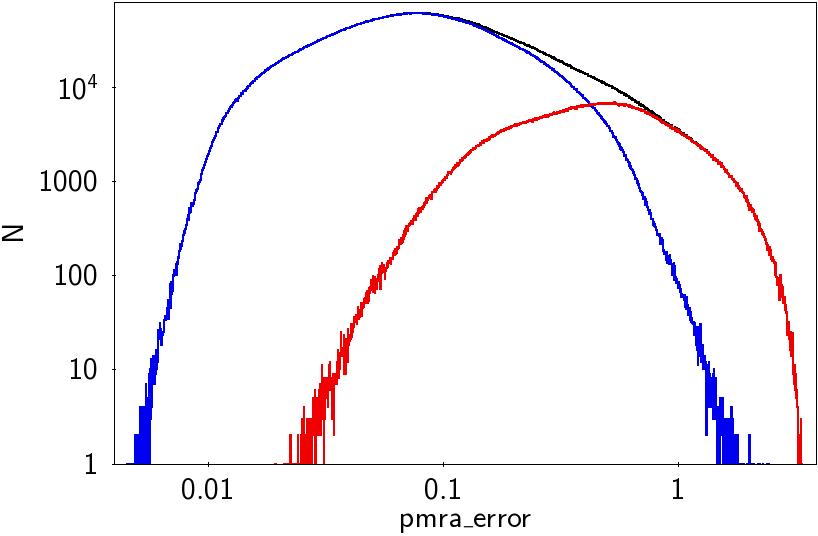
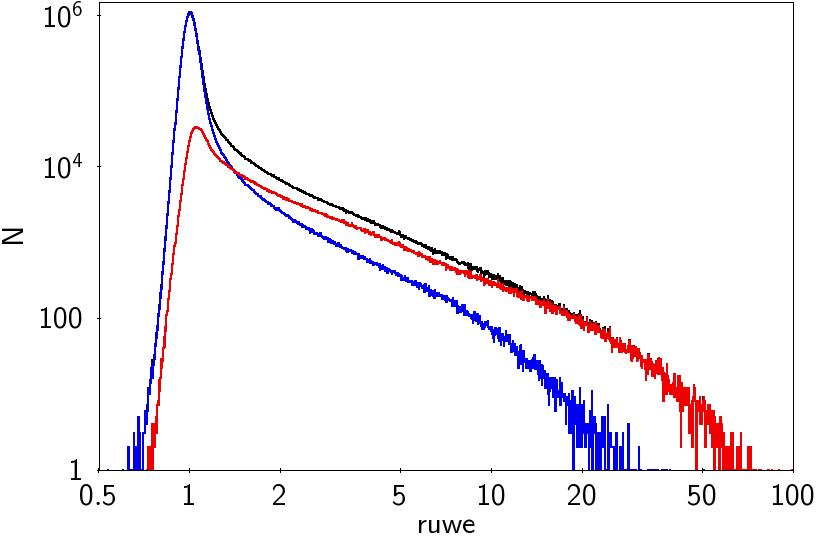
This split between the good vs. bad astrometric sources can also be validated when considering other astrometric predictor variables used by the classifier. Fig. 5 shows the distributions of an additional 3 predictor variables (parallax_error, pmra_error, ruwe) as well as the parallax signal-to-noise measurement (parallax_over_error) which has been used to select the training set. In all cases the Random Forest classifier appears to have separated the apparent bimodal distributions observed in the predictor variables.
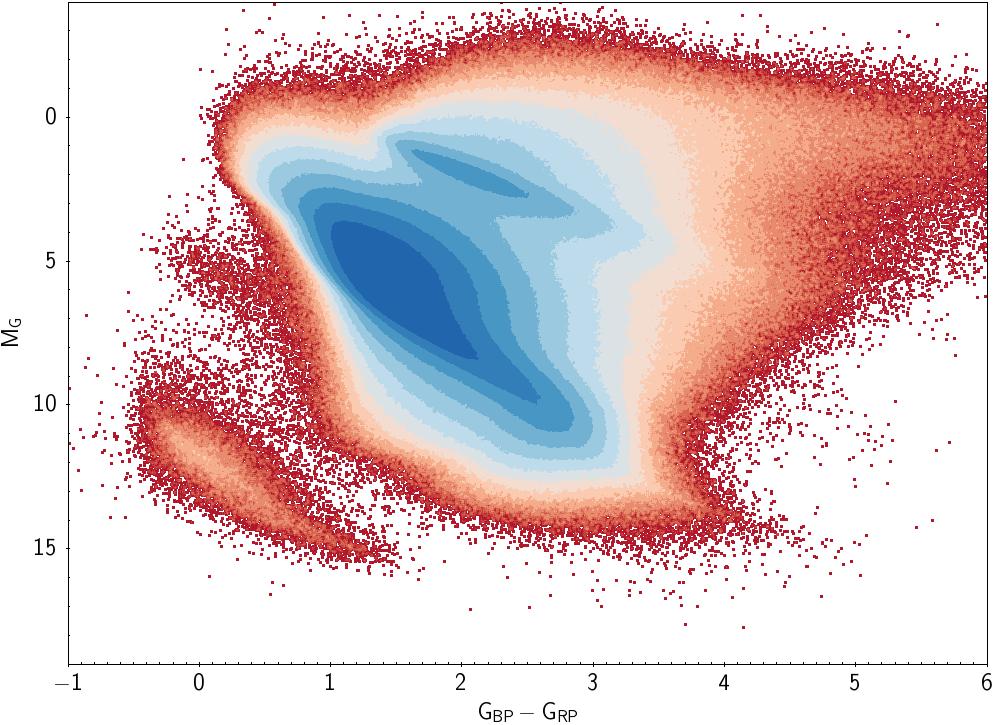
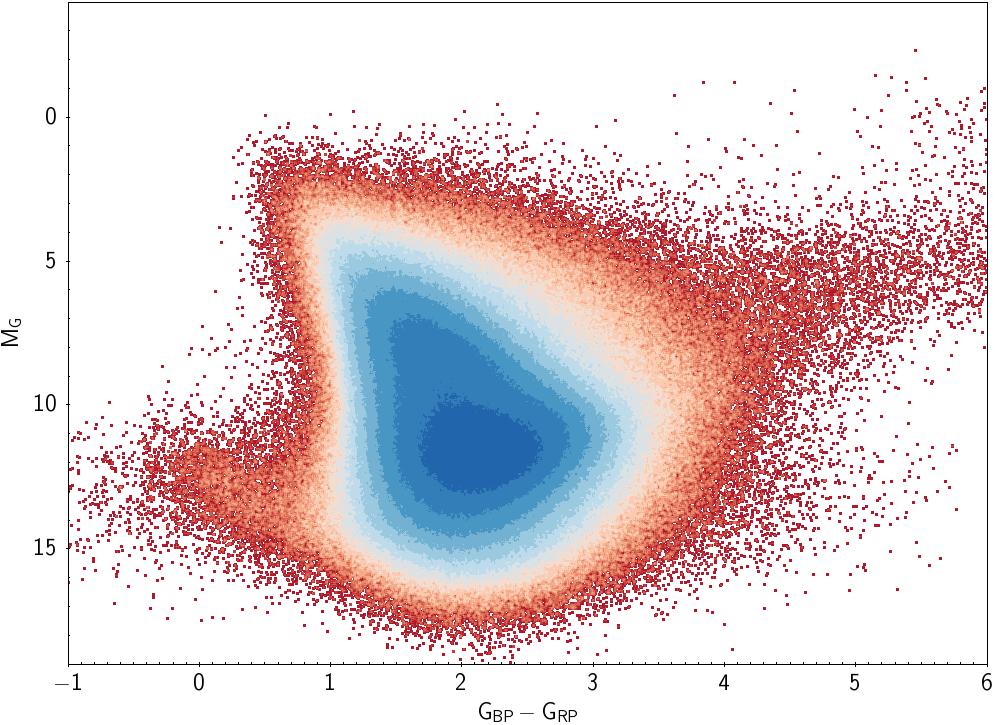
Inspecting the CMDs of the predicted good vs. bad astrometric targets provides additional insight on the Random Forest performance. Fig. 6 displays the Gaia CMD of the predicted good vs. bad astrometric targets. Overall, the Random Forest classifies a total of 30,944,717 good astrometric targets (91%) and 3,042,463 bad astrometric targets (9%). It is clear that most of the bad astrometric sources are correctly removed as they populate the same region in the CMD as the negative parallax sample used for training (see right panel of Fig. 1). Although the split has been efficiently achieved, it is also the case that some good astrometric sources have been flagged as bad ones by the classifier, and vice-versa. This is particularly evident when inspecting the CMD region for sources classified as having good astrometry (left panel in Fig. 6), which appears to still be populated with relatively large number of sources on the blue side of the main sequence. Furthermore, some sources flagged as having bad astrometry by the classifier appear to populate the WD track, and it is also possible some of these have been mislabeled (right panel in Fig. 6). Overall however, the bulk of the bad astrometric sources appears to have been removed correctly.
4 Potential applications of the XGAPS catalogue
Owning broad and narrow-band photometric measurements for million Galactic plane sources, astrometric information, as well as multi-epoch photometry in many of these, the applications for the XGAPS catalogue can be wide-reaching, especially for the identification of specific source types and related population studies. Examples based on the Gaia/IPHAS catalogue (Scaringi et al. 2018) include the discovery of new binary systems (Carrell et al. 2022), the selection and identification of Herbig Ae/Be systems (Vioque et al. 2020), planetary nebulae (Sabin et al. 2022), as well as candidate X-ray emitting binaries (Gandhi et al. 2020). Further applications may also be found in constructing reliable training sets for classification, as has been used by Gaia Collaboration et al. (2022b) to train a Random Forest for classification of targets based on synthetic photometry.
Also important, XGAPS provides information that can be efficiently used in selecting targets for large multi-object spectroscopic surveys such as the WHT Enhanced Area Velocity Explorer (WEAVE: Dalton et al. 2012) and the 4-metre Multi-Object Spectrograph Telescope (4MOST: de Jong et al. 2019). An example of this is the selection of white dwarf candidates in the Galactic plane to be observed with 4MOST as part of the community selected White Dwarf Binary Survey (PIs: Toloza and Rebassa-Mansergas). This includes a total of 28,102 targets that satisfy the following criteria in XGAPS:
-
•
Have a Gaia declination degrees
-
•
Have the flagRF set to 1
-
•
Lie within the region and
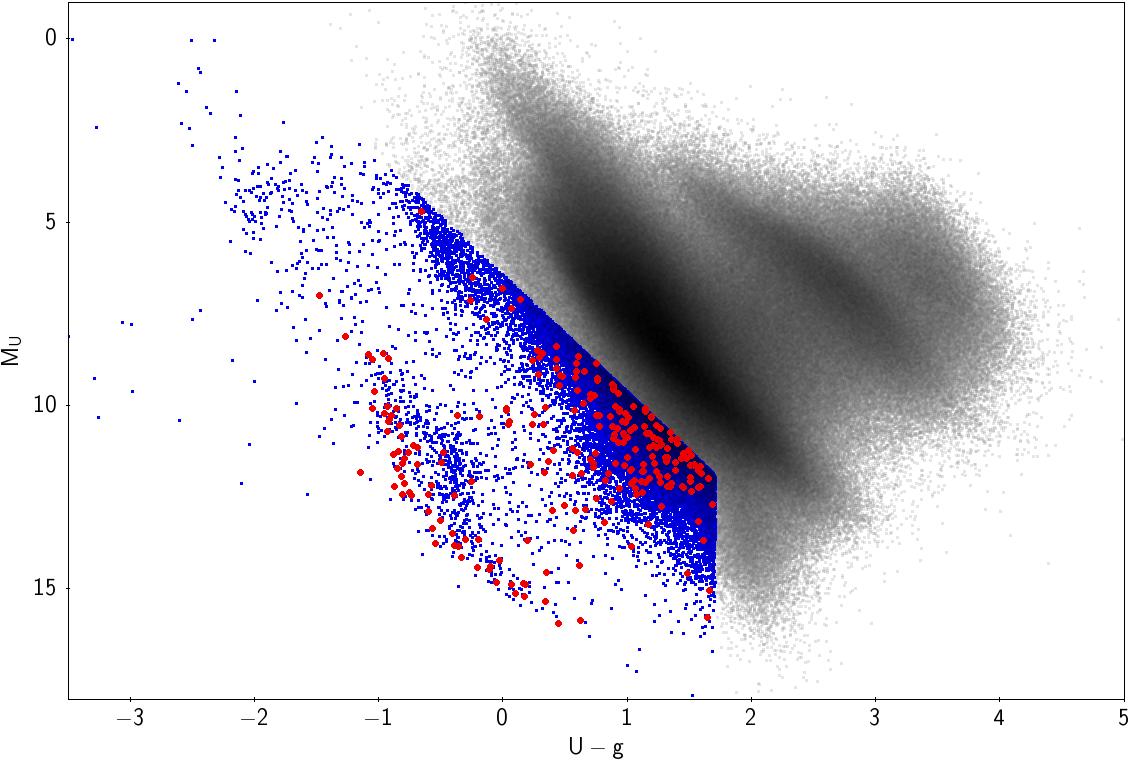
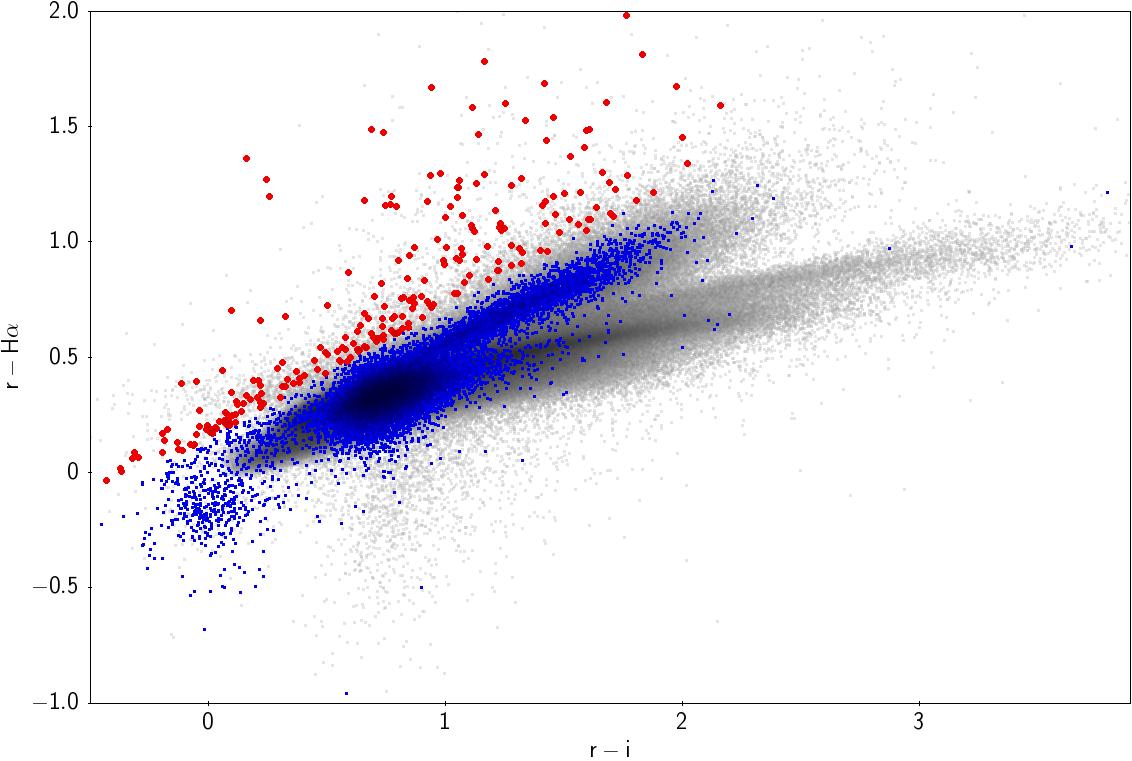
The resulting CMD using the UVEX colours is shown in the left panel of Fig. 7. The declination cut was employed to ensure targets are observable from Paranal Observatory where the 4MOST survey will be carried out from. The flagRF is employed to minimise spurious cross-matches and bad astrometric targets. The final colour-magnitude cuts are somewhat ad-hoc at this stage (especially as the band has not yet been photometrically calibrated across the full survey), but attempt to select all blue-excess sources relative to the main sequence as defined in the UVEX passbands (the bluest set of the XGAPS catalogue). Although preliminary and in need of refinement using well-validated and spectroscopically confirmed targets, these colour cuts provide a first attempt to select white dwarf candidates in the plane for the 4MOST survey. A further cut using the IPHAS passbands of to select H-excess sources yields 241 likely accreting white dwarf systems (right panel of Fig. 7). We point out that these colour cuts are preliminary, and only serve to demonstrate the potential application of the XGAPS catalogue. Specifically for the selection of H-excess sources, a more refined method of selecting H-excess candidates based on the local population as defined in absolute colour-magnitude diagrams has been shown to produce more complete samples of objects, but this comes at the expense of purity (e.g. Fratta et al. 2021).
5 Conclusion
We have presented the XGAPS catalogue which provides a sub-arcsecond cross-match between Gaia DR3, IPHAS, UVEX and UKIDSS. It contains photometric and astrometric measurements for million sources within the northern Galactic plane. In total, XGAPS contains 2 epoch photometry in the -band, as well as single-epoch (not simultaneous) photometry in up to 9 broad-band filters (, , , , , , , , and ) and one narrow-band H-filter. XGAPS additionally provides a confidence metric inferred using Random Forests aimed at assessing the reliability of the Gaia astrometric parameters for any given source in the catalogue. XGAPS is provided as a catalogue with 111 columns. A description of the columns is presented in Table LABEL:tab:cols. The full XGAPS catalogue can be obtained through ViZieR. As XGAPS only covers the northern Galactic plane, future extensions are planned to merge the southern Galactic plane and bulge using data from the VST Photometric H Survey of the Southern Galactic Plane and Bulge (VPHAS+: Drew et al. 2014).
Acknowledgements
Cross-matching between catalogues has been performed using STILTS, and diagrams were produced using the astronomy-oriented data handling and visualisation software TOPCAT (Taylor 2005). This work has made use of the Astronomy & Astrophysics package for Matlab (Ofek 2014). This research has also made extensive use of the SIMBAD database, operated at CDS, Strasbourg. This work is based on observations made with the Isaac Newton Telescope operated on the island of La Palma by the Isaac Newton Group of Telescopes in the Spanish Observatorio del Roque de los Muchachos of the Instituto de Astrofísica de Canarias. This work is also based in part on data obtained as part of the UKIRT Infrared Deep Sky Survey. This work has made additional use of data from the European Space Agency (ESA) mission Gaia (https://www.cosmos.esa.int/gaia), processed by the Gaia Data Processing and Analysis Consortium (DPAC, https://www.cosmos.esa.int/web/gaia/dpac/consortium). Funding for the DPAC has been provided by national institutions, in particular the institutions participating in the Gaia Multilateral Agreement.
MM work was funded by the Spanish MICIN/AEI/10.13039/501100011033 and by “ERDF A way of making Europe” by the “European Union” through grant RTI2018-095076-B-C21, and the Institute of Cosmos Sciences University of Barcelona (ICCUB, Unidad de Excelencia “María de Maeztu”) through grant CEX2019-000918-M. ARM acknowledges support from Grant RYC-2016-20254 funded by MCIN/AEI/10.13039/501100011033 and by ESF Investing in your future, and from MINECO under the PID2020-117252GB-I00 grant.
Data Availability
The XGAPS catalogue produced in this paper is available and can be found on VizieR.
References
- Arenou et al. (2018) Arenou F., et al., 2018, A&A, 616, A17
- Babusiaux et al. (2022) Babusiaux C., et al., 2022, arXiv e-prints, p. arXiv:2206.05989
- Breiman (2001) Breiman L., 2001, Mach. Learn., 45, 5–32
- Carrell et al. (2022) Carrell K., Gray Cherry J., Gillespie C., 2022, AJ, 164, 77
- Casali et al. (2007) Casali M., et al., 2007, A&A, 467, 777
- Dalton et al. (2012) Dalton G., et al., 2012, in McLean I. S., Ramsay S. K., Takami H., eds, Society of Photo-Optical Instrumentation Engineers (SPIE) Conference Series Vol. 8446, Ground-based and Airborne Instrumentation for Astronomy IV. p. 84460P, doi:10.1117/12.925950
- De Angeli et al. (2022) De Angeli F., et al., 2022, arXiv e-prints, p. arXiv:2206.06143
- Drew et al. (2005) Drew J. E., et al., 2005, MNRAS, 362, 753
- Drew et al. (2014) Drew J. E., et al., 2014, MNRAS, 440, 2036
- Eyer et al. (2022) Eyer L., et al., 2022, arXiv e-prints, p. arXiv:2206.06416
- Fabricius et al. (2021) Fabricius C., et al., 2021, A&A, 649, A5
- Fratta et al. (2021) Fratta M., et al., 2021, MNRAS, 505, 1135
- Frémat et al. (2022) Frémat Y., et al., 2022, arXiv e-prints, p. arXiv:2206.10986
- Gaia Collaboration et al. (2016) Gaia Collaboration et al., 2016, A&A, 595, A1
- Gaia Collaboration et al. (2018) Gaia Collaboration et al., 2018, A&A, 616, A1
- Gaia Collaboration et al. (2021a) Gaia Collaboration et al., 2021a, A&A, 649, A1
- Gaia Collaboration et al. (2021b) Gaia Collaboration et al., 2021b, A&A, 649, A6
- Gaia Collaboration et al. (2022a) Gaia Collaboration et al., 2022a, arXiv e-prints, p. arXiv:2206.05870
- Gaia Collaboration et al. (2022b) Gaia Collaboration et al., 2022b, arXiv e-prints, p. arXiv:2206.06215
- Gandhi et al. (2020) Gandhi P., Buckley D. A. H., Charles P., Hodgkin S., Scaringi S., Knigge C., Rao A., 2020, arXiv e-prints, p. arXiv:2009.07277
- González-Solares et al. (2008) González-Solares E. A., et al., 2008, MNRAS, 388, 89
- Greimel et al. (2021) Greimel R., et al., 2021, A&A, 655, A49
- Groot et al. (2009) Groot P. J., et al., 2009, MNRAS, 399, 323
- Hambly et al. (2008) Hambly N. C., et al., 2008, MNRAS, 384, 637
- Lawrence et al. (2007) Lawrence A., et al., 2007, MNRAS, 379, 1599
- Lindegren et al. (2018) Lindegren L., et al., 2018, A&A, 616, A2
- Lindegren et al. (2021a) Lindegren L., et al., 2021a, A&A, 649, A2
- Lindegren et al. (2021b) Lindegren L., et al., 2021b, A&A, 649, A4
- Lucas et al. (2008) Lucas P. W., et al., 2008, MNRAS, 391, 136
- Luri et al. (2018) Luri X., et al., 2018, A&A, 616, A9
- Monguió et al. (2020) Monguió M., et al., 2020, A&A, 638, A18
- Ofek (2014) Ofek E. O., 2014, MATLAB package for astronomy and astrophysics, Astrophysics Source Code Library (ascl:1407.005)
- Riello et al. (2018) Riello M., et al., 2018, A&A, 616, A3
- Sabin et al. (2022) Sabin L., Toalá J. A., Ramos-Larios G., Guerrero M. A., 2022, Frontiers in Astronomy and Space Sciences, 9, 897904
- Scaringi et al. (2018) Scaringi S., et al., 2018, MNRAS, 481, 3357
- Taylor (2005) Taylor M. B., 2005, in Shopbell P., Britton M., Ebert R., eds, Astronomical Society of the Pacific Conference Series Vol. 347, Astronomical Data Analysis Software and Systems XIV. p. 29
- Vioque et al. (2020) Vioque M., Oudmaijer R. D., Schreiner M., Mendigutía I., Baines D., Mowlavi N., Pérez-Martínez R., 2020, A&A, 638, A21
- de Jong et al. (2019) de Jong R. S., et al., 2019, The Messenger, 175, 3
Appendix A Catalogue format
| Column name | Unit | Description |
|---|---|---|
| GaiaDR3 | Unique Gaia DR3 source designation | |
| RAJ2016_Gaia | degrees | Gaia DR3 barycentric right ascension (ICRS) at Epoch 2016.0 |
| DEJ2016_Gaia | degrees | Gaia DR3 barycentric declination (ICRS) at Epoch 2016.0 |
| err_RAJ2016_Gaia | mas | Standard error of right ascension (err_RAJ2016_Gaiacos(dec)) |
| err_DEJ2016_Gaia | mas | Standard error of declination |
| parallax | mas | Absolute stellar parallax |
| parallax_error | mas | Standard error of parallax |
| pm | mas/yr | Total proper motion |
| pmra | mas/yr | Proper motion in right ascension direction (pmracos(DEJ2016_Gaia)) |
| pmdec | mas/yr | Proper motion in declination direction |
| pmra_error | mas/yr | Standard error of proper motion in right ascension direction |
| pmdec_error | mas/yr | Standard error of proper motion in declination direction |
| astrometric_excess_noise | mas | Excess noise of the source from the Gaia astrometric solution |
| astrometric_excess_noise_sig | Significance of excess noise of the source from the Gaia astrometric solution | |
| ruwe | Renormalised unit weight error | |
| duplicated_source | Source with multiple source identifiers in Gaia DR3 | |
| phot_g_mean_flux | electron/s | Gaia DR3 G-band mean flux |
| phot_g_mean_flux_error | electron/s | Error on the G-band mean flux |
| phot_g_mean_flux_over_error | Integrated mean G flux divided by its error. | |
| phot_bp_mean_flux | electron/s | Gaia DR3 integrated BP mean flux |
| phot_bp_mean_flux_error | electron/s | Error on the integrated BP mean flux |
| phot_bp_mean_flux_over_error | Integrated mean BP flux divided by its error | |
| phot_rp_mean_flux | electron/s | Gaia DR3 integrated RP mean flux |
| phot_rp_mean_flux_error | electron/s | Error on the integrated RP mean flux |
| hot_rp_mean_flux_over_error | Integrated mean RP flux divided by its error | |
| nameIPHAS | Source designation (JHHMMSS.ss+DDMMSS.s) without IGAPS prefix for IPHAS detection | |
| RAJbMJD_IPHAS | deg | J2000 RA (Gaia DR2 reference frame) for IPHAS detection |
| DECJbMJD_IPHAS | deg | J2000 DEC (Gaia DR2 reference frame) for IPHAS detection |
| sourceID_IPHAS | IPHAS Unique source identification string (run-ccd-detection number) | |
| posErr_IPHAS | arcsec | Astrometric fit error (RMS) across the CCD for IPHAS detection. |
| rMJD_I | Modified Julian Date at the start of the r_I exposure. | |
| bMJD_IPHAS | d | Modified Julian Date used for cross-matching Gaia to IPHAS |
| bMJD_separation_IPHAS | arcsec | Angular separation between the rewound Gaia position at Epoch bMJD_IPHAS to the nominal IPHAS position |
| nameUVEX | Source designation (JHHMMSS.ss+DDMMSS.s) without IGAPS prefix for UVEX detection. | |
| RAJbMJD_UVEX | deg | J2000 RA (Gaia DR2 reference frame) for UVEX detection. |
| DECJbMJD_UVEX | deg | J2000 DEC (Gaia DR2 reference frame) for UVEX detection. |
| sourceID_UVEX | Unique source identification string (run-ccd-detection number) for UVEX detection. | |
| posErr_UVEX | arcsec | Astrometric fit error (RMS) across the CCD for UVEX detection. |
| rMJD_U | Modified Julian Date at the start of the r_U exposure. | |
| bMJD_UVEX | d | Modified Julian Date used for cross-matching Gaia to UVEX |
| bMJD_separation_UVEX | arcsec | Angular separation between the rewound Gaia position at Epoch bMJD_UVEX to the nominal UVEX position |
| sourceID_UKIDSS | Unique UKIDSS identifier | |
| RAJbMJD_UKIDSS | deg | UKIDSS detection RA |
| DECJbMJD_UKIDSS | deg | UKIDSS detection DEC |
| epoch_UKIDSS | yr | Epoch at the start of the UKIDSS observation |
| bMJD_UKIDSS | d | Modified Julian Date used for cross-matching Gaia to UKIDSS |
| bMJD_separation_UKIDSS | arcsec | Angular separation between the rewound Gaia position at Epoch bMJD_UKIDSS to the nominal UKIDSS position |
| phot_g_mean_mag | mag | Integrated G-band mean magnitude |
| phot_bp_mean_mag | mag | Integrated BP mean magnitude |
| phot_rp_mean_mag | mag | Integrated RP mean magnitude |
| i | mag | IPHAS i mag (Vega) using the 2.3 arcsec aperture. |
| iErr | mag | IPHAS i mag (Vega) error using the 2.3 arcsec aperture. |
| ha | mag | IPHAS H mag (Vega) using the 2.3 arcsec aperture. |
| haErr | mag | IPHAS H mag (Vega) error using the 2.3 arcsec aperture. |
| r_I | mag | IPHAS r mag (Vega) using the 2.3 arcsec aperture. |
| rErr_I | mag | IPHAS r mag (Vega) error using the 2.3 arcsec aperture. |
| i2 | mag | IPHAS i mag (Vega) for the secondary detection. |
| i2Err | mag | IPHAS i mag (Vega) error for the secondary detection. |
| ha2 | mag | IPHAS H mag (Vega) for the secondary detection. |
| ha2Err | mag | IPHAS H mag (Vega) error for the secondary detection. |
| r2_I | mag | IPHAS r mag (Vega) for the secondary detection. |
| r2Err_I | mag | IPHAS r mag (Vega) error for the secondary detection. |
| r2MJD_I | d | Modified Julian Date at the start of the r2_I exposure. |
| r_U | mag | UVEX r mag (Vega) using the 2.3 arcsec aperture. |
| rErr_U | mag | UVEX r mag (Vega) error using the 2.3 arcsec aperture. |
| g | mag | UVEX g mag (Vega) using the 2.3 arcsec aperture. |
| gErr | mag | UVEX g mag (Vega) error using the 2.3 arcsec aperture. |
| U_RGO | mag | UVEX URGO mag (Vega) using the 2.3 arcsec aperture. |
| UErr | mag | Random uncertainty for U_RGO. Pipeline random error only |
| r2_U | mag | UVEX r mag (Vega) for the secondary detection. |
| r2Err_U | mag | UVEX r mag (Vega) error for the secondary detection. |
| g2 | mag | UVEX g mag (Vega) for the secondary detection. |
| g2Err | mag | UVEX g mag (Vega) error for the secondary detection. |
| U_RGO2 | mag | UVEX URGO mag (Vega) for the secondary detection. |
| U2Err | mag | UVEX Random uncertainty for U_RGO2. Pipeline random error only |
| r2MJD_U | d | Modified Julian Date at the start of the r2_U exposure. |
| j | mag | UKIDSS j mag (Vega) using 2.0 arcsec aperture. |
| jErr | mag | UKIDSS j mag (Vega) error using 2.0 arcsec aperture. |
| h | mag | UKIDSS h mag (Vega) using 2.0 arcsec aperture. |
| hErr | mag | UKIDSS h mag (Vega) error using 2.0 arcsec aperture. |
| k | mag | UKIDSS k mag (Vega) using 2.0 arcsec aperture. |
| kErr | mag | UKIDSS k mag (Vega) error using 2.0 arcsec aperture. |
| bp_rp | mag | BP - RP colour |
| bp_g | mag | BP - G colour |
| g_rp | mag | G - RP colour |
| rmi | mag | r_I - i colour |
| rmha | mag | r_I - H colour |
| Umg | mag | U_RGO - g colour |
| gmr | mag | g - r_U colour |
| jmh | mag | j - h colour |
| jmk | mag | j - k colour |
| Gmj | mag | G - j colour |
| Umk | mag | U_RGO - k colour |
| paramsSolved | Number of parameters solved for in the Gaia DR3 model | |
| redChi2 | Reduced chi2 for the Gaia DR3 astrometric fit computed as astrometric_chi2_al/(astrometric_n_good_obs_al-paramsSolved) | |
| rmsG | Root mean square for the G band Gaia observations computed as phot_g_mean_flux_error*(sqrt(phot_g_n_obs)) | |
| frac_rmsG | Fractional root mean square for the G band Gaia observations computed as phot_g_mean_flux_error*(sqrt(phot_g_n_obs)/phot_g_mean_flux) | |
| dist | pc | Inverse parallax distance to the source (no reddening) computed as 1/(abs(parallax)/1000) |
| pmT | mas/yr | Transverse proper motion computed as sqrt(pow(pmra,2)+pow(pmdec,2)) |
| vT | km/s | Transverse velocity computed as 4.74*dist*(pm/1000) |
| M_G | mag | Absolute Gaia G magnitude inferred using the inverse parallax distance dist |
| R_IPHAS | mag | Absolute IPHAS r magnitude inferred using the inverse parallax distance dist |
| I_IPHAS | mag | Absolute IPHAS i magnitude inferred using the inverse parallax distance dist |
| R_UVEX | mag | Absolute UVEX r magnitude inferred using the inverse parallax distance dist |
| G_UVEX | mag | Absolute UVEX g magnitude inferred using the inverse parallax distance dist |
| U_UVEX | mag | Absolute UVEX U_RGO magnitude inferred using the inverse parallax distance dist |
| M_j | mag | Absolute UKIDSS j magnitude inferred using the inverse parallax distance dist |
| M_h | mag | Absolute UKIDSS h magnitude inferred using the inverse parallax distance dist |
| M_h | mag | Absolute UKIDSS k magnitude inferred using the inverse parallax distance dist |
| voteRF | Random Forest classification probability for the source being classed as a good astrometric source | |
| flagRF | Random Forest classification. flagRF=1 if voteRF>0.5, else flagRF=0 |