Identifying Spurious Correlations and Correcting them with an Explanation-based Learning
Abstract
Identifying spurious correlations learned by a trained model is at the core of refining a trained model and building a trustworthy model. We present a simple method to identify spurious correlations that have been learned by a model trained for image classification problems. We apply image-level perturbations and monitor changes in certainties of predictions made using the trained model. We demonstrate this approach using an image classification dataset that contains images with synthetically generated spurious regions and show that the trained model was overdependent on spurious regions. Moreover, we remove the learned spurious correlations with an explanation based learning approach.
1 Introduction
Most of the literature on explainable AI focuses on explaining a model’s capabilities. For example, for image classification tasks, several approaches to feature attribution based model explanation generation are available. These approaches locate discriminative image regions used by models to classify categories zhou2016learning ; selvaraju2017grad ; omeiza2019smooth ; wang2020score . Such approaches, and other explainability methods, have found applications in several areas such as medical imaging belton2021optimising ; hagos2022interpretable and finance bussmann2020explainable ; nicholls2021financial . While explaining a model’s predictions helps end users gain insights into how a model works, it is also important to explain the limits of a model to users to help them to understand when they should avoid using a model. Understanding and identifying the limits of a model is equally as important as understanding the reasons for the outputs of a model.
In 2020, The National Institute of Standards and Technology (NIST), an agency of the United States of America (USA) department of commerce, published "four principles of xAI" to which black-box models should adhere phillips2020four . One of the four principles is knowledge limits, which states that an AI system should explicitly present its shortcomings, and identify scenarios where it might fail. For these reasons, as is presented in Figure 1, we view the process of achieving model trustworthiness through both understanding the capabilities of a model, and identifying and reducing model limits 111Different terms such as knowledge limits phillips2020four , systemic errors d2022spotlight , failure analysis singla2021understanding , and blind-spot discovery plumb2022evaluating are used in the literature, but we believe model limits generalizes all of them..
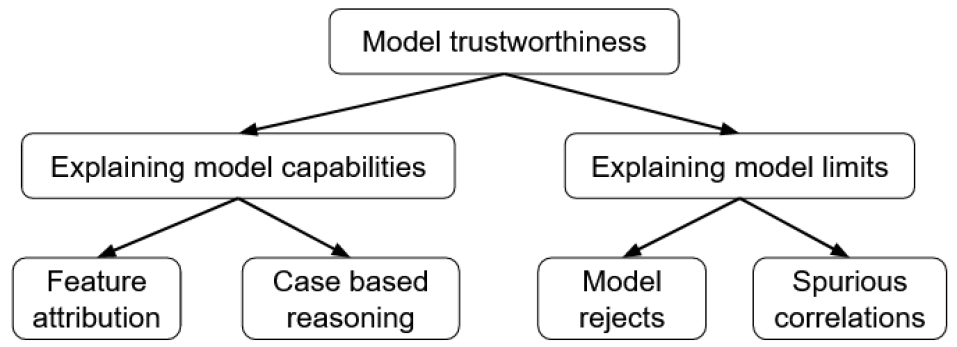
1.1 Model capabilities
Considering whether model explanations utilize features or instances, we can categorize explanations of a model’s capabilities into: (1) feature attribution, and (2) case based or example based explanations. Approaches to generate explanations based on feature attribution explain the predictions made by a model by identifying instance or image regions that the model finds salient. Class Activation Mapping (CAM) zhou2016learning and Gradient Weighted Class Activation Mapping (GradCAM) selvaraju2017grad are well known examples feature attribution approaches to explanation generation. Approaches to genrating expantions that are case based use other instances in order to explain the behaviour of a model. Counterfactual keane2020good and semi-factual explanations kenny2021generating are well known examples in this category.
1.2 Model limits
In addition to explaining why a model is working, it is equally important to explain model limits in which a trained model might not work. Model limits of a trained model are a set of instances, instance features or image regions that the model would fail to identify. They can be identified as instances that are out-of-distribution of a trained model plumb2022evaluating or they can be located as spurious correlations or patterns a model might have picked from a training dataset singla2021salient .
Spurious patterns are parts of input instances that a model might have found salient during training, but that are considered unnecessary for classifying instances, or which are not causally related to the instance’s category singla2021understanding . For example, in the famous husky vs wolf classification task popularized by Ribeiro et al. (2016) ribeiro2016should , spurious regions that a model learned were identified from incorrectly classified pictures of a husky and a wolf 222In the husky vs wolf classification, a model was trained with images of wolves that had snow in the background and of huskies that didn’t. For testing the model, among other test instances, images of a husky that had a snow background and a wolf that didn’t were used. This tricked the trained model into incorrect classification ribeiro2016should .. By creating test instances to trick the model, they showed that the model had learned spurious correlations using the confounding image regions that frequently appeared in the training instances and not the main objects in the test images. However, transferring this approach of identifying spurious correlations to other classification tasks would be expensive as it requires heavy manual input in identifying the candidate images that supposedly contain spurious regions.
In this paper, we present a simple perturbation based method to automatically identify spurious correlations learned by an image classifier, and an approach to unlearning them using explanation based learning. We use mean Monte Carlo (MC) dropout values to monitor model uncertainty and compare average changes in mean MC dropout values of perturbed images between a model trained with classification loss only and a model fine-tuned using explanation based learning. The following are the main contributions of this paper:
-
1.
We present an image-level perturbation based approach to identifying spurious correlations.
-
2.
We show how an image classifier model could be overly dependent on spurious image regions.
-
3.
We propose an explanation based learning approach to removing spurious correlations.
2 Related work
The limits of a model can be presented at two levels. At the instance or image level, instances that are out of distribution for a model can be identified. This is usually implemented by adding reject options to a model linusson2018classification . With a reject option, a trained model is able to avoid making predictions for instances for which it has low certainty. At the feature level, spurious correlations, or confounding image features or regions can be identified. In this section, we present examples of both approaches to explaining the limits of a model and methods of unlearning them.
2.1 Image level: out of distribution
Image level explanation of model limits is concerned with identifying out of distribution instances and systemic errors plumb2022evaluating ; singla2021understanding ; d2022spotlight . One type of case-based reasoning that were recently used for model limit explanation are semi-factual explanations kenny2021generating . Artlet et al. (2022) artelt2022even proposed to explain model rejects, which are out of distribution instances, with semifactual explanations that were generated using a perturbation based approach. However, because of the unlimited perturbation approach used, the explanations cannot be guaranteed to be plausible artelt2022even . Online interviews were conducted to explain a model’s error predictions in hlosta2020explaining .
2.2 Feature level: spurious correlations
As is explained in Section 1.2, feature level identification of model limits involves locating or identifying spurious patterns.
Most of the current literature on identifying spurious correlations learned by trained models requires an annotated dataset plumb2021finding . Plumb et al. (2021) plumb2021finding used pixel wise annotations available on the MS COCO dataset. Singla and Feizi et al. (2022) singla2021salient use user annotations to identify spurious patterns of a model trained on the Imagenet dataset. But, involving users for pixel wise annotation of image datasets can be time-consuming and expensive. Singla et al. (2021) singla2021understanding used image features extracted using a post-hoc explanation approach—Class Activation Mapping (CAM) saliency maps zhou2016learning —and images that a trained model failed to correctly predict in order to associate image regions with errors. However, post-hoc explanations were reported to fail in identifying previously unknown spurious signals adebayo2021post . The rate at which the predictions made by a model change after objects are added to or removed from input images was also proposed as a way to identify spurious patterns plumb2021finding . However, a model’s prediction or probability outputs at the softmax or last layer of a model often results in an overconfident classification melotti2020probabilistic .
We identify expensiveness of involving users for image features annotation, failure of post-hoc explanations in identifying unknown spurious signals adebayo2021post as research gaps in the current spurious correlations identification literature. Towards resolving both research gaps, we aim to automatically identify spurious correlations of a trained deep learning model without the need for user annotation or synthetically generated test instances.
Perturbation based explanations modify parts of an input instance and monitor changes in model output to identify regions that are important for model inference. LIME uses perturbation to generate subsamples for a simpler model training ribeiro2016should . For image inputs, it identifies super-pixels and replaces them with mean values of corresponding regions garreau2021does . Image perturbation can also be performed by sliding square boxes as masks over an input image zeiler2014visualizing ; petsiuk2018rise . However, perturbation can lead to implausible explanations artelt2022even .
2.3 Unlearning spurious correlations
Complying with regulations such as the right to be forgotten of the GDPR mantelero2013eu ; voigt2017eu and removing polluted data liu2020learn are some of the advantages of enabling a trained model to forget trained data or model unlearning. Model retraining and approximate learning are two of the major categories in model unlearning liu2020learn . While model retraining removes effects of specific data points or instances from the training dataset by retraining a trained model without them neel2021descent ; kim2022efficient , approximate learning minimizes the computational cost of retraining a model by converting training algorithms into another form, a summation form for example cao2015towards .
While model unlearning focuses on forgetting training data points at the instance level, a more detailed model refinement approach that utilizes instance or image features can provide a platform for rich communication with users which translates to better control over model refinement for users. Explanation based learning proposes to fill this gap by correcting models based on user interaction with- or feedback on model explanations stumpf2009interacting ; kulesza2015principles . Similar to model unlearning, there are two general categories of correcting trained models using explanation based learning: (1) model re-training, which involves generating new training examples to unlearn spurious correlations schramowski2020making ; plumb2021finding ; and (2) model fine-tuning which adds an explanation loss into model training compared to its deviation or similarity from ground truth annotation of objects or spurious regions in an image, respectively ross2017right ; teso2019explanatory ; schramowski2020making ; shao2021right .
3 Methods
3.1 Dataset
To demonstrate the effectiveness of an explanation based learning to refine models, Teso and Kersting teso2019explanatory used a decoy version of the Fashion MNIST dataset xiao2017fashion . It is made up of Fashion MNIST images with 4x4 squares of pixels added to randomly selected image corners. However, the decoys used in this dataset are class independent, making it harder to track them and monitor their impacts on a model’s certainty. We used a class-wise decoy version of the Fashion MNIST dataset that contains synthetic spurious regions in the same image regions across the same class hagos2022impact . We chose this approach of adding class-wise spurious regions for two main reasons: (1) to monitor changes in model confidence after image region perturbations that include spurious regions using MC dropout; and (2) to take advantage of the available annotations of the spurious regions for an explanation based model fine-tuning. The dataset contains 60,000 28x28 pixel images for model training. A test dataset of 10,000 unseen images is used to measure model performance.
3.2 Experimental setup
3.2.1 Model training
After experimenting with different architectures and comparing their performances, a convolutional neural network with one convolutional layer followed by a 50% dropout and a fully connected layer was selected. We trained the model with the Adam optimizer and a decaying learning rate starting with . We used accuracy to measure classification performance, and the mean of 100 MC dropout forward passes to measure the trained model’s certainty in classifying perturbed images. We use MC dropout to assess a trained model’s certainty, to circumvent the overconfidence issue of softmax layers gal2016dropout . We used Paperspace A4000 cloud service to train and test our models. It took us a total of 10 minutes to train a model using classification only, 42 minutes to train a model using an explanation based learning, and it took us an average of 17 minutes to compute mean MC dropouts of perturbed images using 50 images from a target class.
We ended up with two models that have the same architecture: an initial model that was trained using classification loss, , only (Equation 1), and a fine-tuned version of the initial model using explanation based learning. After we assess the initial model’s confidence in classifying perturbed images and visualize the effects of spurious correlations, we fine-tune the model using existing spurious region annotations with an explanation based learning.
| (1) |
For the explanation based model fine-tuning, we used a Right for the Right Reasons (RRR) using GradCAM (Equation 2) explanation loss, , that is computed between GradCAM model explanations and spurious region annotations. L2 regularization is also used to address over-fitting. This is summarised in Equations 2 and 3 using GradCAM explanations, where is the ground truth annotation and normalizes the Grad-CAM output, holds a model’s parameters, with input , labels , predictions , and a parameter regularization term .
| (2) |
| (3) |
3.2.2 Perturbation
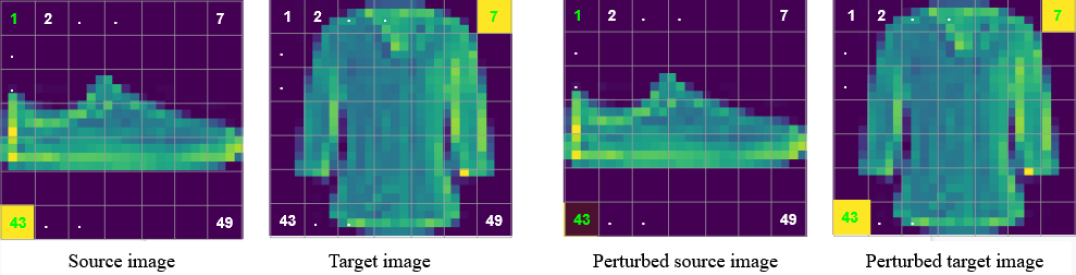
To perform perturbation we randomly select two classes: source class , target class , an input image categorized as , and a set of images, (size=N) categorized as . We apply a 4x4 square of pixels exchange, , between and each image in , . For the decoyed Fashion MNIST, we use images from the Sneaker category as the source class and subset of images (N=50) from the Shirt category as target class. For single images from the source and target classes, we end up with 49 perturbations given the 28x28 size of Fashion MNIST images. Two example images from the source and target classes are presented in Figure 2, where the perturbations are applied by exchanging image patches between the corresponding numbers in the grid. We perform perturbation using images in the existing dataset to generate perturbed images that are in-distribution of the existing training and test dataset. This grounds the generated perturbations to the space of available dataset–making our results plausible.
3.3 Identifying spurious correlations
We associate a trained model’s limits with its ability to correctly classify the perturbed versions of images. Conformity measure has been used to compute a model’s certainty and to identify out of distribution instances artelt2022even , but since the perturbed images we have are in-distribution we resort to the MC dropout.
After applying perturbation of a 4x4 square of pixels exchange, , between and each image in , , as is discussed in Section 3.2.2, we then monitor the trained model’s, , certainty in classifying the perturbed images, using a mean MC dropout value of a 100 loops, . We locate image regions that were used for perturbations that brought the biggest negative impact on the model’s certainty and resulted in the lowest certainty value: . Given the over-dependence of the model, we take these image regions as candidates of spurious correlations and use an explanation based learning (Equation 3) described in Section 3.2.1 to fine-tune the trained model. We perform this fine-tuning to reduce effects of the spurious regions on the model’s prediction.
4 Results and conclusion
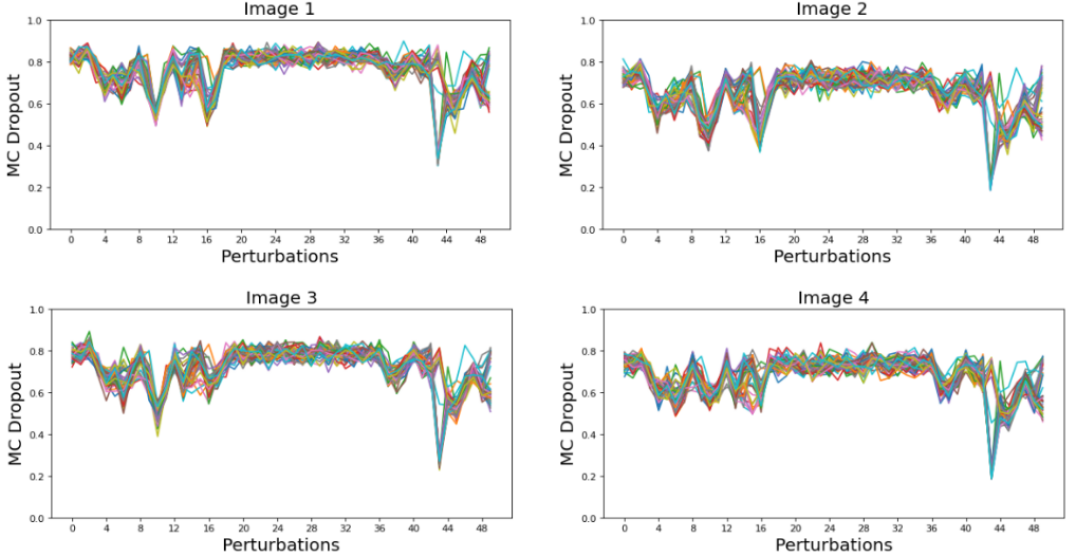
Figure 4 shows MC dropout values of four test images from class Sneaker that were initially correctly classified by the model, after each perturbation against 50 images from the target class, class Shirt. At perturbation number 43 (which perturbs the spurious region as seen in Figure 2), we can see that the model’s mean MC values suddenly drop for all the plots. We normally expect a change of mean MC values as a result of the perturbations, but the changes in mean MC values at the 43rd perturbation are visually much higher than other perturbations. This is because the spurious region in the test images were masked by zeroed regions from the target images. This shows that the trained model was overly dependent on the spurious regions for its prediction. Some of the perturbed images didn’t lose much MC values because the target regions that were used for perturbation had higher pixel intensities and weren’t zero.
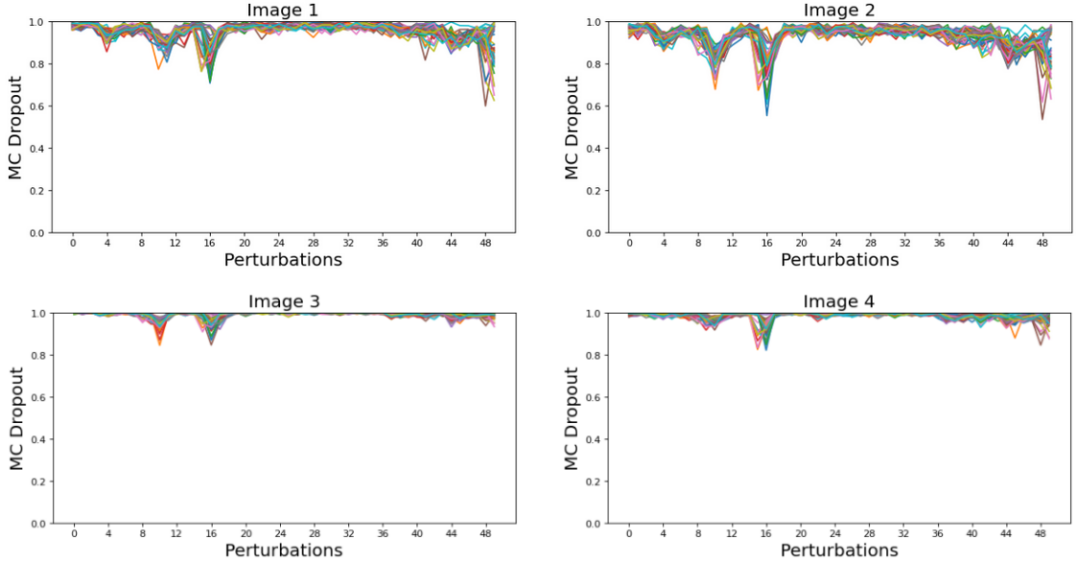
After visualizing the effects of spurious correlations on mean MC dropout values, we refined the trained model using an explanation based learning (Equation 3). Mean MC dropout values of the same test images used in Figure 4 using the resulting refined model and using the same 50 images from the target class are seen in Figure 4. While there are still changes in MC values as a result of perturbations, the huge changes seen in Figure 4 were removed with an explanation based fine-tuning. In addition to the visual conformation of the removal of spurious correlations, while the average change in mean MC values for the original model was at 0.50, the refined model only had an average change of MC values at 0.15.
With a dataset that consisted of synthetically generated spurious regions and by monitoring mean MC dropout values on perturbed images, we were able to see that a trained model was overly dependent on spurious regions. This could be because the spurious regions are on the same location across images of same category in the training dataset. This approach of identifying spurious correlations can be extended to other image classification areas that could naturally have spurious regions in their training dataset. In addition to spotting spurious correlations, we were able to decrease their effects on a model’s certainty with an explanation based learning. By explaining instance feature level limits of a trained model and providing end users with a way to correct spurious correlations, we believe our method can contribute towards developing trustworthy models.
Although we used the existing spurious regions annotations, as user feedback, to implement the explanation based learning, our approach can also be extended to build an explanation based interactive learning where users can actively participate in the model building process. In addition, in our experiments, while the artificially added spurious regions brought the highest negative impacts on a trained model’s certainty, a wider experiment involving other datasets is required to assess if perturbing other image regions could have higher impacts than the spurious regions. For future work, we plan to expand our approach to other datasets that contain confounding regions and to involve user interactions as feedback on model explanations instead of using existing annotations.
Acknowledgements
This publication has emanated from research conducted with the financial support of Science Foundation Ireland under Grant number 18/CRT/6183. For the purpose of Open Access, the author has applied a CC BY public copyright licence to any Author Accepted Manuscript version arising from this submission.
References
- (1) Adebayo, J., Muelly, M., Abelson, H., Kim, B.: Post hoc explanations may be ineffective for detecting unknown spurious correlation. In: International Conference on Learning Representations (2021)
- (2) Artelt, A., Hammer, B.: " even if…"–diverse semifactual explanations of reject. arXiv preprint arXiv:2207.01898 (2022)
- (3) Belton, N., Welaratne, I., Dahlan, A., Hearne, R.T., Hagos, M.T., Lawlor, A., Curran, K.M.: Optimising knee injury detection with spatial attention and validating localisation ability. In: Annual Conference on Medical Image Understanding and Analysis. pp. 71–86. Springer (2021)
- (4) Bussmann, N., Giudici, P., Marinelli, D., Papenbrock, J.: Explainable ai in fintech risk management. Frontiers in Artificial Intelligence 3, 26 (2020)
- (5) Cao, Y., Yang, J.: Towards making systems forget with machine unlearning. In: 2015 IEEE Symposium on Security and Privacy. pp. 463–480. IEEE (2015)
- (6) d’Eon, G., d’Eon, J., Wright, J.R., Leyton-Brown, K.: The spotlight: A general method for discovering systematic errors in deep learning models. In: 2022 ACM Conference on Fairness, Accountability, and Transparency. pp. 1962–1981 (2022)
- (7) Gal, Y., Ghahramani, Z.: Dropout as a bayesian approximation: Representing model uncertainty in deep learning. In: international conference on machine learning. pp. 1050–1059. PMLR (2016)
- (8) Garreau, D., Mardaoui, D.: What does lime really see in images? In: International Conference on Machine Learning. pp. 3620–3629. PMLR (2021)
- (9) Hagos, M.T., Curran, K.M., Mac Namee, B.: Impact of feedback type on explanatory interactive learning. In: International Symposium on Methodologies for Intelligent Systems. pp. 127–137. Springer (2022)
- (10) Hagos, M.T., Killeen, R.P., Curran, K.M., Mac Namee, B., Initiative, A.D.N., et al.: Interpretable identification of mild cognitive impairment progression using stereotactic surface projections. In: PAIS 2022, pp. 153–156. IOS Press (2022)
- (11) Hlosta, M., Papathoma, T., Herodotou, C.: Explaining errors in predictions of at-risk students in distance learning education. In: International Conference on Artificial Intelligence in Education. pp. 119–123. Springer (2020)
- (12) Keane, M.T., Smyth, B.: Good counterfactuals and where to find them: A case-based technique for generating counterfactuals for explainable ai (xai). In: International Conference on Case-Based Reasoning. pp. 163–178. Springer (2020)
- (13) Kenny, E.M., Keane, M.T.: On generating plausible counterfactual and semi-factual explanations for deep learning. In: Proceedings of the AAAI Conference on Artificial Intelligence. vol. 35, pp. 11575–11585 (2021)
- (14) Kim, J., Woo, S.S.: Efficient two-stage model retraining for machine unlearning. In: Proceedings of the IEEE/CVF Conference on Computer Vision and Pattern Recognition. pp. 4361–4369 (2022)
- (15) Kulesza, T., Burnett, M., Wong, W.K., Stumpf, S.: Principles of explanatory debugging to personalize interactive machine learning. In: Proceedings of the 20th international conference on intelligent user interfaces. pp. 126–137 (2015)
- (16) Linusson, H., Johansson, U., Boström, H., Löfström, T.: Classification with reject option using conformal prediction. In: Pacific-Asia Conference on Knowledge Discovery and Data Mining. pp. 94–105. Springer (2018)
- (17) Liu, Y., Ma, Z., Liu, X., Liu, J., Jiang, Z., Ma, J., Yu, P., Ren, K.: Learn to forget: Machine unlearning via neuron masking. arXiv preprint arXiv:2003.10933 (2020)
- (18) Mantelero, A.: The eu proposal for a general data protection regulation and the roots of the ‘right to be forgotten’. Computer Law & Security Review 29(3), 229–235 (2013)
- (19) Melotti, G., Premebida, C., Bird, J.J., Faria, D.R., Gonçalves, N.: Probabilistic object classification using cnn ml-map layers. arXiv preprint arXiv:2005.14565 (2020)
- (20) Neel, S., Roth, A., Sharifi-Malvajerdi, S.: Descent-to-delete: Gradient-based methods for machine unlearning. In: Algorithmic Learning Theory. pp. 931–962. PMLR (2021)
- (21) Nicholls, J., Kuppa, A., Le-Khac, N.A.: Financial cybercrime: A comprehensive survey of deep learning approaches to tackle the evolving financial crime landscape. IEEE Access (2021)
- (22) Omeiza, D., Speakman, S., Cintas, C., Weldermariam, K.: Smooth grad-cam++: An enhanced inference level visualization technique for deep convolutional neural network models. arXiv preprint arXiv:1908.01224 (2019)
- (23) Petsiuk, V., Das, A., Saenko, K.: Rise: Randomized input sampling for explanation of black-box models. arXiv preprint arXiv:1806.07421 (2018)
- (24) Phillips, P.J., Hahn, C.A., Fontana, P.C., Broniatowski, D.A., Przybocki, M.A.: Four principles of explainable artificial intelligence. Gaithersburg, Maryland (2020)
- (25) Plumb, G., Johnson, N., Cabrera, Á.A., Ribeiro, M.T., Talwalkar, A.: Evaluating systemic error detection methods using synthetic images. arXiv preprint arXiv:2207.04104 (2022)
- (26) Plumb, G., Ribeiro, M.T., Talwalkar, A.: Finding and fixing spurious patterns with explanations. arXiv preprint arXiv:2106.02112 (2021)
- (27) Ribeiro, M.T., Singh, S., Guestrin, C.: " why should i trust you?" explaining the predictions of any classifier. In: Proceedings of the 22nd ACM SIGKDD international conference on knowledge discovery and data mining. pp. 1135–1144 (2016)
- (28) Ross, A.S., Hughes, M.C., Doshi-Velez, F.: Right for the right reasons: Training differentiable models by constraining their explanations. arXiv preprint arXiv:1703.03717 (2017)
- (29) Schramowski, P., Stammer, W., Teso, S., Brugger, A., Herbert, F., Shao, X., Luigs, H.G., Mahlein, A.K., Kersting, K.: Making deep neural networks right for the right scientific reasons by interacting with their explanations. Nature Machine Intelligence 2(8), 476–486 (2020)
- (30) Selvaraju, R.R., Cogswell, M., Das, A., Vedantam, R., Parikh, D., Batra, D.: Grad-cam: Visual explanations from deep networks via gradient-based localization. In: Proceedings of the IEEE international conference on computer vision. pp. 618–626 (2017)
- (31) Shao, X., Skryagin, A., Schramowski, P., Stammer, W., Kersting, K.: Right for better reasons: Training differentiable models by constraining their influence function. In: Proceedings of Thirty-Fifth AAAI Conference on Artificial Intelligence (AAAI) (2021)
- (32) Singla, S., Feizi, S.: Salient imagenet: How to discover spurious features in deep learning? In: International Conference on Learning Representations (2021)
- (33) Singla, S., Nushi, B., Shah, S., Kamar, E., Horvitz, E.: Understanding failures of deep networks via robust feature extraction. In: Proceedings of the IEEE/CVF Conference on Computer Vision and Pattern Recognition. pp. 12853–12862 (2021)
- (34) Stumpf, S., Rajaram, V., Li, L., Wong, W.K., Burnett, M., Dietterich, T., Sullivan, E., Herlocker, J.: Interacting meaningfully with machine learning systems: Three experiments. International journal of human-computer studies 67(8), 639–662 (2009)
- (35) Teso, S., Kersting, K.: Explanatory interactive machine learning. In: Proceedings of the 2019 AAAI/ACM Conference on AI, Ethics, and Society. pp. 239–245 (2019)
- (36) Voigt, P., Von dem Bussche, A.: The eu general data protection regulation (gdpr). A Practical Guide, 1st Ed., Cham: Springer International Publishing 10(3152676), 10–5555 (2017)
- (37) Wang, H., Wang, Z., Du, M., Yang, F., Zhang, Z., Ding, S., Mardziel, P., Hu, X.: Score-cam: Score-weighted visual explanations for convolutional neural networks. In: Proceedings of the IEEE/CVF conference on computer vision and pattern recognition workshops. pp. 24–25 (2020)
- (38) Xiao, H., Rasul, K., Vollgraf, R.: Fashion-mnist: a novel image dataset for benchmarking machine learning algorithms. arXiv preprint arXiv:1708.07747 (2017)
- (39) Zeiler, M.D., Fergus, R.: Visualizing and understanding convolutional networks. In: European conference on computer vision. pp. 818–833. Springer (2014)
- (40) Zhou, B., Khosla, A., Lapedriza, A., Oliva, A., Torralba, A.: Learning deep features for discriminative localization. In: Proceedings of the IEEE conference on computer vision and pattern recognition. pp. 2921–2929 (2016)
Checklist
-
1.
For all authors…
-
(a)
Do the main claims made in the abstract and introduction accurately reflect the paper’s contributions and scope? [Yes]
-
(b)
Did you describe the limitations of your work? [Yes]
-
(c)
Did you discuss any potential negative societal impacts of your work? [N/A]
-
(d)
Have you read the ethics review guidelines and ensured that your paper conforms to them? [Yes]
-
(a)
-
2.
If you are including theoretical results…
-
(a)
Did you state the full set of assumptions of all theoretical results? [N/A]
-
(b)
Did you include complete proofs of all theoretical results? [N/A]
-
(a)
-
3.
If you ran experiments…
-
(a)
Did you include the code, data, and instructions needed to reproduce the main experimental results (either in the supplemental material or as a URL)? [No] We have included the instructions to reproduce the experiments (See Section 3). We will release the source code soon.
-
(b)
Did you specify all the training details (e.g., data splits, hyperparameters, how they were chosen)? [Yes]
-
(c)
Did you report error bars (e.g., with respect to the random seed after running experiments multiple times)? [No]
-
(d)
Did you include the total amount of compute and the type of resources used (e.g., type of GPUs, internal cluster, or cloud provider)? [Yes]
-
(a)
-
4.
If you are using existing assets (e.g., code, data, models) or curating/releasing new assets…
-
(a)
If your work uses existing assets, did you cite the creators? [Yes]
-
(b)
Did you mention the license of the assets? [N/A]
-
(c)
Did you include any new assets either in the supplemental material or as a URL? [N/A]
-
(d)
Did you discuss whether and how consent was obtained from people whose data you’re using/curating? [N/A]
-
(e)
Did you discuss whether the data you are using/curating contains personally identifiable information or offensive content? [N/A]
-
(a)
-
5.
If you used crowdsourcing or conducted research with human subjects…
-
(a)
Did you include the full text of instructions given to participants and screenshots, if applicable? [N/A]
-
(b)
Did you describe any potential participant risks, with links to Institutional Review Board (IRB) approvals, if applicable? [N/A]
-
(c)
Did you include the estimated hourly wage paid to participants and the total amount spent on participant compensation? [N/A]
-
(a)