:
\theoremsep
\jmlrvolume
\firstpageno1
\jmlryear2022
\jmlrworkshopMachine Learning for Health (ML4H) 2022
Using Open-Ended Stressor Responses to Predict Depressive Symptoms across Demographics
Abstract
Stressors are related to depression, but this relationship is complex. We investigate the relationship between open-ended text responses about stressors and depressive symptoms across gender and racial/ethnic groups. First, we use topic models and other NLP tools to find thematic and vocabulary differences when reporting stressors across demographic groups. We train language models using self-reported stressors to predict depressive symptoms, finding a relationship between stressors and depression. Finally, we find that differences in stressors translate to downstream performance differences across demographic groups.
keywords:
depression, stressors, NLP, topic models1 Introduction
Despite depression being one of the most common mental health disorders, underrepresented communities continue to be under-diagnosed and under-treated (Sorkin et al., 2011; Stockdale et al., 2008). Further, there is a well documented difference in depression prevalence in gender (Brody et al., 2018) and racial/ethnic groups (Barnes et al., 2013; Woodward et al., 2013). One theory for the differences in depression prevalence, diagnosis and treatment across demographics groups is Cultural Relativity, which attributes these variations to differential life events, vulnerability and symptoms (Whaley, 1997; Moazen-Zadeh and Assari, 2016; Assari and Moazen-Zadeh, 2016). Given that stressors have been shown to differ across demographics (Pearlin et al., 2005), stress has been thought to play a role in depression differences by demographics (Nolen-Hoeksema and Hilt, 2009). The hypothesis is that certain demographic groups, e.g. women or African Americans, have greater exposure and/or are more vulnerable to stressors, which has been associated with depressed mood and general anxiety (Bowleg et al., 2020; Fedina et al., 2018; Kwate and Goodman, 2015; Marchand et al., 2016; Williams et al., 1997). However, recent studies have stressed possible biases in the analysis of stressors studies, e.g. standardized stressor questionnaires lack the power or specificity of interview or open-ended measures (Acharya et al., 2018).
We take advantage of an unusual data collection effort that provides access to clinically validated scales of depressive symptoms as well as open-ended survey responses about stressors, to analyze the relationship of stressors and depression across gender and racial/ethnic groups. Open-ended survey questions may be particularly effective at studying the complex relationship of stressors and depression across demographics (Weger et al., 2022). Our hypothesis is that racial/ethnic and gender groups share different stressors, and these responses are not equally predictive of their actual mental health state. To analyze differences in text across demographics, we automatically analyze survey text responses using methods based on vocabulary distributions, such as log-odds-ratios and Linguistic Inquiry and Word Count (Pennebaker et al., 2015, LIWC) distributions, as well as topics discovered by a structural topic model, which allows covariates to affect topical prevalence and topical content (Roberts et al., 2013). We also train language models to study the relationship of stressors and depression across demographics. In summary, our contributions are the following:
-
•
We analyze differences in stressors across gender and racial/ethnic groups using open-ended text responses
-
•
We contextualize the relationship of stressors and depression by using text responses of stressors as predictors for depression
-
•
We analyze the performance of these predictive models across gender and racial/ethnic groups
2 Background
Stressors have a complex relationship with depression (Acharya et al., 2018). For instance, while studies have shown that stressful events are associated with episodes of depression (Wike, 2014; Hammen, 2005; Kessler, 1997; Mazure, 1998), the neurobiological response to stress does not always lead to depressive symptoms (Van Praag et al., 2004; Bonde, 2008). Therefore, while determining the exact nature of the relationship between stressors and depression may lead to more effective treatment (Van Praag et al., 2004), we do not expect high performance from models that only utilize stressors to predict depression.
Relevant to our study, stressors and stress levels are known to vary across demographics, such as gender (Acharya et al., 2018; Parker and Brotchie, 2010) and race (Alang et al., 2021; Pearlin et al., 1997). Stressors related to changes in social activities, eating, workload, education performance, living environments, parental relations, and financial strain are more prevalent in women (Acharya et al., 2018; Lewis et al., 2015; Cherenack and Sikkema, 2022; Elliott, 2001). Black college students experience additional stress related to being a racial minority in predominantly White settings (Ancis et al., 2000). Other stressors, such as police encounters, have been linked with Latinx and African American populations compared to White populations (Alang et al., 2021). The dichotomy of stressors is usually studied between majority White populations and a minority racial group, however, some work suggests that race-related stressors may be different across non-White populations, e.g. African American students self-report higher levels of race-related stress compared to Chicano and Filipino counterparts (Baker, 1988).
3 Methods
We present the dataset used in our study (\sectionrefsec:methods-data), our procedure for analyzing stressors (\sectionrefsec:methods-stressors), and the details of the prediction task (\sectionrefsec:methods-prediction.)
3.1 Data
We use the UMD-ODH dataset (Kelly et al., 2020, 2021), which includes self-reported demographics and clinically validated mental health scales for depressive symptoms, QIDS-sr16 (Rush et al., 2003), and psychosis, CAPE-15 (Capra et al., 2017), as well as an open-ended question about stressors: Describe the biggest source of stress in your life at the moment. What things have you done to deal with it?
Participants were allowed to respond in follow-up surveys, with 47% of subjects doing 2 or more survey responses and an average 3.3 surveys per subject. We select the survey responses that have demographic data available, and remove duplicates and responses with less than 3 tokens resulting in survey responses. We used the CLD3111https://github.com/google/cld3 language identification tool and Google Translate222https://github.com/ssut/py-googletrans to find and translate non-English responses ( Spanish). We obtain the depressive symptom labels from QIDS-sr16 cutoffs: 7 for minor depressive symptoms and 9 for major depressive symptoms, following prior work (Sung et al., 2013). \tablereftab:data-stats shows the dataset statistics for depressive symptoms and demographics.
3.2 Stressors Analysis
We analyze open-ended text responses on stressors using both vocabulary and topic model methods. As we summarized in \sectionrefsec:background, there is evidence that stressors differ across demographics. Therefore, we use these methods to compare distributions of two groups: pair-wise comparisons for gender and racial/ethnic groups.
Vocabulary Analysis. To analyze the vocabulary distributions of the survey responses we employed the log-odds-ratio, informative Dirichlet prior333COCA English corpus is the prior (Davies, 2008), which is often used to study vocabulary differences between groups (Monroe et al., 2008). We utilized the Spacy English tokenizer (Honnibal and Montani, 2017), and remove punctuation and digits. Tokens that were not used in at least 5 different surveys were removed from the vocabulary. Additionally, in order to avoid subject-bias in the analysis, we experimented with using either log of frequencies (less restrictive) or bag-of-words (more restrictive) at the subject level to restrict the impact each individual respondent had on the distribution, finding that log of frequencies yielded a good balance. In addition to vocabulary, we also used categories from the LIWC dictionary, which has been used in other mental health tasks (Aguirre and Dredze, 2021).
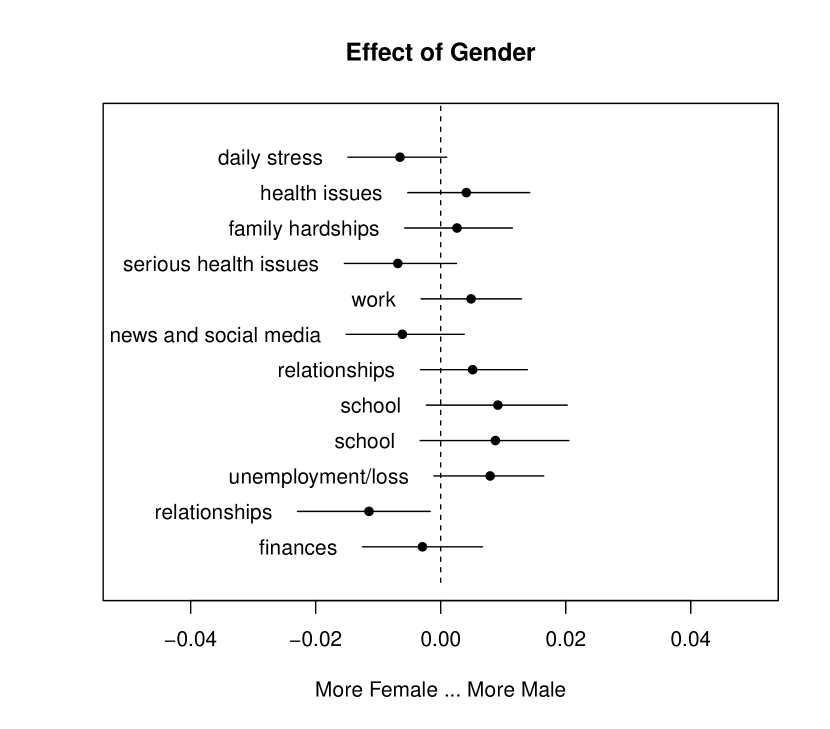
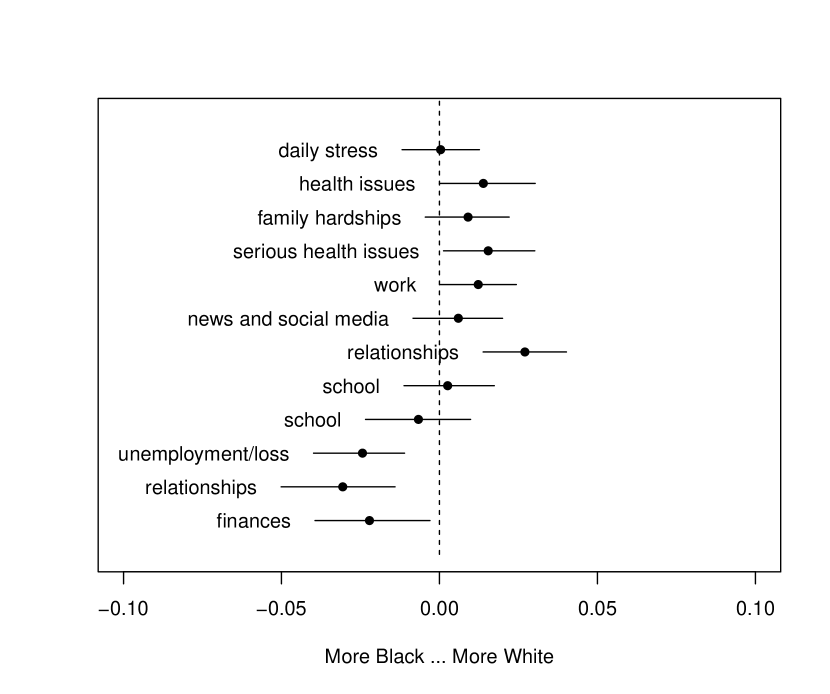
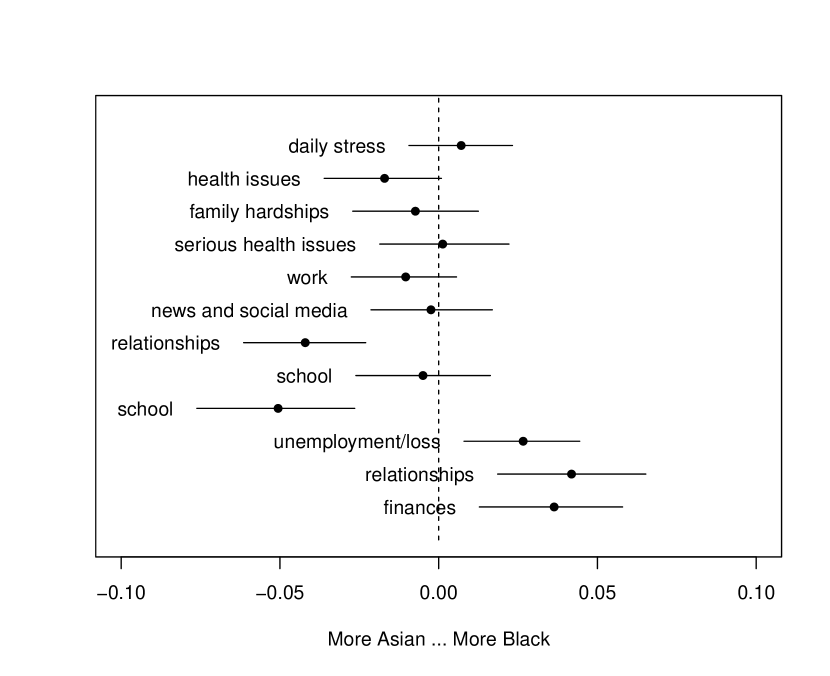
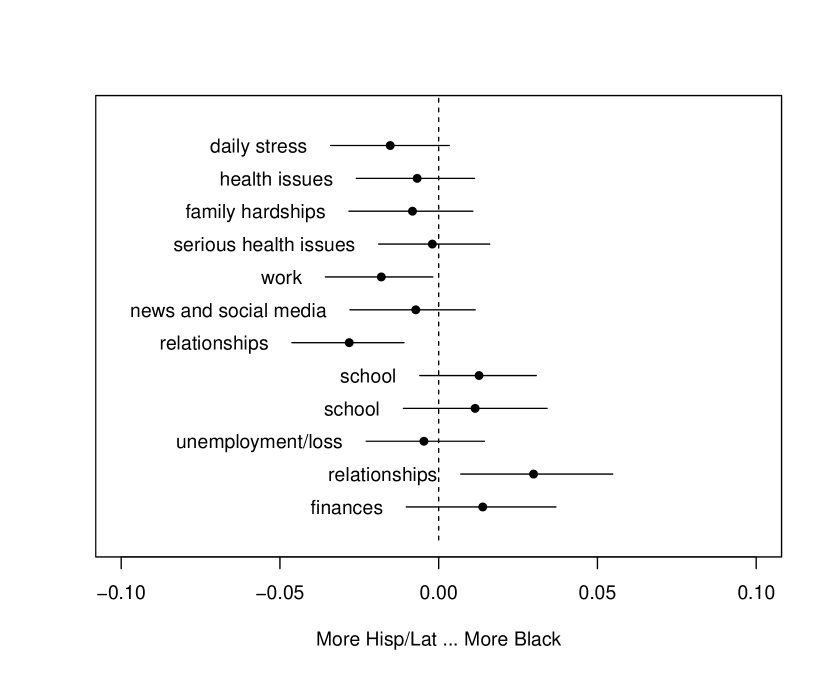
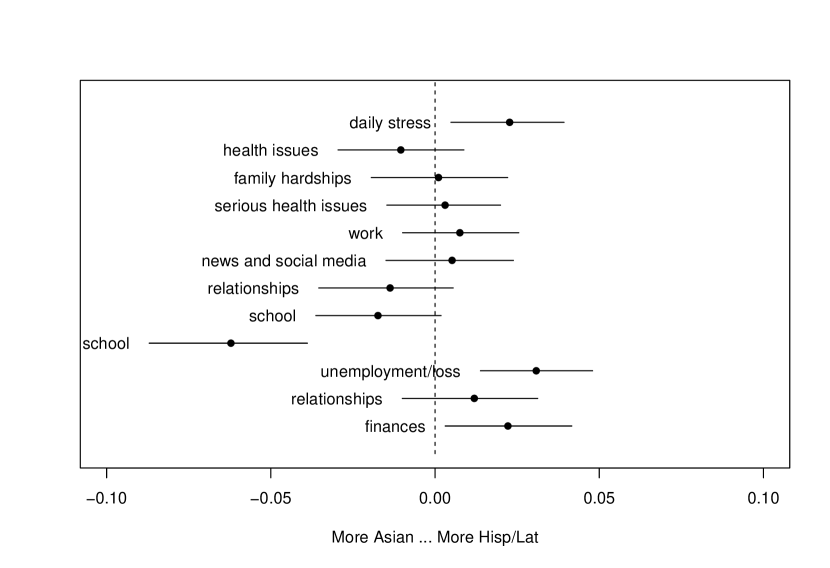
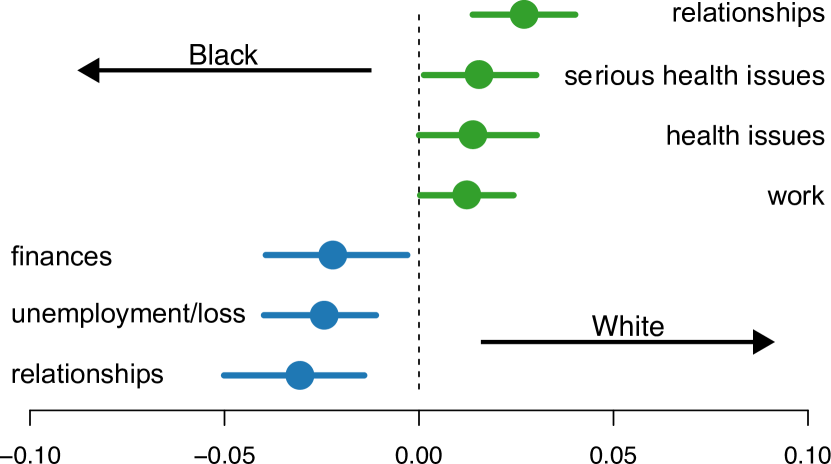
Topic Models. We trained a structural topic model (STM) to compare the topic distributions across covariates (Roberts et al., 2013). The covariates for the analysis are the gender and racial/ethnic labels, and the depressive symptom labels based on QIDS-sr19 cutoffs. We also add a COVID-19 covariate, as we observe differences in populations before and after the COVID-19 pandemic.444COVID-19 population analysis in \appendixrefapd:covid-19 An author of the paper and two non-author annotators agreed on topic cohesion (whether a topic has a name or not) and names using the top 30 tokens and text responses ranked by topic proportion; Fleiss’ kappa showed that there was fair agreement between the annotators, . \figurereffig:black_white_pretty show the effect of the race covariate (Black vs White participants) on the final topics annotated.
3.3 Prediction Task
We formulate the prediction task as a binary classification task based on the QIDS-sr19 cutoff scores by joining the Minor and Major Depressive symptom surveys into one category.555We also experimented with control vs Major Depressive symptoms as labels in \appendixrefapd:mdd-task We performed a random train-test split (90-10%) ensuring that surveys from the same subject were not shared across splits. We train both linear and neural models.
Linear. Inspired by prior work predicting depression using social media, we utilize TF-IDF, 50-dimensional LDA topic distribution LDA (Blei et al., 2003), 200-dimensional mean-pooled vector of GloVe embeddings Pennington et al. (2014) and LIWC categories as features for our models (Aguirre et al., 2021). We experimented with -regularized Logistic Regression and SGD Classifiers. See \appendixrefapd:model-specs for more details, e.g. hyperparameter search space.
Neural. We experimented with fine-tuning MentalBERT (Ji et al., 2022), an example of a recently introduced large language model for mental health classification tasks. In order to contextualize the performance due to pretraining on mental health data, we also finetuned BERT (Devlin et al., 2018) and ClinicalBERT (Alsentzer et al., 2019). For each task, we fine-tuned all layers of the models in addition to the classification head. Following Barbieri et al. (2020), we performed a parameter search over learning rate values of , , , and , with a batch size of for at least epochs.
fig:black_white_pretty
Fairness Metric. Language models are known to suffer from biases associated with demographics (Aguirre et al., 2021). Furthermore, models may be fair across a single demographic axis, but biases for intersectional groups (known as Fairness Gerrymandering (Kearns et al., 2018).) We check the performance of our models across intersectional groups. Intersectional fairness has been the focus of recent work, either adapting single axis fairness definitions to intersectional groups (Ghosh et al., 2021) or creating new definitions explicitly for intersectional settings (Kearns et al., 2018). We utilize an empirical estimation of an Differential Fairness (Foulds et al., 2020) definition of Equalized Odds adapted from Morina et al. (2019): -Differential Equalized Odds (-D).666See \appendixrefapd:fairness-definition for the detailed definition.
4 Results & Analysis
4.1 Stressors Analysis
We report the analyses of the stressors reported in the survey responses. \figurereffig:black_white_pretty shows an example of the results the topic model when comparing Black and White individuals in the dataset; \appendixrefapd:stressors-figures shows the rest of the topic model and log-odds-ratio, Informative Dirichlet prior pair-wise comparisons across the demographics.
Gender. We find stressors related to health (vocab: COVID-19, pandemic, exercising; liwc: health), finances (vocab: finances; liwc: money, reward), relationships (vocab: boyfriend; liwc: family, home) and the self (vocab: I’m, my, me, myself; liwc: 1st-person-pronoun) more likely in women than men population. Stressors related to social interactions (vocab: he, his, their, she, we; liwc: 2nd&3rd-person-pronoun) more likely in men than women. Stressors related to education (vocab: schoolwork, homework, finals) were related to both.
Similar to prior work, we find stressors related to finances, relationships and health are more prevalent for women than men. However, we find that stressors related to education are prevalent in both groups, contradicting prior work (Acharya et al., 2018).
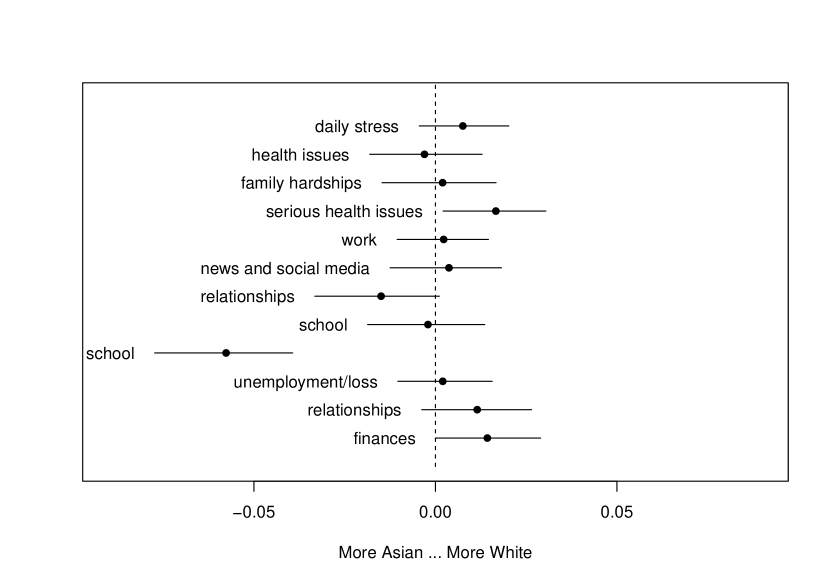
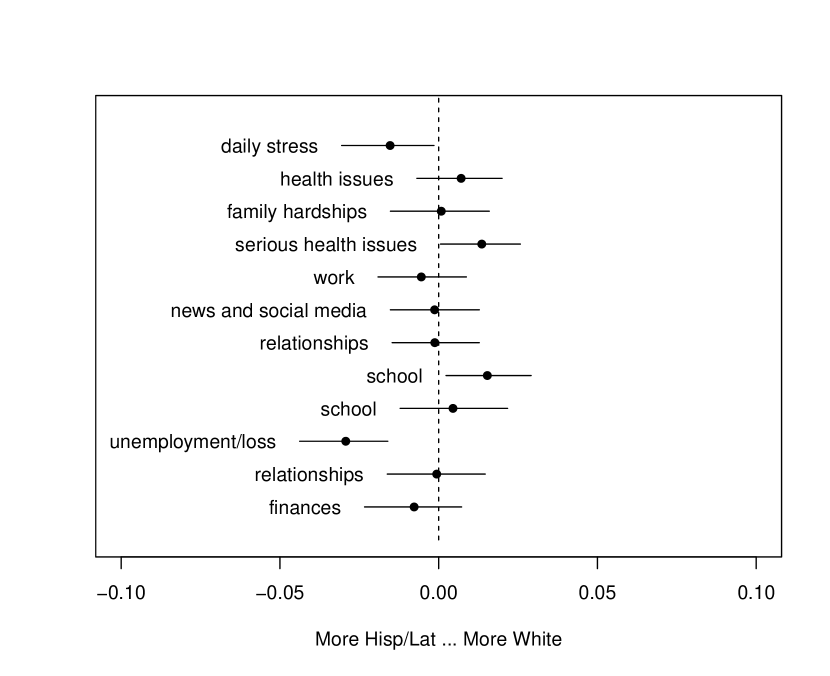
Race/Ethnicity. In the African American group, text responses related to community (vocab: programs[governmental], neighbors) and religion (liwc: relig) were more likely than other groups. In the Asian American group, stressors related to scheduling (vocab: scheduling, managing, organized, balancing, time; liwc: time) were more likely than other groups. In the Hispanic/Latinx group, stressors related to government (vocab: government, state; liwc: social), death (vocab: loss[family member/friend]), and basic needs (vocab: basic[needs], daily) were more likely than other groups. And finally, in the White American group, text responses related to family (liwc: family, home) and coping mechanisms (vocab: therapist, relax, yoga, cope) were more likely than other groups. Stressors related to education were related to Hispanic/Latinx, Black and Asian groups; stressors related to health were more related with Hispanic/Latinx, Black and White groups; and, stressors related to finances were related to all groups.
Consistent with prior work, we found stressors related to poverty, e.g. community in African Americans and government in Hispanic/Latinx, related more with marginalized populations, and that religion, more prevalent with African Americans, may be a coping mechanism (Strawbridge et al., 1998).
4.2 Prediction Task
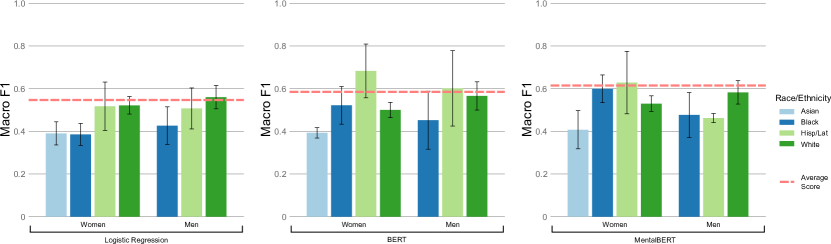
fig:model-performance
We performed a hyperparameter search using 10-fold cross validation and report the best mean and standard deviation macro-averaged F1 score of the validation sets for each model, as well as the corresponding test set performance in \tablereftab:results-prediction-mdd-task.
Results suggest that the neural models outperform linear models. This performance difference is expected since the neural models have been pre-trained with much more data and have been shown to outperform linear models in similar tasks (Rao et al., 2020). Still, neural models have drawback, e.g. lack of interpretability, more compute resources.
Comparing the neural models, we expected MentalBERT to outperform the other variants of BERT, as it was further trained on mental health related text and was shown to outperform these models on similar tasks based on social media. However, we observe minimal performance differences between MentalBERT, BERT and ClinicalBERT, suggesting that the mental health pre-training performance gain may not generalize to other mental health tasks or domains.
tab:results-fairness
| Validation | Test | |
|---|---|---|
| Logistic Regression | 0.20 | 1.61 |
| SGD Classifier | 0.34 | 0.76 |
| BERT | 0.33 | 0.81 |
| ClinicalBERT | 0.27 | 0.96 |
| MentalBERT | 0.37 | 1.10 |
Additionally, we investigate the performance difference of the models across demographics, as measured by -Differential Equal Odds (-D), by combining the predictions of the resulting models of the 10-fold cross validation. The results in \tablereftab:results-fairness suggest that the linear models tend to be fairer compared to the neural models, however, linear models perform closer to random performance which suggest that the performance is close to random for all demographic sub-groups. Comparing the neural models, there doesn’t seem to be a clear trend, except that MentalBERT seems to be the most unfair neural model.
The fairness and performance results suggest that there is a performance-fairness balance, where higher performing models tend to be less fair. A difference compared with prior work is that the low fairness scores are not between majority and minority groups (e.g. often between White men and African American women), but actually from two underrepresented groups: Latinx (higher performance) and Asian American (lower performance), as seen in \figurereffig:model-performance. This performance disparity may also be due to the relationship between stressors and depression across demographics, as some subgroups’ stressors may be more related than others, as explored in \sectionrefsec:background.
5 Conclusion & Future Work
We studied the use of open-ended text responses about stressors to analyze the relationship between stressors and depression across gender and racial/ethnic groups. We find that stressors vary across demographics. Further, we train language models on the stressors responses to predict depressive symptoms, finding a relation between stressors and depression. However, these stressors are not equally predictive of depressive symptoms across demographics, as we find a trade-off between overall model performance and fairness across demographics.
Future work may investigate the use of demographic specific cut-off scores for QIDS-sr16 as there is evidence these may be correlated with these demographics (Lamoureux et al., 2010). Additionally, future annotation efforts on this dataset or others may enable studying the relationship between stressors and coping mechanism, providing more structure or increasing the size of the data that predictive models could use to increase the classification performance. Further, while our study does not include racial/ethnic and gender small minorities due to insufficient sample size, future work could study these groups which often experience higher levels of stress which has been linked with elevated risk of depressive symptoms or major depressive disorder episodes (Hoy-Ellis and Fredriksen-Goldsen, 2016).
This study makes a step towards understanding the relationship between stressors and depression contextualized by gender and racial/ethnic demographics, and could be expanded by efforts that seek to provide personalized care. However, we must proceed with caution when seeking to generalize the relationship between stressors and depression across demographics.
We would like to acknowledge Rosalyn Shin and Elizabeth Salesky for annotating the topic model results. This work was supported in part by the National Science Foundation under award 2124270.
References
- Acharya et al. (2018) Lala Acharya, Lan Jin, and William Collins. College life is stressful today–emerging stressors and depressive symptoms in college students. Journal of American college health, 66(7):655–664, 2018.
- Aguirre and Dredze (2021) Carlos Aguirre and Mark Dredze. Qualitative analysis of depression models by demographics. In Proceedings of the Seventh Workshop on Computational Linguistics and Clinical Psychology: Improving Access, pages 169–180, Online, June 2021. Association for Computational Linguistics. 10.18653/v1/2021.clpsych-1.19. URL https://aclanthology.org/2021.clpsych-1.19.
- Aguirre et al. (2021) Carlos Aguirre, Keith Harrigian, and Mark Dredze. Gender and racial fairness in depression research using social media. In Proceedings of the 16th Conference of the European Chapter of the Association for Computational Linguistics: Main Volume, pages 2932–2949, 2021.
- Alang et al. (2021) Sirry Alang, Donna McAlpine, and Malcolm McClain. Police encounters as stressors: Associations with depression and anxiety across race. Socius, 7:2378023121998128, 2021.
- Alsentzer et al. (2019) Emily Alsentzer, John Murphy, William Boag, Wei-Hung Weng, Di Jin, Tristan Naumann, and Matthew McDermott. Publicly available clinical BERT embeddings. In Proceedings of the 2nd Clinical Natural Language Processing Workshop, pages 72–78, Minneapolis, Minnesota, USA, June 2019. Association for Computational Linguistics. 10.18653/v1/W19-1909. URL https://www.aclweb.org/anthology/W19-1909.
- Ancis et al. (2000) Julie R Ancis, William E Sedlacek, and Jonathan J Mohr. Student perceptions of campus cultural climate by race. Journal of Counseling & Development, 78(2):180–185, 2000.
- Assari and Moazen-Zadeh (2016) Shervin Assari and Ehsan Moazen-Zadeh. Ethnic variation in the cross-sectional association between domains of depressive symptoms and clinical depression. Frontiers in psychiatry, 7:53, 2016.
- Baker (1988) LA Baker. The relationship between background factors, life stresses, and sociopolitical orientation in ethnic minority freshman at a predominantly white university. Unpublished manuscript, University of California, Los Angeles, 1988.
- Barbieri et al. (2020) Francesco Barbieri, Jose Camacho-Collados, Luis Espinosa Anke, and Leonardo Neves. TweetEval: Unified benchmark and comparative evaluation for tweet classification. In Findings of the Association for Computational Linguistics: EMNLP 2020, pages 1644–1650, Online, November 2020. Association for Computational Linguistics. 10.18653/v1/2020.findings-emnlp.148. URL https://aclanthology.org/2020.findings-emnlp.148.
- Barnes et al. (2013) David M Barnes, Katherine M Keyes, and Lisa M Bates. Racial differences in depression in the united states: how do subgroup analyses inform a paradox? Social psychiatry and psychiatric epidemiology, 48(12):1941–1949, 2013.
- Blei et al. (2003) David M Blei, Andrew Y Ng, and Michael I Jordan. Latent dirichlet allocation. Journal of machine Learning research, 3(Jan):993–1022, 2003.
- Bonde (2008) Jens Peter Ellekilde Bonde. Psychosocial factors at work and risk of depression: a systematic review of the epidemiological evidence. Occupational and environmental medicine, 65(7):438–445, 2008.
- Bowleg et al. (2020) Lisa Bowleg, Ana Maria del Río-González, Mary Mbaba, Cheriko A Boone, and Sidney L Holt. Negative police encounters and police avoidance as pathways to depressive symptoms among us black men, 2015–2016. American Journal of Public Health, 110(S1):S160–S166, 2020.
- Brody et al. (2018) Debra Brody, Laura Pratt, and Jeffery Hughes. Prevalence of depression among adults aged 20 and over: United states, 2013-2016. NCHS data brief, pages 1–8, 02 2018.
- Capra et al. (2017) Carina Capra, David J Kavanagh, Leanne Hides, and James G Scott. Current cape-15: a measure of recent psychotic-like experiences and associated distress. Early intervention in psychiatry, 11(5):411–417, 2017.
- Cherenack and Sikkema (2022) Emily M Cherenack and Kathleen J Sikkema. Puberty-and menstruation-related stressors are associated with depression, anxiety, and reproductive tract infection symptoms among adolescent girls in tanzania. International journal of behavioral medicine, 29(2):160–174, 2022.
- Davies (2008) Mark Davies. The corpus of contemporary american english (coca): 560 million words, 1990-present, 2008.
- Devlin et al. (2018) Jacob Devlin, Ming-Wei Chang, Kenton Lee, and Kristina Toutanova. BERT: pre-training of deep bidirectional transformers for language understanding. CoRR, abs/1810.04805, 2018. URL http://arxiv.org/abs/1810.04805.
- Elliott (2001) Marta Elliott. Gender differences in causes of depression. Women & Health, 33(3-4):183–198, 2001.
- Ettman et al. (2020) Catherine K Ettman, Salma M Abdalla, Gregory H Cohen, Laura Sampson, Patrick M Vivier, and Sandro Galea. Prevalence of depression symptoms in us adults before and during the covid-19 pandemic. JAMA network open, 3(9):e2019686–e2019686, 2020.
- Ettman et al. (2021) Catherine K Ettman, Salma M Abdalla, Gregory H Cohen, Laura Sampson, Patrick M Vivier, and Sandro Galea. Low assets and financial stressors associated with higher depression during covid-19 in a nationally representative sample of us adults. J Epidemiol Community Health, 75(6):501–508, 2021.
- Fedina et al. (2018) Lisa Fedina, Bethany L Backes, Hyun-Jin Jun, Roma Shah, Boyoung Nam, Bruce G Link, and Jordan E DeVylder. Police violence among women in four us cities. Preventive medicine, 106:150–156, 2018.
- Foulds et al. (2020) James R Foulds, Rashidul Islam, Kamrun Naher Keya, and Shimei Pan. An intersectional definition of fairness. In 2020 IEEE 36th International Conference on Data Engineering (ICDE), pages 1918–1921. IEEE, 2020.
- Ghosh et al. (2021) Avijit Ghosh, Lea Genuit, and Mary Reagan. Characterizing intersectional group fairness with worst-case comparisons. In Artificial Intelligence Diversity, Belonging, Equity, and Inclusion, pages 22–34. PMLR, 2021.
- Hammen (2005) Constance Hammen. Stress and depression. Annual Review of Clinical Psychology(2005), 1(1):293–319, 2005.
- Hardt et al. (2016) Moritz Hardt, Eric Price, and Nati Srebro. Equality of opportunity in supervised learning. Advances in neural information processing systems, 29, 2016.
- Honnibal and Montani (2017) Matthew Honnibal and Ines Montani. spaCy 2: Natural language understanding with Bloom embeddings, convolutional neural networks and incremental parsing. 2017.
- Hoy-Ellis and Fredriksen-Goldsen (2016) Charles P Hoy-Ellis and Karen I Fredriksen-Goldsen. Lesbian, gay, & bisexual older adults: Linking internal minority stressors, chronic health conditions, and depression. Aging & Mental Health, 20(11):1119–1130, 2016.
- Ji et al. (2022) Shaoxiong Ji, Tianlin Zhang, Luna Ansari, Jie Fu, Prayag Tiwari, and Erik Cambria. MentalBERT: Publicly Available Pretrained Language Models for Mental Healthcare. In Proceedings of LREC, 2022.
- Kearns et al. (2018) Michael Kearns, Seth Neel, Aaron Roth, and Zhiwei Steven Wu. Preventing fairness gerrymandering: Auditing and learning for subgroup fairness. In International Conference on Machine Learning, pages 2564–2572. PMLR, 2018.
- Kelly et al. (2020) Deanna L Kelly, Max Spaderna, Vedrana Hodzic, Suraj Nair, Christopher Kitchen, Anne E Werkheiser, Megan M Powell, Fang Liu, Glen Coppersmith, Shuo Chen, et al. Blinded clinical ratings of social media data are correlated with in-person clinical ratings in participants diagnosed with either depression, schizophrenia, or healthy controls. Psychiatry Research, 294:113496, 2020.
- Kelly et al. (2021) Deanna L Kelly, Max Spaderna, Vedrana Hodzic, Glen Coppersmith, Shuo Chen, and Philip Resnik. Can language use in social media help in the treatment of severe mental illness? Current research in psychiatry, 1(1):1, 2021.
- Kessler (1997) Ronald C Kessler. The effects of stressful life events on depression. Annual review of psychology, 48(1):191–214, 1997.
- Kwate and Goodman (2015) Naa Oyo A Kwate and Melody S Goodman. Cross-sectional and longitudinal effects of racism on mental health among residents of black neighborhoods in new york city. American journal of public health, 105(4):711–718, 2015.
- Lamoureux et al. (2010) Brittain E Lamoureux, Eftihia Linardatos, David M Fresco, Dena Bartko, Everett Logue, and Lori Milo. Using the qids-sr16 to identify major depressive disorder in primary care medical patients. Behavior therapy, 41(3):423–431, 2010.
- Lewis et al. (2015) Andrew J Lewis, Peter Kremer, Kim Douglas, John W Toumborou, Mohajer A Hameed, George C Patton, and Joanne Williams. Gender differences in adolescent depression: Differential female susceptibility to stressors affecting family functioning. Australian Journal of Psychology, 67(3):131–139, 2015.
- Marchand et al. (2016) Alain Marchand, Jaunathan Bilodeau, Andrée Demers, Nancy Beauregard, Pierre Durand, and Victor Y Haines III. Gendered depression: Vulnerability or exposure to work and family stressors? Social science & medicine, 166:160–168, 2016.
- Mazure (1998) Carolyn M Mazure. Life stressors as risk factors in depression. Clinical Psychology: Science and Practice, 5(3):291, 1998.
- Moazen-Zadeh and Assari (2016) Ehsan Moazen-Zadeh and Shervin Assari. Depressive symptoms predict major depressive disorder after 15 years among whites but not blacks. Frontiers in public health, 4:13, 2016.
- Monroe et al. (2008) Burt L Monroe, Michael P Colaresi, and Kevin M Quinn. Fightin’words: Lexical feature selection and evaluation for identifying the content of political conflict. Political Analysis, 16(4):372–403, 2008.
- Morina et al. (2019) Giulio Morina, Viktoriia Oliinyk, Julian Waton, Ines Marusic, and Konstantinos Georgatzis. Auditing and achieving intersectional fairness in classification problems. arXiv preprint arXiv:1911.01468, 2019.
- Nolen-Hoeksema and Hilt (2009) Susan Nolen-Hoeksema and Lori M Hilt. Gender differences in depression. 2009.
- O’Connor et al. (2010) Brendan O’Connor, Michel Krieger, and David Ahn. Tweetmotif: Exploratory search and topic summarization for twitter. In Fourth International AAAI Conference on Weblogs and Social Media, 2010.
- Parker and Brotchie (2010) Gordon Parker and Heather Brotchie. Gender differences in depression. International review of psychiatry, 22(5):429–436, 2010.
- Pearlin et al. (1997) Leonard I Pearlin, Carol S Aneshensel, and Allen J LeBlanc. The forms and mechanisms of stress proliferation: The case of aids caregivers. Journal of health and social behavior, pages 223–236, 1997.
- Pearlin et al. (2005) Leonard I Pearlin, Scott Schieman, Elena M Fazio, and Stephen C Meersman. Stress, health, and the life course: Some conceptual perspectives. Journal of health and Social Behavior, 46(2):205–219, 2005.
- Pennebaker et al. (2015) James W Pennebaker, Ryan L Boyd, Kayla Jordan, and Kate Blackburn. The development and psychometric properties of liwc2015. Technical report, 2015.
- Pennington et al. (2014) Jeffrey Pennington, Richard Socher, and Christopher D. Manning. Glove: Global vectors for word representation. In Empirical Methods in Natural Language Processing (EMNLP), pages 1532–1543, 2014. URL http://www.aclweb.org/anthology/D14-1162.
- Ramos et al. (2003) Juan Ramos et al. Using tf-idf to determine word relevance in document queries. In Proceedings of the first instructional conference on machine learning, volume 242, pages 133–142. Piscataway, NJ, 2003.
- Rao et al. (2020) Guozheng Rao, Yue Zhang, Li Zhang, Qing Cong, and Zhiyong Feng. Mgl-cnn: A hierarchical posts representations model for identifying depressed individuals in online forums. IEEE Access, 8:32395–32403, 2020. 10.1109/ACCESS.2020.2973737.
- Roberts et al. (2013) Margaret E Roberts, Brandon M Stewart, Dustin Tingley, Edoardo M Airoldi, et al. The structural topic model and applied social science. In Advances in neural information processing systems workshop on topic models: computation, application, and evaluation, volume 4, pages 1–20. Harrahs and Harveys, Lake Tahoe, 2013.
- Rush et al. (2003) A John Rush, Madhukar H Trivedi, Hicham M Ibrahim, Thomas J Carmody, Bruce Arnow, Daniel N Klein, John C Markowitz, Philip T Ninan, Susan Kornstein, Rachel Manber, et al. The 16-item quick inventory of depressive symptomatology (qids), clinician rating (qids-c), and self-report (qids-sr): a psychometric evaluation in patients with chronic major depression. Biological psychiatry, 54(5):573–583, 2003.
- Sorkin et al. (2011) Dara H Sorkin, Quyen Ngo-Metzger, John Billimek, Kristin J August, Sheldon Greenfield, and Sherrie H Kaplan. Underdiagnosed and undertreated depression among racially/ethnically diverse patients with type 2 diabetes. Diabetes care, 34(3):598–600, 2011.
- Stockdale et al. (2008) Susan E Stockdale, Isabel T Lagomasino, Juned Siddique, Thomas McGuire, and Jeanne Miranda. Racial and ethnic disparities in detection and treatment of depression and anxiety among psychiatric and primary health care visits, 1995–2005. Medical care, 46(7):668, 2008.
- Strawbridge et al. (1998) William J Strawbridge, Sarah J Shema, Richard D Cohen, Robert E Roberts, and George A Kaplan. Religiosity buffers effects of some stressors on depression but exacerbates others. The Journals of Gerontology Series B: Psychological Sciences and Social Sciences, 53(3):S118–S126, 1998.
- Sung et al. (2013) Sharon Cohan Sung, Charity Cheng Hong Low, Daniel Shuen Sheng Fung, and Yiong Huak Chan. Screening for major and minor depression in a multiethnic sample of a sian primary care patients: A comparison of the nine-item patient health questionnaire (phq-9) and the 16-item quick inventory of depressive symptomatology–self-report (qids-sr16). Asia-Pacific Psychiatry, 5(4):249–258, 2013.
- Van Praag et al. (2004) Herman M Van Praag, E Ron de Kloet, and Jim Van Os. Stress, the brain and depression. Cambridge University Press, 2004.
- Vedula and Parthasarathy (2017) Nikhita Vedula and Srinivasan Parthasarathy. Emotional and linguistic cues of depression from social media. In Proceedings of the 2017 International Conference on Digital Health, pages 127–136, 2017.
- Weger et al. (2022) Rachel Weger, Juan-Antonio Lossio-Ventura, Margaret Rose-McCandlish, Jacob Shaw, Stephen Sinclair, Francisco Pereira, Joyce Chung, and Lauren Atlas. “is there anything else you would like to tell us?”: An analysis of language features in text responses to a study on mental health during the covid-19 pandemic. 2022.
- Whaley (1997) Arthur L Whaley. Ethnicity/race, paranoia, and psychiatric diagnoses: Clinician bias versus sociocultural differences. Journal of Psychopathology and Behavioral Assessment, 19(1):1–20, 1997.
- Wike (2014) Alexandra Elizabeth Wike. Discrimination and perceived stress in sexual and gender minorities: Self-esteem as a moderating factor. University of North Texas, 2014.
- Williams et al. (1997) David R Williams, Yan Yu, James S Jackson, and Norman B Anderson. Racial differences in physical and mental health: Socio-economic status, stress and discrimination. Journal of health psychology, 2(3):335–351, 1997.
- Woodward et al. (2013) Amanda T Woodward, Robert J Taylor, Jamie M Abelson, and Niki Matusko. Major depressive disorder among older african americans, caribbean blacks, and non-hispanic whites: secondary analysis of the national survey of american life. Depression and anxiety, 30(6):589–597, 2013.
Appendix A Data Statistics
tab:data-stats # surveys % Total number 2607 Gender women 1854 71.1 men 659 25.3 other 94 3.6 Race/Ethnicity Caucasian 1761 67.5 African American 221 8.5 Asian American 246 9.4 Latinx/Hispanic 277 10.6 other 102 3.9 Depressive Symptoms No Symptoms 1012 38.8 Minor Dep. Symp. 531 20.4 Major Dep. Symp. 1064 40.8 COVID-19 Before Pandemic 890 34.1 During Pandemic 1717 65.9 Age 18-29 1084 41.6 30-59 1409 54.0 >=60 114 4.4
tab:data-stats shows the dataset statistics for depressive symptoms and demographics. Surveys were filtered based on open-ended text responses as described in \sectionrefsec:methods-data.
Appendix B Covid-19 Analysis
Prior work suggest that the prevalence for depression symptoms in the US was more than 3-fold higher during COVID-19 compared to before (Ettman et al., 2020), and that there is a relation between stressors before and during the pandemic (Ettman et al., 2021). To contextualize this effect in our dataset, we ask the following population questions: Are the depression rates before and during pandemic different across demographic groups? Do the demographic populations (race/ethnicity and gender) differ before and during the pandemic? We perform statistical tests on the number of surveys and report the results in this section.
We first compared the depression rates in the surveys submitted before and during the COVID-19 pandemic. We performed 100 trials, where each trial sampled surveys with replacement for each demographic group and recording the resulting depression rate. A pooled t-test revealed a significant difference in the depression rates of the surveys before (, ) and during the COVID-19 pandemic (, ), , . This is also true for each demographic group; the tests results are reported in \appendixrefapd:pandemic-depression-results. These findings suggest that the rate of depression in the surveys was significantly higher during the COVID-19 pandemic than before.
Next, we compared the demographic populations of the surveys submitted before and during the COVID-19 pandemic. We constructed contingency tables for each demographic axis: gender and racial/ethnic groups. A -test revealed a significant difference in racial/ethnic distributions for surveys before and during the COVID-19 pandemic but not for gender, suggesting that there are more surveys of Hispanic/Latino, Black and Asian respondents during the pandemic than before, but the gender populations did not change (see \appendixrefapd:pandemic-demographic-results for more details).
Together, these results suggest that the population characteristics change based on COVID-19 pandemic both at the demographic level and at the depression rate level. A likely reason may be changes in the recruitment strategy of participants, as the dataset creators reported multiple recruitment efforts both before and during the pandemic. Other studies have found that depression rates increased during the COVID-19 pandemic (Ettman et al., 2020). Overall, these changes mean that we must control for the pandemic in our experiments to avoid probable confoundings.
Appendix C Major Depressive Symptom Task
We formulate the prediction task as a binary classification task based on the QIDS-sr19 cutoff scores by joining the Minor and Major Depressive symptom surveys into one category in \sectionrefsec:methods-prediction. Here, we conduct experiments with a binary classification task where we only consider control vs Major Depressive symptoms (excluding Minor Depressive symptom surveys). Similar to \sectionrefsec:methods-prediction, we performed a random train-test split (90-10%) ensuring that surveys from the same subject were not shared across splits, and the linear and neural model setup is the same.
tab:results-prediction-mdd-task 1. Depressive Symptoms 2. Major Depressive Symptoms Validation Test Validation Test Model Logistic Regression 0.53 0.051 0.55 0.031 0.53 0.033 0.60 0.033 SGD Classifier 0.53 0.037 0.56 0.019 0.53 0.041 0.56 0.045 BERT 0.54 0.063 0.59 0.030 0.60 0.057 0.60 0.031 ClinicalBERT 0.52 0.058 0.61 0.027 0.60 0.050 0.62 0.033 MentalBERT 0.55 0.051 0.62 0.029 0.59 0.069 0.62 0.035
tab:results-fairness-mdd-task Depressive Symptoms Major Depressive Symptoms Validation Test Validation Test Logistic Regression 0.20 1.61 0.61 1.11 SGD Classifier 0.34 0.76 0.30 1.07 BERT 0.33 0.81 0.63 2.09 ClinicalBERT 0.27 0.96 0.64 1.34 MentalBERT 0.37 1.10 0.72 2.85
We performed a hyperparameter search using 10-fold cross validation and report the best mean and standard deviation macro-averaged F1 score of the validation sets for each model, as well as the corresponding test set performance in \tablereftab:results-prediction-mdd-task (we include results in \sectionrefsec:results-prediction for ease of comparison). Overall, models trained in Task 2 tend to have higher F1 scores compared to Task 1, which is surprising given that Task 2 has less data than Task 1. Perhaps Task 2 is easier, as the less obvious Minor Depressive symptoms are removed, making a clearer distinction between responses of subjects with depressive symptoms and control.
We investigate the performance difference of the models across demographics. We combined the predictions of the resulting models of the 10-fold cross validation and calculated fairness metrics based on our intersectional definition: -Differential Equal Odds (-D). The fairness results in \tablereftab:results-fairness-mdd-task suggest that the linear models tend to be more fair compared to the neural models, although it varies depending on the dataset and task. Comparing the neural models, there doesn’t seem to be a clear trend, except in Task 2, where MentalBERT seems to be the most unfair model.
Appendix D Model Specifications
Tokenization. Raw text from the survey responses was tokenized using a modified version of the Twokenizer (O’Connor et al., 2010). English contractions, hyphenated and slashed terms were expanded, while specific numeric values were deleted. As pronoun usage tends to differ in individuals living with depression (Vedula and Parthasarathy, 2017), we removed any English pronouns from our stop word set (English Stop Words from nltk.org). Case was standardized across all tokens.
Features. The bag-of-words representation of each survey is then used to generate the following additional feature dimensions: a 50-dimensional LDA topic distribution (Blei et al., 2003), a 64-dimensional LIWC category distribution (Pennebaker et al., 2015), and a 200-dimensional mean-pooled vector of GloVe embeddings (Pennington et al., 2014). The reduced bag-of-words representation is transformed using TF-IDF weighting (Ramos et al., 2003).777All data-specific feature transformations (e.g. LDA, TF-IDF) are learned without access to development or test data.
Hyperparameter Selection. Each model is trained using a hyperparameter grid search over the regularization strength {1e-3, 1e-2, 1-e1, 1, 10, 100, 1e3, 1e4, 1e5}, class weighting {None, Balanced}, and feature set standardization {On, Off}, as well as the model-specific hyperparameters shown in \tablereftab:hyperparameter-linear.
tab:hyperparameter-linear Model Parameter Space Logistic Regression C 1000, 100, 10, 1, .1, .01, .001 solver liblinear, lbfgs SGD Classifier alpha 1e-5, 1e-4, 1e-3, 1e-2 epsilon .001, .01, .1
Hyperparameters were selected to maximize held-out F1 score within a 10%-sied held-out split of the training data (10-fold cross validation within the training data). We used the Ray[tune]888https://github.com/ray-project/tune-sklearn library for the hyperparameter search.
Appendix E Fairness Definition
To choose which fairness definition is important for these models, we employ likely use cases, such as a screening tool to prioritize access to care for possible patients in need. In such case, equal access to care across demographics, which can be modeled by equal true positive rate (TPR), is most important; this is often referred to as Equal Opportunity (Hardt et al., 2016). However, this definition would reward high recall models without regard to precision, which could create situations in finite resource systems (e.g. healthcare) where resources are invested only in the majority community. Instead, we use the more restrictive Equalized Odds intersectional definitions, that also penalize low specificity models (Hardt et al., 2016):
Inspired by the Empirical estimation of Differential Fairness (Foulds et al., 2020) and an Equalized Odds adaptation of Differential Fairness (Morina et al., 2019), we define the Empirical estimation of the Differential Equalized Odds (D): Assuming discrete outcomes, , where , are empirical counts of their subscripted values in the dataset, and is a set of all subgroups of protected attributes. A model with predictions satisfies Differential Equalized Odds (-D) by verifying that for any , , and , we have,
Here, are positive predictions of a model, , are true labels, and are tuples of all protected attributes (gender and racial/ethnic groups), including both intersectional subgroups (African American Woman) as well as general demographic groups (Woman).
Appendix F Demographic Population Results
F.1 Depression Rates Before and During COVID-19 Pandemic
We compare the depression rates in the surveys submitted before and during the COVID-19 pandemic. Each trial consisted in sampling surveys with replacement for each demographics and recorded the depression rates. We performed 100 trials in order to get distributions of the dataset before and during the COVID-19 pandemic. A pooled t-test revealed a significant difference in the depression rates of the surveys before COVID-19 pandemic (, ) and during COVID-19 pandemic (, ), , .
Looking at surveys submitted by men participants, a pooled t-test revealed a significant difference in the depression rates of the surveys before COVID-19 pandemic (, ) and during COVID-19 pandemic (, ), , . Looking at surveys submitted by women participants, a pooled t-test revealed a significant difference in the depression rates of the surveys before COVID-19 pandemic (, ) and during COVID-19 pandemic (, ), , .
Looking at surveys submitted by White participants, a pooled t-test revealed a significant difference in the depression rates of the surveys before COVID-19 pandemic (, ) and during COVID-19 pandemic (, ), , . Looking at surveys submitted by Black participants, a pooled t-test revealed a significant difference in the depression rates of the surveys before COVID-19 pandemic (, ) and during COVID-19 pandemic (, ), , . Looking at surveys submitted by Hisp/Lat participants, a pooled t-test revealed a significant difference in the depression rates of the surveys before COVID-19 pandemic (, ) and during COVID-19 pandemic (, ), , . Looking at surveys submitted by Asian participants, a pooled t-test revealed a significant difference in the depression rates of the surveys before COVID-19 pandemic (, ) and during COVID-19 pandemic (, ), , .
F.2 Gender and Racial/Ethnic Group Rates Before and During the COVID-19 pandemic
A test of independence was performed to examine the relation between gender and the number of surveys submitted before and during the COVID-19 pandemic. The relation between these variables was significant, (1, N = 2513) = 12.7, p = .00036. Women submitted more responses during the pandemic. However, in the previous subsection we showed that the rates for depression where different before and during the pandemic, and given that we expect depression rates to be higher in women, perhaps the depressive symptom variable is a confounder. We perform separate test of independence for each survey groups, with depressive symptoms and no depressive symptoms. The relation between gender and the number of surveys with no depressive disorder before and during the COVID-19 pandemic was not significant (1, N = 1003) = 1.6, p = .213. Also, the relation between gender and the number of surveys with Major or Minor depressive disorder before and during the COVID-19 pandemic was not significant (1, N = 1510) = 0.9, p = .366. These results suggest that the gender populations did not change before and during the pandemic.
A test of independence was performed to examine the relation between race/ethnicity and the number of surveys submitted before and during the COVID-19 pandemic. The relation between these variables was significant, (4, N = 2607) = 81.2, . Asian American, African American and Hispanic/Latinx submitted more surveys during the pandemic. This relation was significant for the surveys with no depressive disorder (4, N = 1012) = 59.5, and with Major or Minor depressive disorder (4, N = 1595) = 36.4, . These results suggest that Asian American, African American and Hispanic/Latinx submitted more surveys during the pandemic.
Appendix G More Figures on Stressors
tab:appx-vocab,tab:appx-liwc show the pairwise log-odds-ratio comparison of token vocabulary and LIWC category distributions respectively. \figurereffig:topic-gender,fig:topic-race-white-black,fig:topic-race-white-asian,fig:topic-race-white-hisp,fig:topic-race-black-asian,fig:topic-race-black-hisp,fig:topic-race-hisp-asian show the effects of gender and all racial/ethnic groups on the topics from the structural topic model trained on the stressors responses.
| Gender | |||
| Women () | Men () | ||
| token | ratio | token | ratio |
| n’t | -4.501 | ’s | 0.053 |
| ’m | -4.435 | homework | 0.037 |
| ’ve | -3.621 | said | 0.032 |
| ’s | -3.225 | proactive | 0.032 |
| covid | -3.120 | finals | 0.026 |
| covid-19 | -2.832 | consult | 0.025 |
| ’ll | -1.562 | girlfriend | 0.024 |
| coronavirus | -0.948 | recovering | 0.024 |
| ’d | -0.800 | prescribed | 0.023 |
| stress | -0.483 | would | 0.023 |
| ’re | -0.444 | relatives | 0.022 |
| idk | -0.377 | ’re | 0.022 |
| pandemic | -0.314 | wife | 0.021 |
| stressful | -0.311 | deadlines | 0.019 |
| alot | -0.262 | first | 0.019 |
| biggest | -0.260 | may | 0.019 |
| stressor | -0.256 | looting | 0.018 |
| trying | -0.227 | entertained | 0.018 |
| stressed | -0.224 | might | 0.018 |
| finances | -0.212 | one | 0.017 |
| stressing | -0.200 | world | 0.017 |
| source | -0.191 | overcome | 0.017 |
| cope | -0.165 | dating | 0.017 |
| schoolwork | -0.164 | sexual | 0.017 |
| exercising | -0.158 | ’d | 0.016 |
| boyfriend | -0.151 | share | 0.016 |
| dealing | -0.137 | grades | 0.016 |
| job | -0.127 | contracting | 0.016 |
| bills | -0.126 | run | 0.015 |
| gre | -0.121 | could | 0.015 |
| Ethnicity | |||
| Black () | White () | ||
| ’s | -0.069 | covid | 4.798 |
| would | -0.028 | n’t | 4.494 |
| could | -0.023 | ’ve | 4.283 |
| n’t | -0.022 | ’m | 4.227 |
| first | -0.021 | covid-19 | 2.480 |
| might | -0.019 | coronavirus | 0.800 |
| two | -0.018 | stress | 0.523 |
| men | -0.017 | pandemic | 0.472 |
| mean | -0.017 | stressful | 0.335 |
| one | -0.016 | stressor | 0.284 |
| say | -0.014 | stressed | 0.260 |
| come | -0.014 | dealing | 0.236 |
| light | -0.014 | biggest | 0.233 |
| number | -0.013 | finances | 0.233 |
| great | -0.013 | trying | 0.224 |
| young | -0.013 | source | 0.183 |
| thank | -0.013 | job | 0.153 |
| morning | -0.013 | work | 0.140 |
| hopeful | -0.012 | try | 0.139 |
| across | -0.012 | stressing | 0.126 |
| programs | -0.012 | relax | 0.124 |
| hair | -0.012 | cope | 0.121 |
| front | -0.012 | deal | 0.120 |
| face | -0.011 | worrying | 0.118 |
| interest | -0.011 | tried | 0.112 |
| second | -0.011 | applying | 0.112 |
| brought | -0.011 | yoga | 0.111 |
| attention | -0.011 | done | 0.109 |
| available | -0.011 | boyfriend | 0.108 |
| george | -0.011 | therapist | 0.108 |
| Hisp/Lat () | White () | ||
| idk | -0.377 | covid | 4.871 |
| ’s | -0.068 | n’t | 4.459 |
| breaths | -0.033 | ’ve | 4.202 |
| ’re | -0.029 | ’m | 3.803 |
| would | -0.026 | ’s | 3.183 |
| could | -0.023 | covid-19 | 2.773 |
| basic | -0.022 | coronavirus | 0.800 |
| n’t | -0.020 | stress | 0.531 |
| first | -0.019 | pandemic | 0.332 |
| government | -0.019 | stressful | 0.323 |
| might | -0.018 | stressor | 0.256 |
| may | -0.018 | biggest | 0.244 |
| world | -0.017 | dealing | 0.231 |
| war | -0.016 | trying | 0.228 |
| one | -0.016 | finances | 0.222 |
| two | -0.016 | stressed | 0.215 |
| come | -0.016 | source | 0.190 |
| years | -0.016 | internship | 0.148 |
| light | -0.015 | dealt | 0.138 |
| ensure | -0.015 | job | 0.137 |
| store | -0.015 | work | 0.132 |
| lost | -0.015 | relax | 0.132 |
| name | -0.014 | deal | 0.129 |
| state | -0.014 | stressing | 0.126 |
| line | -0.014 | try | 0.122 |
| students | -0.013 | cancelled | 0.116 |
| eyes | -0.013 | boyfriend | 0.116 |
| say | -0.013 | tried | 0.115 |
| something | -0.013 | applying | 0.112 |
| idea | -0.013 | therapist | 0.108 |
| Asian () | White () | ||
| ’s | -0.068 | covid | 4.956 |
| said | -0.040 | n’t | 4.459 |
| scheduling | -0.030 | ’ve | 4.202 |
| internships | -0.030 | ’m | 4.039 |
| schoolwork | -0.029 | ’s | 3.022 |
| would | -0.026 | covid-19 | 2.480 |
| first | -0.020 | ’ll | 1.753 |
| n’t | -0.019 | ’re | 0.800 |
| black | -0.018 | coronavirus | 0.718 |
| might | -0.018 | stress | 0.543 |
| insecurity | -0.017 | pandemic | 0.437 |
| two | -0.017 | stressful | 0.299 |
| may | -0.017 | biggest | 0.262 |
| years | -0.016 | stressed | 0.251 |
| one | -0.016 | dealing | 0.245 |
| state | -0.015 | finances | 0.233 |
| looked | -0.015 | trying | 0.220 |
| history | -0.014 | source | 0.200 |
| however | -0.014 | destress | 0.174 |
| went | -0.014 | job | 0.153 |
| students | -0.014 | dealt | 0.145 |
| come | -0.014 | deal | 0.129 |
| goes | -0.013 | internship | 0.129 |
| think | -0.013 | work | 0.126 |
| young | -0.013 | exercising | 0.121 |
| financially | -0.013 | getting | 0.117 |
| play | -0.012 | relax | 0.116 |
| three | -0.012 | cancelled | 0.116 |
| market | -0.012 | boyfriend | 0.116 |
| chat | -0.012 | tried | 0.112 |
| Hisp/Lat () | Black () | ||
| ’m | -1.349 | covid-19 | 0.800 |
| ’ve | -0.628 | covid | 0.242 |
| n’t | -0.628 | finding | 0.015 |
| pandemic | -0.141 | exams | 0.013 |
| stressed | -0.045 | moving | 0.012 |
| lost | -0.030 | studying | 0.011 |
| stressor | -0.029 | anxiety | 0.011 |
| bills | -0.025 | biggest | 0.011 |
| virus | -0.024 | deal | 0.010 |
| due | -0.023 | paying | 0.009 |
| daily | -0.022 | housing | 0.009 |
| try | -0.018 | currently | 0.009 |
| basic | -0.017 | money | 0.009 |
| job | -0.016 | knowing | 0.008 |
| feel | -0.015 | stress | 0.008 |
| mask | -0.014 | diagnosed | 0.008 |
| hopeless | -0.014 | relax | 0.008 |
| done | -0.014 | mental | 0.008 |
| sleep | -0.013 | anxious | 0.008 |
| getting | -0.013 | save | 0.007 |
| stressful | -0.012 | boyfriend | 0.007 |
| struggling | -0.011 | source | 0.007 |
| mood | -0.011 | lack | 0.007 |
| working | -0.011 | care | 0.006 |
| family | -0.011 | weeks | 0.005 |
| finances | -0.011 | neighbors | 0.005 |
| unemployed | -0.010 | right | 0.005 |
| hard | -0.010 | busy | 0.005 |
| walks | -0.010 | move | 0.005 |
| current | -0.010 | talking | 0.005 |
| Asian () | Black () | ||
| ’m | -0.893 | covid | 1.054 |
| ’ve | -0.628 | biggest | 0.029 |
| n’t | -0.628 | paying | 0.022 |
| coronavirus | -0.082 | stress | 0.021 |
| assignments | -0.038 | currently | 0.017 |
| stressful | -0.036 | source | 0.017 |
| pandemic | -0.035 | saving | 0.013 |
| applying | -0.033 | getting | 0.012 |
| try | -0.030 | finding | 0.011 |
| schedule | -0.026 | life | 0.010 |
| friends | -0.022 | lack | 0.010 |
| managing | -0.019 | dealing | 0.010 |
| stressing | -0.018 | deal | 0.009 |
| cope | -0.018 | moving | 0.009 |
| grad | -0.017 | car | 0.008 |
| school | -0.016 | mental | 0.008 |
| things | -0.016 | sources | 0.008 |
| taking | -0.015 | boyfriend | 0.007 |
| organized | -0.015 | safe | 0.007 |
| work | -0.014 | doctor | 0.007 |
| exams | -0.013 | weight | 0.007 |
| time | -0.013 | relatives | 0.006 |
| thinking | -0.012 | unemployment | 0.006 |
| meditation | -0.012 | grades | 0.006 |
| stresses | -0.011 | stable | 0.006 |
| week | -0.010 | feeling | 0.006 |
| feel | -0.010 | financial | 0.006 |
| financially | -0.010 | pregnant | 0.006 |
| talked | -0.010 | studying | 0.006 |
| still | -0.010 | constantly | 0.006 |
| Hisp/Lat () | Asian () | ||
| covid | -0.824 | covid-19 | 0.800 |
| ’m | -0.499 | ’s | 0.258 |
| pandemic | -0.106 | schoolwork | 0.110 |
| exercising | -0.037 | coronavirus | 0.082 |
| stressed | -0.036 | assignments | 0.039 |
| distancing | -0.025 | deadlines | 0.036 |
| getting | -0.024 | applying | 0.033 |
| daily | -0.023 | schedule | 0.026 |
| masks | -0.020 | exams | 0.026 |
| due | -0.020 | concentrate | 0.025 |
| biggest | -0.018 | stressful | 0.024 |
| thoughts | -0.018 | friends | 0.022 |
| job | -0.017 | managing | 0.019 |
| sleep | -0.017 | motivation | 0.019 |
| suicidal | -0.014 | internship | 0.019 |
| dealing | -0.014 | stressing | 0.018 |
| paying | -0.013 | school | 0.017 |
| making | -0.013 | relax | 0.016 |
| hard | -0.013 | try | 0.012 |
| current | -0.013 | stresses | 0.011 |
| stress | -0.012 | balancing | 0.010 |
| car | -0.012 | time | 0.010 |
| needs | -0.011 | financially | 0.010 |
| mood | -0.011 | jobs | 0.009 |
| feeling | -0.011 | keep | 0.009 |
| constantly | -0.011 | talking | 0.009 |
| ca | -0.011 | things | 0.008 |
| finances | -0.011 | knowing | 0.008 |
| walks | -0.010 | awake | 0.008 |
| ’m | -0.010 | lonely | 0.008 |
| Gender | |||
| Women () | Men () | ||
| category | ratio | category | ratio |
| anx | -0.184 | article | 0.130 |
| negemo | -0.119 | function | 0.125 |
| verb | -0.110 | prep | 0.077 |
| pro1 | -0.095 | social | 0.071 |
| focuspresent | -0.095 | shehe | 0.060 |
| achiev | -0.094 | conj | 0.041 |
| health | -0.093 | hear | 0.041 |
| affect | -0.072 | number | 0.039 |
| drives | -0.066 | space | 0.038 |
| sad | -0.062 | female | 0.037 |
| family | -0.061 | pronoun | 0.036 |
| money | -0.061 | percept | 0.036 |
| reward | -0.059 | male | 0.034 |
| home | -0.050 | ipron | 0.030 |
| cogproc | -0.042 | see | 0.027 |
| Ethnicity | |||
| Black () | White () | ||
| article | -0.164 | anx | 0.197 |
| function | -0.153 | health | 0.131 |
| prep | -0.084 | negemo | 0.128 |
| social | -0.080 | verb | 0.126 |
| shehe | -0.077 | achiev | 0.119 |
| conj | -0.056 | focuspresent | 0.114 |
| male | -0.054 | pro1 | 0.110 |
| space | -0.049 | affect | 0.086 |
| hear | -0.049 | family | 0.080 |
| pronoun | -0.047 | drives | 0.076 |
| number | -0.046 | sad | 0.069 |
| percept | -0.044 | time | 0.064 |
| power | -0.038 | friend | 0.060 |
| ipron | -0.038 | bio | 0.058 |
| female | -0.036 | home | 0.053 |
| Hisp/Lat () | White () | ||
| article | -0.156 | anx | 0.193 |
| function | -0.146 | health | 0.133 |
| prep | -0.077 | verb | 0.121 |
| social | -0.077 | negemo | 0.119 |
| shehe | -0.072 | achiev | 0.111 |
| conj | -0.053 | focuspresent | 0.108 |
| male | -0.049 | pro1 | 0.103 |
| hear | -0.048 | affect | 0.083 |
| percept | -0.046 | family | 0.076 |
| pronoun | -0.046 | drives | 0.070 |
| space | -0.045 | time | 0.064 |
| number | -0.043 | friend | 0.062 |
| power | -0.039 | sad | 0.059 |
| ipron | -0.038 | bio | 0.056 |
| female | -0.035 | reward | 0.051 |
| Asian () | White () | ||
| article | -0.161 | anx | 0.204 |
| function | -0.150 | health | 0.141 |
| prep | -0.083 | negemo | 0.133 |
| social | -0.078 | verb | 0.123 |
| shehe | -0.073 | pro1 | 0.110 |
| conj | -0.057 | achiev | 0.107 |
| hear | -0.050 | focuspresent | 0.106 |
| male | -0.050 | affect | 0.090 |
| percept | -0.046 | family | 0.081 |
| space | -0.045 | sad | 0.073 |
| number | -0.045 | drives | 0.073 |
| pronoun | -0.045 | bio | 0.066 |
| ipron | -0.039 | time | 0.056 |
| power | -0.035 | friend | 0.055 |
| see | -0.034 | reward | 0.053 |
| Hisp/Lat () | Black () | ||
| sad | -0.009 | article | 0.008 |
| negemo | -0.008 | prep | 0.007 |
| achiev | -0.008 | function | 0.006 |
| focuspresent | -0.007 | focusfuture | 0.004 |
| pro1 | -0.007 | shehe | 0.004 |
| adverb | -0.006 | relig | 0.004 |
| verb | -0.006 | male | 0.004 |
| anx | -0.006 | space | 0.004 |
| feel | -0.005 | social | 0.003 |
| home | -0.005 | relativ | 0.003 |
| informal | -0.005 | number | 0.003 |
| body | -0.005 | conj | 0.003 |
| leisure | -0.004 | motion | 0.003 |
| affect | -0.004 | interrog | 0.003 |
| tentat | -0.004 | risk | 0.003 |
| Asian () | Black () | ||
| work | -0.013 | health | 0.009 |
| achiev | -0.011 | bio | 0.008 |
| leisure | -0.010 | negemo | 0.005 |
| focuspresent | -0.009 | anx | 0.004 |
| time | -0.007 | risk | 0.004 |
| friend | -0.005 | motion | 0.004 |
| affiliation | -0.004 | money | 0.004 |
| home | -0.004 | male | 0.003 |
| verb | -0.003 | shehe | 0.003 |
| see | -0.003 | article | 0.003 |
| drives | -0.003 | ingest | 0.003 |
| informal | -0.002 | female | 0.003 |
| ipron | -0.002 | affect | 0.003 |
| compare | -0.002 | ppron | 0.003 |
| percept | -0.002 | power | 0.003 |
| Hisp/Lat () | Asian () | ||
| negemo | -0.013 | work | 0.015 |
| sad | -0.013 | time | 0.008 |
| anx | -0.010 | friend | 0.006 |
| health | -0.010 | relativ | 0.006 |
| bio | -0.010 | prep | 0.005 |
| pro1 | -0.007 | leisure | 0.005 |
| affect | -0.007 | article | 0.005 |
| feel | -0.006 | focusfuture | 0.004 |
| body | -0.006 | function | 0.004 |
| family | -0.006 | conj | 0.003 |
| money | -0.005 | compare | 0.003 |
| certain | -0.005 | achiev | 0.003 |
| adverb | -0.005 | focuspresent | 0.003 |
| cogproc | -0.005 | number | 0.002 |
| risk | -0.003 | hear | 0.002 |