[a]Abhi Modak
System-size dependence of particle production at mid- and forward rapidity with ALICE
Abstract
The pseudorapidity densities of charged particles and inclusive photons produced in high energy nuclear collisions are essential observables to characterise the global properties of the collisions, such as the achieved energy density, and to provide important constraints for Monte Carlo model calculations. In the LHC Run 1 and Run 2 configurations, ALICE had large coverage to measure charged particles over a pseudorapidity range (), combining the data from the Silicon Pixel Detector (SPD) and the Forward Multiplicity Detector (FMD). The inclusive photons are measured at forward rapidity using the Photon Multiplicity Detector (PMD), covering the pseudorapidity range . New results on charged-particle pseudorapidity densities measured in pp, p–Pb, and Pb–Pb collisions at = 5.02 TeV using Run 1 and Run 2 data are presented. Inclusive photon production is reported for p–Pb collisions at = 5.02 TeV. The charged-particle rapidity densities are derived from the measured charged-particle pseudorapidity densities, and then parameterized by a normal distribution. This allows us to study the evolution of the width of the rapidity distributions as a function of the number of participants in all three collision systems. The performance of the new Inner Tracking System (ITS) designed for ALICE Run 3 configuration is also discussed for pilot beam pp collisions at = 0.9 TeV.
1 Introduction
Particle production at the Large Hadron Collider (LHC) energies is driven by a combination of hard (perturbative) and soft (non-perturbative) quantum chromodynamics (QCD) processes. Soft QCD processes dominate the bulk of particle production at low transverse momenta and can only be described by phenomenological models and effective theories. Multiplicity and pseudorapidity distributions of the produced final-state particles are some of the basic measurements to characterise the global properties of the collisions [1] and to provide constraints for better tuning of models in understanding the underlying description of particle production. During the LHC Run 1 and Run 2, ALICE recorded data with various colliding systems (pp, p–Pb, Xe–Xe and Pb–Pb) at different center-of-mass energies. This offered the possibility to study the evolution of particle production with collision energy and system-size which will further help to learn about how the nuclear medium affects particle production mechanisms.
In this article, we report measurements of charged-particle pseudorapidity densities () in pp, p–Pb, and Pb–Pb collisions at mid- and forward rapidities using the ALICE detector [2]. The inclusive photon production, which provides the information complementary to those obtained from the charged particles, is studied in p–Pb collisions over the kinematic range . The performance of the new Monolithic Active Pixel Sensors-based Inner Tracking System (ITS) (designed for ALICE Run 3 configuration [3]) and the tracking/matching algorithms are presented for LHC pilot run of pp collisions at = 0.9 TeV in October 2021.
2 Analysis method
The measurements of at = 5.02 TeV were performed based on the data collected by ALICE during LHC Run 1 for p–Pb collisions (in 2013) and during Run 2 for pp and Pb–Pb collisions (in 2015). The p–Pb and Pb–Pb data were analysed with a minimum bias (MB) trigger requiring a coincidence of signals in each side of the V0 sub-detectors (V0A and V0C). Likewise, the pp data were analysed for inelastic (INEL) interactions with at least one charged-particle detected at (INEL 0 event class). The standard ALICE event selection and centrality determination based on the V0 amplitude were considered in this analysis [4, 5]. The was measured by counting the number of tracklets using the SPD detector at mid-rapidity (). At forward rapidity the measurement was done based on the deposited energy signal in the FMD and a statistical method was employed to calculate the inclusive number of charged particles [4]. The detailed studies on the estimation of systematic uncertainties in pp, p–Pb and Pb–Pb collisions can be found in Ref. [4].
The was also analysed, using the new ALICE computing software framework, named Online-Offline (O2) [6], for pp collisions at = 0.9 TeV using the pilot beam Run 3 data collected in October 2021. The events were selected using timing information of the Fast Interaction Trigger (FIT) detector [7]. The charged-particle tracks that have at least one hit in any of the ITS layers were considered in this analysis. Correction procedures similar to the ones described in [8] are used to correct the measured distributions. Systematic uncertainties from various sources (event generator dependence, uncertainties, strangeness corrections and particle composition) were evaluated using techniques identical to those reported in [8].
The pseudorapidity density of inclusive photons () was measured on an event-by-event basis using a preshower technique with the PMD detector [9, 10, 11]. The reconstruction of photons consists of two steps: (i) finding clusters of hits on the preshower plane of the PMD and (ii) discriminating between photons and charged hadrons. The clustering was performed using a nearest neighbour clustering algorithm. Each cluster is characterized by the number of cells (cluster ) contained in it and the total energy (measured in terms of ADC) deposited in that cluster. Suitable photon-hadron discrimination thresholds were applied based on the cluster and ADC content to obtain a photon-rich sample, known as -like clusters [10]. A Bayesian unfolding technique [12] was then used to correct the measured distributions of -like clusters affected by instrumental effects and the contamination from hadron clusters [11]. A detailed discussion on the estimation of systematic uncertainties for the photon analysis is given in Refs. [10, 11].
3 Results and discussion
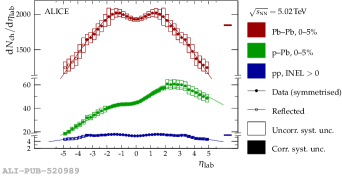
Figure 1 shows the primary charged-particle pseudorapidity densities measured in pp collisions with the INEL 0 event class and in top central (0–5%) p–Pb and Pb–Pb collisions at = 5.02 TeV. The at mid-rapidity in pp collisions is found to be 5.7 0.2 while for 0–5% Pb–Pb collisions it reaches 2000. A clear asymmetric shape of is observed in p–Pb collisions and the distribution peaks at 60 around = 3 on the Pb-going direction.
The ratio of the charged-particle pseudorapidity density, (where labels centrality classes in p–Pb and Pb–Pb collisions), in p–Pb and Pb–Pb collisions to that in pp collisions is presented as a function of in Fig. 2(a). It is observed that the ratio, , increases linearly with from the p-going to the Pb-going direction for central collisions which suggests a scaling of the pp distribution with the increasing number of participants as the lead nucleus is probed by the incident proton. A similar scaling, however, is not observed in the ratio of the Pb–Pb distributions relative to the pp. The exhibits an enhancement of particle production around = 0 for the more central collisions.
The charged-particle rapidity density () in Pb–Pb collisions [13], to a good accuracy, is observed to follow a normal distribution within . The conversion of to is given by . Hence, for symmetric collision systems (pp and Pb–Pb) can be parameterized as [4, 13]
| (1) |
where , and are the total integral and width of the distribution, respectively, and the rapidity in the center-of-mass frame. Based on the observation of the linear increase of the p–Pb to pp ratios, the for the asymmetric system (p–Pb) can also be parameterized as
| (2) |
where is replaced by which is linear in multiplied by a factor . and which is the rapidity of the center-of-mass system in the laboratory frame. Best-fit parameterizations of the measured in terms of Eq. 1 (for pp and Pb–Pb) and Eq. 2 (for p–Pb) are shown in Fig. 1. The charged-particle pseudorapidity distributions are well described by these two functions and , indicating that the particle production in pp, p–Pb, and Pb–Pb collisions follow a normal distribution in rapidity.
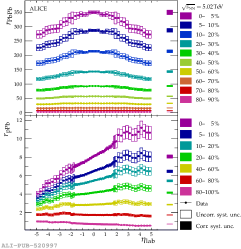
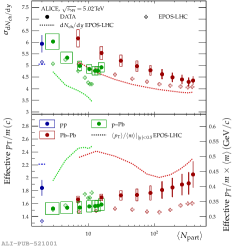
The top panel of Fig. 2(b) presents the width of the charged-particle rapidity distributions () for pp, p–Pb, and Pb–Pb collisions as a function of the average number of participating nucleons () calculated using a Glauber model. The extracted from the same parameterisation of the EPOS-LHC calculations [14] is shown by open markers. The dashed lines are obtained directly by evaluating the width of the charged particle rapidity density from EPOS-LHC model. The general trend is that the decreases as increases, consistent with the behaviour of the Pb–Pb to pp ratios. It is also noted that the width of the distributions in p–Pb and Pb–Pb approaches that of the pp distribution at low . These results suggest that the enhancement of particle production near mid-rapidity in Pb–Pb is an effect of the nuclear medium. The bottom panel of Fig. 2(b) shows the dependence of the parameter on . The right-hand ordinate is the same but multiplied by the average . The parameter extracted from the EPOS-LHC calculations [14] is also presented (open markers) in the figure. The dashed lines represent the average predicted by the EPOS-LHC [14]. The model calculations indicate that the extracted transverse momentum to mass ratio is smaller than the .
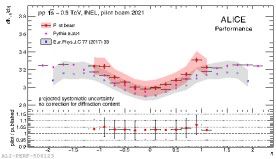
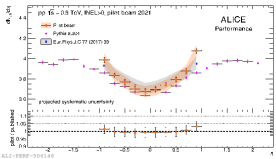
Figures 3(a) and 3(b) present the measurements of using Run 3 pilot beam data in pp collisions at = 0.9 TeV for INEL and INEL 0 event classes respectively. The results are compared to the published Run 2 measurements [15]. The difference between Run 2 and Run 3 measurements comes mainly from: (a) the upgraded ALICE detector and (b) new reconstruction algorithms. It is observed that there is good agreement between the present measurements and published results. However, the measurements for the INEL event class is slightly higher than the published data due to the lack of diffraction correction in the Run 3 Monte Carlo (MC) simulation. PYTHIA 8 [16] explains the data within uncertainties. These results validate the performance of the new ITS as well as the new reconstruction algorithms.
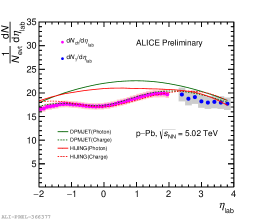
Figure 4 presents the (solid blue circles) measured for MB events in p–Pb collisions at = 5.02 TeV in the rapidity interval, together with the measurements of charged-particle production (solid magenta circles) at mid-rapidity [17]. The measurements are compared with the predictions from HIJING [18] and DPMJET [19] event generators. Both MC models considered here are in good agreement with whereas is slightly overpredicted by DPMJET. These results provide new constraints on model calculations to understand particle, and in particular photon, production in p–Pb collisions.
4 Summary
We have presented and compared the charged-particle pseudorapidity density measured in pp, p–Pb, and Pb–Pb collisions at = 5.02 TeV. A clear enhancement of particle production at mid-rapidity in central Pb–Pb collisions compared to pp collisions is observed whereas a linear scaling is seen for p–Pb collisions with respect to the pp collisions. By transforming the pseudorapidity distributions to rapidity distributions we have found that the measurements for all three collision systems follow a normal distribution in rapidity. We have analysed the pilot beam data in pp collisions at = 0.9 TeV using the new ITS detector and the brand new computing framework and the performance of the whole setup has been studied, obtaining excellent perspective in view of Run 3 data taking. Finally, we have also measured the at forward rapidity which follows the trend of charged-particle measurements at mid-rapidity.
References
- [1] J. D. Bjorken, Phys. Rev. D 27 (1983), 140-151.
- [2] B. B. Abelev et al. [ALICE Collaboration], Int. J. Mod. Phys. A 29, 1430044 (2014).
- [3] B. Abelev et al. [ALICE Collaboration], J. Phys. G 41 (2014), 087001.
- [4] C. H. Christensen et al. [ALICE Collaboration], [arXiv:2204.10210 [nucl-ex]].
- [5] B. Abelev et al. [ALICE Collaboration], Phys. Rev. C 88 (2013) no.4, 044909, [arXiv:1301.4361 [nucl-ex]].
- [6] A. Alkin et al. EPJ Web Conf. 251, 03063 (2021).
- [7] W. H. Trzaska [ALICE Collaboration], Nucl. Instrum. Meth. A 845, 463-466 (2017).
- [8] J. Adam et al. [ALICE Collaboration], Eur. Phys. J. C 77, no.1, 33 (2017), [arXiv:1509.07541 [nucl-ex]].
- [9] M. M. Aggarwal et al., Nucl. Instrum. Meth. A 488, 131-143 (2002) [arXiv:nucl-ex/0112016 [nucl-ex]].
- [10] B. B. Abelev et al., [ALICE Collaboration], Eur. Phys. J. C 75, no.4, 146 (2015).
- [11] A. Modak [ALICE Collaboration], PoS LHCP2021 (2021), 217, [arXiv:2110.05157 [hep-ex]].
- [12] G. D’Agostini, Nucl. Instrum. Meth. A 362, 487-498 (1995).
- [13] J. Adam et al. [ALICE Collaboration], Phys. Lett. B 772, 567-577 (2017), [arXiv:1612.08966 [nucl-ex]].
- [14] T. Pierog et al. Phys. Rev. C 92, no.3, 034906 (2015) [arXiv:1306.0121 [hep-ph]].
- [15] J. Adam et al. [ALICE Collaboration], Eur. Phys. J. C 77, no.1, 33 (2017) [arXiv:1509.07541 [nucl-ex]].
- [16] C. Bierlich et al. [arXiv:2203.11601 [hep-ph]].
- [17] B. Abelev et al. [ALICE Collaboration], Phys. Rev. Lett. 110, no.3, 032301 (2013).
- [18] X. N. Wang and M. Gyulassy, Phys. Rev. D 44, 3501-3516 (1991).
- [19] S. Roesler, R. Engel and J. Ranft, International Conference on Advanced Monte Carlo for Radiation Physics, Particle Transport Simulation and Applications (MC 2000), pp. 1033-1038. 12, 2000. [arXiv:hep-ph/0012252 [hep-ph]].
- [20]