Multi-VQG: Generating Engaging Questions for Multiple Images
Abstract
Generating engaging content has drawn much recent attention in the NLP community. Asking questions is a natural way to respond to photos and promote awareness. However, most answers to questions in traditional question-answering (QA) datasets are factoids, which reduce individuals’ willingness to answer. Furthermore, traditional visual question generation (VQG) confines the source data for question generation to single images, resulting in a limited ability to comprehend time-series information of the underlying event. In this paper, we propose generating engaging questions from multiple images. We present MVQG 111Github repo: https://github.com/AcademiaSinicaNLPLab /MVQG-Dataset-of-Generating-Engaging-Questions-for-Mu ltiple-Images, a new dataset, and establish a series of baselines, including both end-to-end and dual-stage architectures. Results show that building stories behind the image sequence enables models to generate engaging questions, which confirms our assumption that people typically construct a picture of the event in their minds before asking questions. These results open up an exciting challenge for visual-and-language models to implicitly construct a story behind a series of photos to allow for creativity and experience sharing and hence draw attention to downstream applications.
1 Introduction
The popularity of image-sharing behavior in chats and social media applications shows that this is a natural way to increase participant engagement (Hu et al., 2014). In response, asking questions based on these photos is a straightforward method to promote awareness, sustain attention, and acquire useful information. An obvious example is that when we see someone share a photo of a car accident on Facebook, commenting “Was anyone injured in the crash?” draws more attention and replies from both the author and other readers than “Oh my goodness, that is serious.” Furthermore, from the author’s aspect, posting photos on social media with an engaging, image-related question helps the author to hear the public voice of their feelings and thoughts, and keeps the author connected with the world (Lu et al., 2021).
However, not all the questions have the same effect. Questions in traditional text-based QA datasets such as SQuAD (Rajpurkar et al., 2016), NarrativeQA (Kociský et al., 2018), or FairytaleQA (Zhao et al., 2022) are for educational purposes and language understanding, which do not seek to encourage people to reply. Meanwhile, questions in the VQA dataset (Antol et al., 2015a) usually ask about the color of an object or its position, to which the answers are too obvious for humans to respond. In fact, these two kinds of questions are rarely seen in daily chat and social media posts. Shuster et al. (2019) state that humans consider engaging and effective captions those that “avoid stating the obvious.” As with image captions, an engaging and effective question asks about things behind the scenes and is usually open-ended.
Moreover, the input information for question generation also matters. Images are more straightforward for humans than text, and they provide plenty of room for imagination. In addition, images shared on social media are often sequential instead of solitary, as a single image gives readers only a limited understanding of the experience being shared. To this end, despite the existence of question generation (QG) datasets such as those created by Lu et al. (2021), Wei et al. (2021), or Mostafazadeh et al. (2016), which contain engaging questions, their text-based or single-image settings limit the usage of current QG models in popular applications.
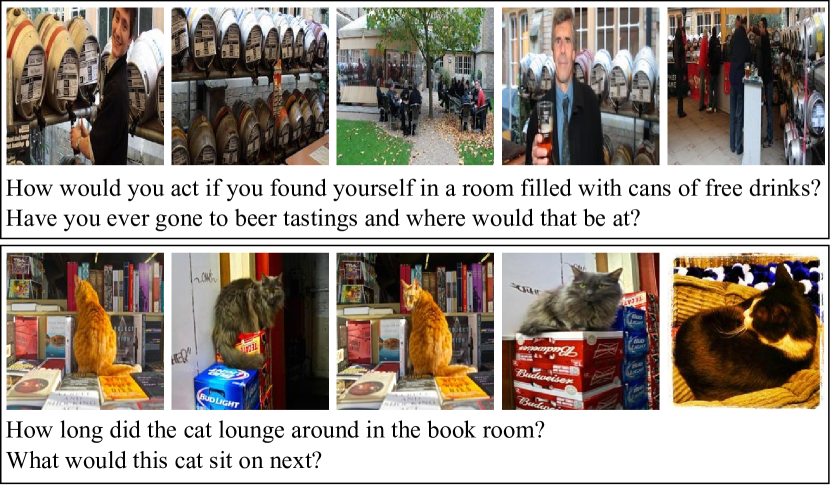
To facilitate downstream applications involving a set of shared images, e.g., accompanying robots, social media robots, automatic assistants, or reminiscence therapy, we propose generating an engaging question from multiple images. We create MVQG, a new dataset, by asking workers to write down a question following instructions based on a sequence of photos from VIST Huang et al. (2016), a dataset consisting of five sequential images and a story about those images. For a better illustration of the task, Figure 1 shows two examples of MVQG. Unlike the instruction of VQA’s data collection (Antol et al., 2015b) asked workers to imagine “a smart robot“ that “understands a lot about images,“ such as objects, scenes, or color, or texture, and come up with questions to “stump this smart robot.” Our instruction, on the other hand, asked workers to imagine that they want to have a conversation with people on Twitter and hence to write a question to start that conversation. The data analysis shows that our instructions help collect more engaging questions than VQG (Mostafazadeh et al., 2016), the benchmark dataset for visual question generation. Furthermore, we establish a series of baselines, including both end-to-end and dual-stage architectures. The experimental results show that information about stories behind the image sequence helps baselines generate engaging questions, which confirms our assumption that humans typically construct stories in their heads before asking questions. These results open up an exciting challenge for visual-and-language models: implicitly constructing a story behind a series of photos to allow for creativity and experience sharing, hence drawing attention to its downstream applications.
The contributions of our paper are threefold: first, we introduce a novel task multi-VQG and MVQG, a new dataset: given a sequence of relevant images, generate a corresponding engaging question; second, we propose several baselines and show that story information helps baselines to generate engaging questions from image sequences; third, we propose five aspects for human evaluation as benchmarks to better evaluate the engagement of generated questions.
2 Related Work
User engagement has received much recent attention in the NLP community. Mostafazadeh et al. (2016) created the first visual question generation dataset comprised of natural and engaging questions. However, engagement is not well-stated in this work; it simply means “the first question that comes to mind”. Shuster et al. (2019) present an engaging image captioning task to improve the ability of machines to communicate with humans; engaging captions are defined as captions that “avoid stating the obvious.” Lu et al. (2021) develop a dataset for poll-question generation for social media posts. This work demonstrates that the poll question is an engaging question that can be utilized to help us hear the public voice for decision-making and thus better understand our society. Wei et al. (2021) state that an engaging and attractive question may incorporate additional details or emotional phrases. Such questions are more likely to be answered. Images and questions are two prominent elements in these works, indicating that visual stimulation and inquiry are typical means to communicate awareness and sustain connections. However, these studies primarily consider single images, limiting the use of current QG models in popular applications because individuals typically share multiple photos to express more comprehensive experiences. In our study, we propose generating engaging questions over an image sequence and creating a dataset comprised of five photos and human-written questions.
A visual-and-language (VL) model is typically used to generate engaging questions from images. After the development of BERT (Devlin et al., 2019), various BERT-based VL models were proposed. These VL models are designed to integrate information from both vision and language modalities via an encoder, and are categorized into fusion encoders and dual encoders based on how input from distinct modalities is aggregated (Du et al., 2022). Fusion encoder models such as VisualBERT (Li et al., 2019), XLMERT (Cho et al., 2020), SOHO (Huang et al., 2021), and VL-T5 (Cho et al., 2021) encode text embeddings and image features in the same model with different fusion approaches. Following self- or cross-attention, the hidden state of the last layer is treated as a fused representation of different modalities. Because fusion encoder models require image and text pairings as input, the model must input all possible pairs in image-text matching tasks, resulting in poor inference speed. Dual encoder models such as CLIP (Radford et al., 2021), on the other hand, use two single-modal encoders to encode the two modalities separately and use the dot product to project the image embedding and text embedding to the same semantic space to compute VL similarity scores. Although dual encoder models are lighter, they frequently fail in difficult VL understanding tasks. As a result, we continue to employ fusion encoder models as baselines in our work. We choose VL-T5 (Cho et al., 2021) as the backbone in particular because it treats all VL tasks as text-generating tasks, which is appropriate for our question generation scenario. Inspired by Shen et al. (2022), we propose an additional baseline model by employing the visual encoder of CLIP (Radford et al., 2021) instead of the self-trained image feature extractor in our fusion encoder, so that the image features are better projected into the semantic space.
3 Dataset: MVQG
3.1 Selection of Image Sequences
Given that the proposed task is to generate engaging questions based on a cohesive narrative, the input photographs cannot be randomly selected from an image set. As a result, we choose image sequences from the VIST dataset, the first dataset of sequential photos accompanied by stories. In the VIST dataset, each image sequence containing five photos extracted from a Flickr album of a human event (e.g., “wedding” or “first day of school”); five photos must be taken within a 48-hour span. Workers constructing VIST arranged the five photos in the order chosen, and then wrote a sentence for each photo to create a story. This procedure guaranteed that the chosen image sequences were “storyable”, i.e., they contained at least one continuous narrative of an event or scene for question generation. In addition, although many social-media posts include multiple images that are not necessarily sequential, when social media users create a post that includes multiple photos, these photos often capture the same scene, event, or concept; that is, these photos can have similar properties to those in the VIST dataset. To this end, we randomly chose 7,700 image sequences from the VIST training set and chose all 1,999 sequences from the VIST test set and assigned them to workers to annotate the engaging questions.
3.2 Question Annotations
Human brains are excellent at object recognition; they can quickly recognize the most significant details in photographs. However, finding the relationship between visuals and developing a unified narrative of events or scenes behind those items requires more time for humans. Thus, if workers are asked to write down a question immediately after seeing the image sequence, they may merely inquire about the first object that comes to mind, rather than ask engaging questions based on a cohesive narrative behind the photos. To solve this problem, we created a data annotation approach to assist workers in writing suitable sentences by answering a three-stage question:
-
Q1.
Please list the top five objects (e.g., dogs, trees) or events (e.g., weddings, parties) you regard as being the most important in the image sequence.
-
Q2.
Please describe the visual sequence using one or more sentences based on the items and events you observed in Q1.
-
Q3.
Imagining that you decide to post this image sequence on Twitter and want to expand the conversation by solely commenting on a question connected to these images. What is the question you would ask based on the description you gave in Q2?
This strategy implicitly prompted workers to formulate an abstract notion of the image sequence according to their observations. As a result, we were able to obtain engaging questions that corresponded to the cohesive narratives of the events depicted in the visual sequences. Furthermore, the descriptions provided in Q2 qualify this dataset for multi-image captioning, making it suited for use in a wider range of vision-and-language applications, e.g., image captioning. Moreover, many recent question generation models are answer-agnostic (Dugan et al., 2022; Chowdhury et al., 2022). Their findings show that adding context summaries as the intermediary layer can improve the relevance and interpretability of generated questions. Inspired by their research, the descriptions provided in Q2 can also serve as summaries to generate event-centric questions.
We gathered MVQG questions by crowdsourcing the task on Amazon Mechanical Turk (AMT). For each image sequence, we assigned 2 to 5 workers to annotate questions (at $0.2/HIT). We only accepted participants with a 98% or more HIT acceptance rate, had 3,000 or more finished HITs, and were located in the US. We also required turkers to spend at least 30 seconds on each assignment. In total, we asked workers to annotate 9,699 image sequences and obtained 31,421 questions. After the annotation process, we manually revised the grammatical errors in all questions. The dataset will be released after the paper is accepted.
4 Dataset Analyses
4.1 Data Statistics
| # all image sequences | 9,699 |
| # all questions | 31,421 |
| # all workers participated | 878 |
| Max # questions written by one worker | 1,249 |
| Avg. # questions written by one worker | 35.8 |
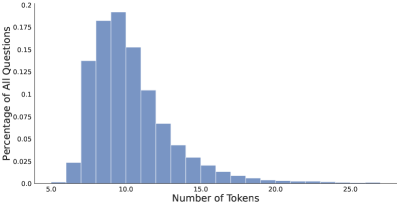
Table 1 reports the statistics of the crowdsourcing task. Figure 2 shows the histogram of the sentence length of the questions in MVQG, where the average question length is 10 tokens (Std=3). Table 2 list the top-15 frequent n-gram (with n=3) of questions opening in MVQG; this suggests that users on social media tend to ask open-ended questions (beginning with “Have you ever”, “Do you think”, or “How do you”), inviting others to share their opinions and expand the conversation. The top-30 frequent words in MVQG are listed in Table 3; this demonstrates that the questions we gathered contain subjective words such as like, think, favorite, and feel, indicating that the collected questions are more related to people’s perspectives than objective facts, encouraging individuals to answer them.
4.2 Disentangling MVQG Effectiveness
| Have you ever | What would you | When was the |
| Do you like | What do you | If you could |
| Do you think | What kind of | Can you share |
| What is the | How do you | Which is your |
| What is your | Why do these | Does anyone know |
| like | last | time | event | city | man |
| people | party | place | wedding | know | enjoy |
| ever | favorite | see | type | food | day |
| would | go | kind | anyone | get | play |
| think | many | family | friends | feel | best |
| Dataset | Vocab. Size | Avg. Sentence Length | Yngve Score | % of Abstract Terms | Avg. Term Depth |
|---|---|---|---|---|---|
| 568 | 11.036 | 2.206 | 0.131 | 7.832 | |
| 592 | 11.165 | 2.173 | 0.127 | 7.406 | |
| 360 | 6.882 | 1.831 | 0.106 | 7.837 | |
| 608 | 12.341 | 2.271 | 0.127 | 7.906 |
Experimental Settings
Two sources contribute to the efficacy of MVQG questions: 1) our question annotation approach, and 2) the cohesive narrative of events resulting from the five-photo arrangement. We conducted an experiment to investigate the effect of these two factors on the question quality.
First, to evaluate the influence of the annotation approach, we selected VQG images and annotated them with different instructions. We randomly chose 200 samples from VQG and hired one worker per sample to annotate the image with our instruction. The annotated questions () were then compared to the questions collected with original VQG instruction (). Then, to evaluate the effect of the number of images, we randomly selected 200 samples from MVQG. For each five-image sample, we randomly chose one image and hired one worker to annotate the selected image per our instructions. The questions with the one-photo setup () were then compared to the questions with the original five-photo MVQG setup ().
Quality Criteria
Following Ferraro et al. (2015), we evaluated the quality of questions according to the following criteria:
-
•
Vocabulary size: the number of unique vocabulary words.
-
•
Average sentence length: this shows how rich and descriptive the sentences are (Ferraro et al., 2015). Writing a sentence is a high-cognitive task. However, to complete numerous jobs fast, MTurk workers typically write short and simple sentences (e.g., “What is the girl doing?”). These short questions are not detailed and are frequently similar to those from other workers. In other words, long question requires more effort from MTurk workers and can be more diverse, which may lead to higher quality.
-
•
Syntactic complexity: the amount of embedding/branching in a sentence’s syntax. We report the mean Yngve score (Yngve, 1960) normalized by the sentence length.
-
•
Percentage of abstract terms: this indicates the range of visual and non-visual concepts covered by the dataset. Of all noun tokens on WordNet (Fellbaum, 1998), tokens belonging to Abstract (Physical) Entity are regarded as abstract (concrete) terms.
-
•
Average term depth: noun terms on WordNet with a smaller depth indicate higher-level concepts (Liu et al., 2021).
Results
The first two columns in Table 4 show that questions in have a 1.7 times larger vocabulary size and are about 2 times longer on average than questions in , which reflects the fact that the proposed annotation approach yields more diverse and descriptive sentences. The third and forth columns in Table 4 indicate that questions in exhibit more complex sentence structure and have more abstract words than , implying that writing down descriptions first helps individuals think more about the abstract events behind the images and thus yields more complex questions. This then makes our collected questions much easier for individuals to engage with. The last column in Table 4 shows that questions in have a smaller term depth than questions in , suggesting that questions in use more high-level concepts. Basic-level categories were typically used to name things (Rosch and Mervis, 1975; Anglin, 1977; Brown, 1958), whereas in multi-image scenarios, higher-level ideas were more often used to cover things in various photos Murphy (2022). This encourages individuals to answer questions not only based on the things they saw, but by imagining the story or the relations of objects in the five images. This shows that our instructions contributed more to the engagement of the collected questions than the multi-image setting.
5 Baselines
We propose both end-to-end and dual-stage VL baselines for MVQG. We introduce each baseline here and provide the details in Appendix A.
| Group | Baseline | Benchmark 1 | Benchmark 2 | Benchmark 3 | Benchmark 4 | Benchmark 5 |
|---|---|---|---|---|---|---|
| 1 | 35.08% (1.981) | 34.80% (1.985) | 34.60% (1.983) | 35.04% (1.971) | 35.80% (1.963) | |
| 31.84% (2.038) | 32.64% (2.018) | 30.64% (2.050) | 32.60% (2.026) | 30.12% (2.058) | ||
| 33.08% (1.981) | 32.56% (1.995) | 34.76% (1.966) | 32.36% (2.001) | 34.08% (1.978) | ||
| 2 | 33.44% (2.016) | 33.96% (2.019) | 32.88% (2.020) | 34.24% (1.986) | 33.20% (2.001) | |
| 33.44% (2.006) | 32.80% (1.995) | 33.36% (2.001) | 31.64% (2.025) | 33.32% (2.002) | ||
| 33.12% (1.977) | 33.24% (1.985) | 33.76% (1.979) | 34.12% (1.988) | 33.48% (1.996) | ||
| 3 | 34.09% (1.988) | 34.81% (1.974) | 34.13% (1.984) | 32.01% (2.022) | 33.97% (1.993) | |
| 34.25% (1.976) | 32.97% (2.012) | 32.97% (2.008) | 33.89% (1.980) | 32.13% (2.008) | ||
| 31.65% (2.036) | 32.21% (2.012) | 32.89% (2.008) | 34.09% (1.998) | 33.89% (1.999) | ||
| 4 | 50.68% (1.493) | 51.24% (1.488) | 50.48% (1.495) | 50.48% (1.495) | 49.28% (1.507) | |
| 49.32% (1.507) | 48.76% (1.512) | 49.52% (1.505) | 49.52% (1.505) | 50.72% (1.493) |
For the end-to-end baselines, we chose the VL-T5 model (Cho et al., 2021) as the backbone . VL-T5 inputs contain the visual embedding and the visual semantic grounding . Each image is handled as a sequence of visual embeddings consisting of the whole image embedding and its object region embeddings. As visual embeddings from RoI features lack semantic meaning, we inject visual semantic grounding into VL-T5 to facilitate semantic understanding and cross-image reasoning. We adopt grounded situation recognition (GSR) Pratt et al. (2020) and the corresponding JSL model to produce structured semantic summaries of images. For each image , JSL outputs a verb representing the salient activity of and its 1 to 6 corresponding semantic roles. The predicted verb and nouns are combined as the visual semantic grounding of each image.
We propose three fine-tuned versions of VL-T5 respectively pretrained on VCR (Zellers et al., 2019) (), VIST (), and VQG (), and fine-tuned on MVQG. He et al. (2019) show that after standard fine-tuning, the model forgets important language generation skills acquired during pretraining. Therefore, we propose the adapt-tuned version of VL-T5 by adding the adapter layer to each Transformer block of the baseline, and replacing the fine-tuning stage with adapt-tuning. In the adapt-tuning stage, we update only the parameters of the adapter layer and freeze all other parameters. We pretrain our model on VIST () and VQG (), and adapt-tune on MVQG. Moreover, inspired by Shen et al. (2022), which shows that the CLIP visual encoder (Radford et al., 2021) can be used as visual embedding and improve the VL model performance, we propose the CLIP version of VL-T5 by replacing the visual embeddings of VL-T5 with the output of the CLIP visual encoder ().
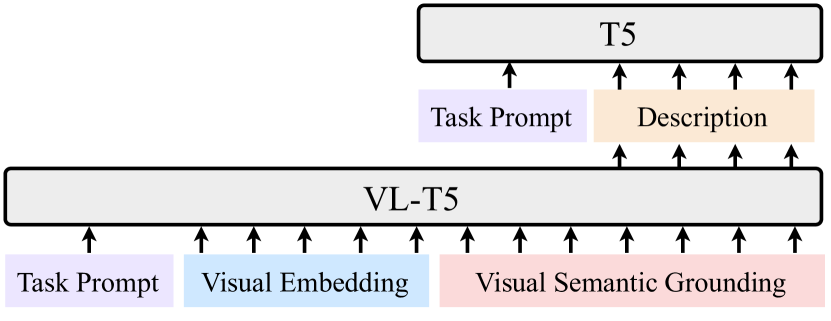
For the dual-stage baselines, we first used an image captioning model to generate a description from an image sequence, after which we used a question generation model to generate a question from the description. The image captioning model used was a VL-T5 model pretrained on VCR, and the question generation model was a T5 model (Raffel et al., 2020) pretrained on SQuAD (Rajpurkar et al., 2016). We provided three types of text as descriptions: (1) captions from the VIST dataset (CAP2Q), (2) stories from the VIST dataset (STY2Q), and (3) summaries from Q2 in MVQG (SUM2Q). The VL-T5 image captioning model and question generation model were fine-tuned on these three description types, respectively. As the end-to-end baselines used CLIP to encode visual input, we adopted the CLIP visual encoder in our dual-staged baselines. We replaced the T5 model in the second stage with VL-T5 and then used the result of the CLIP visual encoder as visual input and the descriptions as textual input. For the different types of descriptions, we propose , , and .
6 Experiment and Discussion
We randomly divided MVQG into the training (70%), val (20%), and test (10%) sets, and evaluated the models introduced earlier with human and automatic metric evaluation.
| Ranking | |||||
|---|---|---|---|---|---|
| Baseline | Benchmark 1 | Benchmark 2 | Benchmark 3 | Benchmark 4 | Benchmark 5 |
| 35.1% | 34.9% | 34.0% | 34.9% | 34.0% | |
| 32.3% | 31.7% | 33.4% | 32.4% | 33.4% | |
| 32.5% | 33.4% | 32.6% | 32.7% | 32.6% | |
| Rating | |||||
| Baseline | Benchmark 1 | Benchmark 2 | Benchmark 3 | Benchmark 4 | Benchmark 5 |
| 3.55 | 3.68 | 3.66 | 3.66 | 3.69 | |
| 3.60 | 3.59 | 3.62 | 3.61 | 3.61 | |
| 3.66 | 3.68 | 3.72 | 3.72 | 3.70 | |
6.1 Human Evaluation
Recent work has demonstrated the unreliability of automatic evaluation and recommends relying on human evaluation Liu et al. (2016). Therefore, we first conducted a human evaluation to understand how people feel about the generated questions, specifically whether they are natural, engaging, and focus on high-level relations among objects. We randomly selected 100 image sequences from the MVQG test set and generated questions for each using our established baselines and models. For each sequence, we hired five workers from Amazon MTurk to rank the generated questions according to the following benchmarks:
-
Benchmark 1: When you see images like these on social media, it is natural to ask this question.
-
Benchmark 2: This question focuses primarily on the essential objects of the images and the relationships between these objects.
-
Benchmark 3: This question focuses primarily on the story or event behind all the images rather than one specific image.
-
Benchmark 4: This question is specific to the event where the photos were taken. It could be irrelevant or weird to ask this question for other similar events.
-
Benchmark 5: This is an engaging question for this set of photos. You would want to answer this question if you saw it on social media.
Empirically, it is difficult for workers to rank many items at the same time; results thereof are unreliable. Therefore, we divided our baselines into four groups for further discussion. Results are shown in Table 5.
Group 1: Different Pretrained Datasets
First, we compare three VL-T5 baselines pretrained on VIST, VCR, and VQG, respectively. The first group of results in Table 5 reveals that the VL-T5 baseline pretrained on VIST performs best on most of the benchmarks. The substantial difference between and on Benchmark 5 suggests that story information in the pretraining stage helps models ask more engaging questions.
Group 2: Image Description Type
We compare three Description2Q baselines, each containing captions, stories, and summaries as the input text. The result is displayed in the second group of Table 5. and perform well on the Benchmarks 2 and 4 because captions and summaries of photos are better able to provide details of objects and lead to more specific questions. However, has the most rank-1 questions based on Benchmark 1. This suggests that story information results in more natural questions. This finding also suggests that naturalness may not be the main factor leading to engagement, which contradicts the premise in VQG.
Group 3: With or Without Story Information
Third, we investigate the differences between baselines with and without story information. We compare with-story baselines ( and ) and the without-story baseline (). The result in the third group of Table 5 shows that humans prefer questions generated by baselines with story information. Moreover, the fact that outperforms on the Benchmark 5 suggests that the generated questions could be even more engaging if the story information were more explicit.
Group 4: Fine-tuning and Adapt-tuning
Finally, we compare the difference between fine-tuning and adapt-tuning strategies on VL-T5 baselines pretrained on VIST. The result in the last group of Table 5 shows that outperforms on Benchmarks 1 to 4, whereas surpasses on Benchmark 5. Because adapt-tuning retains more information gained via VIST, this result confirms the prior finding that explicit story information results in engaging questions. Also note that this result shows that engagement does not rely only on Benchmarks 1 to 4 as shown in related work.
Ranking vs. Rating
In addition to ranking, several studies evaluated the generated text via human rating (Hu et al., 2020; Wang et al., 2020). Though literature has shown that rating result is almost with no correlation with direct ranking (Hsu et al., 2022), here we still provide both results among , , and for reference. For the rating experiment, we ask workers to rate the generated questions from 1 (the worst) to 5 (the best) according to the 5 benchmarks. We conduct both ranking and rating experiments on the whole testing set (N=599). The result in Table 6 shows that for ranking evaluation, outperforms other two baselines on all benchmarks significantly (the Kruskal-Wallis test, p=0.02), aligning the result in Table 5, while for rating evaluation, performs better insignificantly (p=0.87). These results overall confirm that is a better setting and MVQG should use ranking for evaluation.
6.2 Automatic Evaluation
Although human evaluation is already a good indicator of model performance, we still provide the automatic evaluation results here for reference. We evaluate the baselines with BLEU (Papineni et al., 2002), METEOR (Banerjee and Lavie, 2005), and BLEURT (Sellam et al., 2020).
| Baseline | B_1 | B_4 | METEOR | BLEURT |
|---|---|---|---|---|
| 40.6 | 3.0 | 38.5 | -51.1 | |
| 42.7 | 4.8 | 41.8 | -42.2 | |
| 41.3 | 3.6 | 40.1 | -46.6 | |
| 41.6 | 2.6 | 39.2 | -44.0 | |
| 41.2 | 3.2 | 38.9 | -51.1 | |
| 41.6 | 3.8 | 38.7 | -54.0 | |
| Cap2Q | 42.8 | 3.4 | 39.6 | -48.4 |
| STY2Q | 41.1 | 3.4 | 39.6 | -48.6 |
| SUM2Q | 41.7 | 3.0 | 39.5 | -47.4 |
| 40.6 | 3.3 | 40.5 | -46.4 | |
| 41.8 | 4.2 | 40.5 | -49.3 | |
| 42.1 | 4.2 | 39.7 | -44.2 |
Table 7 shows the results. outperforms other baselines, particularly and . In addition, and outperform other dual-stage baselines. These two results support the human evaluation result: that models with story information generate more engaging questions. Moreover, outperforming and outperforming STY2Q indicate that the CLIP model provides better embeddings for question generation. Furthermore, all the dual-staged models with CLIP encoder outperform those without it. Since the second stage of those without CLIP generates questions from only text, and the second stage of those with CLIP generates questions from both texts and images, this result illustrates the assistance of visual information for MVQG. The only result that differs from the human evaluation is that outperforms and . However, this is straightforward to explain: the end-to-end fine-tuned model maintains the least information from pretraining and leads to the most similar outcome to the fine-tuning data, which gives it an advantage in the automatic metric evaluation where exact matches are rewarded.
6.3 Effect of Multi-Image Setting
| Baseline | B_1 | B_4 | METEOR | BLEURT |
|---|---|---|---|---|
| 42.7 | 4.8 | 41.8 | -42.2 | |
| 42.1 | 3.9 | 39.5 | -50.5 | |
| 42.1 | 5.0 | 41.6 | -44.2 | |
| 41.6 | 2.6 | 39.2 | -44.0 | |
| 41.8 | 2.9 | 38.0 | -51.8 | |
| 41.4 | 2.7 | 39.8 | -44.2 | |
| 41.1 | 3.4 | 39.6 | -48.6 | |
| 40.5 | 2.8 | 37.9 | -53.4 | |
| 41.0 | 3.5 | 39.8 | -48.4 | |
| 41.8 | 4.2 | 40.5 | -49.3 | |
| 41.3 | 2.9 | 38.0 | -53.4 | |
| 41.3 | 2.6 | 39.1 | -51.7 |
We study the impact of the multi-image setting on beselines. Here we seek to determine whether the most relevant image can represent the entire image sequence, as questions can focus on only one certain event or object. We begin by determining the most representative image in the image sequence by calculating the CLIP score, the cosine similarity between each image and the ground truth question. Then we examine questions generated from three types of input: (1) the entire image sequence, (2) only the most relevant image, and (3) the image sequence without the most relevant image.
Table 8 shows the experiment results. Using the most relevant image leads to the lowest score in most of the baselines, implying that a single image cannot in fact represent the whole image sequence and the underlying event or scenario. Surprisingly, the results also show that even after removing the most relevant image, the performance of some baselines is still high. This suggests that other images in the sequence assist in the reconstruction of missing information and even leave room for more imagination. It also shows that the collected questions cover information from all images in the sequence.
6.4 Case Study
Table 6.4 displays example image sequences and questions generated by baselines. Cases 1 and 2 provide clues for the reason why human evaluation and automatic metrics produce inconsistent results for , , and . In case 1, both the ground truth and the output mention the flower, whereas focuses on the insects and the bird. Because fine-tuned models are more likely to forget the pretrained task and fit the ground truth of the fine-tuned task, may obtain a higher score from the match-based automatic metrics. Adapt-tuning, on the other hand, retains more information from the pretrained task and results in models that do not always follow the guide of the ground truth. As a result, while may have a lower automatic evaluation score, it may generate questions that follow the story, reflecting human preferences. Case 2 shows the case of diverse images. As the first three photos are very different from the last two, it is hard for to generate an engaging question using implicit story information, resulting in a general question. , in contrast, takes an explicit story as input, which enables the model to generate a question connected to the underlying story.
| Case 1 | |
|---|---|
|
|
|
| Ground Truth | Can someone tell me what the name of the bright pink flowers are? |
| \hdashline | What color is the flower? |
| \hdashline | Have you been interested in learning about bugs and bird life? |
| Case 2 | |
|
|
|
| Ground Truth | When you look at these pictures, what else do you think might be sold? |
| \hdashline | Do you like to go to places that have a crowd of people? |
| \hdashline | What kind of food would you like to buy at this festival? |
| Case 3 | |
|
|
|
| Ground Truth | How does everyone think the red sox are going to do this year? |
| \hdashline | Are you fascinated by football? |
| \hdashline | Have you ever been to a costume party before? |
Although and appear to be better than , the generated questions may still include errors. Case 3 is an example illustrating several commonly-seen errors. First, an object and relationship detection error is observed in the output of . The baseline mistakenly detects the objects in the last image as football players. As a result, it asks “Are you fascinated by football?” instead of “baseball.” Second, an inference error is shown in the output of , where people are dressed up in costumes in the second image but it mistakenly detects the event as a costume party. Here we see that grounding and event inference are two major directions for improving the quality of the generated questions.
7 Conclusion
We propose a novel task: given a sequence of images, generate an engaging question. This task extends visual question generation by enabling reasoning across images to comprehend a complete story. We collect MVQG by asking workers to write down five obvious objects, a summary of the image sequence, as well as an engaging question that they would want to post on social media. We establish several baselines for this task. Experimental results reveal that image-related stories help models generate engaging questions, and that using multiple images as input helps models understand the overall picture of the current situation, leading to a better question. The task, dataset, and experimental results we provide open up an exciting challenge for visual-and-language models to implicitly construct a story behind a series of photos for creativity and experience sharing and further attracting attention for downstream applications.
Limitations
Like most crowdsourced datasets, MVQG inherits the common biases of using online crowdsourcing platforms to collect data. For example, the crowd workers on Amazon Mechanical Turk do not represent the user population of popular social media, such as Twitter. Furthermore, although we instructed workers to write questions as if they were posting on Twitter, the used language would still be different. People on social media use informal words and netspeak frequently, but crowd workers are incentivized to get their work approved and might prefer to use more formal languages or polite tones. Moreover, since we specifically encouraged MTurk workers to imagine they are writing questions that they would ask on Twitter, MVQG may be potentially biased on Tweet-liked data. We expect that different platforms will encourage different text styles, but given the amount of data we could financially afford to collect in the first study for this research problem, we decide to focus on only one platform’s style to reduce possible factors. Asking workers to imagine Facebook or Instagram can be another practice, but it will still introduce different biases.
Another limitation is the evaluation of engagement. We evaluated the question engagement by asking crowd workers to rank the questions using different criteria. However, this approach does not capture the in-the-moment feelings or authentic reactions of social media users. The human evaluation results may not reflect the actual performance when the technology is being deployed in the wild.
Ethical Considerations
Although our research aims to produce natural and engaging questions, we are aware of the possibility of employing a similar approach to generate inappropriate, sexist, or racist questions. Furthermore, as the proposed methods use a pre-trained grounded situation recognition and a T5 model as components, the generated questions might inherit the biases of their training data. More research is required to understand and mitigate these risks.
Acknowledgements
This research are partially supported by National Science and Technology Council, Taiwan, under Grant no. 110-2634-F-002-051- and 108-2221-E-001-012-MY3.
References
- Anglin (1977) J. Michael Anglin. 1977. Word, object, and conceptual development.
- Antol et al. (2015a) Stanislaw Antol, Aishwarya Agrawal, Jiasen Lu, Margaret Mitchell, Dhruv Batra, C. Lawrence Zitnick, and Devi Parikh. 2015a. VQA: Visual Question Answering. In International Conference on Computer Vision (ICCV).
- Antol et al. (2015b) Stanislaw Antol, Aishwarya Agrawal, Jiasen Lu, Margaret Mitchell, Dhruv Batra, C. Lawrence Zitnick, and Devi Parikh. 2015b. Vqa: Visual question answering. In Proceedings of the IEEE International Conference on Computer Vision (ICCV).
- Banerjee and Lavie (2005) Satanjeev Banerjee and Alon Lavie. 2005. METEOR: An automatic metric for MT evaluation with improved correlation with human judgments. In Proceedings of the ACL Workshop on Intrinsic and Extrinsic Evaluation Measures for Machine Translation and/or Summarization, pages 65–72, Ann Arbor, Michigan. Association for Computational Linguistics.
- Brown (1958) R. Ben Brown. 1958. How shall a thing be called. Psychological review, 65 1:14–21.
- Cho et al. (2021) Jaemin Cho, Jie Lei, Hao Tan, and Mohit Bansal. 2021. Unifying vision-and-language tasks via text generation. In ICML.
- Cho et al. (2020) Jaemin Cho, Jiasen Lu, Dustin Schwenk, Hannaneh Hajishirzi, and Aniruddha Kembhavi. 2020. X-LXMERT: Paint, Caption and Answer Questions with Multi-Modal Transformers. In Proceedings of the 2020 Conference on Empirical Methods in Natural Language Processing (EMNLP), pages 8785–8805, Online. Association for Computational Linguistics.
- Chowdhury et al. (2022) Jishnu Ray Chowdhury, Debanjan Mahata, and Cornelia Caragea. 2022. On the evaluation of answer-agnostic paragraph-level multi-question generation.
- Devlin et al. (2019) Jacob Devlin, Ming-Wei Chang, Kenton Lee, and Kristina Toutanova. 2019. BERT: Pre-training of deep bidirectional transformers for language understanding. In Proceedings of the 2019 Conference of the North American Chapter of the Association for Computational Linguistics: Human Language Technologies, Volume 1 (Long and Short Papers), pages 4171–4186, Minneapolis, Minnesota. Association for Computational Linguistics.
- Du et al. (2022) Yifan Du, Zikang Liu, Junyi Li, and Wayne Xin Zhao. 2022. A survey of vision-language pre-trained models.
- Dugan et al. (2022) Liam Dugan, Eleni Miltsakaki, Shriyash Upadhyay, Etan Ginsberg, Hannah Gonzalez, Dayheon Choi, Chuning Yuan, and Chris Callison-Burch. 2022. A feasibility study of answer-agnostic question generation for education.
- Fellbaum (1998) Christiane Fellbaum. 1998. WordNet: An Electronic Lexical Database. Bradford Books.
- Ferraro et al. (2015) Francis Ferraro, Nasrin Mostafazadeh, Ting-Hao Huang, Lucy Vanderwende, Jacob Devlin, Michel Galley, and Margaret Mitchell. 2015. A survey of current datasets for vision and language research. In Proceedings of the 2015 Conference on Empirical Methods in Natural Language Processing, pages 207–213, Lisbon, Portugal. Association for Computational Linguistics.
- He et al. (2015) Kaiming He, Xiangyu Zhang, Shaoqing Ren, and Jian Sun. 2015. Deep residual learning for image recognition. CoRR, abs/1512.03385.
- He et al. (2019) Tianxing He, Jun Liu, Kyunghyun Cho, Myle Ott, Bing Liu, James R. Glass, and Fuchun Peng. 2019. Mix-review: Alleviate forgetting in the pretrain-finetune framework for neural language generation models. CoRR, abs/1910.07117.
- Hendrycks and Gimpel (2016) Dan Hendrycks and Kevin Gimpel. 2016. Gaussian error linear units (gelus).
- Holtzman et al. (2019) Ari Holtzman, Jan Buys, Maxwell Forbes, and Yejin Choi. 2019. The curious case of neural text degeneration. CoRR, abs/1904.09751.
- Hsu et al. (2022) Chi-Yang Hsu, Yun-Wei Chu, Vincent Chen, Kuan-Chieh Lo, Chacha Chen, Ting-Hao Huang, and Lun-Wei Ku. 2022. Learning to rank visual stories from human ranking data. In Proceedings of the 60th Annual Meeting of the Association for Computational Linguistics (Volume 1: Long Papers), pages 6365–6378.
- Hu et al. (2020) Junjie Hu, Yu Cheng, Zhe Gan, Jingjing Liu, Jianfeng Gao, and Graham Neubig. 2020. What makes a good story? designing composite rewards for visual storytelling. Proceedings of the AAAI Conference on Artificial Intelligence, 34(0505):7969–7976.
- Hu et al. (2014) Yuheng Hu, Lydia Manikonda, and S. Kambhampati. 2014. What we instagram: A first analysis of instagram photo content and user types. In ICWSM.
- Huang et al. (2016) Ting-Hao Kenneth Huang, Francis Ferraro, Nasrin Mostafazadeh, Ishan Misra, Aishwarya Agrawal, Jacob Devlin, Ross Girshick, Xiaodong He, Pushmeet Kohli, Dhruv Batra, et al. 2016. Visual storytelling. In Proceedings of the 2016 Conference of the North American Chapter of the Association for Computational Linguistics: Human Language Technologies, pages 1233–1239.
- Huang et al. (2021) Zhicheng Huang, Zhaoyang Zeng, Yupan Huang, Bei Liu, Dongmei Fu, and Jianlong Fu. 2021. Seeing out of the box: End-to-end pre-training for vision-language representation learning. 2021 IEEE/CVF Conference on Computer Vision and Pattern Recognition (CVPR), pages 12971–12980.
- Kociský et al. (2018) Tomás Kociský, Jonathan Schwarz, Phil Blunsom, Chris Dyer, Karl Moritz Hermann, Gábor Melis, and Edward Grefenstette. 2018. The narrativeqa reading comprehension challenge. Transactions of the Association for Computational Linguistics, 6:317–328.
- Li et al. (2019) Liunian Harold Li, Mark Yatskar, Da Yin, Cho-Jui Hsieh, and Kai-Wei Chang. 2019. Visualbert: A simple and performant baseline for vision and language.
- Liu et al. (2016) Chia-Wei Liu, Ryan Lowe, Iulian Vlad Serban, Michael Noseworthy, Laurent Charlin, and Joelle Pineau. 2016. How NOT to evaluate your dialogue system: An empirical study of unsupervised evaluation metrics for dialogue response generation. CoRR, abs/1603.08023.
- Liu et al. (2021) Fangyu Liu, Emanuele Bugliarello, Edoardo Maria Ponti, Siva Reddy, Nigel Collier, and Desmond Elliott. 2021. Visually grounded reasoning across languages and cultures. In Proceedings of the 2021 Conference on Empirical Methods in Natural Language Processing, pages 10467–10485, Online and Punta Cana, Dominican Republic. Association for Computational Linguistics.
- Lu et al. (2021) Zexin Lu, Keyang Ding, Yuji Zhang, Jing Li, Baolin Peng, and Lemao Liu. 2021. Engage the public: Poll question generation for social media posts. In Proceedings of the 59th Annual Meeting of the Association for Computational Linguistics and the 11th International Joint Conference on Natural Language Processing (Volume 1: Long Papers), pages 29–40, Online. Association for Computational Linguistics.
- Mostafazadeh et al. (2016) Nasrin Mostafazadeh, Ishan Misra, Jacob Devlin, Larry Zitnick, Margaret Mitchell, Xiaodong He, and Lucy Vanderwende. 2016. Generating natural questions about an image. CoRR, abs/1603.06059.
- Murphy (2022) Gregory L. Murphy. 2022. Categories and concepts. In R. Biswas-Diener & E. Diener, editors, Champaign, IL. DEF publishers.
- Papineni et al. (2002) Kishore Papineni, Salim Roukos, Todd Ward, and Wei-Jing Zhu. 2002. Bleu: a method for automatic evaluation of machine translation. In Proceedings of the 40th Annual Meeting of the Association for Computational Linguistics, pages 311–318, Philadelphia, Pennsylvania, USA. Association for Computational Linguistics.
- Pratt et al. (2020) Sarah Pratt, Mark Yatskar, Luca Weihs, Ali Farhadi, and Aniruddha Kembhavi. 2020. Grounded situation recognition. ArXiv, abs/2003.12058.
- Radford et al. (2021) Alec Radford, Jong Wook Kim, Chris Hallacy, Aditya Ramesh, Gabriel Goh, Sandhini Agarwal, Girish Sastry, Amanda Askell, Pamela Mishkin, Jack Clark, Gretchen Krueger, and Ilya Sutskever. 2021. Learning transferable visual models from natural language supervision. In ICML.
- Raffel et al. (2020) Colin Raffel, Noam Shazeer, Adam Roberts, Katherine Lee, Sharan Narang, Michael Matena, Yanqi Zhou, Wei Li, and Peter J. Liu. 2020. Exploring the limits of transfer learning with a unified text-to-text transformer. Journal of Machine Learning Research, 21(140):1–67.
- Rajpurkar et al. (2016) Pranav Rajpurkar, Jian Zhang, Konstantin Lopyrev, and Percy Liang. 2016. SQuAD: 100,000+ questions for machine comprehension of text. In Proceedings of the 2016 Conference on Empirical Methods in Natural Language Processing, pages 2383–2392, Austin, Texas. Association for Computational Linguistics.
- Rosch and Mervis (1975) Eleanor Rosch and Carolyn B Mervis. 1975. Family resemblances: Studies in the internal structure of categories. Cognitive Psychology, 7(4):573–605.
- Sellam et al. (2020) Thibault Sellam, Dipanjan Das, and Ankur Parikh. 2020. BLEURT: Learning robust metrics for text generation. In Proceedings of the 58th Annual Meeting of the Association for Computational Linguistics, pages 7881–7892, Online. Association for Computational Linguistics.
- Shen et al. (2022) Sheng Shen, Liunian Harold Li, Hao Tan, Mohit Bansal, Anna Rohrbach, Kai-Wei Chang, Zhewei Yao, and Kurt Keutzer. 2022. How much can CLIP benefit vision-and-language tasks? In International Conference on Learning Representations.
- Shuster et al. (2019) Kurt Shuster, Samuel Humeau, Hexiang Hu, Antoine Bordes, and Jason Weston. 2019. Engaging image captioning via personality. 2019 IEEE/CVF Conference on Computer Vision and Pattern Recognition (CVPR), pages 12508–12518.
- Wang et al. (2020) Ruize Wang, Zhongyu Wei, Piji Li, Qi Zhang, and Xuanjing Huang. 2020. Storytelling from an image stream using scene graphs. Proceedings of the AAAI Conference on Artificial Intelligence, 34(0505):9185–9192.
- Wei et al. (2021) Jiayi Wei, Xilian Li, Yi Zhang, and Xin Wang. 2021. Visual question rewriting for increasing response rate. Proceedings of the 44th International ACM SIGIR Conference on Research and Development in Information Retrieval.
- Yngve (1960) Victor H. Yngve. 1960. A model and an hypothesis for language structure. Proceedings of the American Philosophical Society, 104(5):444–466.
- Zellers et al. (2019) Rowan Zellers, Yonatan Bisk, Ali Farhadi, and Yejin Choi. 2019. From recognition to cognition: Visual commonsense reasoning. In The IEEE Conference on Computer Vision and Pattern Recognition (CVPR).
- Zhao et al. (2022) Zhenjie Zhao, Yufang Hou, Dakuo Wang, Mo Yu, Chengzhong Liu, and Xiaojuan Ma. 2022. Educational question generation of children storybooks via question type distribution learning and event-centric summarization. In Proceedings of the 60th Annual Meeting of the Association for Computational Linguistics (Volume 1: Long Papers), pages 5073–5085, Dublin, Ireland. Association for Computational Linguistics.
Appendix A Implementation Details of Baselines
A.1 VL-T5
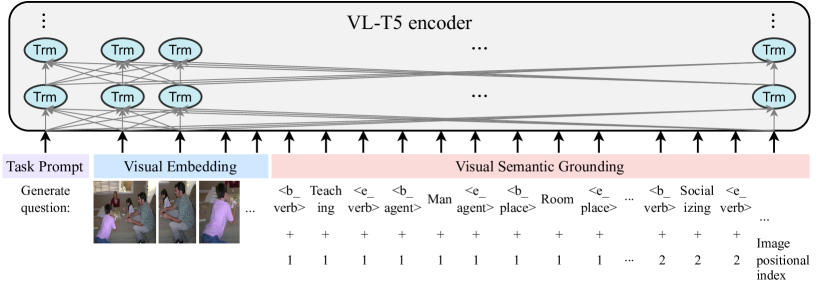
The input of the VL-T5 model is depicted in Figure 3. The input contains the task prompt, the visual embedding, and the visual semantic grounding. Each semantic grounding embedding is the sum of the token embedding and the image positional embedding. The semantic grounding is produced by grounded situation recognition (GSR) Pratt et al. (2020) and the corresponding JSL model. Consider the image in Figure 3, which depicts a man teaching a boy. JSL predicts the primary activity teaching (verb frame) and then the agent man and place room as its semantic roles. The predicted verb and nouns are combined as the visual semantic grounding of each image. In particular, when tokenizing, we quote the verb with the starting and ending tokens <b_verb> and <e_verb> to highlight the activity, and the <b_[role]> and <e_[role]> tokens to spot the roles and their types, as illustrated in Figure 3. The decoder, which is similar to the original T5 decoder, is omitted from the figure for brevity. The embeddings of text tokens for these semantic roles are randomly initiated during training, and each text embedding is combined with the image’s positional index embedding of its associated visual embedding to link the semantic role tokens to their corresponding visual images.
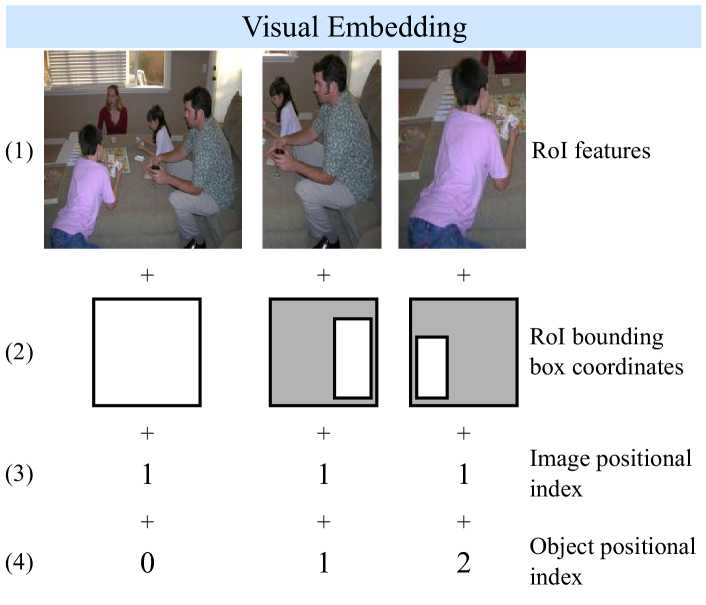
Figure 4 illustrates how images are encoded. Each image is handled as a sequence of visual embeddings consisting of the entire image embedding and its object region embeddings to . Each visual embedding includes (1) RoI features: the hidden representation of the bounding box created by a ResNet50 He et al. (2015) model, (2) RoI bounding box coordinates: the upper left and the lower right points of the box and its area, (3) image positional indices: , where is the number of images, used to discriminate regions from different images, and (4) object positional indices: , which serve as positional embeddings in an image. These are all projected to 768-dimensional vectors, summed, and layer-normalized to form the final visual embedding . Note that in is 0.
We used the AdamW optimizer with a learning rate of 1e-4 and a batch size of 8 for both pretrained and fine-tuned tasks. During inference, we used nucleus sampling with , which has been shown effective in generating diverse text Holtzman et al. (2019).
A.2 Adapter Layer
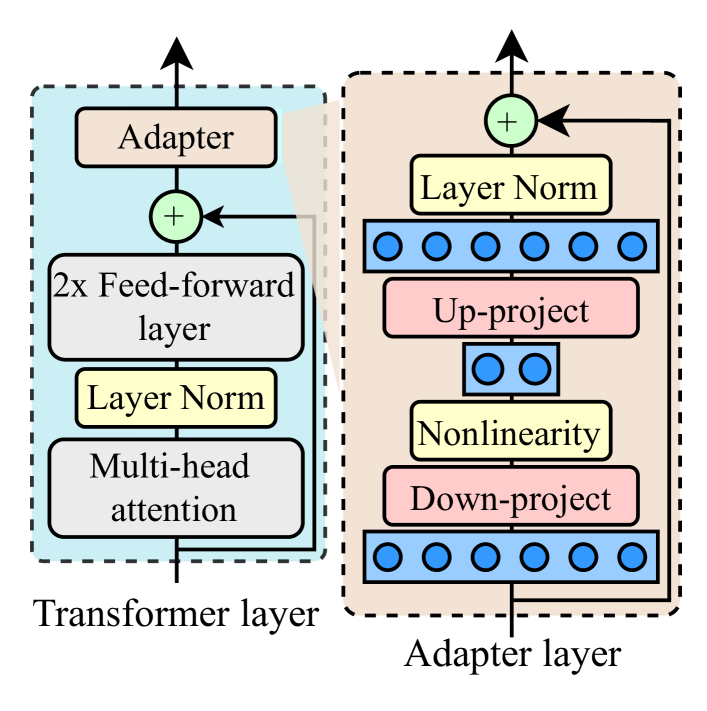
For the adapt-tuned baselines, we employed an adapter layer after the original Transformer layers for both the VL-T5 encoder and decoder, as shown in Figure 5. The adapter layer down-projects the input as a 384-dimensional vector, passing it into a GELU activation function (Hendrycks and Gimpel, 2016), up-projecting it to the original size, and finally using a residual layer to sum the projected vector with the input. During the pretraining stage, we bypassed the adapter layers and trained only the parameters of the original Transformer layers. During the adapt-tuning stage, we considered and trained the adapter layers while fixing the parameters of the original parts.
A.3 CLIP as Visual Encoder
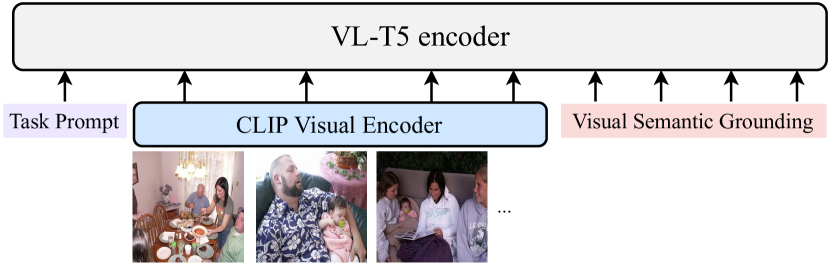
Figure 6 depicts how the CLIP visual encoder is used in the VL-T5 baseline. Instead of finding RoI features and bounding boxes in each image, we put the entire image into the CLIP visual encoder and obtained the visual embedding. Because the visual embedding from CLIP was a 1024-dimensional vector, we projected it onto 768 dimensions using a linear layer. The CLIP visual encoder and the linear layer were tuned during the training stage. The CLIP variant we used was CLIP-RN50 (ResNet50 as the visual backbone).
A.4 Description2Q
The architecture of Description2Q is shown in Figure 7. We used a VL-T5 model to generate descriptions from image sequences. The input of VL-T5 was the same as in A.1, and the output description was a caption, story, or summary, depending on the fine-tuning tasks. Then the generated description was fed into a T5 model pretrained on SQuAD and fine-tuned on the ground truth of descriptions to generate a question.