Maven-Ere: A Unified Large-scale Dataset for Event Coreference, Temporal, Causal, and Subevent Relation Extraction
Abstract
The diverse relationships among real-world events, including coreference, temporal, causal, and subevent relations, are fundamental to understanding natural languages. However, two drawbacks of existing datasets limit event relation extraction (ERE) tasks: (1) Small scale. Due to the annotation complexity, the data scale of existing datasets is limited, which cannot well train and evaluate data-hungry models. (2) Absence of unified annotation. Different types of event relations naturally interact with each other, but existing datasets only cover limited relation types at once, which prevents models from taking full advantage of relation interactions. To address these issues, we construct a unified large-scale human-annotated ERE dataset Maven-Ere with improved annotation schemes. It contains event coreference chains, temporal relations, causal relations, and subevent relations, which is larger than existing datasets of all the ERE tasks by at least an order of magnitude. Experiments show that ERE on Maven-Ere is quite challenging, and considering relation interactions with joint learning can improve performances. The dataset and source codes can be obtained from https://github.com/THU-KEG/MAVEN-ERE.
1 Introduction
Communicating events is a central function of human languages, and understanding the complex relationships between events is essential to understanding events (Levelt, 1993; Miller and Johnson-Laird, 2013; Pinker, 2013). Thus event relation extraction (ERE) tasks, including extracting event coreference, temporal, causal and subevent relations (Liu et al., 2020b), are fundamental challenges for natural language processing (NLP) and also support various applications (Chaturvedi et al., 2017; Rashkin et al., 2018; Khashabi et al., 2018; Sap et al., 2019; Zhang et al., 2020).
Dataset #Doc. #Event Coref. #T-Link #C-Link #Subevent ACE 2005 ✓ ✗ ✗ ✗ TAC KBP ✓ ✗ ✗ ✗ TB-Dense ✗ ✗ ✗ MATRES ✗ ✗ ✗ Causal-TB ✗ ✗ EventStoryLine ✓ ✗ HiEve ✓ ✗ ✗ RED ✓ Maven-Ere ✓
Due to the widely acknowledged importance, many efforts have been devoted to developing advanced ERE methods (Liu et al., 2014; Hashimoto et al., 2014; Ning et al., 2017). Recently, data-driven neural models have become the mainstream of ERE methods (Dligach et al., 2017; Aldawsari and Finlayson, 2019; Liu et al., 2020a; Lu and Ng, 2021a). However, these data-driven methods are severely limited by two drawbacks of existing event relation datasets: (1) Small data scale. Due to the high inherent annotation complexity, the data scale of existing human-annotated datasets is limited. From the statistics shown in Table 1, we can see existing popular datasets contain only hundreds of documents and limited numbers of relations, which cannot adequately cover the diverse event semantics and is insufficient for training sophisticated neural models (Wang et al., 2020a). Moreover, event relations in these datasets are often incomprehensive. For instance, TB-Dense (Chambers et al., 2014) and MATRES (Ning et al., 2018b) only annotate event temporal relations for event pairs within adjacent sentences. (2) Absence of unified annotation. Naturally, various types of event relations have rich interactions with each other. For example, the cause events must start temporally before the effect events, and the superevents must temporally contain the subevents. The coreference relation is the foundation, and all the other relations are shared among coreferent event mentions. However, as shown in Table 1, existing datasets typically only cover limited relation types at once. RED (O’Gorman et al., 2016) is a notable exception developing comprehensive unified annotation guidelines, but can only serve as a test set (Wang et al., 2020a) due to its small scale. This results in the closely connected ERE tasks being conventionally handled independently and limits the development of joint ERE methods (Ning et al., 2018a; Wang et al., 2020a).
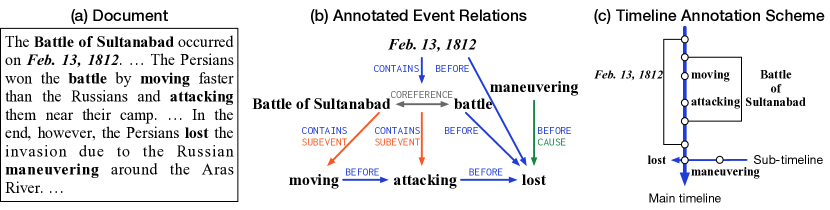
In this paper, we construct Maven-Ere, the first unified large-scale event relation dataset, based on the previous MAVEN (Wang et al., 2020b) dataset, which is a massive general-domain event detection dataset covering English Wikipedia documents and fine-grained event types. As the example in Figure 1, Maven-Ere makes up the absence of unified annotation by annotating kinds of event relations in the same documents. Maven-Ere has event coreference chains, temporal relations, causal relations, and subevent relations. To our knowledge, Maven-Ere achieves the first million-scale human-annotated ERE dataset. As shown in Table 1, in every ERE task, Maven-Ere is larger than existing datasets by at least an order of magnitude, which shall alleviate the limitation of data scale and facilitate developing ERE methods.
As shown in Figure 1, event relations are dense and complex. Hence constructing Maven-Ere requires thorough and laborious crowd-sourcing annotation. To ensure affordable time and resource costs, we further develop a new annotation methodology based on O’Gorman et al. (2016), which is the only existing annotation scheme supporting all the relation types. Specifically, we decompose the overall annotation task into multiple sequential stages, which reduces competence requirements for annotators. The overhead of later stages can also be reduced with the results of previous stages. First, we annotate coreference relations so that the later-stage annotations only need to consider one of all the coreferent event mentions. For temporal relation annotation, we develop a new timeline annotation scheme, which avoids laboriously identifying temporal relations for every event pair like previous works (Chambers et al., 2014; Ning et al., 2018b). This new scheme brings much denser annotation results. For every words, Maven-Ere has more than times the number of temporal relations as the previous most widely-used dataset MATRES (Ning et al., 2018b). For causal and subevent relation annotation, we set annotation constraints with temporal relations and the relation transitivity to reduce annotation scopes.
We develop strong baselines for Maven-Ere based on a widely-used sophisticated pre-trained language model (Liu et al., 2019). Experiments show that: (1) ERE tasks are quite challenging and achieved performances are far from promising; (2) Our large-scale data sufficiently trains the models and brings performance benefits; (3) Considering the relation interactions with straightforwardly joint training improves the performances, which encourages more explorations. We also provide some empirical analyses to inspire future works.
2 Dataset Construction
Based on the event triggers in MAVEN (Wang et al., 2020b), we annotate data for four ERE tasks: extracting event coreference, temporal, causal, and subevent relations. For each task, we introduce its definition, the annotation process, and basic statistics of Maven-Ere compared with its typical existing datasets. For the overall statistic comparisons, please refer to appendix A.
2.1 Coreference Relation
Task Description
Event coreference resolution requires identifying the event mentions referring to the same event. Event mentions are the key texts expressing the occurrences of events. For example, in Figure 1, the “Battle of Sulatnabad” and the later “battle” are two event mentions referring to the same real-world event, so they have a coreference relation. Like entity coreference resolution, event coreference resolution is important to various applications and is widely acknowledged as more challenging (Choubey and Huang, 2018).
Annotation
We follow the annotation guidelines of O’Gorman et al. (2016) and invite annotators to annotate event coreference relations. The annotators are all trained and pass a qualification test before annotation. Given the documents and highlighted event mentions, the annotators are required to group the coreferent mentions together. The outputs are event coreference chains, each linking a set of different event mentions. Each document is annotated by independent annotators, and the final results are obtained by majority voting. To improve the data quality on top of the original MAVEN and avoid annotation vagueness, we allow the annotators to report if the provided mentions do not express events, and we will delete the mentions reported by all the annotators. The B-Cubed F-1 (Bagga and Baldwin, 1998) between each pair of annotation results is on average, which shows that the annotation consistency is satisfactory.
Dataset #Doc. #Mention #Chain Event Type ACE 2005 ✓ ECB+ ✗ TAC KBP ✓ Maven-Ere ✓
Statistics
After annotation, we get event coreference chains in total. In Table 2, we compare the size of Maven-Ere with existing widely-used datasets, including ACE 2005 (Walker et al., 2006), ECB+ (Cybulska and Vossen, 2014), and TAC KBP. Following the setup of previous works (Lu and Ng, 2021a, b), the TAC KBP here includes LDC2015E29, LDC2015E68 and TAC KBP 2015 (Ellis et al., 2015), 2016 (Ellis et al., 2016) and 2017 (Getman et al., 2017). We can see that Maven-Ere has much more annotated event coreference chains, which shall benefit event coreference resolution methods.
2.2 Temporal Relation
Task Description
Temporal relation extraction aims at extracting the temporal relations between events and temporal expressions (TIMEXs). TIMEXs are the definitive references to time within texts. Considering them in temporal relation extraction helps to anchor the relative temporal orders to concrete timestamps. Hence we need to annotate TIMEXs before annotating temporal relations.
Following the ISO-TimeML standard (Pustejovsky et al., 2010), we annotate four types of TIMEX: DATE, TIME, DURATION and PREPOSTEXP, but we ignore the QUANTIFIER and SET, since they are harder for crowd-sourcing workers and less helpful for linking events to real-world timestamps. For temporal relations, we follow O’Gorman et al. (2016) and comprehensively set types of temporal relations: BEFORE, CONTAINS, OVERLAP, BEGINS-ON, ENDS-ON, SIMULTANEOUS. Except for SIMULTANEOUS and BEGINS-ON, the relation types are unidirectional, i.e., the head event must start before the tail event in a relation instance.
Annotation
In TIMEX annotation, we invite trained and qualified annotators. Each document is annotated by annotators, and the final results are obtained through majority voting. The average inter-annotator agreement is (Fleiss’ kappa).
Previous works (Styler IV et al., 2014; Chambers et al., 2014; Ning et al., 2018b) show that annotating temporal relations is very challenging since densely annotating relations for every event pair is extremely time-consuming, and the expressions of temporal relations are often vague. Hence we design a sophisticated annotation scheme inspired by the multi-axis scheme of Ning et al. (2018b) and the time-anchoring scheme of Reimers et al. (2016). As illustrated in Figure 1 (c), instead of identifying relations for every single event pair, we ask the annotators to sort the beginnings and endings of events and TIMEXs on a timeline. Thus the annotators only need to consider how to arrange the bounding points of temporally close events and TIMEXs, and the relations between the events and TIMEXs on the timeline can be automatically inferred from their relative positions. However, due to the narrative vagueness, the temporal relations between some events cannot be clearly determined from contexts, such as the “maneuvering” and “attacking” in Figure 1. As discussed by Ning et al. (2018b), this often happens when expressing opinions, intentions, and hypotheses. In these cases, we allow the annotators to create sub-timelines, and we treat events on different timelines as no temporal relations. An event may be placed on multiple timelines like the “lost” in Figure 1.
With this annotation scheme, we can get high-quality temporal relations for all the pairs at an affordable cost with no need to reduce the annotation scope like previous works (Chambers et al., 2014; Ning et al., 2018b) which only annotate events within adjacent sentences. To control data quality and resource costs, each document will be annotated by a well-trained annotator at first. Then an expert will check and revise the annotation results. We invite annotators and experts in temporal relation annotation. To measure data quality, we randomly sample documents and annotate them twice in the above pipeline. The average agreement is (Cohen’s kappa).
Statistics
We obtain TIMEXs, including DATE, DURATION, TIME, and PREPOSTEXP. Based on the events and TIMEXs, we annotate temporal relations in total, including BEFORE, CONTAINS, SIMULTANEOUS, OVERLAP, BEGINS-ON, and ENDS-ON. We can see the data unbalance among types is serious. To ensure that the created dataset well reflects the real-world data distribution, we do not intervene the label distribution and keep the unbalanced distribution in Maven-Ere. This poses a challenge for future temporal relation extraction models.
In Table 3, we compare the size of Maven-Ere with existing widely used datasets, including TimeBank 1.2 (Pustejovsky et al., 2003b), TempEval 3 (UzZaman et al., 2013), RED (O’Gorman et al., 2016), TB-Dense (Chambers et al., 2014), MATRES (Ning et al., 2018b), and TCR (Ning et al., 2018a). Maven-Ere is orders of magnitude larger than existing datasets and is the first million-scale temporal relation extraction dataset to our knowledge. Our timeline annotation scheme also brings denser annotation results. For every words, Maven-Ere has temporal relations, while MATRES has . We believe a leap in data size could significantly facilitate temporal relation extraction research and promote broad temporal reasoning applications.
Dataset #Doc. #Mention #TIMEX #T-Link TimeBank 1.2 TempEval-3∗ RED TB-Dense MATRES TCR Maven-Ere
2.3 Causal Relation
Task Description
Understanding causality is a long-standing goal of artificial intelligence. Causal relation extraction, which aims at extracting the causal relations between events, is an important task to evaluate it. To enable crowd-sourcing annotation, we do not adopt the complicated causation definitions (Dunietz et al., 2017) but instead annotate two types of straightforward and clear causal relation types: CAUSE and PRECONDITION following previous discussions (Ikuta et al., 2014; O’Gorman et al., 2016). CAUSE is defined as “the tail event is inevitable given the head event”, and PRECONDITION is defined as “the tail event would not have happened if the head event had not happened” (Ikuta et al., 2014). Note that we allow to annotate causal relations for negative events, which are the events that did not actually happen. In this way, we also cover the negative causation discussed in previous literatures (Mirza et al., 2014).
Annotation
Considering the temporal nature of causality, we limit the annotation scope to event pairs with BEFORE and OVERLAP relations labeled in temporal annotation. To further reduce annotation overhead, we ask the annotators to consider the transitivity of causal relations and make minimal annotations. That is if “A CAUSE/PRECONDITION B” and “B CAUSE/PRECONDITION C” have been annotated, the causal relation between A and C can be discarded. Furthermore, we annotate causal relations and subevent relations in the same stage so that we can involve subevent relations in the transitivity rules. This means that you can discard the causal relations between A and C if you have (1) “A CAUSES/PRECONDITIONS B and C SUBEVENT B” or (2) “A SUBEVENT B and B PRECONDITION C”. The discarded relations are then automatically completed after human annotation. We invite trained and qualified annotators, and each document is annotated by independent annotators. The final results are obtained through majority voting. The average inter-annotator agreement for causal relations is (Cohen’s kappa).
Dataset #Doc. #Mention #C-Link BECauSE 2.0 CaTeRS RED Causal-TB EventStoryLine Maven-Ere
Statistics
We obtain causal relations, including CUASE and PRECONDITION. Table 4 shows the size of Maven-Ere and existing widely-used datasets, including BECauSE 2.0 (Dunietz et al., 2017), CaTeRS (Mostafazadeh et al., 2016), RED (O’Gorman et al., 2016), Causal-TB (Mirza et al., 2014), and EventStoryLine (Caselli and Vossen, 2017). Maven-Ere is still much larger than all the existing datasets.
2.4 Subevent Relation
Task Description
Subevent relation extraction requires identifying whether event A is a subevent of event B. “A SUBEVENT B” means that A is a component part of B and spatiotemporally contained by B (Hovy et al., 2013; Glavaš et al., 2014; O’Gorman et al., 2016). Subevent relations organize the unconnected events into hierarchical structures, which support the event understanding applications (Aldawsari and Finlayson, 2019).
Annotation
We limit the annotation scope to event pairs with CONTAINS relations considering the inherent temporal containment property in subevent definition. This significantly reduces annotation overhead. The subevent relation annotation is conducted together with causal relations, and we invite the same annotators. Each document is annotated by annotators, and the final results are obtained with majority voting. The average inter-annotator agreement is (Cohen’s kappa).
Dataset #Doc. #Mention #Subevent Relation Intelligence Community HiEve RED Maven-Ere
Statistics
We get subevent relations after annotation. Table 5 shows the size comparisons of Maven-Ere and existing datasets, including the Intelligence Community (Hovy et al., 2013), HiEve (Glavaš et al., 2014) and RED (O’Gorman et al., 2016). We can see that Maven-Ere is also significantly larger than existing datasets.
3 Data Analysis
3.1 Distance between Related Events
Dataset (%) (%) (%) Avg. Coreference ACE 2005 KBP Maven-Ere Temporal TB-Dense MATRES TCR Maven-Ere Causal Causal-TB EventStoryLine Maven-Ere Subevent HiEve Maven-Ere
Understanding the relations between long-distance event pairs helps to understand documents in the discourse-level (Naik et al., 2019), and modeling long-range dependencies is a long-standing challenge for NLP models. Hence we analyze the distance distributions of the annotated event relations in Maven-Ere and compare them with existing most widely-used datasets in Table 6.
For temporal relations, since the mainstream annotation scheme requires identifying relations for every event pair, existing most widely-used and high-quality datasets like TB-Dense and MATRES limit the annotation scope to the events in the same or adjacent sentences and ignore long-distance temporal relations, which are also informative (Reimers et al., 2016; Naik et al., 2019). This also limits the causal relation datasets based on them like Causal-TB. As shown in Table 6, with the help of our timeline annotation scheme, Maven-Ere has much more long-distance temporal and causal relations compared to existing datasets, which can better support real-world applications and poses new challenges for ERE models.
For coreference relations, Maven-Ere has shorter average distances and much higher short-distance rates. This is because MAVEN (Wang et al., 2020b) covers much more generic events and annotates much denser event mentions. For comparison, Maven-Ere has event mentions per words, while this number is and for ACE 2005 and TAC KBP, respectively. For subevent relations, the distributions of HiEve and Maven-Ere are similar, and we think HiEve has a longer average distance because of its longer average document length ( vs. words).
3.2 Relation Transitivity
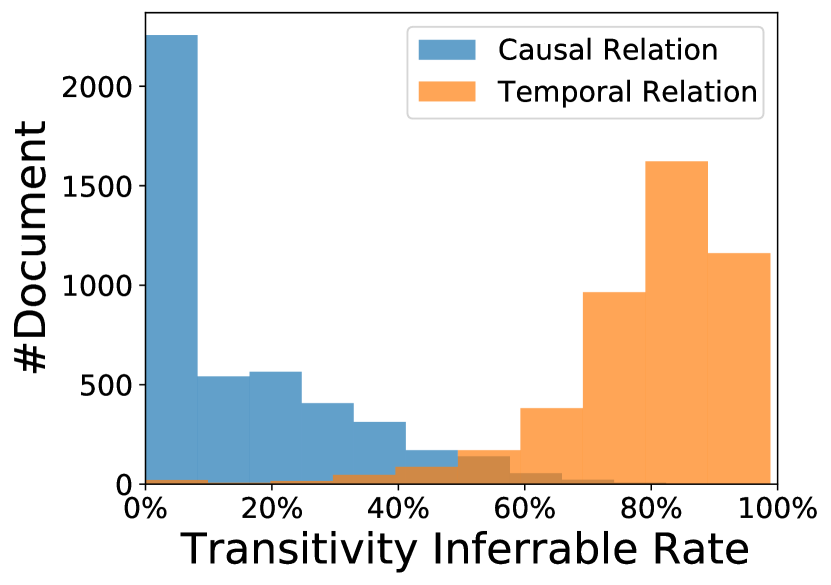
Temporal and causal relations follow a certain transitivity rules (Allen, 1983; Gerevini and Schubert, 1995), e.g., if there exists “A BEFORE B” and “B BEFORE C”, “A BEFORE C” also holds. Previous ERE methods often use these natural transitivity rules as constraints in post-processing (Chambers and Jurafsky, 2008; Denis and Muller, 2011; Ning et al., 2018a) and training (Wang et al., 2020a). Here we estimate the importance of considering transitivity in handling Maven-Ere by counting how many relations can be inferred from other relations with transitivity rules. The detailed transitivity rules that we consider are shown in appendix B.
Overall, temporal relations and causal relations are inferrable with transitivity rules. We further plot the distribution of documents containing different rates of transitivity inferrable relations in Figure 2. We can see that more than temporal relations can be inferred with transitivity rules for most of the documents. The transitivity inferrable causal relations, although significantly less, also take up a substantial proportion. These results suggest that considering the relation transitivity is helpful for handling Maven-Ere, and we encourage future works to explore it.
4 Experiments and Analyses
To demonstrate the challenges of Maven-Ere and analyze the potential future directions for ERE, we conduct a series of experiments.
4.1 Experiment Setup
Model
Considering that pre-trained language models (PLMs) have dominated broad NLP tasks, we adopt a widely-used PLM RoBERTa (Liu et al., 2019) as the backbone and build classification models on top of it, which provides simple but strong baselines for the ERE tasks. To extract the event relations in a document, we encode the whole document with RoBERTa and set an additional classification head taking the contextualized representations at the positions of different event pairs’ corresponding event triggers as inputs. Then we fine-tune the model to classify relation labels. Besides training the tasks independently, we also set a straightforward jointly training model combining the losses of the tasks, which is to demonstrate the benefits of our unified annotation. The implementation details are shown in appendix C.
MUC B3 CEAFe BLANC Precision Recall F-1 Precision Recall F-1 Precision Recall F-1 Precision Recall F-1 ACE 2005 TAC KBP Maven-Ere +joint
Precision Recall F-1 Temporal TB-Dense MATRES TCR Maven-Ere +joint Causal Causal-TB EventStoryLine Maven-Ere +joint Subevent HiEve Maven-Ere +joint
Benchmarks
To assess the challenges of Maven-Ere, we also include existing most widely-used datasets of the ERE tasks into evaluations, including ACE 2005, TAC KBP, TB-Dense, MATRES, TCR, Causal-TB, EventStoryLine, and HiEve. Following previous works (Ning et al., 2018a), TCR is used only as an additional test set for models developed on MATRES. Due to the small data scale of Causal-TB and EventStoryLine, previous works (Gao et al., 2019; Cao et al., 2021) typically adopt -fold cross-validation on them and only do causality identification, which ignores the directions of causal relations. In our evaluation on the two datasets, we also do cross-validation but consider the relation directions in accordance with Maven-Ere. Similarly, we do not down-sample the negative instances for HiEve like previous works (Zhou et al., 2020; Wang et al., 2021). For the other datasets, we follow previous benchmark settings and show detailed data split statistics in appendix D.
Metrics
Following previous works (Choubey and Huang, 2017; Lu et al., 2022), we adopt MUC (Vilain et al., 1995), B3 (Bagga and Baldwin, 1998), CEAFe (Luo, 2005) and BLANC (Recasens and Hovy, 2011) metrics for event coreference resolution. For the other tasks, we adopt the standard micro-averaged precision, recall and F-1 metrics.
4.2 Experimental Result
Experimental results for coreference relations are shown in Table 7 and for the other ERE tasks are shown in Table 8. We can observe that: (1) For extracting coreference, causal and subevent relations, the model’s performances on Maven-Ere are much higher than on previous datasets, indicating the benefits of our larger data scale. (2) For temporal relations, the performances on MATRES and TCR are significantly higher than that on Maven-Ere. This is because they only cover relation types and annotate local event pairs within adjacent sentences, which results in easier data and inflated model performances. With the timeline annotation scheme, Maven-Ere annotates -type global temporal relations within documents, and the lower performance better reflects the inherent challenge of temporal understanding. The performance on TB-Dense is much lower, but we think this comes from TB-Dense’s small data scale ( documents), which cannot well train the model. (3) Except for coreference, the achieved performances for the other ERE tasks are far from practically usable. This demonstrates that understanding the diverse and complex event relations is a huge challenge for NLP models and needs more research efforts. (4) Straightforwardly joint training on the tasks can bring certain improvements, especially on the tasks with fewer data, i.e., causal and subevent ERE. It indicates that considering the rich interactions between event relations is promising for handling the complex ERE tasks.
4.3 Analysis on Data Scale
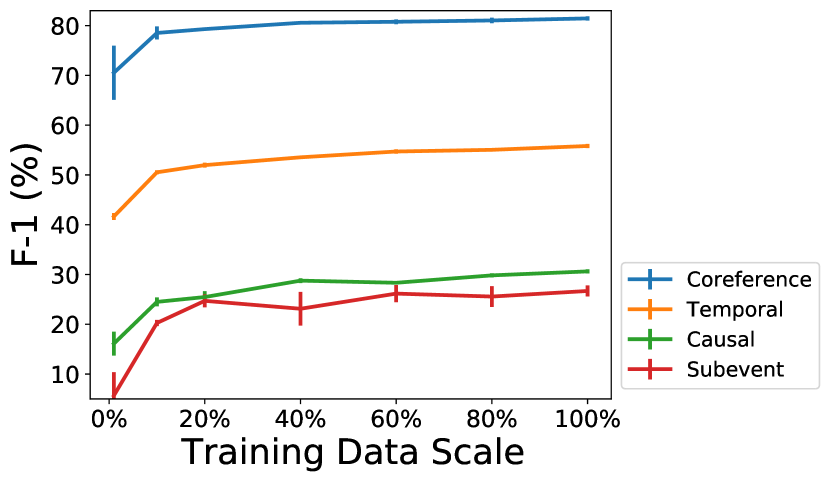
Compared with existing datasets, Maven-Ere significantly increases the data scale of all the ERE tasks. To assess the benefits brought by larger data scale and evaluate whether Maven-Ere provides enough training data, we conduct an ablation study on the training data scale.
Figure 3 shows how RoBERTa’s test performance changes along with different proportions of data used in training. We can see that increasing training data scale brings substantially higher and stabler performances, which shows the benefits of Maven-Ere’s large scale. The performance improvements are quite marginal at the scale of Maven-Ere. It indicates that Maven-Ere is generally sufficient to train ERE models.
4.4 Analysis on Distance between Events
Like § 3.1, we analyze how the distances between related events influence model performances. We sample a jointly-trained model and see how it performs on data with different distances in Table 9. Since the evaluation of event coreference resolution is based on clusters, which cannot be divided by distances, we only study the other tasks here.
For causal and subevent relations, performances on data with longer distances are lower, which intuitively suggests that modeling long-range dependency is still important to ERE, although the PLMs are effective. However, for temporal relations, data with longer distances are easier. We think this is because event pairs with longer narrative distances are typically also with longer temporal distances, which makes their relations easier to classify.
4.5 Error Analysis
Temporal Causal Subevent
We further analyze the errors in the predictions of a jointly trained model to provide insights for further improvements. Considering the event coreference resolution task has reached a high performance and its different cluster-based evaluation, we only analyze the other tasks. The results are shown in Table 10. We can see that identification mistakes (false positive and false negative) make up the majority of all the mistakes. It indicates that the most important challenge for ERE is still identifying whether there is a relation or not. Furthermore, like § 3.2, we analyze how many mistakes can be fixed by applying transitivity rules to other predictions. These transitivity fixable mistakes only account for small proportions, which suggests that sophisticated models have imperfectly but substantially learned the transitivity rules from massive data.
5 Related Work
Since the fundamental role of understanding event relations in NLP, various ERE datasets have been constructed. Event coreference relations are often covered in event extraction datasets like MUC (Grishman and Sundheim, 1996), ACE (Walker et al., 2006) and TAC KBP (Ellis et al., 2015, 2016; Getman et al., 2017). Besides, some datasets focus on unrestricted coreference resolution and ignore event semantic types, like OntoNotes (Pradhan et al., 2007) and ECB datasets (Bejan and Harabagiu, 2008; Lee et al., 2012; Cybulska and Vossen, 2014). Following the TimeML specification (Pustejovsky et al., 2003a, 2010), established temporal relation datasets like TimeBank (Pustejovsky et al., 2003b) and TempEval (Verhagen et al., 2009, 2010; UzZaman et al., 2013) have been constructed. However, these works exhibit low annotation agreements and efficiency issues. Ning et al. (2018b) develop a multi-axis annotation annotation scheme based on the dense scheme of Chambers et al. (2014) to alleviate them, and Reimers et al. (2016) propose to anchor the event starting and ending points to specific time. Our timeline annotation scheme is inspired by them. Based on the temporal understanding, causal relation datasets (Do et al., 2011; Mirza et al., 2014; Mostafazadeh et al., 2016; Dunietz et al., 2017; Caselli and Vossen, 2017; Tan et al., 2022) are developed. To organize events into hierarchies, subevent relation datasets (Hovy et al., 2013; Glavaš et al., 2014) are collected.
FP FN Transitivity Fixable Temporal Causal Subevent
However, the scale of these datasets is limited, and different types of relations are rarely integrated into one dataset. Some datasets (Hovy et al., 2013; Mirza et al., 2014; Glavaš et al., 2014; Caselli and Vossen, 2017; Minard et al., 2016; Ning et al., 2018a) annotate two or three kinds of relations. O’Gorman et al. (2016) and Hong et al. (2016) provide unified annotation schemes for within-document and cross-document event relations, respectively, but their constructed datasets are also small. We construct Maven-Ere referring to the guidelines of O’Gorman et al. (2016).
6 Conclusion and Future Work
We present Maven-Ere, a unified large-scale dataset for event coreference, temporal, causal, and subevent relations, which significantly alleviates the small scale and absence of unified annotation issues of previous datasets. Experiments show that real-world event relation extraction is quite challenging and may be improved by jointly considering multiple relation types and better modeling long-range dependency. In the future, we will extend the dataset to more scenarios like covering more event-related information and languages.
Limitations
The most important limitation of Maven-Ere is that it only covers English documents, which is inherited from the original MAVEN (Wang et al., 2020b) dataset. This limits the linguistic features covered by Maven-Ere and the scope of applications built on it. We encourage future works to explore (1) develop models for the low-resource languages by applying multilingual transfer learning techniques to Maven-Ere; (2) annotate native datasets for the low-resource languages with the annotation schemes of Maven-Ere. Another limitation is that Maven-Ere only covers the within-document event relations. Future works may extend Maven-Ere to cross-document event relations with the help of existing explorations (Cybulska and Vossen, 2014; Hong et al., 2016).
Ethical Considerations
This paper presents a new dataset, and we discuss some related ethical considerations here. (1) Intellectual property. The original MAVEN dataset is shared under the CC BY-SA 4.0 license111https://creativecommons.org/licenses/by-sa/4.0 and the Wikipedia corpus is shared under the CC BY-SA 3.0 license222https://creativecommons.org/licenses/by-sa/3.0. They are both free for research use, and we develop Maven-Ere with the consent of the authors of MAVEN. (2) Worker Treatments. We hire the annotators from multiple professional data annotation companies and fairly pay them with agreed salaries and workloads. All employment is under contract and in compliance with local regulations. (3) Controlling Potential Risks. Since the texts in Maven-Ere do not involve private information and annotating event relations does not require many judgments about social issues, we believe Maven-Ere does not create additional risks. To ensure it, we manually checked some randomly sampled data and did not note risky issues.
Acknowledgements
This work is supported by the New Generation Artificial Intelligence of China (2020AAA0106501), the Institute for Guo Qiang, Tsinghua University (2019GQB0003), the Pattern Recognition Center, WeChat AI, Tencent Inc, and the Tsinghua University - Siemens Ltd., China Joint Research Center for Industrial Intelligence and Internet of Things. We thank all the annotators for their efforts and the anonymous reviewers for their valuable comments.
References
- Aldawsari and Finlayson (2019) Mohammed Aldawsari and Mark Finlayson. 2019. Detecting subevents using discourse and narrative features. In Proceedings of ACL, pages 4780–4790.
- Allen (1983) James F. Allen. 1983. Maintaining knowledge about temporal intervals. Commun. ACM, 26(11):832–843.
- Bagga and Baldwin (1998) Amit Bagga and Breck Baldwin. 1998. Entity-Based Cross-Document Coreferencing Using the Vector Space Model. In Proceedings of ACL-COLING, pages 79–85.
- Bejan and Harabagiu (2008) Cosmin Bejan and Sanda Harabagiu. 2008. A linguistic resource for discovering event structures and resolving event coreference. In Proceedings of LREC.
- Cao et al. (2021) Pengfei Cao, Xinyu Zuo, Yubo Chen, Kang Liu, Jun Zhao, Yuguang Chen, and Weihua Peng. 2021. Knowledge-enriched event causality identification via latent structure induction networks. In Proceedings of ACL-IJCNLP, pages 4862–4872.
- Caselli and Vossen (2017) Tommaso Caselli and Piek Vossen. 2017. The event StoryLine corpus: A new benchmark for causal and temporal relation extraction. In Proceedings of the Events and Stories in the News Workshop, pages 77–86.
- Chambers (2013) Nathanael Chambers. 2013. Event Schema Induction with a Probabilistic Entity-Driven Model. In Proceedings of EMNLP, pages 1797–1807.
- Chambers et al. (2014) Nathanael Chambers, Taylor Cassidy, Bill McDowell, and Steven Bethard. 2014. Dense event ordering with a multi-pass architecture. Transactions of the Association for Computational Linguistics, 2:273–284.
- Chambers and Jurafsky (2008) Nathanael Chambers and Daniel Jurafsky. 2008. Jointly combining implicit constraints improves temporal ordering. In Proceedings of EMNLP, pages 698–706.
- Chaturvedi et al. (2017) Snigdha Chaturvedi, Haoruo Peng, and Dan Roth. 2017. Story comprehension for predicting what happens next. In Proceedings of EMNLP, pages 1603–1614.
- Choubey and Huang (2017) Prafulla Kumar Choubey and Ruihong Huang. 2017. Event coreference resolution by iteratively unfolding inter-dependencies among events. In Proceedings of EMNLP, pages 2124–2133.
- Choubey and Huang (2018) Prafulla Kumar Choubey and Ruihong Huang. 2018. Improving event coreference resolution by modeling correlations between event coreference chains and document topic structures. In Proceedings of ACL, pages 485–495.
- Cybulska and Vossen (2014) Agata Cybulska and Piek Vossen. 2014. Using a sledgehammer to crack a nut? lexical diversity and event coreference resolution. In Proceedings of LREC, pages 4545–4552.
- Denis and Muller (2011) Pascal Denis and Philippe Muller. 2011. Predicting globally-coherent temporal structures from texts via endpoint inference and graph decomposition. In Proceedings of IJCAI, page 1788–1793.
- Dligach et al. (2017) Dmitriy Dligach, Timothy Miller, Chen Lin, Steven Bethard, and Guergana Savova. 2017. Neural temporal relation extraction. In Proceedings of EACL, pages 746–751.
- Do et al. (2011) Quang Do, Yee Seng Chan, and Dan Roth. 2011. Minimally supervised event causality identification. In Proceedings of EMNLP, pages 294–303.
- Dunietz et al. (2017) Jesse Dunietz, Lori Levin, and Jaime Carbonell. 2017. The BECauSE corpus 2.0: Annotating causality and overlapping relations. In Proceedings of the 11th Linguistic Annotation Workshop, pages 95–104.
- Ellis et al. (2015) Joe Ellis, Jeremy Getman, Dana Fore, Neil Kuster, Zhiyi Song, Ann Bies, and Stephanie M Strassel. 2015. Overview of linguistic resources for the TAC KBP 2015 evaluations: Methodologies and results. In TAC.
- Ellis et al. (2016) Joe Ellis, Jeremy Getman, Dana Fore, Neil Kuster, Zhiyi Song, Ann Bies, and Stephanie M Strassel. 2016. Overview of Linguistic Resources for the TAC KBP 2016 Evaluations: Methodologies and Results. In TAC.
- Gao et al. (2019) Lei Gao, Prafulla Kumar Choubey, and Ruihong Huang. 2019. Modeling document-level causal structures for event causal relation identification. In Proceedings of NAACL-HLT, pages 1808–1817.
- Gerevini and Schubert (1995) Alfonso Gerevini and Lenhart Schubert. 1995. Efficient algorithms for qualitative reasoning about time. Artificial Intelligence, 74(2):207–248.
- Getman et al. (2017) Jeremy Getman, Joe Ellis, Zhiyi Song, Jennifer Tracey, and Stephanie Strassel. 2017. Overview of linguistic resources for the tac kbp 2017 evaluations: Methodologies and results. In TAC.
- Glavaš et al. (2014) Goran Glavaš, Jan Šnajder, Marie-Francine Moens, and Parisa Kordjamshidi. 2014. HiEve: A corpus for extracting event hierarchies from news stories. In Proceedings of LREC, pages 3678–3683.
- Grishman and Sundheim (1996) Ralph Grishman and Beth Sundheim. 1996. Message understanding conference- 6: A brief history. In Proceedings of COLING.
- Hashimoto et al. (2014) Chikara Hashimoto, Kentaro Torisawa, Julien Kloetzer, Motoki Sano, István Varga, Jong-Hoon Oh, and Yutaka Kidawara. 2014. Toward future scenario generation: Extracting event causality exploiting semantic relation, context, and association features. In Proceedings of ACL, pages 987–997.
- Hong et al. (2016) Yu Hong, Tongtao Zhang, Tim O’Gorman, Sharone Horowit-Hendler, Heng Ji, and Martha Palmer. 2016. Building a cross-document event-event relation corpus. In Proceedings of the 10th Linguistic Annotation Workshop held in conjunction with ACL 2016 (LAW-X 2016), pages 1–6.
- Hovy et al. (2013) Eduard Hovy, Teruko Mitamura, Felisa Verdejo, Jun Araki, and Andrew Philpot. 2013. Events are not simple: Identity, non-identity, and quasi-identity. In Proceedings of Workshop on Events: Definition, Detection, Coreference, and Representation, pages 21–28.
- Ikuta et al. (2014) Rei Ikuta, Will Styler, Mariah Hamang, Tim O’Gorman, and Martha Palmer. 2014. Challenges of adding causation to richer event descriptions. In Proceedings of the Second Workshop on EVENTS: Definition, Detection, Coreference, and Representation, pages 12–20.
- Joshi et al. (2019) Mandar Joshi, Omer Levy, Luke Zettlemoyer, and Daniel Weld. 2019. BERT for coreference resolution: Baselines and analysis. In Proceedings of EMNLP-IJCNLP, pages 5803–5808.
- Khashabi et al. (2018) Daniel Khashabi, Tushar Khot, Ashish Sabharwal, and Dan Roth. 2018. Question answering as global reasoning over semantic abstractions. In Proceedings of AAAI.
- Kingma and Ba (2014) Diederik Kingma and Jimmy Ba. 2014. Adam: A method for stochastic optimization. In Proceedings of ICLR.
- Lee et al. (2012) Heeyoung Lee, Marta Recasens, Angel Chang, Mihai Surdeanu, and Dan Jurafsky. 2012. Joint entity and event coreference resolution across documents. In Proceedings of EMNLP-CoNLL, pages 489–500.
- Levelt (1993) Willem JM Levelt. 1993. Speaking: From intention to articulation. MIT press.
- Liu et al. (2020a) Jian Liu, Yubo Chen, and Jun Zhao. 2020a. Knowledge enhanced event causality identification with mention masking generalizations. In Proceedings of IJCAI, pages 3608–3614.
- Liu et al. (2020b) Kang Liu, Yubo Chen, Jian Liu, Xinyu Zuo, and Jun Zhao. 2020b. Extracting events and their relations from texts: A survey on recent research progress and challenges. AI Open, 1:22–39.
- Liu et al. (2019) Yinhan Liu, Myle Ott, Naman Goyal, Jingfei Du, Mandar Joshi, Danqi Chen, Omer Levy, Mike Lewis, Luke Zettlemoyer, and Veselin Stoyanov. 2019. RoBERTa: A Robustly Optimized BERT Pretraining Approach. CoRR, abs/1907.11692.
- Liu et al. (2014) Zhengzhong Liu, Jun Araki, Eduard Hovy, and Teruko Mitamura. 2014. Supervised within-document event coreference using information propagation. In Proceedings of LREC, pages 4539–4544.
- Lu and Ng (2021a) Jing Lu and Vincent Ng. 2021a. Constrained multi-task learning for event coreference resolution. In Proceedings of NAACL-HLT, pages 4504–4514.
- Lu and Ng (2021b) Jing Lu and Vincent Ng. 2021b. Conundrums in event coreference resolution: Making sense of the state of the art. In Proceedings of EMNLP, pages 1368–1380.
- Lu et al. (2022) Yaojie Lu, Hongyu Lin, Jialong Tang, Xianpei Han, and Le Sun. 2022. End-to-end neural event coreference resolution. Artificial Intelligence, 303:103632.
- Luo (2005) Xiaoqiang Luo. 2005. On coreference resolution performance metrics. In Proceedings of EMNLP-HLT, pages 25–32.
- Miller and Johnson-Laird (2013) George A Miller and Philip N Johnson-Laird. 2013. Language and perception. In Language and Perception. Harvard University Press.
- Minard et al. (2016) Anne-Lyse Minard, Manuela Speranza, Ruben Urizar, Begoña Altuna, Marieke van Erp, Anneleen Schoen, and Chantal van Son. 2016. MEANTIME, the NewsReader multilingual event and time corpus. In Proceedings of LREC, pages 4417–4422.
- Mirza et al. (2014) Paramita Mirza, Rachele Sprugnoli, Sara Tonelli, and Manuela Speranza. 2014. Annotating causality in the TempEval-3 corpus. In Proceedings of the EACL 2014 Workshop on Computational Approaches to Causality in Language (CAtoCL), pages 10–19.
- Mostafazadeh et al. (2016) Nasrin Mostafazadeh, Alyson Grealish, Nathanael Chambers, James Allen, and Lucy Vanderwende. 2016. CaTeRS: Causal and temporal relation scheme for semantic annotation of event structures. In Proceedings of the Fourth Workshop on Events, pages 51–61.
- Naik et al. (2019) Aakanksha Naik, Luke Breitfeller, and Carolyn Rose. 2019. TDDiscourse: A dataset for discourse-level temporal ordering of events. In Proceedings of the 20th Annual SIGdial Meeting on Discourse and Dialogue, pages 239–249.
- Ning et al. (2017) Qiang Ning, Zhili Feng, and Dan Roth. 2017. A structured learning approach to temporal relation extraction. In Proceedings of EMNLP, pages 1027–1037.
- Ning et al. (2018a) Qiang Ning, Zhili Feng, Hao Wu, and Dan Roth. 2018a. Joint reasoning for temporal and causal relations. In Proceedings of ACL, pages 2278–2288.
- Ning et al. (2019) Qiang Ning, Sanjay Subramanian, and Dan Roth. 2019. An improved neural baseline for temporal relation extraction. In Proceedings of EMNLP-IJCNLP, pages 6203–6209.
- Ning et al. (2018b) Qiang Ning, Hao Wu, and Dan Roth. 2018b. A multi-axis annotation scheme for event temporal relations. In Proceedings of ACL, pages 1318–1328.
- O’Gorman et al. (2016) Tim O’Gorman, Kristin Wright-Bettner, and Martha Palmer. 2016. Richer event description: Integrating event coreference with temporal, causal and bridging annotation. In Proceedings of CNS, pages 47–56.
- Pinker (2013) Steven Pinker. 2013. Learnability and Cognition, new edition: The Acquisition of Argument Structure. MIT press.
- Pradhan et al. (2007) Sameer S. Pradhan, Lance Ramshaw, Ralph Weischedel, Jessica MacBride, and Linnea Micciulla. 2007. Unrestricted coreference: Identifying entities and events in ontonotes. In Proceedings of ICSC, pages 446–453.
- Pustejovsky et al. (2003a) James Pustejovsky, José M Castano, Robert Ingria, Roser Sauri, Robert J Gaizauskas, Andrea Setzer, Graham Katz, and Dragomir R Radev. 2003a. Timeml: Robust specification of event and temporal expressions in text. New directions in question answering, 3:28–34.
- Pustejovsky et al. (2003b) James Pustejovsky, Patrick Hanks, Roser Saurí, Andrew See, Rob Gaizauskas, Andrea Setzer, Dragomir Radev, Beth Sundheim, David Day, Lisa Ferro, and Marcia Lazo. 2003b. The TimeBank corpus. Proceedings of Corpus Linguistics.
- Pustejovsky et al. (2010) James Pustejovsky, Kiyong Lee, Harry Bunt, and Laurent Romary. 2010. ISO-TimeML: An international standard for semantic annotation. In Proceedings of LREC.
- Rashkin et al. (2018) Hannah Rashkin, Maarten Sap, Emily Allaway, Noah A. Smith, and Yejin Choi. 2018. Event2Mind: Commonsense inference on events, intents, and reactions. In Proceedings of ACL, pages 463–473.
- Recasens and Hovy (2011) M. Recasens and E. Hovy. 2011. Blanc: Implementing the rand index for coreference evaluation. Nat. Lang. Eng., 17(4):485–510.
- Reimers et al. (2016) Nils Reimers, Nazanin Dehghani, and Iryna Gurevych. 2016. Temporal anchoring of events for the TimeBank corpus. In Proceedings of ACL, pages 2195–2204.
- Sap et al. (2019) Maarten Sap, Ronan Le Bras, Emily Allaway, Chandra Bhagavatula, Nicholas Lourie, Hannah Rashkin, Brendan Roof, Noah A. Smith, and Yejin Choi. 2019. ATOMIC: an atlas of machine commonsense for if-then reasoning. In Proceedings of AAAI, pages 3027–3035.
- Styler IV et al. (2014) William F. Styler IV, Steven Bethard, Sean Finan, Martha Palmer, Sameer Pradhan, Piet C de Groen, Brad Erickson, Timothy Miller, Chen Lin, Guergana Savova, and James Pustejovsky. 2014. Temporal annotation in the clinical domain. Transactions of the Association for Computational Linguistics, 2:143–154.
- Tan et al. (2022) Fiona Anting Tan, Ali Hürriyetoğlu, Tommaso Caselli, Nelleke Oostdijk, Tadashi Nomoto, Hansi Hettiarachchi, Iqra Ameer, Onur Uca, Farhana Ferdousi Liza, and Tiancheng Hu. 2022. The causal news corpus: Annotating causal relations in event sentences from news. In Proceedings of LREC, pages 2298–2310.
- Tan et al. (2021) Xingwei Tan, Gabriele Pergola, and Yulan He. 2021. Extracting event temporal relations via hyperbolic geometry. In Proceedings of EMNLP, pages 8065–8077.
- UzZaman et al. (2013) Naushad UzZaman, Hector Llorens, Leon Derczynski, James Allen, Marc Verhagen, and James Pustejovsky. 2013. SemEval-2013 task 1: TempEval-3: Evaluating time expressions, events, and temporal relations. In Proceedings of SemEval, pages 1–9.
- Verhagen et al. (2009) Marc Verhagen, Robert Gaizauskas, Frank Schilder, Mark Hepple, Jessica Moszkowicz, and James Pustejovsky. 2009. The tempeval challenge: identifying temporal relations in text. Language Resources and Evaluation, 43(2):161–179.
- Verhagen et al. (2010) Marc Verhagen, Roser Saurí, Tommaso Caselli, and James Pustejovsky. 2010. SemEval-2010 task 13: TempEval-2. In Proceedings of SemEval, pages 57–62.
- Vilain et al. (1995) Marc Vilain, John Burger, John Aberdeen, Dennis Connolly, and Lynette Hirschman. 1995. A model-theoretic coreference scoring scheme. In Proceedings of MUC.
- Walker et al. (2006) Christopher Walker, Stephanie Strassel, Julie Medero, and Kazuaki Maeda. 2006. ACE 2005 multilingual training corpus. Linguistic Data Consortium, 57.
- Wang et al. (2020a) Haoyu Wang, Muhao Chen, Hongming Zhang, and Dan Roth. 2020a. Joint constrained learning for event-event relation extraction. In Proceedings of EMNLP, pages 696–706.
- Wang et al. (2021) Haoyu Wang, Hongming Zhang, Muhao Chen, and Dan Roth. 2021. Learning constraints and descriptive segmentation for subevent detection. In Proceedings of EMNLP, pages 5216–5226.
- Wang et al. (2020b) Xiaozhi Wang, Ziqi Wang, Xu Han, Wangyi Jiang, Rong Han, Zhiyuan Liu, Juanzi Li, Peng Li, Yankai Lin, and Jie Zhou. 2020b. MAVEN: A Massive General Domain Event Detection Dataset. In Proceedings of EMNLP, pages 1652–1671.
- Wolf et al. (2020) Thomas Wolf, Lysandre Debut, Victor Sanh, Julien Chaumond, Clement Delangue, Anthony Moi, Pierric Cistac, Tim Rault, Rémi Louf, Morgan Funtowicz, Joe Davison, Sam Shleifer, Patrick von Platen, Clara Ma, Yacine Jernite, Julien Plu, Canwen Xu, Teven Le Scao, Sylvain Gugger, Mariama Drame, Quentin Lhoest, and Alexander M. Rush. 2020. Transformers: State-of-the-art natural language processing. In Proceedings of EMNLP: System Demonstrations, pages 38–45.
- Zhang et al. (2020) Hongming Zhang, Daniel Khashabi, Yangqiu Song, and Dan Roth. 2020. Transomcs: From linguistic graphs to commonsense knowledge. In Proceedings of IJCAI, pages 4004–4010.
- Zhou et al. (2020) Ben Zhou, Qiang Ning, Daniel Khashabi, and Dan Roth. 2020. Temporal common sense acquisition with minimal supervision. In Proceedings of ACL, pages 7579–7589.
Appendix
Appendix A Dataset Statistics Comparison
We show the detailed statistics of Maven-Ere and other existing widely-used datasets in Table 12. For the TAC KBP data, we follow the setup of Lu and Ng (2021b), which includes TAC KBP 2015 (Ellis et al., 2015), 2016 (Ellis et al., 2016), 2017 (Getman et al., 2017) as well as LDC2015E29 and LDC2015E68. For the multilingual datasets, we only report their statistics of the English parts in accordance with Maven-Ere.
Appendix B Transitivity Rules
Table 11 shows the transitivity rules of temporal and causal relations that we consider in § 3.2. “Relation_1 + Relation_2 = Relation_3” means if there exists “A Relation_1 B” and “B Relation_2 C”, “A Relation_3 C” also holds.
Temporal Transitivity Rules BEFORE + BEFORE = BEFORE BEFORE + CONTAINS = BEFORE BEFORE + SIMULTANEOUS = BEFORE BEFORE + OVERLAP = BEFORE BEFORE + BEGINS-ON = BEFORE BEFORE + ENDS-ON = BEFORE CONTAINS + CONTAINS = CONTAINS CONTAINS + SIMULTANEOUS = CONTAINS SIMULTANEOUS + SIMULTANEOUS = SIMULTANEOUS SIMULTANEOUS + BEFORE = BEFORE SIMULTANEOUS + CONTAINS = CONTAINS SIMULTANEOUS + OVERLAP = OVERLAP SIMULTANEOUS + BEGINS-ON = BEGINS-ON SIMULTANEOUS + ENDS-ON = ENDS-ON OVERLAP + BEFORE = BEFORE OVERLAP + SIMULTANEOUS = OVERLAP BEGINS-ON + BEGINS-ON = BEGINS-ON BEGINS-ON + SIMULTANEOUS = BEGINS-ON ENDS-ON + CONTAINS = BEFORE ENDS-ON + SIMULTANEOUS = ENDS-ON ENDS-ON + BEGINS-ON = ENDS-ON Causal Transitivity Rules CAUSE + CAUSE = CAUSE CAUSE + PRECONDITION = PRECONDITION PRECONDITION + PRECONDITION = PRECONDITION
Appendix C Implementation Details
We implement the RoBERTa model using the Huggingface’s Transformers library (Wolf et al., 2020). RoBERTa contains M parameters, and we add a two-layer perceptron with hidden dimensions and dropout rate as the classification head. We use the standard cross-entropy loss for event temporal, causal, and subevent relation extraction tasks. For event coreference resolution, we follow the design of Joshi et al. (2019). We use the Adam (Kingma and Ba, 2014) optimizer to train the models and set warmup steps. For independently trained models, we set the learning rates as and for the classification head and the RoBERTa encoder. For jointly trained models, the learning rates are and for the classification head and the encoder, respectively. We set the factors as , , , and for the losses of coreference, temporal, causal, and subevent relations. These hyper-parameters are manually tuned with runs and selected with F-1 scores. We use a GeForce RTX 3090 GPU to run the experiments. Average runtimes for an experiment are about , , , , and hours for coreference ERE, temporal ERE, causal ERE, subevent ERE, and joint training.
In evaluation, we implement the standard precision, recall, and F-1 scores with the scikit-learn toolkit333https://scikit-learn.org. For event coreference resolution, we implement the evaluation metrics referring to https://github.com/kentonl/e2e-coref.
Appendix D Data Split Statistics
In all the ERE experiments, we split Maven-Ere as the original split in Wang et al. (2020b).
In event coreference resolution, for ACE 2005 and TAC KBP data, we follow the split of Lu and Ng (2021b). For TAC KBP, LDC2015E29, LDC2015E68, TAC KBP 2015, and TAC KBP 2016 are used for training, and TAC KBP 2017 is used for test. The development set is documents randomly sampled from the training set. However, the data of some LDC catalog numbers provided by Lu and Ng (2021b) are not available, and we use other LDC datasets instead. Specifically, LDC2015E73 and LDC2015E94 are the datasets provided during the TAC KBP 2015 contest and are not publicly available. We use the 2015 data in LDC2020T13 instead. LDC2016E64 and LDC2017E51 are plain source corpora without annotation. We use the 2016 and 2017 data in LDC2020T18 instead. The statistics are shown in Table 13.
In event temporal relation extraction, we follow the splits of Ning et al. (2019) and Tan et al. (2021). The detailed statistics are shown in Table 14.
In event causal relation extraction, we follow previous works (Gao et al., 2019; Cao et al., 2021) to do -fold cross-validation on Causal-TB and EventStoryLine. The statistics for Maven-Ere are shown in Table 15.
In subevent relation extraction, we split HiEve following previous works (Zhou et al., 2020; Wang et al., 2021). The statistics are shown in Table 16.
Dataset #Doc. #Sentence #Word #Event Type #Mention #Chain #TIMEX Type #TIMEX #T-Link Type #T-Link #C-Link Type #C-Link #Subevent Rel. ACE 2005 (Walker et al., 2006) TAC KBP OntoNotes† (Pradhan et al., 2007) ECB+ (Cybulska and Vossen, 2014) TimeBank 1.2 (Pustejovsky et al., 2003b) TempEval-1 (Verhagen et al., 2009) TempEval-2 (Verhagen et al., 2010) TempEval-3∗ (UzZaman et al., 2013) TCR (Ning et al., 2018a) TB-Dense (Chambers, 2013) MATRES (Ning et al., 2018b) EventCausality (Do et al., 2011) BECauSE 2.0 (Dunietz et al., 2017) CaTeRS‡ (Mostafazadeh et al., 2016) EventStoryLine (Caselli and Vossen, 2017) Causal-TB (Mirza et al., 2014) Intelligence Community (Hovy et al., 2013) HiEve (Glavaš et al., 2014) RED (O’Gorman et al., 2016) Maven-Ere
Train Development Test #Doc. #Mention #Chain #Doc. #Mention #Chain #Doc. #Mention #Chain ACE 2005 TAC KBP Maven-Ere
Train Development Test #Doc. #Mention #T-Link #Doc. #Mention #T-Link #Doc. #Mention #T-LInk TB-Dense MATRES TCR Maven-Ere
Train Development Test #Doc. #Mention #T-Link #Doc. #Mention #T-Link #Doc. #Mention #T-LInk Maven-Ere
Train Development Test #Doc. #Mention #T-Link #Doc. #Mention #T-Link #Doc. #Mention #T-LInk HiEve Maven-Ere
Appendix E Discussions on Genre Diversity
Maven-Ere inherits all the documents of MAVEN (Wang et al., 2020b), which are all Wikipedia articles. One may wonder if Maven-Ere are diverse enough in genre and topic and if the ERE skills learned from the large-scale Maven-Ere can transfer to other ERE tasks (datasets). First, the original MAVEN work shows that the documents cover topics, such as Military conflict, Concert tour, etc. Hence we believe Maven-Ere also exhibits a good coverage for general-domain topics. Second, we conduct cross-dataset transfer experiments following Wang et al. (2020b). By further fine-tuning the RoBERTa models previously trained on Maven-Ere, the (MUC) F1 scores increase %, %, %, %, %, %, %, % on ACE 2005, TAC KBP, TB-Dense, MATRES, TCR, Causal-TB, EventStoryLine, and HiEve, respectively. This shows that the general ERE skills learned from Maven-Ere are transferable and can help ERE on datasets in other genres, especially for these small-scale datasets. We encourage future works to explore the influence of genre gaps deeply.