On a model-based analysis of vortex formations and decay in flows through bio-inspired T-shaped cavities
Abstract
(211 words)
Keywords: Vortex dynamics; Vortex decay; T and Y-shaped cavities; Upper airway transport; Bio-inspired modeling
1 Introduction
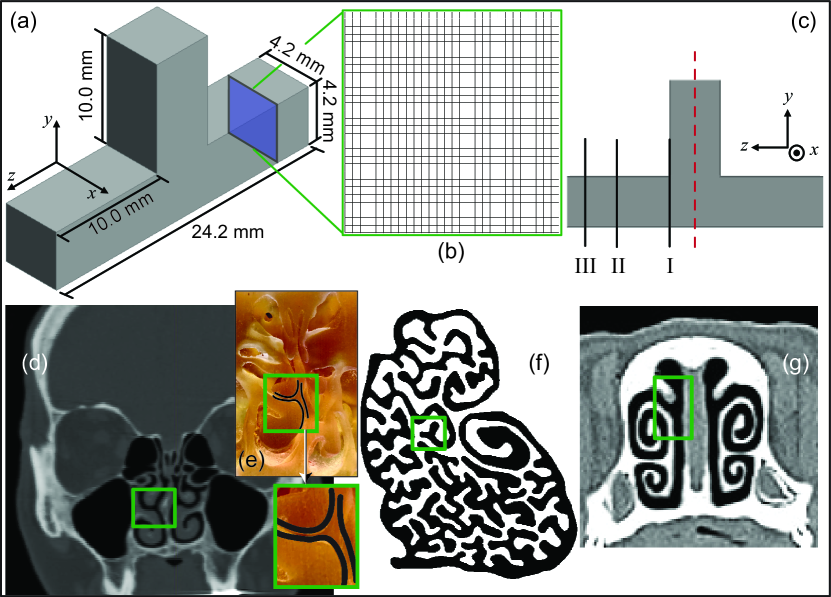
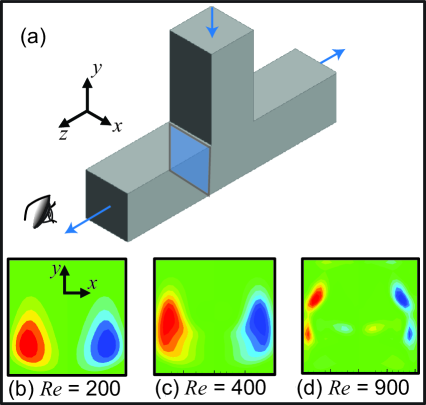
A common fluid flow geometry widely observable both in nature as well as in industrial applications is a T-junction (e.g., see Figure 1(a)-(c)) – or in a somewhat more generic setting, a junction that approximately bears a Y-shape. Despite the apparent geometric simplicity of the domain, past research[7, 8] has demonstrated how intriguing a flow physical system therein can get, with the formation of vortex tubes along the horizontal passage leading to trapping of particles that have lower density than that of the ambient fluidic medium. Remarkably enough, similar micro-channels are also copious in biological systems[1, 2, 3, 4, 5, 6], as for example in human and animal upper respiratory pathways; see Figure 1(d)-(g) for representative airway cross-sections. Vortex-induced trapping [7, 9], although necessary for heat and mass transfer operations especially at the anatomic length scales, has critical ramifications in such bifurcating flows because it is one of the main reasons behind particles getting trapped / slowed down, often contrary to the generally expected trends for particle trajectories in such spaces. Flows with varied particle sizes when passed through T-junctions experience a phenomenon called preferential concentration[9], which essentially constitutes a preferential discharge of light and heavy particles in and out of vortices. As a result, the heavier particles with their higher inertia are ejected out of the vortices much sooner than the lighter ones. This gives rise to a concentrated zone of smaller particles immediately after the junction[10].
Complex hydrodynamic behavior is seen in junctions, often triggered by secondary Dean instabilities when Reynolds number (Re) controlled inertial effects come into play [11, 12, 13, 14]. The curl in velocity streamlines[15] right after the bifurcation is dependent on the inlet velocity magnitude which also governs Re. For bifurcations with rectangular cross-sections, axisymmetric vortex breakdown is observed when it crosses a threshold Re of around 320[16]. Vortex breakdown is basically the formation of recirculating regions after the bifurcation inside which bubbles get trapped and move in a swirling motion.[17] From our simulation, it has been confirmed that the streamwise size of such vortex formations steadily decays with distance from the bifurcation and ultimately dies down. Past research[7, 8] has shown that particles that have specific gravity less than 1, when released in a water stream flowing inside the T-junction – would first travel along with the mean flow till the vortex breakdown points, i.e., the internal stagnation points inside the fluid where the particles get pushed inward back towards the bifurcation causing a ‘permanent’ trapping scenario[18]. However, this occurs for a specific range of Re values which lie well in the laminar flow regime. The present study replicates the underlying flow field in a test T-geometry and will extend the modeling approach to a biological topology, such as the ones shown in Figure 1(e)-(f).
2 Methods
2.1 Geometry building
The geometry shown in Figure 1(b) is a representation of the test T-junction used in this study. The simulated fluidic system flows in along the negative -direction, and after bifurcating, flows out along the positive and negative -directions. A square cross-section with side lengths as mm was assumed, with each arm being -mm long; see Figure 1(d) for a sample mesh profile with an element size of mm.
2.2 Computational framework
Flow behavior was replicated with the imposed physical properties for the ambient fluid medium based on those for water at room temperature and by initializing an inlet velocity of 0.1 m/s, thereby setting the Re for the test flow to be 400. This value of Re lies comfortably below the threshold limit to show any turbulent scales[19, 20]. Our numerical scheme for the viscous-laminar flow state employed pressure-velocity coupling set to SIMPLEC and spatial discretization set to second-order upwind. Convergence criteria for the simulations was defined at for the continuity residual and for the velocity components.
Sixteen planes were defined starting from the section marked as I in Figure 1(c) which was mm away from the reference plane (marked in red) to monitor the changes in helicity, vorticity, and the mean streamwise velocity profiles with the planes placed 0.5 mm apart from each other. Planes II and III in Figure 1(c) show the tenth and sixteenth planes which would be mm and mm from the reference plane respectively.
3 Results
3.1 Spatial evolution of helicity along the horizontal pathway in the streamwise direction
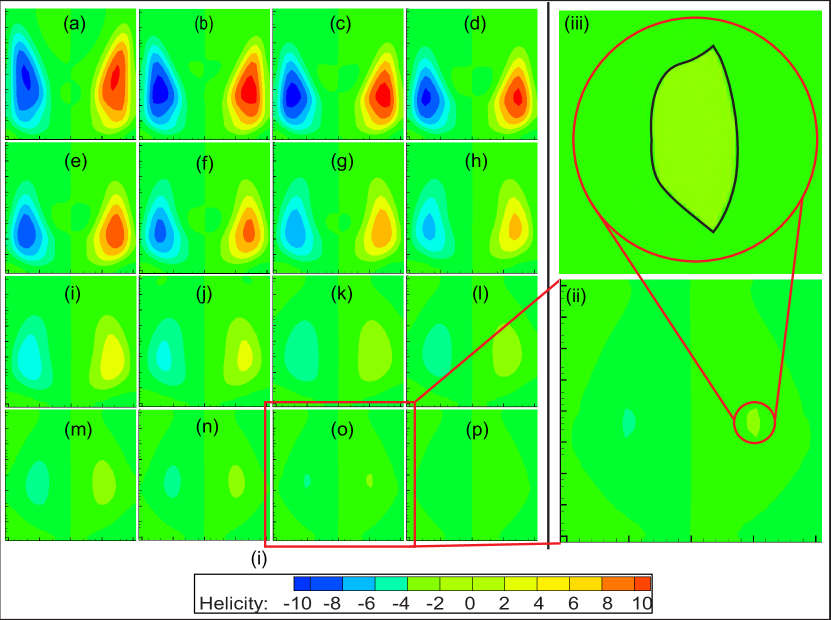
Helicity of a particle is defined by the projection of its spin on to the direction of its momentum[21, 22]. It measures the extent to which vortex lines curl around the central axis known as the core. Figure 2(i) shows the helicity contour plots of the sixteen test planes in ordered alphabetical sequence. It is seen that as one moves away from the reference plane, the helicity contours decrease both in size and magnitude. This helps us quantitatively assess the vortex structures as well, as they also, in turn, decay and dissipate within the outlet pipe. The contours eventually fade out in the fifteenth plane. The vorticity plots, presented next, should also show a similar trend where the contours fade out sooner and not later.
3.2 Spatial evolution of vorticity along the horizontal pathway in the streamwise direction and its relationship with helicity
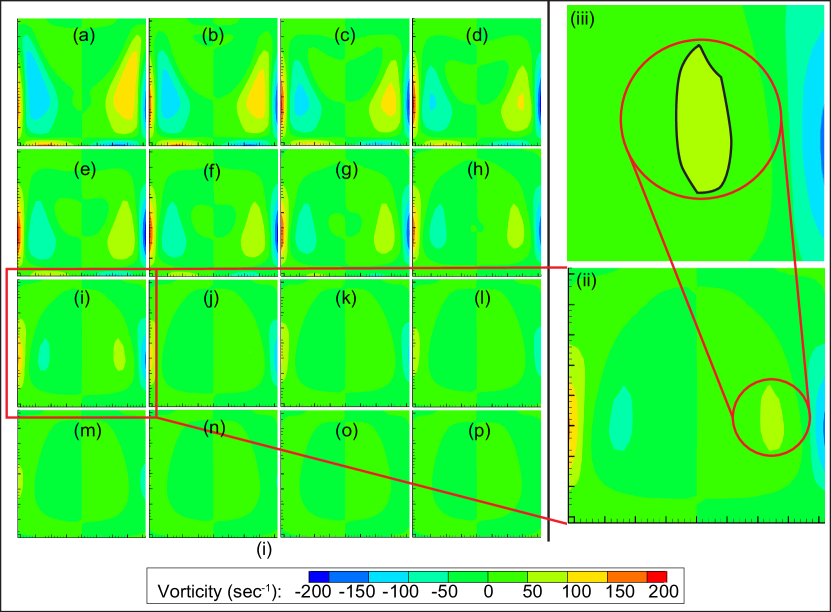
Vorticity is a property of fluid flow, computed as the curl of its velocity field[21, 23, 24, 25, 26, 27, 28]. Figure 3 shows the vorticity contour plots. It is seen that these plots show the same decreasing trend in magnitude and size, as we saw in Section 3.1. However, the vorticity completely dissipates at the ninth plane itself, which would be mm away from the reference plane, implying that the vortices terminate well before the helices do. Panel (ii) of Figure 3 is a magnified version of the ninth plane with panel (iii) showing the vortex structure before it eventually decays to have a negligible impact on the surrounding flow field.
3.3 Spatial analysis of the mean streamwise velocity trend to locate the vortex termination region
Magnitudes of vertex maximum velocities (VMV) were noted for all the planes and it was seen in Figure 4(a) that they increased to a peak velocity and then started decreasing monotonically. A recall to Section 2.2 would show that the inlet velocity was taken to be 0.1 m/s. Therefore, it can be postulated that the next instance where the VMV reaches and then ultimately falls below 0.1 m/s again would be the approximate position where the vortex dies down. Hence, a plot between VMV and distance from reference plane was made from which we were able to figure out graphically that this location is mm from the red-marked reference plane, which would be somewhere in between the eleventh and twelfth plane. Refer to Table 1 for the related data.
| Plane | Distance (mm) | Vertex Maximum Velocity (m/s) |
|---|---|---|
| 1 | 2.4 | 0.1083 |
| 2 | 2.9 | 0.1077 |
| 3 | 3.4 | 0.1097 |
| 4 | 3.9 | 0.1128 |
| 5 | 4.4 | 0.1155 |
| 6 | 4.9 | 0.1164 |
| 7 | 5.4 | 0.1156 |
| 8 | 5.9 | 0.1136 |
| 9 | 6.4 | 0.1104 |
| 10 | 6.9 | 0.1068 |
| 11 | 7.4 | 0.1033 |
| 12 | 7.9 | 0.0994 |
| 13 | 8.4 | 0.0960 |
| 14 | 8.9 | 0.0931 |
| 15 | 9.4 | 0.0906 |
| 16 | 9.9 | 0.0886 |
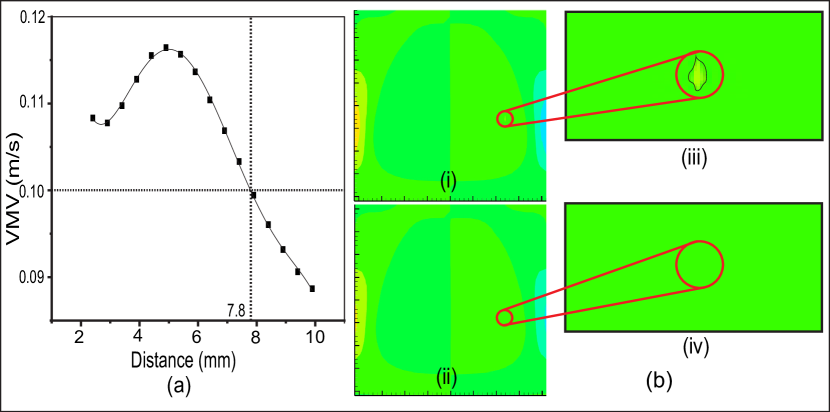
Now, if we go back to Figure 3 and extract the tenth and eleventh (Panel (j) and (k) respectively) planes and zoom-in as shown in Figure 4(b) we can see that there still exists a minute vortex structure in Panel (i), i.e. at the tenth plane, which disappears in the very next plane, i.e. in Panel (ii). So, it is safe to conclude that the vortex does eventually die down in the near vicinity where the VMV equals the inlet velocity. This is, therefore, the point where vortex breakdown occurs and the particles might be forced back inwards into the upstream vortex tube, thus trapping them until the Re is raised further which leads to a local dissipation of the coherent vortex structures (see e.g., Figure 5).
4 Discussion
Investigations on vortex-induced trapping in biomedical pathways, modeled after the explored system, could yield significant inputs for intranasal drug delivery[29, 30] and breathing problems[31]. Bifurcating flows are very common in biological scenarios. Animal anterior airways[32, 1] have multiple locations where such T or Y-shaped junctions are prominent (Figure 1(d)). Fluid friction within these channels are responsible for heat generation along the inner walls[33]. Hence, a study of particle trapping within the vortex tubes inside such topologies is evidently an important aspect to explore for such bifurcating flows[34, 35, 36]. To advance the state-of-art, we will shortly supplement this study with a model for the flow behavior in T/Y-shaped animal respiratory morphology reconstructed medical imaging data.
From our evaluation, it is seen that each of the vortices is ranging over a length that occupies approximately 50-55% of the total outlet arm for the set of boundary conditions used. Additionally, vortex breakdown point is correlated to the inlet velocity; the more the inlet velocity, the farther the vortex breakdown point will be from the junction.
Particle tracking is an important aspect which will help us figure out how long any particle in the fluid stream might get entrapped within the vortex bubble. Categorizing their properties such as density, size, shape would also become necessary then. Dependency of the angle between junctions (e.g., if we consider Y-junctions) can play a vital role in how the vortex structures and their spatial extent evolve[37]. Multiphase fluidic behavior as well as complex rheologies can also affect the particle trapping property of the vortex bubbles[38, 39, 40]. For example, the symmetric occurrence of the vortex bubbles that we observed in our case does not stand in visco-elastic fluids[41]. In the context of biomedical transport, note that a typical arterial flow, based on the time scale in consideration, is pulsatile in nature, but we modeled the test system as a steady flow throughout the entire duration of our simulation. Hence, to realistically model an arterial flow, one has to make appropriate time-dependent changes to the inlet flow conditions[42]. A power law-based correlation between Re and vorticity has been implemented through use of Random Vortex Method (RVM) [43]; the same can be done with our model to compare between the two parameters.
Author contributions
SB: conceptualization, project administration, writing. SD: digital reconstructions, simulations, theoretical calculations, data analysis, writing.
Data availability
The simulation data-sets and scripts for the plotted figures – are available on-request from the corresponding author, through a shared-access Google Drive folder.
ORCID iDs
Saikat Basu https://orcid.org/0000-0003-1464-8425
Sneham Das https://orcid.org/0000-0002-4722-6272
References
References
- [1] J. Yuk, A. Chakraborty, S. Cheng, C. I. Chung, A. Jorgensen, S. Basu, L. P. Chamorro, and S. Jung. On the design of particle filters inspired by animal noses. Journal of the Royal Society Interface, 19(188):20210849, 2022.
- [2] M. J. Diab, S. Cheng, J. Yuk, C. I. Chung, A. Jorgensen, L. Chamorro, S. Jung, S. Basu, and A. Chakraborty. Design of new-generation scalable filters with tortuous pathways inspired from animal noses. In APS Division of Fluid Dynamics Meeting Abstracts, pages H01–010, 2021.
- [3] J. Yuk, K. Frohlich, R. Connor, S. Basu, L. Chamorro, and S. Jung. Bio-inspired mask filters with breathing resistance control. In APS March Meeting Abstracts, volume 2021, pages Y14–007, 2021.
- [4] A. Chakraborty, A. Jorgensen, J. Yuk, C. I. Chung, L. Chamorro, S. Jung, and S. Basu. Simulating inhaled transport through bio-inspired pathways in mask filters. In APS Division of Fluid Dynamics Meeting Abstracts, pages Y01–011, 2020.
- [5] J. Yuk, A. Baskota, B. Cooke, K. Frohlich, D. Morton, C. I. Chung, A. Jorgensen, S. Basu, L. Chamorro, and S. Jung. 3d-printing mask filters inspired by animal nasal cavity. In APS Division of Fluid Dynamics Meeting Abstracts, pages X01–005, 2020.
- [6] C. I. Chung, J. Yuk, A. Jorgensen, S. Basu, S. Jung, and L. Chamorro. Vortex traps to capture particles with reduced pressure loss in respiratory masks. In APS Division of Fluid Dynamics Meeting Abstracts, pages Y01–014, 2020.
- [7] D. Vigolo, S. Radl, and H. A. Stone. Unexpected trapping of particles at a T junction. Proceedings of the National Academy of Sciences, 111(13):4770–4775, April 2014.
- [8] K. Chen, C. Rowley, and H. Stone. Vortex breakdown, linear global instability and sensitivity of pipe bifurcation flows. Journal of Fluid Mechanics, 815:257–294, March 2017.
- [9] J. Bec, L. Biferale, M. Cencini, A. S. Lanotte, and F. Toschi. On the effects of vortex trapping on the velocity statistics of tracers and heavy particle in turbulent flows. arXiv preprint nlin/0604059, 2006.
- [10] S. Manoorkar and J. Morris. Particle motion in pressure-driven suspension flow through a symmetric T-channel. International Journal of Multiphase Flow, 134:103447, January 2021.
- [11] C. Bălan and D. Broboană. Investigations of vortex formation in microbifurcations. Microfluidics and Nanofluidics, 13(5):819–833, November 2012.
- [12] C. Zhang et al. Investigations of thermal and flow behavior of bifurcations and bends in fractal-like microchannel networks: Secondary flow and recirculation flow. International Journal of Heat and Mass Transfer, 85:723–731, June 2015.
- [13] N. Nivedita, P. Ligrani, and I. Papautsky. Dean Flow Dynamics in Low-Aspect Ratio Spiral Microchannels. Scientific Reports, 7(1):44072, April 2017.
- [14] I. Damian, S. Hardt, and C. Balan. From flow focusing to vortex formation in crossing microchannels. Microfluidics and Nanofluidics, 21(8):142, August 2017.
- [15] J. Štigler, R. Klas, M. Kotek, and V. Kopecký. The Fluid Flow in the T-Junction. The Comparison of the Numerical Modeling and Piv Measurement. Procedia Engineering, 39:19–27, 2012.
- [16] S. Chan, S. Haward, and A. Shen. Microscopic Investigation of Vortex Breakdown in a Dividing T-Junction Flow, June 2018. arXiv:1806.10754 [physics].
- [17] A. Mora et al. Numerical study of the dynamics of a droplet in a T-junction microchannel using OpenFOAM. Chemical Engineering Science, 196:514–526, March 2019.
- [18] H. Stone. Seeking Simplicity in the Flows of Complex Fluids. Web link, accessed 06-November-2022.
- [19] K. Selvam, J. Peixinho, and A. P. Willis. Flow in a Circular Expansion Pipe Flow: Effect of a Vortex Perturbation on Localized Turbulence. Fluid Dynamics Research, 48(6):061418, December 2016. arXiv:1602.07151 [physics].
- [20] K. Tuoc. On The Critical Reynolds Number For Transition From Laminar To Turbulent Flow. page 39.
- [21] D. Cao and J. Wan. Helical vortices with small cross-section for 3D incompressible Euler equation, May 2022. arXiv:2206.00201 [math].
- [22] H Keith Moffatt. Helicity and singular structures in fluid dynamics. Proceedings of the National Academy of Sciences, 111(10):3663–3670, 2014.
- [23] D. Cao and J. Wan. Structure of Green’s function of elliptic equations and helical vortex patches for 3D incompressible Euler equations, September 2022. arXiv:2209.12237 [math].
- [24] M. Stremler, A. Salmanzadeh, S. Basu, and C. Williamson. A mathematical model of 2P and 2C vortex wakes. Journal of Fluids and Structures, 27(5-6):774–783, July 2011.
- [25] S. Basu and M. A. Stremler. Exploring the dynamics of ‘2p’wakes with reflective symmetry using point vortices. Journal of Fluid Mechanics, 831:72–100, 2017.
- [26] S. Å Ellingsen, A. H. Akselsen, and L. Chan. Designing vortices in pipe flow with topography-driven Langmuir circulation. Journal of Fluid Mechanics, 926:A9, November 2021. arXiv:2104.07731 [physics].
- [27] G. L. Eyink. Turbulent Flow in Pipes and Channels as Cross-Stream "Inverse Cascades" of Vorticity. Physics of Fluids, 20(12):125101, December 2008. arXiv:0809.1165 [cond-mat, physics:physics].
- [28] L. Hufnagel et al. The three-dimensional structure of swirl-switching in bent pipe flow. Journal of Fluid Mechanics, 835:86–101, January 2018. arXiv:1710.08357 [physics].
- [29] S. Basu, L. T. Holbrook, K. Kudlaty, O. Fasanmade, J. Wu, A. Burke, B. W. Langworthy, Z. Farzal, M. Mamdani, W. D. Bennett, J. P. Fine, B. A. Senior, A. M. Zanation, C. S. Ebert Jr, A. J. Kimple, B. D. Thorp, D. O. Frank-Ito, G. J. M. Garcia, and J. S. Kimbell. Numerical evaluation of spray position for improved nasal drug delivery | Featured in the Editor’s choice: fluid dynamics collection | Metrics data from nature.com: Since publication in 06/2020, downloaded 6,700 times. Scientific Reports, 10(1):1–18, 2020.
- [30] S. Basu, D. O. Frank-Ito, and J. S. Kimbell. On computational fluid dynamics models for sinonasal drug transport: Relevance of nozzle subtraction and nasal vestibular dilation. International Journal for Numerical Methods in Biomedical Engineering, 34(4):e2946, 2018.
- [31] R. J. Thomas. Particle size and pathogenicity in the respiratory tract. Virulence, 4(8):847–858, 2013.
- [32] S. Basu. Computational characterization of inhaled droplet transport to the nasopharynx. Scientific Reports, 11(1):6652, December 2021.
- [33] A. Lintermann, M. Meinke, and W. Schroder. Investigations of the Inspiration and Heating Capability of the Human Nasal Cavity Based on a Lattice-Boltzmann Method. page 11, 2011.
- [34] K. Inthavong, J. Tu, and G. Ahmadi. Computational Modelling of Gas-Particle Flows with Different Particle Morphology in the Human Nasal Cavity. The Journal of Computational Multiphase Flows, 1(1):57–82, January 2009.
- [35] Z. Pan, H. Wang, and Z. Yang. Marangoni Bifurcation Flow in a Microchannel T-Junction and Its Micropumping Effect: A Computational Study. Chinese Physics Letters, 29(7):074702, July 2012.
- [36] C. Li et al. Nasal Structural and Aerodynamic Features That May Benefit Normal Olfactory Sensitivity. Chemical Senses, 43(4):229–237, April 2018.
- [37] Y. Noori, A. Teymourtash, and B. Zafarmand. Calculation of the phase separation rate in two-phase flow of non- Newtonian power-law fluid and gas bubbles flowing inside the T- and Y-junctions using random vortex method. The Canadian Journal of Chemical Engineering, page cjce.24498, July 2022.
- [38] J. Kim et al. Inertio-elastic flow instabilities in a 90° bent microchannel. Soft Matter, 13(34):5656–5664, 2017.
- [39] Y. Park, S. Hong, P. Lee, and J. Kim. Vortex dynamics at the junction of Y-shaped microchannels in dilute polymer solutions. Korea-Australia Rheology Journal, 31(4):189–194, November 2019.
- [40] C. D. Xue et al. Vortex evolution patterns for flow of dilute polymer solutions in confined microfluidic cavities. Soft Matter, 18(20):3867–3877, 2022.
- [41] R. J. Poole, S. J. Haward, and M. A. Alves. Symmetry-breaking Bifurcations in T-channel Flows: Effects of Fluid Viscoelasticity. Procedia Engineering, 79:28–34, 2014.
- [42] C. Cox and M. W. Plesniak. The effect of entrance flow development on vortex formation and wall shear stress in a curved artery model. Physics of Fluids, 33(10):101908, October 2021. arXiv:2108.02377 [physics].
- [43] Y. Noori, A. R. Teymourtash, and B. Zafarmand. Use of Random Vortex Method in Simulating Non-Newtonian Fluid Flow in a T-junction for Various Reynolds Numbers and Power-law Indexes. International Journal of Engineering, 35(5):954–966, 2022.