Probing the evolution of Type Ia supernovae with their ejecta velocities
Abstract
There is growing evidence that Type Ia supernovae (SNe Ia) are likely produced via multiple explosion channels. Understanding how different channels evolve with redshift is critical in determining their precision in measuring cosmological parameters. Previous studies indicated that SN Ia ejecta velocity is one powerful tool to differentiate between different channels. It was also suspected that the tight correlation with the host-galaxy environment could result in the evolution of SN ejecta velocities. In this work, we measure the velocities from 400 confirmed SNe Ia discovered by the Pan-STARRS1 Medium Deep Survey (PS1-MDS), and combine them with the SNe discovered by different surveys to form a large compilation of velocity measurements. For the first time, we find that the SNe Ia with faster have a significantly different redshift distribution from their slower counterparts (with a -value of from the K-S test), in the sense that HV SNe Ia are more likely to be found at lower redshift. The trend may suggest a strong evolution of SN Ia ejecta velocity, or imply that the SN Ia demographics (as distinguished by their ejecta velocities) are likely to vary with time. Our results also imply that the progenitor system of HV SNe Ia (and possibly some NV SNe Ia) may favor a metal-rich environment and/or scenarios of long delay time. However, we do not see a significant difference (in 2) in Hubble residuals when splitting our sample based on the velocity.
1. Introduction
Type Ia supernovae (SNe Ia) are mature standardizable candles that are frequently used to measure the cosmological parameters (e.g., Riess et al., 1998; Perlmutter et al., 1999; Riess et al., 2007; Kessler et al., 2009; Sullivan et al., 2011; Suzuki et al., 2012; Scolnic et al., 2018; Abbott et al., 2019; Jones et al., 2019; Brout et al., 2022). These studies generally assumed that the SNe Ia originated from a uniform class and showed negligible evolution over the cosmological time. In practice, we do not fully understand these exceptional explosions, such as their progenitor system and the explosion mechanism. Thus, the degree to which SN Ia properties evolve with redshift and how these evolutionary effects will impact the precision of the cosmological parameters will become an important consideration in their future use.
Previous studies have shown some evidence that SN Ia properties could evolve with redshift. Howell et al. (2007) first studied the light-curve width as a function of redshift. After carefully selecting their sample to minimize the Malmquist bias, they found SNe Ia at higher redshift tend to have a wider light-curve width. This further implies that the higher- SNe Ia are on average brighter than the lower- SNe Ia (based on the width and luminosity relation; Phillips, 1993). This trend has also been confirmed by Nicolas et al. (2021) with a more recent dataset.
The SN Ia spectral features as a function of redshift were also investigated by several studies. Bronder et al. (2008) studied three spectral features (, , ) and found that the low- and high- samples are generally similar except for the equivalent width (EW) of line. In contrast, Walker et al. (2011) did not see a significant difference in the EW of between the low- and high- samples; however, they found the strength of decreases with redshift. Foley et al. (2008) constructed the SN Ia composite spectra based on the redshift. Their results revealed an ultraviolet (UV) excess for the composite spectrum of the high- sample, also a significant difference in the strength of between low- and high- composite spectra. The trend that higher- SNe Ia tend to have a UV excess has also been confirmed by Balland et al. (2018). In addition, the results from Sullivan et al. (2009) and Balland et al. (2009) both indicated that the higher- SNe Ia tend to show lower intermediate-mass element (IME) abundances than that of lower- counterparts, although Sullivan et al. (2009) attributed this trend as changes in SN Ia demographics rather than the evolution of photometrically similar SNe.
Most studies mentioned above could not investigate the SN spectral properties redward of 6000 Å (e.g., the line) due to the limited wavelength coverage at high redshift. Foley (2012) was the first to look into the relation between velocity () and redshift, but they found an insignificant difference in between low- and high- SNe Ia with a small sample. More recent studies suggested that SN Ia ejecta velocity is likely to correlate with the host-galaxy environment. For example, high-velocity (HV) SNe Ia ( km s-1; Wang et al., 2009) tend to reside in more massive galaxies than their normal-velocity (NV; km s-1) counterparts (Pan et al., 2015; Pan, 2020; Dettman et al., 2021). Considering the evolution of galaxy populations, Pan (2020) suspected that the fraction of HV SN Ia may decrease with redshift. With a new light-curve model, Jones et al. (2022) found a marginal trend that SNe Ia tend to have larger EWs in low-mass galaxies, but they did not see a trend with .
Wang et al. (2009) proposed that HV SNe Ia are likely to have a different origin from NV SNe Ia, given their preference for a lower extinction ratio () than that of NV SNe Ia. There is also evidence that the HV SNe Ia tend to show a blue excess in their late-time light curves and variable Na i absorption lines in their spectra (Wang et al., 2019). In addition to their preference for massive host galaxies (e.g., Pan et al., 2015; Pan, 2020), they also tend to be more concentrated in the inner regions of their host galaxies, whereas the NV events span a wider range of radial distances (Wang et al., 2013). In the nebular phase, a few studies have indicated that HV SNe Ia tend to show redshifted [] line, while NV SNe Ia could have either blueshifted or redshifted [] line in their spectra (Maeda et al., 2010; Maguire et al., 2018; Li et al., 2021). This trend implies that HV SNe Ia (and at least part of the NV SNe Ia) could be produced via asymmetric explosions. It is yet clear if the HV and NV SNe Ia are physically distinct and produced via different channels. Theoretical studies proposed that the sub-Chandrasekhar-mass WD explosions could be a promising mechanism to explain the wide range of (including the HV SNe Ia) as found by spectroscopic observations (e.g., Polin et al., 2019; Shen et al., 2021). The simulation of sub-Chandrasekhar-mass explosions from these studies are generally consistent with the observational properties of HV SNe Ia, such as their unique color and ejecta velocity. However, more precise physics, radiative transfer, and the effect of secondary star (e.g., Pakmor et al., 2022) need to be considered in future works.
Motivated by the growing evidence that SNe Ia are likely to result from multiple channels, and that their ejecta velocities could be key to distinguishing between different channels of explosion, we measure the velocity from the absorption line of the SNe Ia discovered by the Pan-STARRS1 Medium Deep Survey (PS1-MDS) in this paper. We aim to investigate the relation between and various SN and host-galaxy properties, and probe the potential evolution effect and/or demographic change of SN Ia populations. A plan of the paper follows. In Section 2 we discuss our SN Ia spectroscopic sample, measurement, and the determination of host-galaxy parameters. The results are shown in Section 3. The discussion and conclusions are presented in Sections 4 and 5, respectively. Throughout this paper, we assume km s-1 Mpc-1 and a flat universe with if not mentioned otherwise.
2. Data and method
2.1. Spectroscopic observations of PS1-MDS SNe
Here we study the spectroscopically confirmed SNe Ia discovered by the PS1-MDS. The details of the PS1-MDS can be found in Rest et al. (2014) and Scolnic et al. (2018). The spectroscopic observations were obtained with a variety of telescope/instrument combinations, including the FAST Spectrograph on the 1.5-m Tillinghast Telescope (Fabricant et al., 1998), the Supernova Integrated Field Spectrograph (SNIFS; Aldering & Supernova Factory, 2007) on the University of Hawai’i 88-inch (UH88) telescope, the Alhambra Faint Object Spectrograph and Camera (ALFOSC) on the 2.56-m Nordic Optical Telescope, the Dual Imaging Spectrograph (DIS) on the Astrophysical Research Consortium 3.5-meter Telescope, the Richey-Chretien Spectrograph on the Kitt Peak National Observatory 4-m telescope, the Intermediate dispersion Spectrograph and Image System (ISIS) on the 4.2-m William Herschel Telescope (WHT), the Blue Channel Spectrograph (Schmidt et al., 1989) and Hectospec (Fabricant et al., 2005) on the 6.5-m Multiple Mirror Telescope (MMT), the Low Dispersion Survey Spectrograph-3 (LDSS3) and the Magellan Echellette (MagE; Marshall et al., 2008) on the 6.5-m Magellan Clay telescope, the Inamori-Magellan Areal Camera and Spectrograph (IMACS; Dressler et al., 2011) on the 6.5-m Magellan Baade telescope, the Gemini Multi-Object Spectrographs (GMOS; Hook et al., 2004) on both 8.1-m Gemini North and South telescopes, the DEep Imaging Multi-Object Spectrograph (DEIMOS) on the 10-m Keck-II telescope (Faber et al., 2003), and the Optical System for Imaging and low-Intermediate-Resolution Integrated Spectroscopy (OSIRIS; Cepa et al., 2003) on the 10.4-m Gran Telescopio CANARIAS (GTC).
The spectra are reduced with IRAF111The Image Reduction and Analysis Facility (IRAF) is distributed by the National Optical Astronomy Observatories, which are operated by the Association of Universities for Research in Astronomy, Inc., under a cooperative agreement with the National Science Foundation. and Interactive Data Language (IDL) tasks following the standard procedure (bias subtraction, flat-fielding, wavelength calibration, and flux calibration). When possible, we carefully select the background regions to subtract the host-galaxy light when extracting the 1-D spectrum. This can help reduce the host-galaxy contamination on the SN spectra. A summary of spectroscopic observation for all the confirmed SNe Ia can be found in Table LABEL:spec_sample, and their spectra are available from the WISeREP archive (Yaron & Gal-Yam, 2012).
| Num. of SNe left | |
|---|---|
| Confirmed as SN Ia | 381 |
| Redshift derived from host | 321 |
| LC quality cut | 283 |
| Phase cut | 126 |
| With measurement | 48 |
2.2. Sample selection
The objects studied in this work were all spectroscopically confirmed as SN Ia. We use the Supernova Identification (SNID; Blondin & Tonry, 2007) code to classify the SNe. The classification scheme is briefly summarized as follows: We first clipped or masked the nebular emission lines from the host galaxy (if any) in the spectra before SNID classification. The redshift is forced to be fixed if known (e.g., from the host galaxy). The SNID classification is mainly based on the quality parameter named ‘rlap’ (see Blondin & Tonry, 2007). The higher rlap indicates a better correlation (as weighted by the overlap in wavelength space) between the input spectrum and the template. Following the method in Miknaitis et al. (2007), we classify a supernova to be Ia if its best-match template from SNID is an Ia and at least 50% of the templates with rlap larger than 5.0 are also Ia. A total of 362 objects pass the criterion and are confirmed as Ia. We classify another 19 objects as Ia (which fail to pass our SNID criteria) with eye inspection. The final parent sample contains 381 spectroscopically confirmed SNe Ia.
To measure the ejecta velocity, only SNe with host-galaxy redshift available are included. This gives 321 SNe from the parent sample. We also apply the same quality cuts on SN light curves (LCs) as those described in Scolnic et al. (2018) to ensure a precise phase determination of our spectrum. These include the constraints on LC fitting parameters such as reduced , the LC width (), and peak date () uncertainties. We do not apply the cuts on or since our study is not limited to the cosmological sample. Total 283 SNe Ia pass the LC quality cut and are used as our final spectroscopic sample. The number of SNe left after each cut is shown in Table 1.
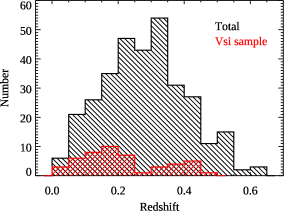
The redshift of our final spectroscopic sample ranges from 0.03 to 0.63, with a median redshift of 0.3. Most of the SNe have only single-epoch spectroscopic observation, with 10% of our SNe (21 out of 283) having multi-epoch spectra. The distribution of redshift and phase of the spectra used for classification can be found in Fig. 1.
 |

|
2.3. velocity measurement
In this work, we focus on the photospheric velocity measured from the line near the maximum light. line is selected because it is relatively free from the contamination of other lines and detached high-velocity features (HVFs; Wang et al., 2003; Gerardy et al., 2004; Mazzali et al., 2005). The alternative is the line. However, the strong HVFs and potential contamination (e.g., ) could complicate the precise determination of the photospheric component when high-quality spectra are unavailable. (e.g., Childress et al., 2014; Maguire et al., 2014; Silverman et al., 2015).
Here we use the technique from Blondin et al. (2006) to measure the velocity. Following the procedure described in Siebert et al. (2019), the spectrum is first smoothed with an inverse-variance Gaussian kernel of a temporary smoothing factor. An error spectrum is then determined from the smoothed residual spectrum by subtracting the initially smoothed spectrum from the original spectrum. A signal-to-noise ratio (S/N) is estimated using the median flux ratio between the smoothed spectrum and error spectrum. This S/N will be used to determine the final smoothing factor (by adopting the empirical relation in Siebert et al., 2019) to smooth the SN spectrum. The is calculated by measuring the minimum wavelength of the smoothed line.
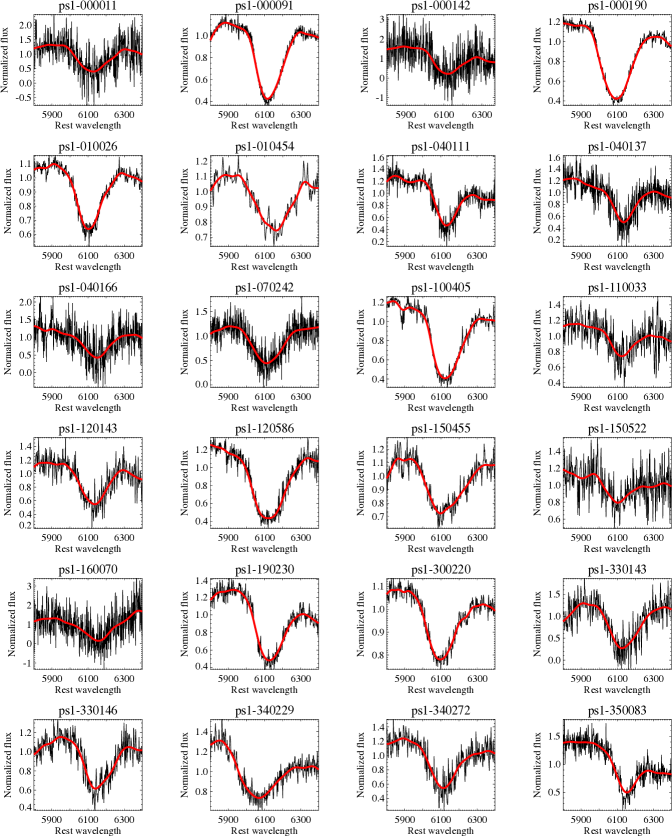
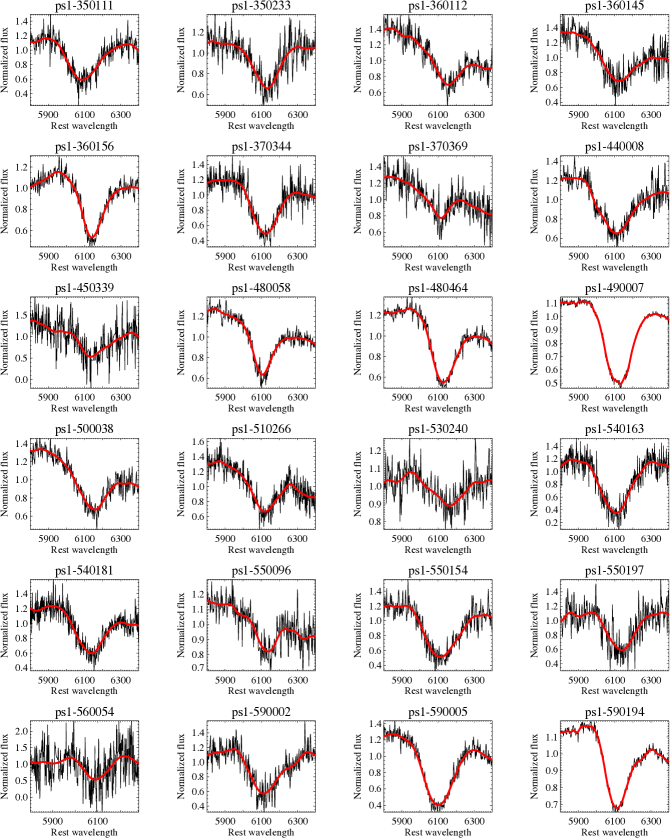
Following Maguire et al. (2014) and Pan et al. (2015), we obtain the near-peak sample by restricting the phase of our spectroscopic observations to be within 5 days relative to the peak luminosity. The velocity evolution within this phase range is expected to be mild and small. This phase cut gives a near-peak sample of 126 SNe. Finally, we are able to measure the from 48 SNe that have sufficient quality (via eye inspection) and wavelength coverage. The median of our sample is 10923 km s-1, with a minimum and maximum velocity of 9015 and 13459 km s-1, respectively. The redshift distribution of our sample can be found in Fig. 1. Fig. 13 and Fig. 14 show the observed and smoothed flux of each SN around line in our sample. Our measurement can be found in Table LABEL:hiz_vsi.
2.3.1 Evaluation of host-galaxy contamination
 |
 |
SNe at high redshift are often blended with their host galaxies. As mentioned in Section 2.1, we chose the background regions as carefully as we could to subtract the host-galaxy light when processing the spectrum. However, it is sometimes inevitable that the final spectrum could still suffer non-negligible contamination from their host galaxies. Here we evaluate the effect of host-galaxy contamination on the measurement.
Our method is based on Howell et al. (2005), using a fitting technique to estimate the fraction of host-galaxy contamination in the SN spectrum. Howell et al. (2005) fit each SN spectrum with a library of SN templates of all types and a range of phases. The reddening, redshift (if not determined from the host galaxy), and fraction of host-galaxy contamination are derived by minimizing the difference between the observed SN spectrum and template spectrum. Instead of fitting the observed spectrum with templates of a wide range of parameter space (which could result in substantial degeneracy), we developed a script to allow specific SN and host-galaxy templates in the fitting. For the SN template, we use the kaepora database (Siebert et al., 2019) to produce a mean spectrum given the exact phase and LC width (e.g., from Scolnic et al., 2018) of each SN in our sample. For the host-galaxy template, we first measure the host-galaxy photometry from the PS1 template images in filters. We measure the photometry by placing an aperture of 1.5″ radius at the SN location. This allows us to constrain better the host-galaxy spectral energy distribution (SED) near the SN birthplace. The measured photometry will then be used as input for the photometric redshift code Z-PEG to derive the best-fit galaxy template and properties. Z-PEG fits the observed galaxy colors with galaxy SED templates corresponding to nine spectral types (SB, Im, Sd, Sc, Sbc, Sb, Sa, S0, and E). Here we assume a Salpeter (1955) initial-mass function (IMF). The photometry is corrected for the foreground Milky Way reddening with and a Cardelli, Clayton, & Mathis (1989, CCM) reddening law. The details of the fitting procedure can be found in Pan et al. (2014).
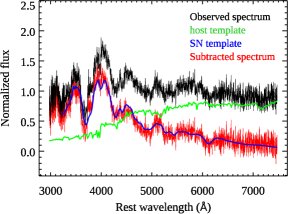
Fig. 2 shows the result of host-galaxy subtraction from one of our SNe. Overall, the host-galaxy contamination of our sample is not significant. We determine a median host-galaxy fraction of only 17%, with 45 out of 48 SNe having fractions lower than 50%. The velocity comparison between the spectra before and after the host-galaxy template subtraction can be found in Fig. 3. The two measurements are consistent with each other, with a mean offset of 65 km s-1 and rms scatter of 101 km s-1. Given that the difference in velocity is statistically insignificant, and not all the SNe in our sample have host-subtracted spectra available, we simply adopt the original velocity measurements for further analysis.
 |
 |
 |
3. Results
3.1. Silicon velocity and light-curve parameters
We first compare the with the SN photometric parameters, such as stretch and optical color . Here we adopt the SALT2 (Guy et al., 2007) measurement from Scolnic et al. (2018) for the analysis. The parameter measures the LC width of SN Ia, a key parameter to calibrate the SN luminosities. Brighter SNe Ia tend to have LCs with slower decline rates or higher stretches (Phillips, 1993). The color parameter measures the SN () color at maximum light, which is also important for SN Ia standardization (e.g., Riess, Press, & Kirshner, 1996). The as a function of and can be found in Fig. 4. We do not find a significant trend between and . This is consistent with many previous low- studies (e.g., Wang et al., 2009; Pan, 2020; Dettman et al., 2021). No significant trend is identified with the color parameter either. Nevertheless, we do find that all the HV SNe Ia in Fig. 4 have mag, where the NV SNe Ia can go as blue as mag. This is in line with the previous findings that HV SNe Ia tend to be redder than their NV counterparts (e.g., Wang et al., 2009).
3.2. Silicon velocity and host-galaxy properties
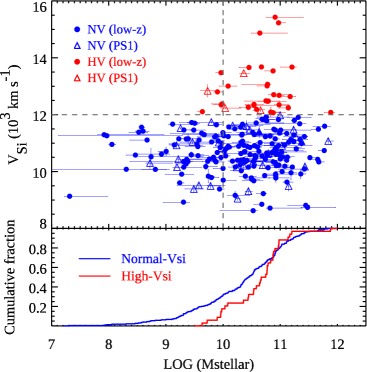
The relation between and host-galaxy properties at low redshift was investigated by several recent studies (e.g., Wang et al., 2013; Pan et al., 2015; Pan, 2020). For instance, Pan (2020) found a significant trend between and host-galaxy stellar mass (), in the sense that HV SNe Ia tend to explode in massive galaxies, while NV SNe Ia can be found in either low-mass or massive galaxies. This trend was further confirmed by Dettman et al. (2021) with a different low- dataset.
We revisit this relationship with the PS1-MDS sample. The host-galaxy studied in this work is determined by Z-PEG fitting (see Section 2.3.1 for details). In contrast to Section 2.3.1, here we use an elliptical to enclose the whole galaxy to determine the rather than putting a small aperture local to the SN position. This ensures a better comparison with previous host-galaxy studies. The result is shown in Fig. 5. The PS1-MDS sample generally shows good consistency with the low- sample. Despite the small sample size, most of the HV SNe Ia from PS1-MDS have host-galaxy . The difference in mean between HV and NV subgroups (considering both the low- and PS1-MDS SNe) is (at 3.9 significance), with host galaxies from HV subgroup being (on average) more massive than that from NV subgroup.
We also examine the relation between and other host-galaxy properties of interest, such as the star-formation rate (SFR) and specific SFR. However, no significant trend is found with our sample. This is consistent with the previous low- studies (e.g., Pan, 2020).
3.3. Silicon velocity and redshift
|
Given the relation between and host-galaxy , Pan (2020) suspected that the ejecta velocity of SN Ia may evolve with redshift. Here we investigate the ejecta velocity as a function of redshift by comparing the PS1-MDS SNe with SNe discovered from different surveys.
In addition to the PS1-MDS SNe, we add the spectroscopic compilation studied in Foley (2012) to increase the number of high- samples. This compilation contains the SNe discovered by both Sloan Digital Sky Survey-II (SDSS-II) Supernovae Survey (Frieman et al., 2008) and Supernova Legacy Survey (SNLS; Astier et al., 2006) programs. We re-measured the for these SNe with the consistent method as that described in Section 2.3. The same phase cut (see Section 4.2) is adopted to these SNe to obtain the near-peak measurement. A total of 23 high- SNe are added to our sample. The new measurements of these additional SNe are listed in Table LABEL:hiz_vsi. For the low- sample, we use the spectroscopic compilation studied in Pan et al. (2015) and Dettman et al. (2021). The SNe studied in Pan et al. (2015) were all discovered by the Palomar Transient Factory (PTF; Law et al., 2009). Dettman et al. (2021) compiled a large low- sample from the Foundation Supernova Survey (Foley et al., 2018), Carnegie Supernova Project (CSP; Hamuy et al., 2006), Wang et al. (2009, hereafter W09), and Foley & Kasen (2011, hereafter FK11). The of these low- SNe were all measured consistently. Our final low- sample contains the near-peak measurements from 388 SNe.
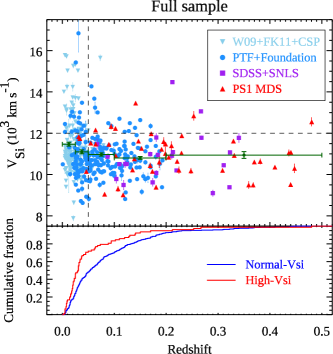
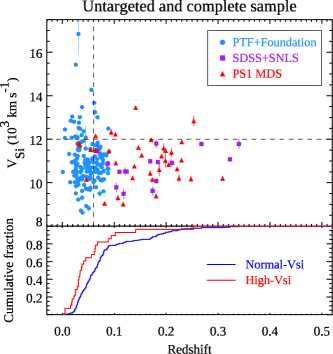
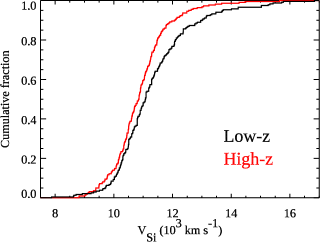
The result is shown in the left panel of Fig. 6. We find significant evidence that HV SNe Ia are more likely to be found in the local Universe than their NV counterparts. A K-S test gives a probability of only 0.008% that HV and NV SNe Ia have similar redshift distributions. The difference in mean redshift calculated via bootstrap resampling between HV and NV subgroups is (at 3.9 significance), with the HV subgroup having (on average) lower redshift than the NV subgroup. If splitting the entire sample into low- and high- subgroups based on the median redshift (), the mean of the high- subgroup is 400 km s-1 lower than that of the low- subgroup at a 5 significance. Applying the phase correction (e.g., from Foley et al., 2011) on our measurements does not change the trend. This result is neither sensitive to the criterion used to separate the HV and NV subgroups. By randomly varying the criterion between 11500 and 12500 km s-1, the K-S tests all give a probability below 0.01% that HV and NV SNe Ia have the same redshift distribution. The mean in bins of redshift can be found in Table 2. Here we only create one redshift bin for SNe at since the trend does not change significantly over there (possibly due to the small number of SNe), and increasing the number of bins does not help identify further trends. Fig. 7 shows the cumulative fractions of for low- and high- SNe Ia separated by the median redshift of the sample. It is also evident that the lower- and higher- subgroups have very different distributions (a -value of 0.004 from the K-S test), with the higher- subgroup having generally lower than the lower- subgroup. This is consistent with the result in Foley (2012), although their trend is insignificant (a -value of 0.1) due to the relatively small sample size.
| redshift | mean | Num. of SNe |
|---|---|---|
| ( km s-1) | ||
| 11467 91 | 128 | |
| 11095 89 | 112 | |
| 10970 85 | 93 | |
| 10804 72 | 94 | |
| 10941 158 | 32 |
Considering only the SNe from un-targeted surveys (wide-field rolling search for supernovae, e.g., PTF, Foundation, SDSS-II, and SNLS), the fraction of HV SN Ia in the low- subgroup (as separated by the median redshift) is 16% (23 out of 146). This fraction decreases to 11% (16 out of 151) for the high- subgroup. Assuming the same rate as that of the low- subgroup, we expect 25 HV SNe Ia to be found in the high- subgroup. With this, we determine a Poisson probability for 16 or less HV SNe Ia at the high- subgroup to be 3.5%, indicating that the HV SNe Ia at higher redshift are significantly fewer than what we would expect from the local Universe.
This trend should not be sensitive to either the selection effect or the completeness of the sample (see Section 4 for a discussion). Nevertheless, a relatively complete sample is investigated by applying the redshift cuts studied in Nicolas et al. (2021). The redshift cuts of , 0.31, and 0.60 are applied to the SDSS, PS1, and SNLS samples, respectively. Following Pan et al. (2014), we apply a redshift cut of to our low- sample. The result is shown in the right panel of Fig. 6. The same trend is obtained with this complete sample. A K-S test gives a probability of only 0.6% that HV and NV SNe Ia have similar redshift distributions.
In summary, we see a significant trend that HV and NV SNe Ia are likely to have different redshift distributions, in the sense that the HV SNe Ia tend to be rarer toward higher redshift. We discuss this result and potential caveats in Section 4.
 |
 |
4. Discussion
4.1. Evolution of silicon velocity
Pan (2020) proposed that the rate of HV SN Ia population may change with redshift, with fewer HV SNe Ia discovered at higher redshift. The prediction is based on a large sample of low- SNe Ia and their host galaxies, where they found HV SNe Ia have a strong preference to explode in massive galaxies. Previous observations have shown that the galaxy function tend to evolve with redshift, in the sense that galaxies at higher redshift contain on average less (e.g., Davidzon et al., 2017). This evolution was also identified with SN Ia host galaxies (Sullivan et al., 2010). These observations imply that SN Ia populations (concerning their ejecta velocities) may vary with time.
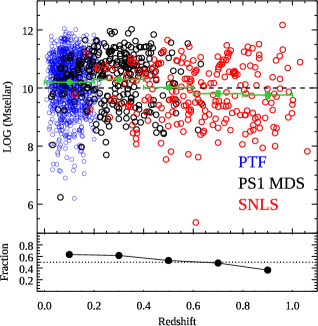
We revisit the trend between and redshift by compiling a large SN Ia host-galaxy sample spanning a wide range of redshift, including that from PTF (Pan et al., 2015), PS1-MDS (this work), and SNLS (Sullivan et al., 2010). The host-galaxy are all determined consistently (see Section 2.3.1). The result is shown in Fig. 8. It is evident that the low-mass galaxies tend to be lacking at higher redshift, as they are generally faint and more likely to be treated as hostless events. In spite of that, we identify a trend consistent with that found in Sullivan et al. (2010). The mean are , , , , , for redshift bins of 0.0 to 0.2, 0.2 to 0.4, 0.4 to 0.6 and 0.6 to 0.8, respectively. This trend indicates that the mean host-galaxy tends to decrease with redshift. The fraction of massive galaxies (, where the HV SNe Ia are preferentially found) are 63%, 62%, 53%, 49%, and 37%, from the lowest to highest redshift bins. Assuming that the HV SNe Ia predominantly reside in massive galaxies, it would be natural to expect fewer HV SNe Ia to be found at higher redshift, consistent with the trend found in Section 3.3. This indicates that the SN Ia ejecta velocity is likely to evolve with redshift. Alternatively, it could imply that the SN Ia demographics are likely to vary with redshift (considering multiple channels to produce SNe Ia; see Section 4.3 for a discussion).
The underlying mechanism to cause the preference of HV SNe Ia for exploding in the local Universe is still unclear. Theoretically, stellar populations in more massive galaxies tend to have (on average) higher metallicities (e.g., Tremonti et al., 2004). This implies that the HV SNe Ia may favor metal-rich environments. Alternatively, the predominant fraction of HV SNe Ia discovered near the present time may suggest that their progenitors could favor the scenarios of long delay time (i.e., the time between the progenitor star formation and the subsequent SN Ia explosion). This is also supported by the observations that more massive galaxies are likely to host older stellar populations (e.g., Gallazzi et al., 2005). Further investigations of their host environments will be crucial in the future to disentangle various effects.
4.2. Selection effect
 |
|
Here we discuss the potential selection effects which may produce the trend found in Section 3.3. Firstly, the Malmquist bias may mimic the trend between and redshift if the HV SNe Ia are systematically fainter than the NV SNe Ia. We would expect that the fraction of HV SNe Ia becomes lower at higher redshift. However, Wang et al. (2009) and Wang et al. (2013) have shown that the brightness of HV and NV SNe Ia are generally comparable (in terms of their -band absolute magnitudes). This is further supported by the relation between and LC width, where no significant trend was found by previous studies (e.g., Wang et al., 2009; Pan, 2020; Dettman et al., 2021). These findings make the Malmquist bias unlikely to be the underlying source that drives the preference of HV SNe Ia for exploding in the local Universe.
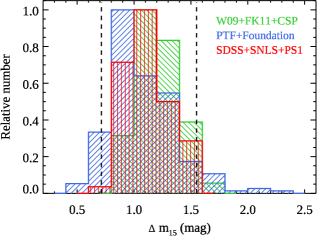
Fig. 9 shows the SN Ia (defined as -band decline 15 days after peak -band brightness) distributions of different sub-samples in this work. The is converted from the light-curve stretch parameters (e.g., Guy et al., 2007; Conley et al., 2008) measured by previous studies. We find that the distributions at different redshifts (as represented by different sub-samples) all cover the range of HV SNe Ia studied in this work ( mag, as indicated by the dashed lines in Fig. 9). However, it is noted that the low- samples tend to present an excess of extremely high- SNe (e.g., mag) compared to the high- samples. This is likely due to the selection effect since SNe with higher decline faster and are generally fainter than those with lower . Thus, they are harder to be detected at higher redshift. To examine if the difference in distributions could impact our results, we construct a new sub-sample by restricting the decline rates of our SNe to mag (i.e., consistent with the minimum and maximum an HV SN Ia can have in our sample), and re-measure the trend between and redshift. We find the new sub-sample shows a negligible difference in the dependence of on redshift compared to the original sample. A K-S test still gives a significantly low probability (a -value of 0.0009) that HV and NV SNe Ia have similar redshift distributions.
Finally, a possible selection effect may be introduced during our quality cut procedure if the strength of line depends on the ejecta velocity. If the HV SNe Ia have systematically weaker line, they could be more easily removed by our quality cut when the SNe were discovered at higher redshift and thus have spectra of lower S/N. However, an opposite trend was identified by previous studies (e.g., Wang et al., 2009) that the HV SNe Ia tend to show stronger line (i.e., lager EW) than that of NV SNe Ia. This actually strengthens the trend we found between and redshift.
4.3. Silicon velocity distribution
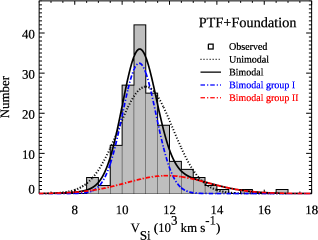
Zhang et al. (2020) studied the distribution with a large sample of low- SNe Ia. They found that the shows a significant bimodal Gaussian distribution, with one group having a mean km s-1 and the other group having a mean km s-1. Here we designate the SNe in these two velocity distributions as group-I (with lower mean ) and group-II (with higher mean ) to distinguish them from the conventional NV and HV SNe Ia. Zhang et al. (2020) calculated a population fraction of 65% and 35% for group-I and group-II SNe, respectively. While it is unclear if these populations are physically distinct, a bimodal Gaussian distribution can adequately describe the distribution of low- SNe Ia.
However, the results from Zhang et al. (2020) could be strongly biased, as a substantial fraction of their sample were discovered from the galaxy-targeted surveys (from the kaepora database; Siebert et al., 2019). This could affect the intrinsic population ratio of group-II to group-I SNe, given that the HV SNe Ia (predominantly in group-II) are preferentially discovered in massive galaxies. Here we revisit their works with SNe Ia discovered only in un-targeted surveys. We use the PTF and Foundation SNe (see Section 3.3 for the details) as our low- sample. The full PTF sample contains SNe Ia up to . To facilitate a better comparison with Zhang et al. (2020), we apply a redshift cut and use only SNe Ia at .
We repeat the same statistical technique (the maximum-likelihood method) as that performed in Zhang et al. (2020). This technique has the advantage that it is not sensitive to the bin size of the distribution during the fitting. The result is shown in the left panel of Fig. 10. We find a similar bimodal distribution with our sample. A modified version of Akaike Information Criterion (AICc; Sugiura, 1978) of 2580 and 2551 are calculated for unimodal fit and bimodal fit of our distribution, respectively. This indicates that the bimodal distribution gives a significantly better (e.g., a difference larger than 6; Mukherjee et al., 1998) fit than the unimodal fit. However, our low- SNe tend to show quite different population fractions and mean velocities between the two groups from that of Zhang et al. (2020). We measure a mean km s-1 and km s-1 for group-I and group-II SNe, respectively. The population fractions are 76% and 24% for group-I and group-II SNe, respectively. Our sample has an averagely lower (for both velocity groups), and a lower fraction of SNe in group-II than that of Zhang et al. (2020). The difference is likely due to the different strategies between the galaxy-targeted and un-targeted surveys. In principle, the un-targeted surveys should give a more intrinsic fraction of each velocity group than the targeted surveys.
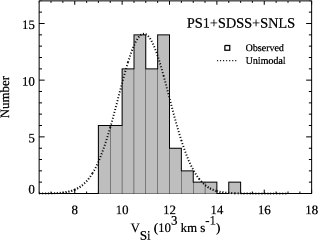
We next examine the distribution for SNe at higher redshift. The high- sample studied here is essentially the same as that in Section 3.3 (from the PS1-MDS, SDSS, and SNLS). The result is shown in the right panel of Fig. 10. In contrast to the low- sample, the bimodal distribution fails to provide a reasonable fit to our high- sample (thus we only present the unimodal fit in the figure). An AICc of 1198 and 1199 is calculated for unimodal fit and bimodal fit, respectively. This indicates that the bimodal distribution is not favored over the unimodal distribution. A mean km s-1 is determined from the unimodal fit.
It is unclear if the difference of distributions between the low- and high- samples is real or due to the relatively small size of the current high- sample. If it is real, our result may imply a potential change in demographics of SN Ia populations with redshift, which is in line with the trend we find in Section 3.3. It is also worth noting that the conventional criterion to separate the HV and NV SNe Ia (i.e., km s-1) cannot separate the two velocity groups unambiguously. There is a substantial overlap in the velocity space between group-I and group-II SNe. From the bimodal fit of our low- sample, there is 3.5% of SNe in group-I that are classified as HV SN Ia and 52.5% of SNe in group-II that are classified as NV SNe Ia. Studies on each individual group of SNe using this velocity criterion would unavoidably suffer some contamination from the other group. It may be possible that the difference in redshift distributions becomes more significant if we can split the sample into group-I and group-II unambiguously, rather than using the conventional NV and HV subgroups. Additional parameters (carbon features, host-galaxy properties, etc.) would be helpful to break the degeneracy in velocity space.
The large dispersion of found in group-II SNe could be linked to the detonations of sub-Chandrasekhar-mass WDs based on a few theoretical studies. Polin et al. (2019) studied the 1D sub-Chandrasekhar-mass WD explosion models and found they can produce a wide range of , including both HV and NV SNe Ia. Their results showed that the relation between SN Ia luminosity and could be well explained by two populations, with one associated with the Chandrasekhar-mass WD explosions and the other with the sub-Chandrasekhar-mass WD explosions. In contrast, Shen et al. (2021) used multi-dimensional radiation transport calculations and produced the bulk of observed SNe Ia from simply the double detonations of sub-Chandrasekhar-mass WDs. However, it is unclear if this scenario alone can explain the bimodal distribution found for low- SNe Ia. A large sample with well-measured ejecta velocities would be critical to better constrain the models in the future.
4.4. Implications on SN Ia cosmology
 |
|
Using a new SN Ia color model, Brout & Scolnic (2021) suggested that the SN Ia intrinsic scatter is likely dominated by the variation of the dust around SN. They found the SNe Ia in massive galaxies have on average lower than those in low-mass galaxies, and this difference can explain the trend between Hubble residuals and host-galaxy (e.g., Sullivan et al., 2010). They also showed that the SN Ia color distribution is inconsistent with a symmetric Gaussian distribution, with an excess of red SNe compared with the blue SNe, and these red SNe were found to present a larger scatter of distance modulus residuals than the blue SNe.
While Brout & Scolnic (2021) proposed that the host-galaxy correlation with SN Ia luminosity is due to the variation in dust properties rather than the luminosities of different progenitor systems, it is not clear yet whether this dust variation is intrinsic to the host galaxies (e.g., from the interstellar medium) or the SN progenitor systems. Different SN Ia explosion scenarios could result in very different dust properties at the SN location. For instance, theoretical studies suggested that the double detonations of sub-Chandrasekhar-mass WDs are likely to have intrinsically different dust properties from that of Chandrasekhar-mass WD explosions (e.g., Polin et al., 2019; Shen et al., 2021). They tend to be redder due to the line blanketing originating from the ashes of the helium shell (although this may also depend on the viewing angle in the model).
Observationally, Wang et al. (2009) suggested that the HV SN Ia prefers a reddening law of lower than that of NV SN Ia. Assuming most (if not all) of the SNe Ia in group-II share the same dust properties as that of HV SNe Ia, this may qualitatively explain the findings in Brout & Scolnic (2021), given their preference for lower and massive host galaxies. The group-II SNe represent only 24% of the total SNe Ia in our low- sample (see Section 4.3). However, this fraction will be raised to 40% if we only consider the SNe in galaxies of . This amount could substantially affect the average dust properties of SNe Ia in massive galaxies. On the other hand, Salim et al. (2018) found that the galaxy dust properties tend to vary with the stellar mass, with massive and quiescent galaxies having lower than that of star-forming galaxies. Although HV SN Ia host galaxies are generally massive, Pan et al. (2015) found that more than half of the HV SN Ia host galaxies are likely star-forming galaxies. Therefore, the dust from the interstellar medium alone seems challenging to explain the preference of HV SNe Ia for having a reddening law of lower . The unique dust properties of SNe in group-II may be related to their own progenitor systems rather than the global host-galaxy environment. If the group-II SNe have a sub-Chandrasekhar-mass origin, they could be an important source of distance uncertainties. This is also evident from the previous studies that showed SNe Ia in low-mass galaxies are better standard candles than those in massive galaxies (e.g., Kim et al., 2019). Nevertheless, separating the two groups unambiguously is challenging as indicated in Section 4.3.
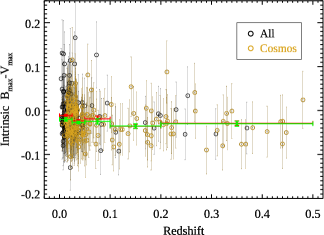
By examining the deviations from a zero-color SN Ia that is corrected for host-galaxy reddening, Foley et al. (2011) determined the intrinsic color (at peak luminosity) for a sample of SNe Ia. They found the velocity is correlated with the SN intrinsic color, with higher-velocity SNe being intrinsically redder than the lower-velocity counterparts (the so-called velocity-color relation). Given the significant trend between and redshift, it is expected that the intrinsic color of SN Ia also changes with redshift. We look into this relation by examining the SN intrinsic color as a function of redshift with our sample. A sub-sample of our SNe in the cosmological sample from Scolnic et al. (2018) and Dettman et al. (2021) is also compared to evaluate the effect on cosmology. We do not include the PTF SNe in this comparison since they were not fitted consistently with SALT2 in our cosmological sample. Here the SN intrinsic color is converted directly from the with the velocity-color relation studied in Foley et al. (2011). The result is shown in Fig. 11. It is evident that the mean intrinsic color of SN Ia also decreases with redshift, with the SNe at being 0.015 mag redder than those at (at 4.3 significance). However, this trend vanishes () if we only consider the SNe in the cosmological sample. This indicates that the trend between velocity/color and redshift is likely caused by those HV and red SNe at the local Universe, and they can be effectively removed by the conventional cuts when building the cosmological sample.
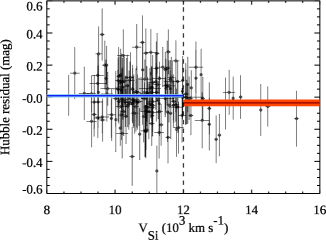
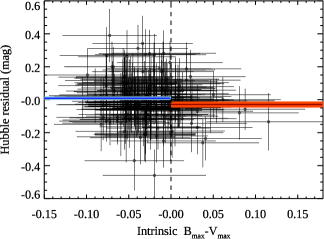
We next investigate the potential distance bias in cosmology by examining the relation between Hubble residual (HR) and parameters of interest. The HR is defined as the difference between the observed peak SN apparent magnitude (after the LC width and color correction) and that expected in the assumed cosmological model. Siebert et al. (2020) found a possible trend (in 2.7 ) between and HR, in the sense that higher-velocity SNe Ia tend to show negative average HRs, while lower-velocity SNe Ia tend to show positive average HRs. However, this trend becomes insignificant if using the SNe mainly discovered by un-targeted surveys (Dettman et al., 2021).
The HR as a function of and SN intrinsic color with our sample are shown in Fig. 12. They were measured from Scolnic et al. (2018) and Dettman et al. (2021) with SALT2 LC fitter. We find that the HV and redder (i.e., with positive intrinsic color) SNe tend to show negative average HRs, while their counterparts tend to show positive average HRs. Our results are generally consistent with the previous studies. However, the trends are not significant as probed by our larger sample, with a difference of mag (1.9) and mag (1.8) between the sub-groups in HR- and HR-color relations, respectively. This again demonstrates that the cosmological cuts play a critical role in removing those extreme SNe. However, as noted in Section 4.3, ejecta velocity alone may not be sufficient to separate different SN populations (if SNe Ia are produced via multiple channels), and that could lower the significance of the trend between HR and ejecta velocity. A better approach combining ejecta velocity and other parameters would be crucial in determining the potential distance bias.
5. Conclusions
In this paper, we measure the velocity () from SNe Ia discovered by the PS1-MDS and study the relation between ejecta velocity and other parameters, such as LC width, color, and host-galaxy . With the addition of SNe from other surveys, we compile a large spectroscopic sample across a wide range of redshift to study the as a function of redshift. Our main findings are:
-
We do not see significant trend between and LC parameters (e.g., and ). However, we note that the HV SNe Ia tend to be on the red side of the color distribution (with mag), consistent with previous studies that HV SNe Ia are on average redder than NV SNe Ia.
-
The relation between and host-galaxy derived in this work is consistent with that from low- studies. The HV SNe Ia tend to reside in massive galaxies, while NV SNe Ia can reside in both low-mass and massive galaxies.
-
By compiling a large spectroscopic dataset spanning a wide range of redshift, we find a significant probability () that HV and NV SNe Ia have distinct redshift distributions, with HV SNe Ia more likely to be found at lower redshift. This trend is not sensitive to either the selection effect or the criterion used to split the HV and NV samples. The result implies that the progenitor of HV SNe Ia (and possibly some NV SNe Ia) may favor a metal-rich environment and/or scenarios of long delay time.
-
We confirm the previous findings that the distribution of low- SNe Ia shows a significant bimodal distribution. The two groups substantially overlap in the velocity space, with a fraction of 76% and 24% for SNe in group-I and group-II, respectively. However, this bimodality becomes insignificant for the high- SNe, possibly due to either the smaller sample size or change in SN demographics.
-
Our results are also in line with recent cosmological studies, which showed the SNe Ia in massive galaxies have on average lower than those in low-mass galaxies. This can be possibly explained by assuming that a large fraction of SNe Ia in massive galaxies have similar dust properties as that of HV SNe Ia.
-
By converting the to the SN intrinsic color, we show that the SNe Ia tend to be intrinsically redder at the local Universe. However, this trend vanishes when considering only the SNe in the cosmological sample. We note that the HV (or intrinsically redder) SNe Ia tend to have negative average HRs than their counterparts, but the trend is not significant with our sample.
Future spectroscopic studies with precise measurements spanning a wide range of redshift would be crucial to differentiate between SN Ia explosion scenarios and investigate their potential evolution or change in demographics. These studies will enormously improve our understanding of the nature of SNe Ia and their use in cosmology.
acknowledgments
Y.-C.P. is supported by the Ministry of Science and Technology (MoST grant 109-2112-M-008-031-MY3).
References
- Abbott et al. (2019) Abbott, T. M. C., Allam, S., Andersen, P., et al. 2019, ApJ, 872, L30
- Aldering & Supernova Factory (2007) Aldering, G. S., & Supernova Factory, N. 2007, in American Astronomical Society Meeting Abstracts, Vol. 210, American Astronomical Society Meeting Abstracts #210, 82.07
- Astier et al. (2006) Astier, P., Guy, J., Regnault, N., et al. 2006, A&A, 447, 31
- Balland et al. (2009) Balland, C., Baumont, S., Basa, S., et al. 2009, A&A, 507, 85
- Balland et al. (2018) Balland, C., Cellier-Holzem, F., Lidman, C., et al. 2018, A&A, 614, A134
- Blondin & Tonry (2007) Blondin, S., & Tonry, J. L. 2007, ApJ, 666, 1024
- Blondin et al. (2006) Blondin, S., Dessart, L., Leibundgut, B., et al. 2006, AJ, 131, 1648
- Bronder et al. (2008) Bronder, T. J., Hook, I. M., Astier, P., et al. 2008, A&A, 477, 717
- Brout & Scolnic (2021) Brout, D., & Scolnic, D. 2021, ApJ, 909, 26
- Brout et al. (2022) Brout, D., Scolnic, D., Popovic, B., et al. 2022, ApJ, 938, 110
- Cardelli et al. (1989) Cardelli, J. A., Clayton, G. C., & Mathis, J. S. 1989, ApJ, 345, 245
- Cepa et al. (2003) Cepa, J., Aguiar-Gonzalez, M., Bland-Hawthorn, J., et al. 2003, in Society of Photo-Optical Instrumentation Engineers (SPIE) Conference Series, Vol. 4841, Instrument Design and Performance for Optical/Infrared Ground-based Telescopes, ed. M. Iye & A. F. M. Moorwood, 1739–1749
- Childress et al. (2014) Childress, M. J., Filippenko, A. V., Ganeshalingam, M., & Schmidt, B. P. 2014, MNRAS, 437, 338
- Conley et al. (2008) Conley, A., Sullivan, M., Hsiao, E. Y., et al. 2008, ApJ, 681, 482
- Davidzon et al. (2017) Davidzon, I., Ilbert, O., Laigle, C., et al. 2017, A&A, 605, A70
- Dettman et al. (2021) Dettman, K. G., Jha, S. W., Dai, M., et al. 2021, ApJ, 923, 267
- Dressler et al. (2011) Dressler, A., Bigelow, B., Hare, T., et al. 2011, PASP, 123, 288
- Faber et al. (2003) Faber, S. M., Phillips, A. C., Kibrick, R. I., et al. 2003, in Society of Photo-Optical Instrumentation Engineers (SPIE) Conference Series, Vol. 4841, Instrument Design and Performance for Optical/Infrared Ground-based Telescopes, ed. M. Iye & A. F. M. Moorwood, 1657–1669
- Fabricant et al. (1998) Fabricant, D., Cheimets, P., Caldwell, N., & Geary, J. 1998, PASP, 110, 79
- Fabricant et al. (2005) Fabricant, D., Fata, R., Roll, J., et al. 2005, PASP, 117, 1411
- Foley (2012) Foley, R. J. 2012, ApJ, 748, 127
- Foley & Kasen (2011) Foley, R. J., & Kasen, D. 2011, ApJ, 729, 55
- Foley et al. (2011) Foley, R. J., Sanders, N. E., & Kirshner, R. P. 2011, ApJ, 742, 89
- Foley et al. (2008) Foley, R. J., Filippenko, A. V., Aguilera, C., et al. 2008, ApJ, 684, 68
- Foley et al. (2018) Foley, R. J., Scolnic, D., Rest, A., et al. 2018, MNRAS, 475, 193
- Frieman et al. (2008) Frieman, J. A., Bassett, B., Becker, A., et al. 2008, AJ, 135, 338
- Gallazzi et al. (2005) Gallazzi, A., Charlot, S., Brinchmann, J., White, S. D. M., & Tremonti, C. A. 2005, MNRAS, 362, 41
- Gerardy et al. (2004) Gerardy, C. L., Höflich, P., Fesen, R. A., et al. 2004, ApJ, 607, 391
- Guy et al. (2007) Guy, J., Astier, P., Baumont, S., et al. 2007, A&A, 466, 11
- Hamuy et al. (2006) Hamuy, M., Folatelli, G., Morrell, N. I., et al. 2006, PASP, 118, 2
- Hook et al. (2004) Hook, I. M., Jørgensen, I., Allington-Smith, J. R., et al. 2004, PASP, 116, 425
- Howell et al. (2007) Howell, D. A., Sullivan, M., Conley, A., & Carlberg, R. 2007, ApJ, 667, L37
- Howell et al. (2005) Howell, D. A., Sullivan, M., Perrett, K., et al. 2005, ApJ, 634, 1190
- Jones et al. (2022) Jones, D. O., Kenworthy, W. D., Dai, M., et al. 2022, arXiv e-prints, arXiv:2209.05584
- Jones et al. (2019) Jones, D. O., Scolnic, D. M., Foley, R. J., et al. 2019, ApJ, 881, 19
- Kessler et al. (2009) Kessler, R., Becker, A. C., Cinabro, D., et al. 2009, ApJS, 185, 32
- Kim et al. (2019) Kim, Y.-L., Kang, Y., & Lee, Y.-W. 2019, Journal of Korean Astronomical Society, 52, 181
- Law et al. (2009) Law, N. M., Kulkarni, S. R., Dekany, R. G., et al. 2009, PASP, 121, 1395
- Li et al. (2021) Li, W., Wang, X., Bulla, M., et al. 2021, ApJ, 906, 99
- Maeda et al. (2010) Maeda, K., Benetti, S., Stritzinger, M., et al. 2010, Nature, 466, 82
- Maguire et al. (2014) Maguire, K., Sullivan, M., Pan, Y. C., et al. 2014, MNRAS, 444, 3258
- Maguire et al. (2018) Maguire, K., Sim, S. A., Shingles, L., et al. 2018, MNRAS, 477, 3567
- Marshall et al. (2008) Marshall, J. L., Burles, S., Thompson, I. B., et al. 2008, in Society of Photo-Optical Instrumentation Engineers (SPIE) Conference Series, Vol. 7014, Ground-based and Airborne Instrumentation for Astronomy II, ed. I. S. McLean & M. M. Casali, 701454
- Mazzali et al. (2005) Mazzali, P. A., Benetti, S., Altavilla, G., et al. 2005, ApJ, 623, L37
- Miknaitis et al. (2007) Miknaitis, G., Pignata, G., Rest, A., et al. 2007, ApJ, 666, 674
- Mukherjee et al. (1998) Mukherjee, S., Feigelson, E. D., Jogesh Babu, G., et al. 1998, ApJ, 508, 314
- Nicolas et al. (2021) Nicolas, N., Rigault, M., Copin, Y., et al. 2021, A&A, 649, A74
- Pakmor et al. (2022) Pakmor, R., Callan, F. P., Collins, C. E., et al. 2022, MNRAS, arXiv:2203.14990
- Pan (2020) Pan, Y.-C. 2020, ApJ, 895, L5
- Pan et al. (2015) Pan, Y. C., Sullivan, M., Maguire, K., et al. 2015, MNRAS, 446, 354
- Pan et al. (2014) Pan, Y.-C., Sullivan, M., Maguire, K., et al. 2014, MNRAS, 438, 1391
- Perlmutter et al. (1999) Perlmutter, S., Aldering, G., Goldhaber, G., et al. 1999, ApJ, 517, 565
- Phillips (1993) Phillips, M. M. 1993, ApJ, 413, L105
- Polin et al. (2019) Polin, A., Nugent, P., & Kasen, D. 2019, ApJ, 873, 84
- Rest et al. (2014) Rest, A., Scolnic, D., Foley, R. J., et al. 2014, ApJ, 795, 44
- Riess et al. (1996) Riess, A. G., Press, W. H., & Kirshner, R. P. 1996, ApJ, 473, 88
- Riess et al. (1998) Riess, A. G., Filippenko, A. V., Challis, P., et al. 1998, AJ, 116, 1009
- Riess et al. (2007) Riess, A. G., Strolger, L.-G., Casertano, S., et al. 2007, ApJ, 659, 98
- Salim et al. (2018) Salim, S., Boquien, M., & Lee, J. C. 2018, ApJ, 859, 11
- Salpeter (1955) Salpeter, E. E. 1955, ApJ, 121, 161
- Schmidt et al. (1989) Schmidt, G. D., Weymann, R. J., & Foltz, C. B. 1989, PASP, 101, 713
- Scolnic et al. (2018) Scolnic, D. M., Jones, D. O., Rest, A., et al. 2018, ApJ, 859, 101
- Shen et al. (2021) Shen, K. J., Boos, S. J., Townsley, D. M., & Kasen, D. 2021, ApJ, 922, 68
- Siebert et al. (2020) Siebert, M. R., Foley, R. J., Jones, D. O., & Davis, K. W. 2020, MNRAS, 493, 5713
- Siebert et al. (2019) Siebert, M. R., Foley, R. J., Jones, D. O., et al. 2019, MNRAS, 486, 5785
- Silverman et al. (2015) Silverman, J. M., Vinkó, J., Marion, G. H., et al. 2015, MNRAS, 451, 1973
- Sugiura (1978) Sugiura. 1978, Communications in Statistics - Theory and Methods, 7, 13
- Sullivan et al. (2009) Sullivan, M., Ellis, R. S., Howell, D. A., et al. 2009, ApJ, 693, L76
- Sullivan et al. (2010) Sullivan, M., Conley, A., Howell, D. A., et al. 2010, MNRAS, 406, 782
- Sullivan et al. (2011) Sullivan, M., et al. 2011, ApJ, 737, 102
- Suzuki et al. (2012) Suzuki, N., et al. 2012, ApJ, 746, 85
- Tremonti et al. (2004) Tremonti, C. A., Heckman, T. M., Kauffmann, G., et al. 2004, ApJ, 613, 898
- Walker et al. (2011) Walker, E. S., Hook, I. M., Sullivan, M., et al. 2011, MNRAS, 410, 1262
- Wang et al. (2003) Wang, L., Baade, D., Höflich, P., et al. 2003, ApJ, 591, 1110
- Wang et al. (2019) Wang, X., Chen, J., Wang, L., et al. 2019, ApJ, 882, 120
- Wang et al. (2013) Wang, X., Wang, L., Filippenko, A. V., Zhang, T., & Zhao, X. 2013, Science, 340, 170
- Wang et al. (2009) Wang, X., Filippenko, A. V., Ganeshalingam, M., et al. 2009, ApJ, 699, L139
- Yaron & Gal-Yam (2012) Yaron, O., & Gal-Yam, A. 2012, PASP, 124, 668
- Zhang et al. (2020) Zhang, K. D., Zheng, W., de Jaeger, T., et al. 2020, MNRAS, 499, 5325
 |
 |
| SN Name | Telescope | MJD | Phase (days) | source | |
|---|---|---|---|---|---|
| PS1-909006 | Gemini | 55098 | 17.1 | 0.283 | host |
| PS1-909010 | Gemini | 55105 | 6.4 | 0.276 | host |
| PS1-910016 | Gemini | 55125 | 19.7 | 0.22 | SN |
| PS1-910017 | Gemini | 55125 | 12 | 0.32 | SN |
| PS1-910018 | Gemini | 55125 | 12.1 | 0.264 | host |
| PS1-910020 | Gemini | 55124 | 14.3 | 0.242 | host |
| PS1-910021 | Gemini | 55125 | 20.2 | 0.256 | host |
| PS1-000006 | Magellan | 55216 | 10 | 0.231 | host |
| PS1-000010 | Magellan | 55217 | 1.7 | 0.246 | host |
| PS1-000011 | Gemini | 55214 | 2.7 | 0.381 | host |
| PS1-000014 | Magellan | 55217 | 14.4 | 0.136 | host |
| PS1-000034 | Magellan,MMT | 55216,55527 | 6.7,255.0 | 0.253 | host |
| PS1-000038 | Magellan | 55217 | 11.5 | 0.151 | host |
| PS1-000091 | Gemini | 55213 | 2.7 | 0.153 | host |
| PS1-000142 | Gemini,MMT,MMT | 55216,55249,55294 | 1.6,24.6,56.0 | 0.437 | host |
| PS1-000174 | NOT,Gemini | 55233,55268 | 13.4,41.5 | 0.245 | host |
| PS1-000190 | Gemini | 55221 | 0.102 | host | |
| PS1-000196 | Magellan | 55216 | 0.350 | host | |
| PS1-000199 | Magellan | 55216 | 1.5 | 0.371 | host |
| PS1-000202 | Gemini,MMT | 55216,55297 | 0.8,50.8 | 0.619 | host |
| PS1-000215 | Magellan | 55217 | 0.466 | host | |
| PS1-000220 | Magellan | 55216 | 0.220 | host | |
| PS1-000236 | Gemini | 55233 | 18.8 | 0.196 | host |
| PS1-000248 | NOT | 55217 | 0.184 | host | |
| PS1-000420 | Magellan | 55217 | 0.311 | host | |
| PS1-010026 | FAST | 55244 | 0.032 | host | |
| PS1-010454 | NOT | 55263 | 2.0 | 0.081 | host |
| PS1-020021 | MMT | 55290 | 0.260 | host | |
| PS1-020090 | Keck | 55295 | 16.5 | 0.410 | host |
| PS1-020096 | MMT | 55294 | 10.8 | 0.226 | host |
| PS1-020132 | WHT,MMT | 55288,55297 | 10.2,18.0 | 0.151 | host |
| PS1-020176 | MMT | 55290 | 16.4 | 0.260 | host |
| PS1-020198 | Gemini | 55297 | 8.3 | 0.361 | host |
| PS1-030006 | MMT | 55294 | 4.1 | 0.503 | host |
| PS1-040111 | Gemini | 55330 | 4.3 | 0.370 | host |
| PS1-040137 | Gemini | 55330 | 2.8 | 0.447 | host |
| PS1-040150 | Gemini | 55330 | 0.382 | host | |
| PS1-040166 | Gemini | 55331 | 3.5 | 0.440 | host |
| PS1-040662 | UH88 | 55351 | 0.032 | host | |
| PS1-040780 | MMT | 55363 | 3.8 | 0.231 | host |
| PS1-040782 | MMT | 55364 | 9.0 | 0.337 | host |
| PS1-050003 | MMT | 55363 | 5.4 | 0.427 | host |
| PS1-050005 | MMT | 55363 | 6.7 | 0.528 | host |
| PS1-050088 | MMT | 55364 | 2.2 | 0.242 | host |
| PS1-050201 | MMT | 55365 | 7.1 | 0.550 | host |
| PS1-050221 | Gemini | 55384 | 13.5 | 0.530 | host |
| PS1-050251 | MMT | 55364 | 0.388 | host | |
| PS1-050291 | MMT | 55364 | 11.4 | 0.325 | host |
| PS1-050293 | MMT | 55364 | 6.5 | 0.360 | host |
| PS1-050296 | MMT | 55364 | 4.1 | 0.351 | host |
| PS1-050301 | MMT | 55365 | 5.4 | 0.347 | host |
| PS1-050303 | MMT | 55365 | 7.2 | 0.328 | host |
| PS1-050577 | MMT | 55364 | 0.459 | host | |
| PS1-050580 | MMT | 55365 | 0.450 | host | |
| PS1-050583 | MMT | 55365 | 0.42 | SN | |
| PS1-050596 | MMT | 55365 | 0.380 | host | |
| PS1-050601 | MMT | 55365 | 0.32 | SN | |
| PS1-050607 | MMT | 55365 | 0.439 | host | |
| PS1-070242 | Magellan | 55422 | 0.064 | host | |
| PS1-070955 | MMT | 55471 | 24.5 | 0.349 | host |
| PS1-080308 | MMT | 55473 | 11.3 | 0.338 | host |
| PS1-080646 | MMT | 55471 | 7.3 | 0.319 | host |
| PS1-080723 | MMT | 55479 | 4.2 | 0.431 | host |
| PS1-080735 | MMT | 55471 | 2.5 | 0.634 | host |
| PS1-090034 | MMT | 55487 | 0.028 | host | |
| PS1-090037 | MMT | 55487 | 13.8 | 0.145 | host |
| PS1-090201 | Gemini | 55485 | 1.3 | 0.509 | host |
| PS1-090275 | MMT | 55514 | 17.6 | 0.140 | host |
| PS1-091748 | MMT | 55514 | 6.2 | 0.148 | host |
| PS1-091869 | MMT | 55528 | 25.5 | 0.289 | host |
| PS1-100014 | MMT | 55540 | 20.5 | 0.31 | SN |
| PS1-100020 | Gemini | 55507 | 26.4 | 0.247 | host |
| PS1-100090 | MMT | 55539 | 28.3 | 0.173 | host |
| PS1-100101 | MMT | 55539 | 15.4 | 0.429 | host |
| PS1-100163 | MMT | 55539 | 12.7 | 0.318 | host |
| PS1-100206 | MMT,MMT | 55515,55540 | ,18.6 | 0.217 | host |
| PS1-100213 | MMT | 55540 | 15.0 | 0.275 | host |
| PS1-100358 | MMT | 55539 | 15.4 | 0.367 | host |
| PS1-100405 | MMT | 55539 | 4.8 | 0.103 | host |
| PS1-110024 | Gemini | 55547 | 0.509 | host | |
| PS1-110030 | MMT | 55540 | 0.178 | host | |
| PS1-110031 | MMT | 55558 | 10.0 | 0.289 | host |
| PS1-110033 | MMT | 55539 | 0.205 | host | |
| PS1-110034 | MMT | 55540 | 0.235 | host | |
| PS1-110036 | MMT | 55540 | 0.202 | host | |
| PS1-110425 | MMT | 55558 | 2.4 | 0.381 | host |
| PS1-110426 | MMT | 55559 | 7.0 | 0.64 | SN |
| PS1-110430 | MMT | 55558 | 3.2 | 0.421 | host |
| PS1-110431 | MMT | 55558 | 5.2 | 0.351 | host |
| PS1-110460 | MMT | 55558 | 0.200 | host | |
| PS1-110478 | MMT | 55558 | 2.6 | 0.265 | host |
| PS1-110536 | MMT | 55558 | 2.1 | 0.235 | host |
| PS1-110542 | MMT | 55559 | 6.4 | 0.427 | host |
| PS1-110567 | MMT | 55559 | 7.4 | 0.215 | host |
| PS1-110716 | MMT | 55570 | 3.8 | 0.316 | host |
| PS1-110721 | MMT | 55570 | 5.8 | 0.578 | host |
| PS1-110734 | MMT | 55570 | 0.1 | 0.402 | host |
| PS1-120044 | MMT,Magellan | 55571,55573 | 0.7,2.1 | 0.481 | host |
| PS1-120085 | MMT | 55570 | 0.322 | host | |
| PS1-120086 | Magellan | 55573 | 8.1 | 0.392 | host |
| PS1-120094 | Magellan | 55573 | 1.9 | 0.451 | host |
| PS1-120143 | MMT | 55571 | 3.2 | 0.174 | host |
| PS1-120225 | MMT | 55571 | 0.107 | host | |
| PS1-120243 | MMT | 55570 | 0.335 | host | |
| PS1-120336 | Magellan | 55592 | 6.3 | 0.161 | host |
| PS1-120369 | Magellan | 55590 | 4.7 | 0.330 | host |
| PS1-120400 | Magellan | 55573 | 0.351 | host | |
| PS1-120444 | Gemini | 55586 | 7.6 | 0.300 | host |
| PS1-120585 | Gemini | 55592 | 7.1 | 0.249 | host |
| PS1-120586 | Gemini | 55591 | 0.9 | 0.230 | host |
| PS1-130283 | MMT | 55614 | 11.2 | 0.077 | host |
| PS1-130308 | MMT | 55614 | 17.6 | 0.082 | host |
| PS1-130755 | MMT | 55615 | 15.1 | 0.293 | host |
| PS1-130862 | MMT | 55615 | 6.3 | 0.333 | host |
| PS1-130943 | MMT | 55615 | 0.30 | SN | |
| PS1-130945 | MMT | 55615 | 0.266 | host | |
| PS1-140152 | MMT | 55687 | 39.9 | 0.209 | host |
| PS1-150254 | MMT | 55687 | 7.2 | 0.275 | host |
| PS1-150455 | MMT | 55687 | 0.064 | host | |
| PS1-150457 | MMT | 55687 | 1.0 | 0.303 | host |
| PS1-150509 | MMT | 55687 | 4.3 | 0.293 | host |
| PS1-150522 | MMT | 55687 | 2.3 | 0.230 | host |
| PS1-151425 | MMT | 55716 | 19.0 | 0.328 | host |
| PS1-160039 | MMT | 55723 | 18.5 | 0.271 | host |
| PS1-160046 | MMT | 55717 | 6.9 | 0.107 | host |
| PS1-160066 | Gemini | 55723 | 4.2 | 0.531 | host |
| PS1-160070 | MMT | 55716 | 3.2 | 0.359 | host |
| PS1-160099 | MMT | 55716 | 14.2 | 0.100 | host |
| PS1-160126 | MMT | 55721 | 8.1 | 0.360 | host |
| PS1-160197 | MMT | 55717 | 4.6 | 0.354 | host |
| PS1-160198 | MMT | 55717 | 0.349 | host | |
| PS1-160200 | MMT | 55717 | 4.6 | 0.424 | host |
| PS1-160287 | MMT | 55717 | 7.0 | 0.51 | SN |
| PS1-170078 | Gemini | 55745 | 13.5 | 0.321 | host |
| PS1-170428 | Gemini | 55744 | 5.0 | 0.300 | host |
| PS1-170532 | MMT | 55769 | 0.107 | host | |
| PS1-180166 | MMT | 55825 | 53.9 | 0.148 | host |
| PS1-180313 | Gemini | 55769 | 0.510 | host | |
| PS1-180561 | MMT | 55808 | 19.9 | 0.229 | host |
| PS1-190209 | MMT | 55808 | 9.9 | 0.367 | host |
| PS1-190230 | Magellan | 55802 | 2.3 | 0.139 | host |
| PS1-190237 | MMT | 55825 | 20.0 | 0.229 | host |
| PS1-190260 | MMT | 55807 | 0.144 | host | |
| PS1-190340 | Magellan,MMT | 55803,55807 | , | 0.138 | host |
| PS1-200132 | GMOS | 55852 | 9.4 | 0.209 | host |
| PS1-300105 | MMT | 55801 | 15.4 | 0.092 | host |
| PS1-300179 | Magellan | 55802 | 9.0 | 0.179 | host |
| PS1-300220 | Magellan | 55802 | 0.094 | host | |
| PS1-310025 | MMT | 55828 | 30.7 | 0.157 | host |
| PS1-310039 | MMT | 55859 | 31.2 | 0.172 | host |
| PS1-310042 | MMT | 55829 | 15.3 | 0.239 | host |
| PS1-310051 | MMT | 55827 | 6.2 | 0.271 | host |
| PS1-310058 | MMT | 55827 | 5.2 | 0.43 | SN |
| PS1-310073 | Magellan | 55855 | 43.5 | 0.150 | host |
| PS1-310090 | Gemini | 55826 | 5.7 | 0.347 | host |
| PS1-310091 | MMT | 55827 | 4.6 | 0.508 | host |
| PS1-310146 | Gemini | 55839 | 1.5 | 0.480 | host |
| PS1-310161 | MMT | 55861 | 17.8 | 0.253 | host |
| PS1-310188 | MMT | 55828 | 2.9 | 0.319 | host |
| PS1-310238 | MMT | 55859,55887 | 16.2,38.0 | 0.284 | host |
| PS1-310260 | Gemini | 55839 | 7.2 | 0.52 | SN |
| PS1-310574 | MMT | 55860 | 15.9 | 0.237 | host |
| PS1-320099 | Magellan | 55856 | 7.6 | 0.380 | host |
| PS1-320258 | MMT | 55860 | 4.9 | 0.341 | host |
| PS1-320469 | MMT | 55894 | 18.2 | 0.371 | host |
| PS1-330022 | MMT | 55887 | 13.9 | 0.264 | host |
| PS1-330023 | MMT | 55887 | 8.7 | 0.181 | host |
| PS1-330056 | MMT | 55893 | 2.5 | 0.260 | host |
| PS1-330075 | MMT | 55893 | 0.06 | SN | |
| PS1-330083 | MMT | 55892 | 3.5 | 0.224 | host |
| PS1-330089 | MMT,Gemini | 55859,55887 | 2.9,3.7 | 0.349 | host |
| PS1-330106 | MMT | 55893 | 0.53 | SN | |
| PS1-330107 | MMT | 55893 | 0.23 | SN | |
| PS1-330112 | MMT | 55894 | 2.4 | 0.209 | host |
| PS1-330128 | MMT | 55893 | 2.5 | 0.321 | host |
| PS1-330143 | MMT | 55894 | 0.8 | 0.187 | host |
| PS1-330146 | MMT | 55894 | 1.4 | 0.135 | host |
| PS1-330176 | MMT | 55894 | 0.37 | SN | |
| PS1-340169 | MMT | 55924 | 0.390 | host | |
| PS1-340211 | MMT | 55926 | 0.272 | host | |
| PS1-340222 | MMT | 55925 | 0.255 | host | |
| PS1-340228 | MMT | 55925 | 0.18 | SN | |
| PS1-340229 | MMT | 55924 | 4.7 | 0.141 | host |
| PS1-340272 | MMT | 55925 | 0.195 | host | |
| PS1-340276 | Gemini | 55926 | 0.440 | host | |
| PS1-340334 | MMT | 55926 | 10.1 | 0.307 | host |
| PS1-350027 | MMT,Gemini | 55945,55947 | 3.2,5.1 | 0.306 | host |
| PS1-350047 | MMT | 55944 | 7.1 | 0.234 | host |
| PS1-350050 | MMT | 55945 | 0.405 | host | |
| PS1-350078 | Gemini | 55945 | 10.7 | 0.301 | host |
| PS1-350080 | MMT | 55953 | 3.4 | 0.286 | host |
| PS1-350083 | MMT,Gemini | 55945,55951 | ,4.7 | 0.368 | host |
| PS1-350091 | Gemini | 55945 | 0.511 | host | |
| PS1-350111 | Gemini | 55946 | 2.4 | 0.253 | host |
| PS1-350180 | MMT,Gemini | 55952,55953,55975 | 1.8,2.5,19.6 | 0.29 | SN |
| PS1-350192 | MMT | 55952 | 0.0 | 0.30 | SN |
| PS1-350219 | Gemini | 55948 | 0.347 | host | |
| PS1-350233 | Gemini,MMT | 55948,55953 | , | 0.169 | host |
| PS1-350235 | MMT | 55953 | 16.6 | 0.264 | host |
| PS1-350316 | MMT | 55952 | 0.080 | host | |
| PS1-350374 | Gemini | 55958 | 2.5 | 0.501 | host |
| PS1-350548 | MMT | 55952 | 0.181 | host | |
| PS1-350601 | Gemini | 55959 | 0.28 | SN | |
| PS1-350606 | Gemini | 55957 | 0.345 | host | |
| PS1-350607 | Gemini | 55957 | 0.55 | SN | |
| PS1-350630 | Gemini | 55951 | 0.305 | host | |
| PS1-350733 | Gemini | 55975 | 5.8 | 0.42 | SN |
| PS1-360112 | MMT | 55984 | 0.181 | host | |
| PS1-360139 | MMT | 55984 | 9.0 | 0.386 | host |
| PS1-360140 | MMT | 55984 | 7.7 | 0.23 | SN |
| PS1-360145 | MMT | 55984 | 4.9 | 0.199 | host |
| PS1-360156 | MMT | 55984 | 0.046 | host | |
| PS1-370066 | GTC | 56000 | 0.09 | SN | |
| PS1-370098 | Magellan | 56037 | 30.5 | 0.221 | host |
| PS1-370308 | MMT | 56013 | 5.7 | 0.201 | host |
| PS1-370329 | Gemini | 56010 | 3.0 | 0.477 | host |
| PS1-370344 | GTC | 56012 | 2.9 | 0.331 | host |
| PS1-370356 | FAST | 56010 | 0.026 | host | |
| PS1-370367 | Gemini | 56010 | 0.471 | host | |
| PS1-370369 | MMT | 56015 | 4.1 | 0.191 | host |
| PS1-370394 | MMT | 56014 | 7.2 | 0.33 | SN |
| PS1-370428 | MMT | 56015 | 7.1 | 0.178 | host |
| PS1-370498 | MMT | 56015 | 9.0 | 0.26 | SN |
| PS1-370563 | Magellan | 56037 | 11.3 | 0.185 | host |
| PS1-370566 | MMT | 56069 | 41.7 | 0.071 | host |
| PS1-370595 | Magellan | 56036 | 10.0 | 0.181 | host |
| PS1-380040 | Gemini | 56034 | 5.0 | 0.67 | SN |
| PS1-380199 | Gemini | 56065 | 18.0 | 0.46 | SN |
| PS1-380279 | Magellan | 56035 | 1.6 | 0.349 | host |
| PS1-380318 | Magellan | 56035,56038 | 7.1,9.4 | 0.338 | host |
| PS1-380378 | MMT | 56069 | 13.2 | 0.271 | host |
| PS1-390259 | MMT | 56127 | 67.2 | 0.122 | host |
| PS1-390264 | MMT | 56070 | 10.7 | 0.370 | host |
| PS1-390314 | GTC | 56076 | 0.140 | host | |
| PS1-390449 | MMT | 56069 | 0.25 | SN | |
| PS1-390471 | MMT | 56070 | 1.2 | 0.292 | host |
| PS1-390627 | MMT | 56070 | 0.160 | host | |
| PS1-420036 | NOT | 56115 | 0.078 | host | |
| PS1-420087 | Gemini | 56159 | 19.4 | 0.25 | SN |
| PS1-420136 | MMT | 56163 | 0.286 | host | |
| PS1-420159 | MMT | 56163 | 7.9 | 0.181 | host |
| PS1-420196 | MMT | 56187 | 16.7 | 0.30 | SN |
| PS1-420258 | MMT | 56187 | 15.4 | 0.275 | host |
| PS1-420352 | MMT | 56187 | 0.402 | host | |
| PS1-420407 | MMT | 56185 | 8.9 | 0.245 | host |
| PS1-420414 | MMT | 56186 | 7.4 | 0.293 | host |
| PS1-420417 | MMT | 56187 | 11.7 | 0.362 | host |
| PS1-430003 | MMT | 56186 | 7.0 | 0.329 | host |
| PS1-430004 | MMT | 56186 | 0.232 | host | |
| PS1-440005 | MMT | 56214 | 0.306 | host | |
| PS1-440008 | MMT | 56214 | 0.147 | host | |
| PS1-440039 | MMT | 56215 | 6.7 | 0.247 | host |
| PS1-440042 | KPNO | 56211 | 0.16 | SN | |
| PS1-440050 | MMT | 56215 | 0.286 | host | |
| PS1-440162 | MMT | 56214 | 0.420 | host | |
| PS1-440185 | GMOS | 56218 | 13.9 | 0.35 | SN |
| PS1-440236 | MMT | 56214 | 4.4 | 0.429 | host |
| PS1-440285 | MMT | 56214 | 16.8 | 0.179 | host |
| PS1-440509 | MMT | 56245 | 12.4 | 0.32 | SN |
| PS1-440639 | Gemini | 56243 | 9.0 | 0.526 | host |
| PS1-440643 | MMT | 56245 | 7.1 | 0.19 | SN |
| PS1-450020 | MMT | 56245 | 7.8 | 0.064 | host |
| PS1-450082 | MMT | 56246 | 0.25 | SN | |
| PS1-450175 | Magellan | 56248 | 7.2 | 0.520 | host |
| PS1-450290 | Gemini | 56252 | 0.49 | SN | |
| PS1-450339 | Gemini | 56250 | 0.41 | host | |
| PS1-460003 | MMT | 56304 | 22.6 | 0.151 | host |
| PS1-460004 | Magellan | 56306 | 39.0 | 0.21 | SN |
| PS1-460037 | Magellan | 56306 | 21.1 | 0.303 | host |
| PS1-460064 | Magellan | 56305 | 26.9 | 0.242 | host |
| PS1-460105 | MMT | 56304 | 12.6 | 0.211 | host |
| PS1-470001 | Magellan | 56306 | 0.094 | host | |
| PS1-470008 | Magellan | 56303 | 3.9 | 0.24 | SN |
| PS1-470015 | Magellan | 56303 | 5.8 | 0.338 | host |
| PS1-470041 | MMT | 56305 | 2.3 | 0.332 | host |
| PS1-470043 | MMT | 56305 | 0.07 | SN | |
| PS1-470047 | MMT | 56305 | 3.0 | 0.08 | SN |
| PS1-470232 | MMT | 56305 | 0.222 | host | |
| PS1-470240 | MMT | 56305 | 0.4 | 0.43 | SN |
| PS1-470244 | MMT | 56328 | 7.1 | 0.36 | SN |
| PS1-480058 | Tillinghast | 56328 | 4.9 | 0.034 | host |
| PS1-480059 | GTC | 56333 | 2.4 | 0.164 | host |
| PS1-480064 | MMT | 56327 | 1.8 | 0.243 | host |
| PS1-480464 | Magellan | 56340 | 0.221 | host | |
| PS1-480791 | Gemini | 56340 | 0.448 | host | |
| PS1-480794 | Gemini | 56340 | 0.335 | host | |
| PS1-490007 | Gemini | 56366 | 0.8 | 0.055 | host |
| PS1-490008 | Gemini | 56377 | 13.3 | 0.121 | host |
| PS1-490037 | Gemini | 56363 | 0.423 | host | |
| PS1-490521 | Gemini | 56369 | 0.341 | host | |
| PS1-500004 | MMT | 56396 | 18.0 | 0.250 | host |
| PS1-500038 | MMT | 56395 | 4.7 | 0.107 | host |
| PS1-500057 | MMT | 56395 | 1.3 | 0.38 | SN |
| PS1-500065 | MMT | 56397 | 22.9 | 0.285 | host |
| PS1-500100 | MMT | 56397 | 4.3 | 0.311 | host |
| PS1-500301 | Gemini | 56403 | 0.325 | host | |
| PS1-500504 | MMT | 56426 | 9.3 | 0.199 | host |
| PS1-500511 | MMT | 56425 | 5.9 | 0.335 | host |
| PS1-510006 | Gemini | 56419 | 0.433 | host | |
| PS1-510082 | MMT | 56426 | 0.080 | host | |
| PS1-510113 | MMT | 56425,56426 | 4.1,4.9 | 0.29 | SN |
| PS1-510251 | MMT | 56426 | 1.6 | 0.240 | host |
| PS1-510266 | Gemini,MMT | 56425,56425 | , | 0.440 | host |
| PS1-510457 | Gemini | 56425 | 0.503 | host | |
| PS1-510550 | MMT | 56450 | 9.9 | 0.241 | host |
| PS1-510578 | GTC,MMT | 56428,56449 | ,7.8 | 0.366 | host |
| PS1-510597 | MMT | 56449 | 7.4 | 0.46 | SN |
| PS1-510638 | MMT | 56449 | 7.7 | 0.27 | SN |
| PS1-520001 | MMT | 56451 | 0.068 | host | |
| PS1-520007 | Keck | 56452 | 0.26 | SN | |
| PS1-520008 | MMT | 56449 | 0.259 | host | |
| PS1-520016 | GTC | 56428 | 3.7 | 0.451 | host |
| PS1-520019 | MMT | 56450 | 8.3 | 0.263 | host |
| PS1-520022 | MMT | 56449 | 6.6 | 0.119 | host |
| PS1-520023 | MMT | 56451 | 7.9 | 0.268 | host |
| PS1-520062 | Keck | 56452 | 0.308 | host | |
| PS1-520071 | Keck | 56452 | 0.411 | host | |
| PS1-520077 | MMT | 56451 | 2.3 | 0.25 | SN |
| PS1-520107 | Keck | 56452 | 0.519 | host | |
| PS1-520188 | Gemini | 56474 | 0.280 | host | |
| PS1-530037 | Magellan | 56484 | 8.7 | 0.27 | SN |
| PS1-530061 | Magellan | 56484 | 0.088 | host | |
| PS1-530086 | Magellan | 56484 | 24.2 | 0.050 | host |
| PS1-530112 | MMT | 56486,56488 | ,0.6 | 0.315 | host |
| PS1-530129 | MMT | 56486 | 0.231 | host | |
| PS1-530175 | Magellan | 56484 | 0.15 | SN | |
| PS1-530219 | Magellan | 56485 | 9.8 | 0.33 | SN |
| PS1-530240 | Magellan | 56485 | 0.117 | host | |
| PS1-530249 | Magellan | 56485 | 0.28 | SN | |
| PS1-530251 | Gemini | 56486 | 0.412 | host | |
| PS1-530585 | Gemini | 56508 | 7.8 | 0.420 | host |
| PS1-540087 | Gemini | 56509 | 0.274 | host | |
| PS1-540095 | MMT | 56536 | 0.186 | host | |
| PS1-540118 | Gemini | 56510 | 0.475 | host | |
| PS1-540163 | Gemini | 56509 | 0.330 | host | |
| PS1-540181 | Gemini | 56517 | 0.309 | host | |
| PS1-550005 | Magellan | 56570 | 27.4 | 0.074 | host |
| PS1-550041 | Magellan | 56569 | 8.5 | 0.26 | SN |
| PS1-550096 | Magellan | 56569 | 0.225 | host | |
| PS1-550137 | Keck | 56571 | 8.7 | 0.321 | host |
| PS1-550154 | Magellan | 56569 | 0.210 | host | |
| PS1-550155 | Magellan | 56570 | 0.514 | host | |
| PS1-550197 | Magellan | 56569 | 3.6 | 0.248 | host |
| PS1-550202 | Magellan | 56569 | 0.421 | host | |
| PS1-550218 | Magellan | 56569 | 9.7 | 0.388 | host |
| PS1-560033 | MMT | 56602 | 22.3 | 0.082 | host |
| PS1-560054 | Gemini | 56574 | 0.480 | host | |
| PS1-560087 | MMT | 56607 | 1.5 | 0.307 | host |
| PS1-560116 | MMT | 56602 | 9.1 | 0.075 | host |
| PS1-560121 | MMT | 56602,56604 | 5.4,6.9 | 0.365 | host |
| PS1-560152 | MMT | 56605 | 5.8 | 0.25 | SN |
| PS1-570022 | MMT | 56603,56604 | 4.9,5.7 | 0.302 | host |
| PS1-570025 | MMT | 56605 | 0.30 | SN | |
| PS1-570051 | MMT | 56606 | 0.230 | host | |
| PS1-570056 | MMT | 56605,56607 | ,1.3 | 0.290 | host |
| PS1-570062 | MMT | 56605 | 9.1 | 0.124 | host |
| PS1-580104 | MMT | 56653 | 11.2 | 0.323 | host |
| PS1-580235 | Magellan | 56655 | 9.0 | 0.33 | SN |
| PS1-580239 | MMT | 56652 | 5.8 | 0.193 | host |
| PS1-580270 | MMT | 56650 | 8.5 | 0.296 | host |
| PS1-580274 | MMT | 56653,56654 | 6.8,7.5 | 0.330 | host |
| PS1-580275 | Magellan | 56663 | 5.9 | 0.383 | host |
| PS1-580276 | Magellan | 56655 | 2.5 | 0.339 | host |
| PS1-580300 | MMT | 56680 | 21.7 | 0.241 | host |
| PS1-580312 | Magellan | 56663 | 0.403 | host | |
| PS1-580327 | Magellan | 56657 | 0.40 | SN | |
| PS1-590002 | Magellan | 56663 | 0.199 | host | |
| PS1-590005 | Magellan | 56663 | 0.2 | 0.171 | host |
| PS1-590031 | Magellan | 56663 | 11.6 | 0.378 | host |
| PS1-590097 | Magellan | 56663 | 0.231 | host | |
| PS1-590194 | MMT | 56680 | 0.090 | host | |
| PS1-040201 | MMT | 55364 | 32.2 | 0.280 | host |
| PS1-090999 | MMT,MMT | 55514,55527 | 15.7,26.0 | 0.28 | SN |
| PS1-110719 | MMT | 55571 | 3.2 | 0.41 | SN |
| PS1-110728 | MMT | 55571 | 6.7 | 0.11 | SN |
| PS1-160214 | MMT | 55720 | 0.9 | 0.630 | host |
| PS1-440264 | MMT | 56215 | 10.4 | 0.30 | SN |
| PS1-480184 | MMT | 56328 | 0.331 | host | |
| PS1-520020 | MMT | 56450 | 0.117 | host | |
| PS1-560150 | MMT | 56602 | 9.7 | 0.200 | host |
| PS1-590191 | MMT | 56680 | 0.0 | 0.222 | host |
| SN Name | Redshift | Phase | ||
|---|---|---|---|---|
| () | (days) | ( km s-1) | ( km s-1) | |
| PS1-000011 | 0.381 | 2.7 | 128 | |
| PS1-000091 | 0.153 | 2.7 | 47 | |
| PS1-000142 | 0.437 | 1.6 | 151 | |
| PS1-000190 | 0.102 | 19 | ||
| PS1-010026 | 0.032 | 28 | ||
| PS1-010454 | 0.081 | 2.0 | 55 | |
| PS1-040111 | 0.370 | 4.3 | 40 | |
| PS1-040137 | 0.447 | 2.8 | 214 | |
| PS1-040166 | 0.440 | 3.5 | 82 | |
| PS1-070242 | 0.064 | 51 | ||
| PS1-100405 | 0.103 | 4.8 | 69 | |
| PS1-110033 | 0.205 | 45 | ||
| PS1-120143 | 0.174 | 3.2 | 19 | |
| PS1-120586 | 0.230 | 0.9 | 58 | |
| PS1-150455 | 0.064 | 44 | ||
| PS1-150522 | 0.230 | 2.3 | 68 | |
| PS1-160070 | 0.359 | 3.2 | 171 | |
| PS1-190230 | 0.139 | 2.3 | 40 | |
| PS1-300220 | 0.094 | 132 | ||
| PS1-330143 | 0.187 | 0.8 | 265 | |
| PS1-330146 | 0.135 | 1.4 | 92 | |
| PS1-340229 | 0.141 | 4.7 | 19 | |
| PS1-340272 | 0.195 | 194 | ||
| PS1-350083 | 0.368 | 4.7 | 113 | |
| PS1-350111 | 0.253 | 2.4 | 215 | |
| PS1-350233 | 0.169 | 126 | ||
| PS1-360112 | 0.181 | 96 | ||
| PS1-360145 | 0.199 | 4.9 | 314 | |
| PS1-360156 | 0.046 | 14 | ||
| PS1-370344 | 0.331 | 2.9 | 89 | |
| PS1-370369 | 0.191 | 4.1 | 17 | |
| PS1-440008 | 0.147 | 23 | ||
| PS1-450339 | 0.410 | 42 | ||
| PS1-480058 | 0.034 | 4.9 | 28 | |
| PS1-480464 | 0.221 | 15 | ||
| PS1-490007 | 0.055 | 0.8 | 21 | |
| PS1-500038 | 0.107 | 4.7 | 130 | |
| PS1-510266 | 0.440 | 76 | ||
| PS1-530240 | 0.117 | 51 | ||
| PS1-540163 | 0.330 | 56 | ||
| PS1-540181 | 0.309 | 93 | ||
| PS1-550096 | 0.225 | 164 | ||
| PS1-550154 | 0.210 | 199 | ||
| PS1-550197 | 0.248 | 3.6 | 130 | |
| PS1-560054 | 0.480 | 206 | ||
| PS1-590002 | 0.199 | 68 | ||
| PS1-590005 | 0.171 | 0.2 | 28 | |
| PS1-590194 | 0.090 | 15 | ||
| SDSS2372 | 0.181 | 2.1 | 197 | |
| SDSS2561 | 0.118 | 0.0 | 229 | |
| SDSS2789 | 0.290 | 3.9 | 151 | |
| SDSS2916 | 0.124 | 1.2 | 53 | |
| SDSS3080 | 0.174 | 189 | ||
| SDSS3592 | 0.087 | 0.2 | 84 | |
| SDSS5533 | 0.220 | 2.3 | 34 | |
| SDSS5549 | 0.121 | 0.3 | 174 | |
| SDSS6057 | 0.067 | 3.4 | 249 | |
| SDSS6315 | 0.267 | 2.7 | 44 | |
| SDSS6699 | 0.311 | 3.7 | 86 | |
| SDSS6933 | 0.213 | 0.4 | 52 | |
| SDSS6936 | 0.181 | 121 | ||
| SDSS7147 | 0.110 | 0.4 | 37 | |
| SDSS7475 | 0.322 | 3.1 | 68 | |
| SDSS7847 | 0.212 | 63 | ||
| SDSS10434 | 0.104 | 2.5 | 202 | |
| 04D1dc | 0.211 | 155 | ||
| 04D3nh | 0.340 | 4.5 | 221 | |
| 05D2ab | 0.323 | 65 | ||
| 05D2ah | 0.184 | 98 | ||
| 05D3ne | 0.169 | 110 | ||
| 06D3fp | 0.268 | 90 |