Cavity deformation and bubble entrapment during the impact of droplets on a liquid pool
Abstract
The impact of droplets on a liquid pool is ubiquitous in nature and important in many industrial applications. A droplet impacting on a liquid pool can result in the pinch-off of a regular bubble or entrap a large bubble under certain impact conditions. In this study, the cavity deformation and the bubble entrapment during the impact of droplets on a liquid pool are studied by combined experimental measurements and numerical simulations. The time evolution of the free surface profile obtained in the numerical simulation is in good agreement with the experimental results. The cavity created by the droplet impact affects the pinch-off of regular bubbles and the entrapment of large bubbles. The regular bubble pinch-off is the direct consequence of the capillary wave propagating downward along the interface of the cavity and merging at the bottom of the cavity. In contrast, the large bubble entrapment is due to the merging of the liquid crowns at the mouth of the cavity. Gravity and environmental pressure play important roles in cavity deformation and bubble entrapment after droplet impact on liquid pools. The maximum depth of the cavity decreases as the gravitational effect becomes stronger. The phenomenon of regular bubble pinch-off may disappear as the gravity decreases. We find that the regular bubble pinch-off can transform into large bubble entrapment when increasing environmental pressure. The size of the large bubble entrapped decreases with increasing the environmental pressure due to the larger difference in the pressure and the vorticity around the liquid crown at increased environmental pressure. Finally, the regime map of bubble entrapment after the droplet impact is obtained.
I Introduction
Droplet impact on liquid surfaces occurs in many natural and industrial processes, such as precipitation Raes et al. (2000), spray coating Guo, Lian, and Sussman (2016), fuel atomization Moreira, Moita, and Panão (2010), and spray cooling Horacek, Kiger, and Kim (2005); Kim, You, and Choi (2004); Shedd and Pautsch (2005); Xie et al. (2012). The outcomes of the impact mainly include bouncing Tang et al. (2019); Wang, Feng, and Zhao (2008); Beesabathuni et al. (2015), coalescence Blanchette and Bigioni (2009); Geri et al. (2017); Kulkarni et al. (2021), jet breakup Agbaglah et al. (2015); Liu et al. (2018); Pan and Hung (2010); Blanco-Rodriguez and Gordillo (2021); Das, Breuer, and Biswas (2022), and splashing Lee et al. (2015); Leng (2001); Motzkus, Gensdarmes, and Gehin (2011). In addition, the impact can result in the entrapment of air bubbles Deng, Anilkumar, and Wang (2007); Oguz and Prosperetti (1990); Haldar and Chakraborty (2018), which is often accompanied by high-speed jets Rein (1996). The bubble entrapment is known to be important for the generation of noise, the production of aerosols, and the transport of gases across the ocean surface Deane and Stokes (2002); Franz (1959); Pumphrey and Elmore (1990).
The pinch-off of bubbles after the droplet impact on liquid pools has been considered in many studies Franz (1959); Pumphrey and Walton (1988); Chen and Guo (2014); Ray, Biswas, and Sharma (2012); Morton, Rudman, and Liow (2000); Ray, Biswas, and Sharma (2015); Oguz and Prosperetti (1990); Pumphrey and Elmore (1990); Deng, Anilkumar, and Wang (2009, 2007). The impact creates a cavity at the impact point, and then a single bubble is pinched off at the cavity bottom as the cavity contracts, and this bubble was named a regular bubble. The Weber number can be used to indicate the ratio between inertial and capillary forces, where and are the density and surface tension coefficient of the fluid, and are the speed and diameter of the droplet, respectively. Bay et al. Ray, Biswas, and Sharma (2015) studied the effect of the inertial force on the crater shape just before collapse, and found that the crater width and wave swell angle (i.e., the angle of the crater cusp just before the crater collapses) increase as the We increases and the regular bubble pinch-off occurs for wave swell angles ranging from 100∘ to 120∘. Capillary waves were found to travel along the interface and merge at the cavity bottom to produce a regular bubble Deng, Anilkumar, and Wang (2009); Leng (2001); Rein (1996). The capillary number can be used to indicate the ratio between viscous and capillary forces, where is the fluid dynamic viscosity. The viscosity and the surface tension could affect the regular bubble pinch-off, and the regular bubble pinch-off cannot be found when the capillary number is larger than 0.6 Deng, Anilkumar, and Wang (2007). The regular bubble pinch-off was also studied numerically using the volume of fluid (VOF) method Berberovic et al. (2011); Morton, Rudman, and Liow (2000); Oguz and Prosperetti (1990); Ray, Biswas, and Sharma (2012). Oguz et al. Oguz and Prosperetti (1990) found that whether a bubble is entrapped or not is determined by the competition between the timescale for the cavity to achieve its maximum depth and the timescale of the capillary wave. Morton et al. Morton, Rudman, and Liow (2000) described the importance of the capillary wave propagation to the bubble pinch-off, and vortex rings were found in the process of the bubble pinch-off. The entrapped bubble was found to depend on the cavity shape and its maximum depth Ray, Biswas, and Sharma (2012). Chen et al. found Chen and Guo (2014) that both the lower and upper limits of the regular bubble entrapment region increased with the liquid viscosity, and scaling models for the lower and upper limits of regular bubble entrapment were proposed.
A large bubble can be entrapped after the closure of the crown during the droplet impact on a pool at large Weber numbers Xu et al. (2018); Bisighini et al. (2010). The size of the entrapped large bubble can be several times larger than the initial droplet Zou et al. (2012). Numerical and experimental studies on the cavity dynamics Deka et al. (2017) found that large bubbles were entrapped during the impact of prolate-shaped droplets. Large bubble entrapment was also found to be a vortex-driven phenomenon after the impact of an oscillating droplet Thoraval, Li, and Thoroddsen (2016).
The deformation of the cavity and the entrapment of bubbles result from the interplay of inertia, viscous force, surface tension, and gravity. Most existing studies focus on the effects of inertial force, viscous force, and surface tension force Deng, Anilkumar, and Wang (2007, 2009); Ray, Biswas, and Sharma (2015); Zeff et al. (2000). However, there are few studies on the effect of gravity, even though the gravitational force can significantly alter the evolution of the interface and affect bubble entrapment. The impact of droplets at high environmental pressure is crucial to many relevant applications, such as fuel atomization in internal combustion engines Panao and Moreira (2005); Singh et al. (2007) and the droplet impact in nuclear power plants Zhang, Ma, and Liu (2020); Kanazawa et al. (1995); Okawa et al. (2007). In addition, the impact of droplets at low gravity is also important to many relevant applications, such as spray cooling in moving systems and fire extinguishing in spacecraft Tao et al. (2013); Han, Tao, and Qin (2014). The effect of the environmental pressure has been proved to be very important during the impact of droplets on solid surfaces Xu, Barcos, and Nagel (2007); Xu, Zhang, and Nagel (2005). In addition, the effect of the environmental pressure was also important in the droplet impact on a liquid pool Klyuzhin et al. (2010); Marcotte et al. (2019). Klyuzhin et al. Klyuzhin et al. (2010) studied the effect of the environmental pressure on the droplet floating time when droplets impact a liquid pool at a low impact speed, and they found that the floating time decreases linearly with decreasing the environmental pressure. In addition, Marcotte et al. Marcotte et al. (2019) studied the effect of the environmental pressure on splashing when ethanol droplets impact liquid pools of different viscosities, and they found that decreasing the environmental pressure could suppress splashing for high-viscosity liquid pools but could not suppress splashing for low-viscosity liquid pools. In our study, the effect of the environmental pressure on bubble entrapment during droplet impact on liquid pools is studied.
In this paper, we focus on the cavity deformation and bubble entrapment after droplets impact a liquid pool. We aim to reveal the role of gravity and environmental pressure on regular bubble pinch-off and large bubble entrapment. The cavity shape and its depth are studied at different gravities in our simulations since the cavity shape and the timescale for the cavity to achieve its maximum depth are important to the bubble pinch-off. The regimes of bubble pinch-off and the theoretical threshold at different gravities are studied here, while previous studies Deng, Anilkumar, and Wang (2007); Oguz and Prosperetti (1990); Pumphrey and Elmore (1990); Deng, Anilkumar, and Wang (2009); Morton, Rudman, and Liow (2000); Ray, Biswas, and Sharma (2012); Chen and Guo (2014); Ray, Biswas, and Sharma (2015) mainly considered earth’s gravity. Inspired by previous research showing that the environmental pressure is important to the droplet impact on liquid pools Klyuzhin et al. (2010); Marcotte et al. (2019), we study the effect of the environmental pressure on the bubble entrapment during the impact process. The regimes of bubble entrapment at different environmental pressures are studied, and the regular bubble pinch-off is found to transform into large bubble entrapment as the environmental pressure increases, whereas the large bubble entrapment was previously observed mainly at large Weber numbers at standard environmental pressure Xu et al. (2018); Bisighini et al. (2010). The experimental setup is introduced in Sec. II. The numerical methodology is presented in Sec. III. Results are discussed and analyzed in Sec. IV, including the model validation, the effects of gravity and environmental pressure on the cavity deformation and bubble entrapment. Conclusions are summarized in Sec. V.
II Experimental setup
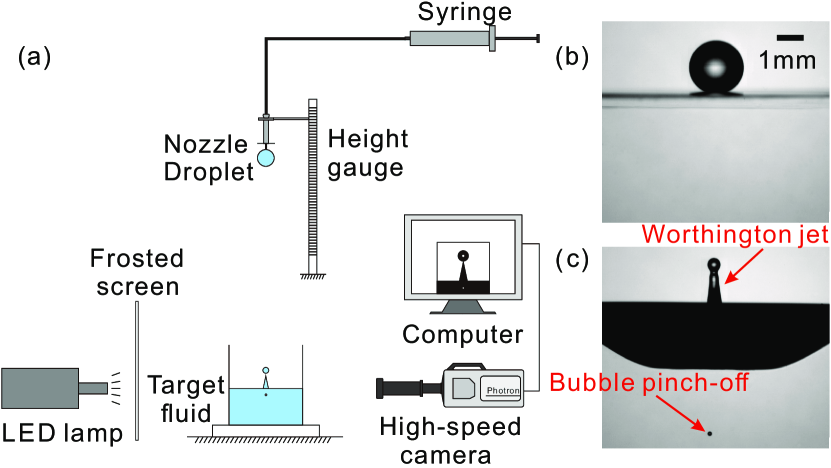
The setup for the impact experiment is schematically shown in Fig. 1. By pushing a syringe to produce a droplet at a syringe tip, the droplet fell and impacted the target liquid pool. The liquid pool is in an open acrylic container with a size of mm3. The width of the container is more than , and the depth of the container is more than 6 times the maximum depth of the cavity. The influence of the container’s wall on the impact process can be neglected. A high-speed camera (Photron Fastcam SA1.1) was used to film the impact process from the side. The resolution is pixels, corresponding to a spatial resolution of 15.9 . The frame rate is 6000 frames per second (fps), and the exposure time is 1/30000 seconds. An LED light was used as the light source, combined with a frosted screen to diffuse the light. A typical image at the impact instant is shown in Fig. 1b, and a typical regular bubble after the impact is shown in Fig. 1c. Using a customized image-processing program of Matlab, we measured the droplet size, the impact speed, and the cavity deformation from the images.
The droplet and the pool were prepared using the same liquid, a mixture of glycerin and water with a mass fraction of glycerin of 62%. The physical properties of the mixture were measured experimentally. We measured the density of the mixture by an electronic liquid densitometer (WLD-MD01, XIONGFA), measured the surface tension of the mixture by a platinum ring tensiometer (MC-1021, MINCE), and measured the dynamic viscosity of the mixture by a digital viscometer (NDJ-8S, SHANGPU). The room temperature is 26.5 ∘C. The density of the mixture is 1156 kg/m3, the surface tension is 68 mN/m, and the dynamic viscosity is 9.5 mPas.
III Numerical methodology
The system of droplet impact consists of two immiscible and incompressible phases, i.e., the liquid and air phases. The VOF method in OpenFOAM is employed for the simulation. The OpenFOAM version used in this study is OpenFOAM-2.1.x. The continuity equation and momentum equation are respectively
| (1) |
| (2) |
where is velocity vector, is dynamic viscosity, is gravitational acceleration, is pressure, is volume fraction, and is interfacial curvature, which can be calculated as
| (3) |
The interface is blurred due to numerical diffusion and the discretization of the convective term is important. To keep the sharp resolution of the interface, Weller Waller (2008) add an artificial convective term into the phase fraction equation
| (4) |
The third term on the left-hand side of Eq. (4) is an extra artificial convective term, where is the compression coefficient and in our study. The physical properties can be obtained from the volume fraction
| (5) |
| (6) |
where the subscripts and refer to the properties for liquid and gas, respectively. The interFoam solver, which has been used in many previous studies Chen and Guo (2014); Gupta and Kumar (2020); Hoang et al. (2013) to simulate incompressible multiphase flows, is employed in this study. Governing equations (1)-(3) are discretized using the finite volume method. Discretized linear matrices for the mass and momentum equations are solved using the Preconditioned BiConjugate Gradient (PBiCG) method and the Preconditioned Conjugate Gradient (PCG) method, respectively. A critical work for the volume fraction equation is to ensure the boundedness of the volume fraction. The multi-dimensional universal limiter with explicit solution (MULES) Damian (2013) developed from the flux correct transport (FCT) algorithm Boris and Book (1973) is used to ensure the boundedness of the volume fraction.
Since the process of cavity deformation and bubble entrapment is symmetric, axisymmetric simulations are performed by setting a wedge domain in cylindrical coordinate. The axial section of the computational domain is rectangular (20 mm 15 mm), and the depth of the pool is 10 mm. The droplet is initialized above the pool surface with a separation of . We set the bottom of the domain as a wall with a no-slip boundary, and the side and top as open boundaries. The initial speed of the droplet is . In the simulations of environmental pressure variation, the gas density is varied as the influence of pressure on the liquid density, liquid viscosity, and air viscosity is negligible. The properties of the air at different environmental pressures are obtained from NIST REFPROP, and the properties of the liquid are the same as that in experiments at 26.5 ∘C. The Weber number, as a ratio between the inertia and surface tension force, is varied by varying the droplet speed from 2.1 to 4 m/s. The Bond number , as a ratio between the gravitational and surface tension forces, is varied by varying the gravitational acceleration g from 0 to 10 . The Weber number is in a range of and the Bond number is in a range of , and the corresponding Froude number , a ratio between the inertia and gravitational force, is in a range of .
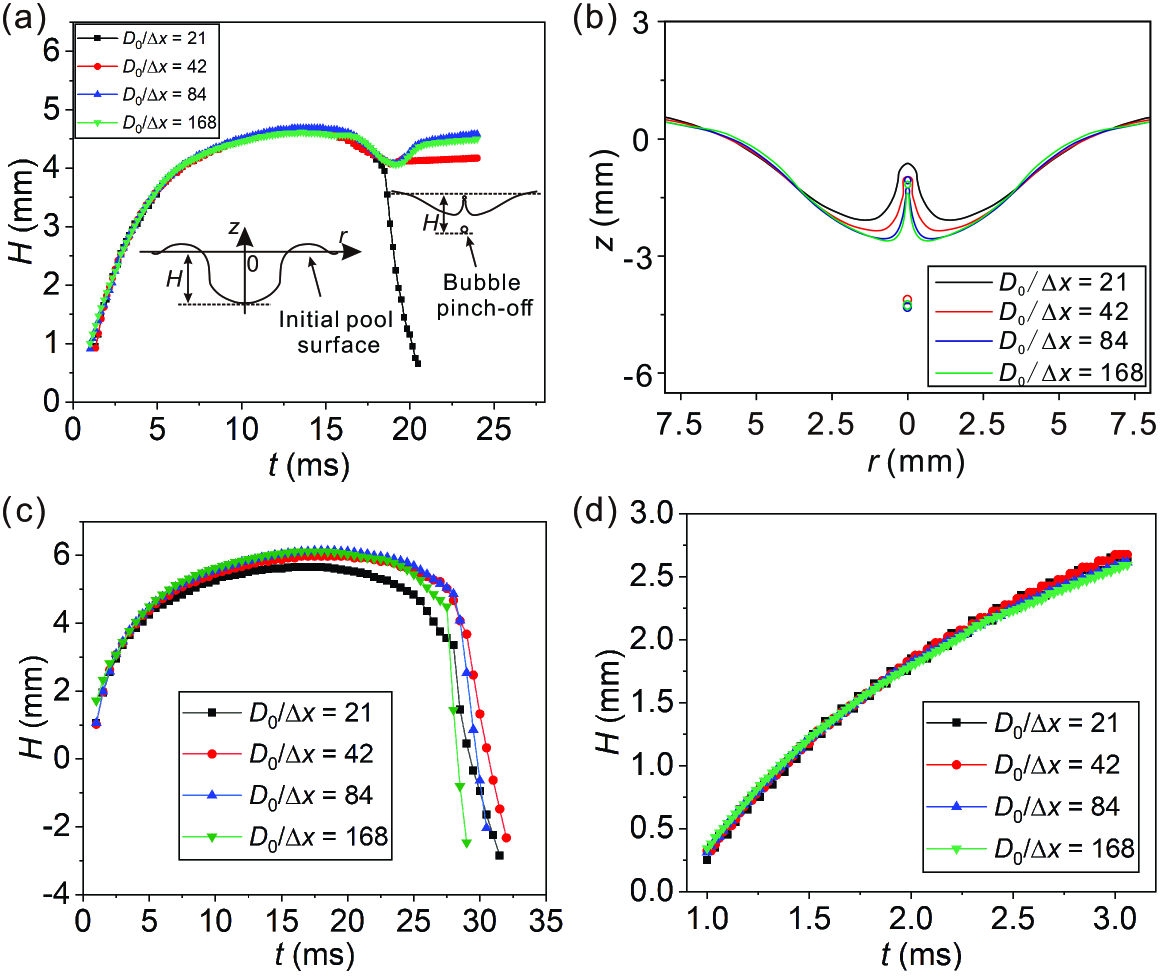
A grid-independence study for the impact process was performed, as shown in Fig. 2. Before the bubble pinch-off, the depth of the cavity was measured from the initial surface of the liquid pool to the bottom of the cavity, and after the bubble pinch-off, was measured from the initial surface of the liquid pool to the bottom of the regular bubble, as illustrated in Fig. 2a. The comparison of with different grid resolutions at is shown in Fig. 2a. We can see that when the grid resolution increases from 42 to 84, the maximum difference in after the droplet pinch-off is about 9.1 at 23.7 ms. However, when increases from 84 to 168, is very close, with a maximum difference of 2.2 at 23.7 ms, and thus the grid resolution of is sufficient for further simulations of the cavity deformation and the bubble pinch-off. Fig. 2b shows the gas-liquid interface profiles at 20.5 ms. The bubble pinch-off could not be captured using the coarse grid () at . If the grid resolution is higher than , the interface profiles were almost the same, and the bubble pinch-off could be captured well. Therefore, the grid resolution of is sufficient for further simulations of the cavity deformation and the bubble pinch-off. In addition, a grid independence study was also performed when the droplets impact at a higher We of 571 (the maximum Weber number considered in this study), and the results (Fig. 2c) show that if the grid resolution is higher than , the cavity depth is also independent of the grid resolution before 27 ms. After that is the formation of the Worthington jet, which is very fast, and there is still a slight deviation between the grids of and . The Worthington jet is not our main concern in this study because if the phenomenon of the regular bubble does not occur, we only consider the time evolution of the cavity before the cavity achieves its maximum depth. Therefore, the grid resolution of is sufficient for the simulations at a higher Weber number. To check the grid independence at higher environmental pressure, a grid-independence study was also performed when the droplet impacts at (the maximum environmental pressure considered in this study), as shown in Fig. 2d. In this scenario, the entrainment of a large bubble occurs soon (at about 3 ms) after the droplets impact at . The results show that the cavity depth when the droplet impacts at a higher environmental pressure is very close in different grid resolutions. Therefore, a grid resolution of was used for further simulations of the cavity deformation and the bubble entrainment.
IV Results and discussions
IV.1 Model validation
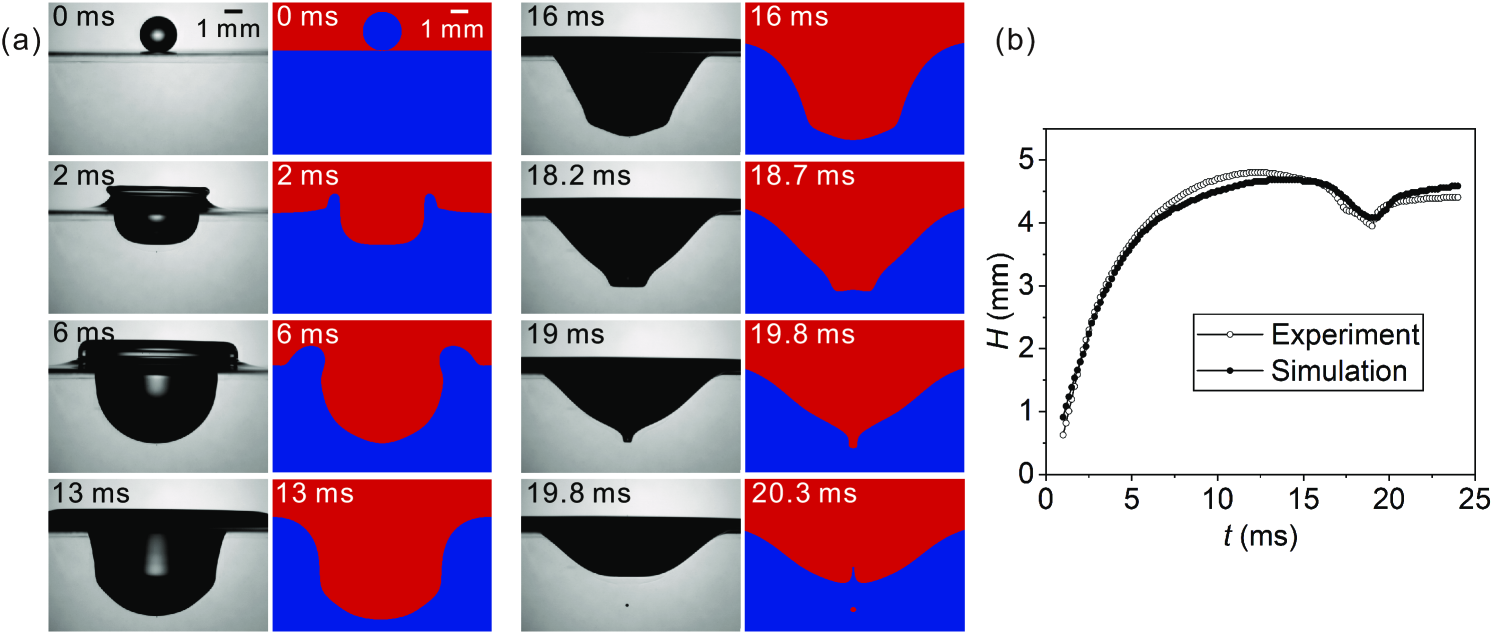
The accuracy of numerical simulation is validated against the droplet impact experimental data. The instant of the droplet impact is set as . The comparison of surface profiles between numerical simulation and experimental images is shown in Fig. 3a. The cavity develops into a hemisphere and then retracts, and a regular bubble is pinched off in the end. At the very beginning stages of the impact in the experiment, a very small bubble is seen at the base of the cavity. The small bubble is from the rupture of the air film between the bottom of the droplet and the pool surface Tang et al. (2019); Jian et al. (2020); Qi, Wang, and Che (2020); Tran et al. (2013); Lo, Liu, and Xu (2017); Langley, Li, and Thoroddsen (2017). Since it is very small and happens at the very early stage of the impact process, its effect on the cavity deformation and the subsequent bubble entrapment is negligible. Since this study mainly focuses on the evolution of the air cavity and the subsequent bubble entrapment, we do not attempt to resolve the formation of the small bubble in the numerical simulation, which requires a grid resolution of sub-micrometer and is very computational demanding. The comparison shows good agreement between the simulation and the experiment in the time evolution of the free surface profile. There is a slight mismatch in time between the numerical and experimental results in the last three frames. One reason is that the error in time accumulates during the simulation of the cavity evolution which is much longer than the pinch-off of the regular bubble, and another reason is the one-frame uncertainty in determining the exact time of drop impact () in the experimental sequences.
The cavity depth (before the bubble pinch-off) and the distance from the pool surface to the bottom of the regular bubble (after the bubble pinch-off) are used for the quantitative assessment of the numerical simulation. The comparisons between numerical and experimental results are shown in Fig. 3b. The cavity depth increases as it expands and then decreases as it retracts. After 20 ms, H increases further as the bubble moves downward in the liquid pool. The comparison shows good agreement between the simulation and the experiment, and indicates that the simulation can predict the cavity deformation and the bubble pinch-off.
IV.2 Effects of gravity
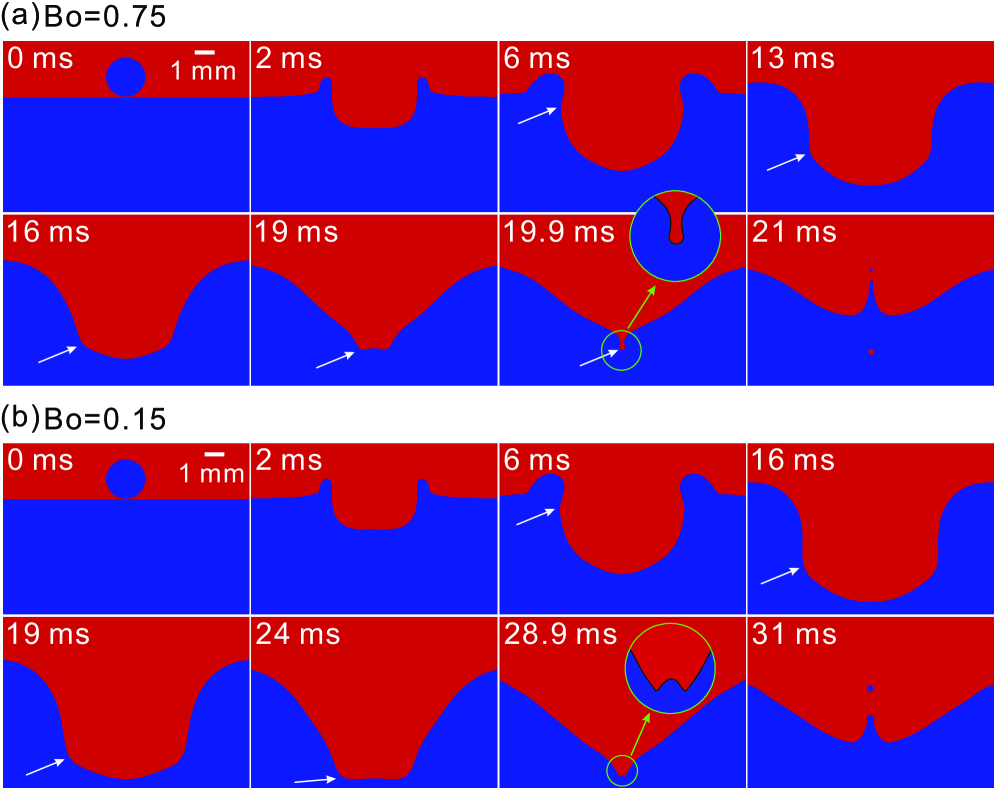
To analyze the effect of the gravitational force on the cavity deformation and bubble pinch-off, we study the cavity behaviors by varying the gravity from 0 to 10 m/s2 while fixing the other parameters. The evolution of the cavity at different Bond numbers is shown in Fig. 4. A regular bubble is pinched off at earth’s gravity (, see Fig. 4a). In contrast, at low gravity (), the phenomenon of regular bubble pinch-off disappears (see Fig. 4b).
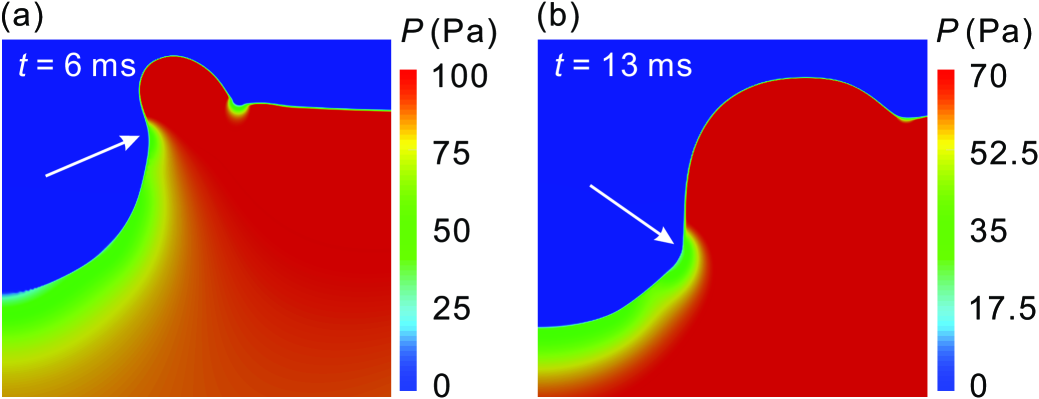
The front of the capillary wave can be seen from the sharp shape on the surface of the cavity, which is highlighted by white arrows in Fig. 4, and the origin of the capillary wave is due to the strong surface disturbance immediately after the initial contact of the impacting drop with the undisturbed liquid surface Morton, Rudman, and Liow (2000); Berberovic et al. (2009); Oǧuz and Prosperetti (1991); Mohamed-Kassim and Longmire (2004). When a capillary wave is created, the sharp curvature of the interface at the front of the capillary wave induces a strong variation of the local pressure Berberovic et al. (2009). The pressure distribution (see Fig. 5) shows that the front of the capillary wave separates the high-pressure region and the relatively low-pressure region. Therefore, the front of the capillary wave can be identified by the sharp curvature on the surface of the cavity. At earth’s gravity, the capillary wave propagates downward along the cavity surface, as shown at 13 ms in Fig. 4a. The capillary wave reaches the lowest point at the cavity bottom at 19.9 ms, producing a cylindrical air pocket (like a U shape) at the cavity bottom, as highlighted by the magnified image at 19.9 ms in Fig. 4a. Then the mouth of the cylindrical air pocket closes, and a regular bubble is pinched off. In contrast, at low gravity (), the interface at the cavity bottom alters its moving direction to the upward at 28.9 ms (see the magnified interface shape), and a jet is produced finally without regular bubble pinch-off.
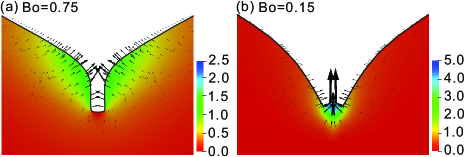
To further clarify the difference between the two scenarios, the velocity fields are compared in Fig. 6. At normal gravity (), the cavity surface moves inward, and the speed of the cavity surface is largest at the mouth of the air cylinder, and the speed of the interface at the bottom of the air cylinder is almost zero, as shown in Fig. 6a. Thus, the mouth of the cylinder closes at high speed to pinch off a regular bubble. In contrast, at low gravity (), the interface at the bottom of the cavity moves upward at high speed, which results in a high-speed jet and prevents the bubble pinch-off, as shown in Fig. 6b.
The evolution of the cavity depth before the formation of the Worthington jet is shown in Fig. 7a. Initially, the cavity depth increases rapidly due to the large inertia of the droplet fluid. As the droplet fluid sinks and the cavity expands, the growth of the cavity slows down, and the growth rate of the cavity depth decreases. After reaching a maximum cavity size, the cavity retracts due to the gravitational force. Therefore, the cavity depth decreases.
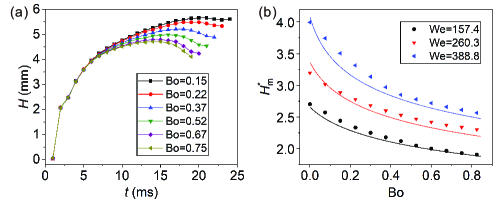
The maximum depth of the cavity is defined as the maximum depth measured from the initial pool surface to the bottom of the cavity along the axis of symmetry () before the formation of the Worthington jet. The time variation of the cavity depth in Fig. 7a also shows that the maximum cavity depth is affected by gravitational force. With increasing the gravity, the maximum cavity depth decreases, and the time to reach the maximum cavity depth decreases. This can be explained by the conversion and conservation of energy. The droplet’s initial energy includes kinetic and surface energy. The kinetic energy can be expressed as
| (7) |
The initial surface energy of the droplet is
| (8) |
The droplet’s initial kinetic energy and the surface energy are converted to the gravitational potential energy of the liquid crown and the surface energy of the cavity liquid. The increment in the gravitational potential energy is due to the liquid originally in the cavity position (before the droplet impact) moving to a higher position and forming the liquid crown (after the droplet impact). Therefore, the increment in the gravitational potential energy as the cavity expands to its maximum depth can be approximated as , where m is the mass of the elevated liquid and the elevated height of the liquid can be estimated by . Since the cavity can be approximated by a hemisphere when it expands to the maximum depth Berberovic et al. (2009); Bisighini et al. (2010); Engel (1966); Leng (2001), the mass of the elevated liquid can be expressed as . Therefore, the increment in the gravitational potential energy of the liquid crown as the cavity expands to its maximum depth can be expressed as
| (9) |
We ignore the kinetic energy of the liquid crown because the cavity can be assumed as quasi-stationary when it achieves its maximum depth. A precise calculation of the surface energy should consider the change in the surface area from the initial flat surface of the pool to the cavity and the crown, which is complex geometry and difficult to calculate directly. Since the cavity is almost hemispherical, we can simply estimate the scale of the variation of the surface area as . Hence, the variation in the surface energy can be estimated as
| (10) |
The droplet’s initial energy is approximately the sum of the increment of the surface energy of the cavity and the gravitational potential energy of the liquid crown,
| (11) |
By substituting Eqs. (7)-(10) into Eq. (11), we can get
| (12) |
where is the maximum dimensionless depth of the cavity and is defined as .
The maximum depth of the cavity at different gravities is shown in Fig. 7b. The symbols are the results of the numerical simulation, and the lines are the theoretical results predicted by Eq. (12). The comparison shows reasonable agreement between the simulation and the theoretical prediction. The maximum depth of the cavity decreases with increasing Bo, and increases with increasing We. The reason is that the droplet with a larger We has more inertia, which can be converted to more surface energy of the cavity, and thus produces a deeper cavity.
To determine the condition of regular bubble pinch-off, we produce a map of impact outcomes by varying the droplet speed and the gravitational acceleration , as shown in Fig. 8. Regular bubbles are produced when the inertia effect is strong (i.e., large We) and the gravitational force is large (i.e., large Bo). After the impact, capillary waves are formed near the impact point, and propagates inward and downward along the cavity surface. The pinch-off of a regular bubble occurs if the timescale for the cavity to achieve its maximum depth is smaller than the timescale of the capillary wave Morton, Rudman, and Liow (2000); Oguz and Prosperetti (1990). The timescale for the cavity to achieve its maximum depth Oguz and Prosperetti (1990) can be expressed as
| (13) |
where is the minimum speed of the capillary-gravity surface wave. The timescale of capillary wave is
| (14) |
where is the wavenumber, Oguz and Prosperetti (1990). Therefore, the threshold of regular bubble pinch-off can be expressed as
| (15) |
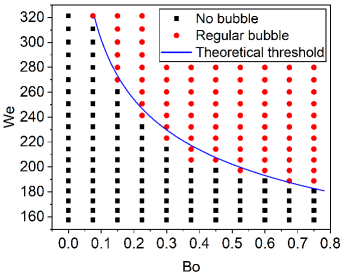
The line in Fig. 8 is the theoretical threshold of the bubble pinch-off predicted by Eq. (15). The threshold from the numerical results agrees well with scaling model predicted by Eq. (15), confirming the accuracy of the above theoretical analysis. The analysis also shows that the main role of the gravitational force in the pinch-off of regular bubbles is to induce capillary-gravity surface waves. If the gravitation force is strong, the capillary-gravity waves propagate quickly to create a cavity of a hemispherical shape. Then the capillary wave propagates to the lowest point of the cavity, producing a cylinder of air. Finally, the cylindrical air pocket pinches off to produce a regular bubble. If the gravitational force increases (i.e., Bo increases), the capillary-gravity waves propagate faster, and the pinch-off of regular bubbles becomes easier. Therefore, the threshold Weber number of bubble pinch-off decreases as the Bond number increases.
IV.3 Effects of the environmental pressure
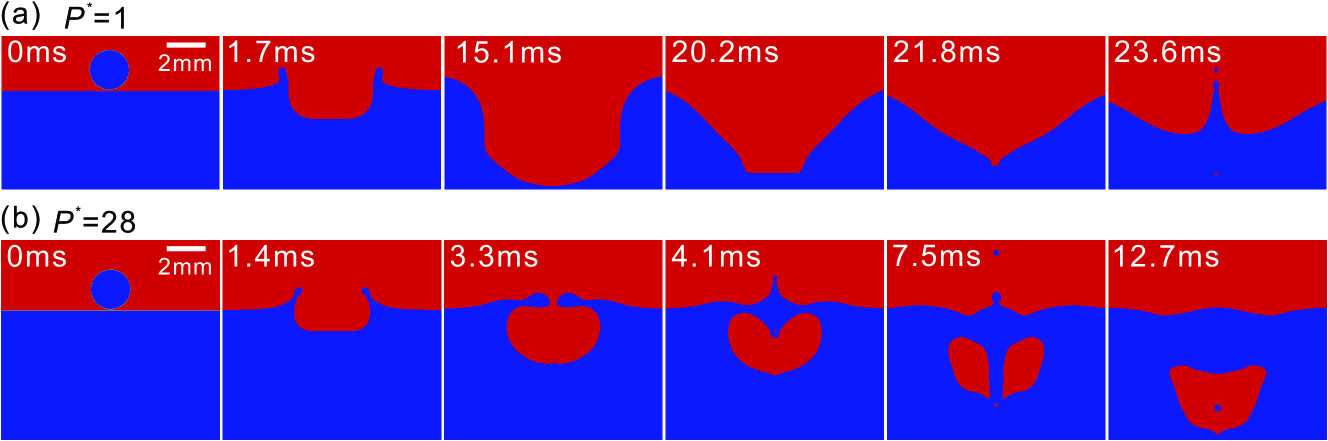
Environmental pressure plays an essential role in the impact of droplets on a liquid pool Klyuzhin et al. (2010); Marcotte et al. (2019), and its effect on bubble entrapment is discussed in this section. The evolution of the cavity at different environmental pressures is compared in Fig. 9. The relative pressure is used , where is the environmental pressure, and is the standard pressure, 1 bar. At standard environmental pressure , the crown moves upward and also outward, as shown at 1.7 ms in Fig. 9a. The capillary wave propagates inward along the cavity interface, and a cylindrical air pocket is produced at the bottom of the cavity at 21.8 ms, and the mouth of the cylindrical air pocket contracts to pinch off a regular bubble at 23.6 ms. In contrast, when the environmental pressure is high, the liquid crown moves upward and also inward, as shown at 1.4 ms in Fig. 9b for . The liquid crown becomes thicker as it moves inward. Then, the rim of the liquid crown collides, sealing a large bubble below the surface of the pool. Meanwhile, an upward jet and a downward jet are produced because of the inertia of the collision of the crown rim. Then, the downward jet punctures into the large bubble, which finally converges at the center. Meanwhile, the upward jet breaks up into secondary droplets owing to the jet’s capillary instability.
To analyze the mechanism of large bubble entrapment, we consider the vorticity field and the pressure field. Upon the impact, strong vorticity is induced at the interface. Then the vorticity detaches from the interface and forms a vortex ring. The pressure, vorticity, and velocity fields are shown in Figs. 10a and 10b. A pressure difference is found in the air phase between the two sides of the liquid crown, and the vorticity detaches from the crown surface to form a vortex ring, as shown at 1.4 ms in Fig. 10a. The variation of the vorticity and the pressure along the surface of the crown at a typical instant are plotted in Figs. 10c and 10d, respectively. As the environmental pressure increase, the vorticity becomes stronger, and the pressure difference between the two sides of the crown rim becomes larger. The stronger vortex and the larger pressure difference push the rim to bend inward and downward (see the velocity field in Fig. 10b and the shape of the crown rim in Fig. 10e). The crown rims finally contact and entrap a large bubble.
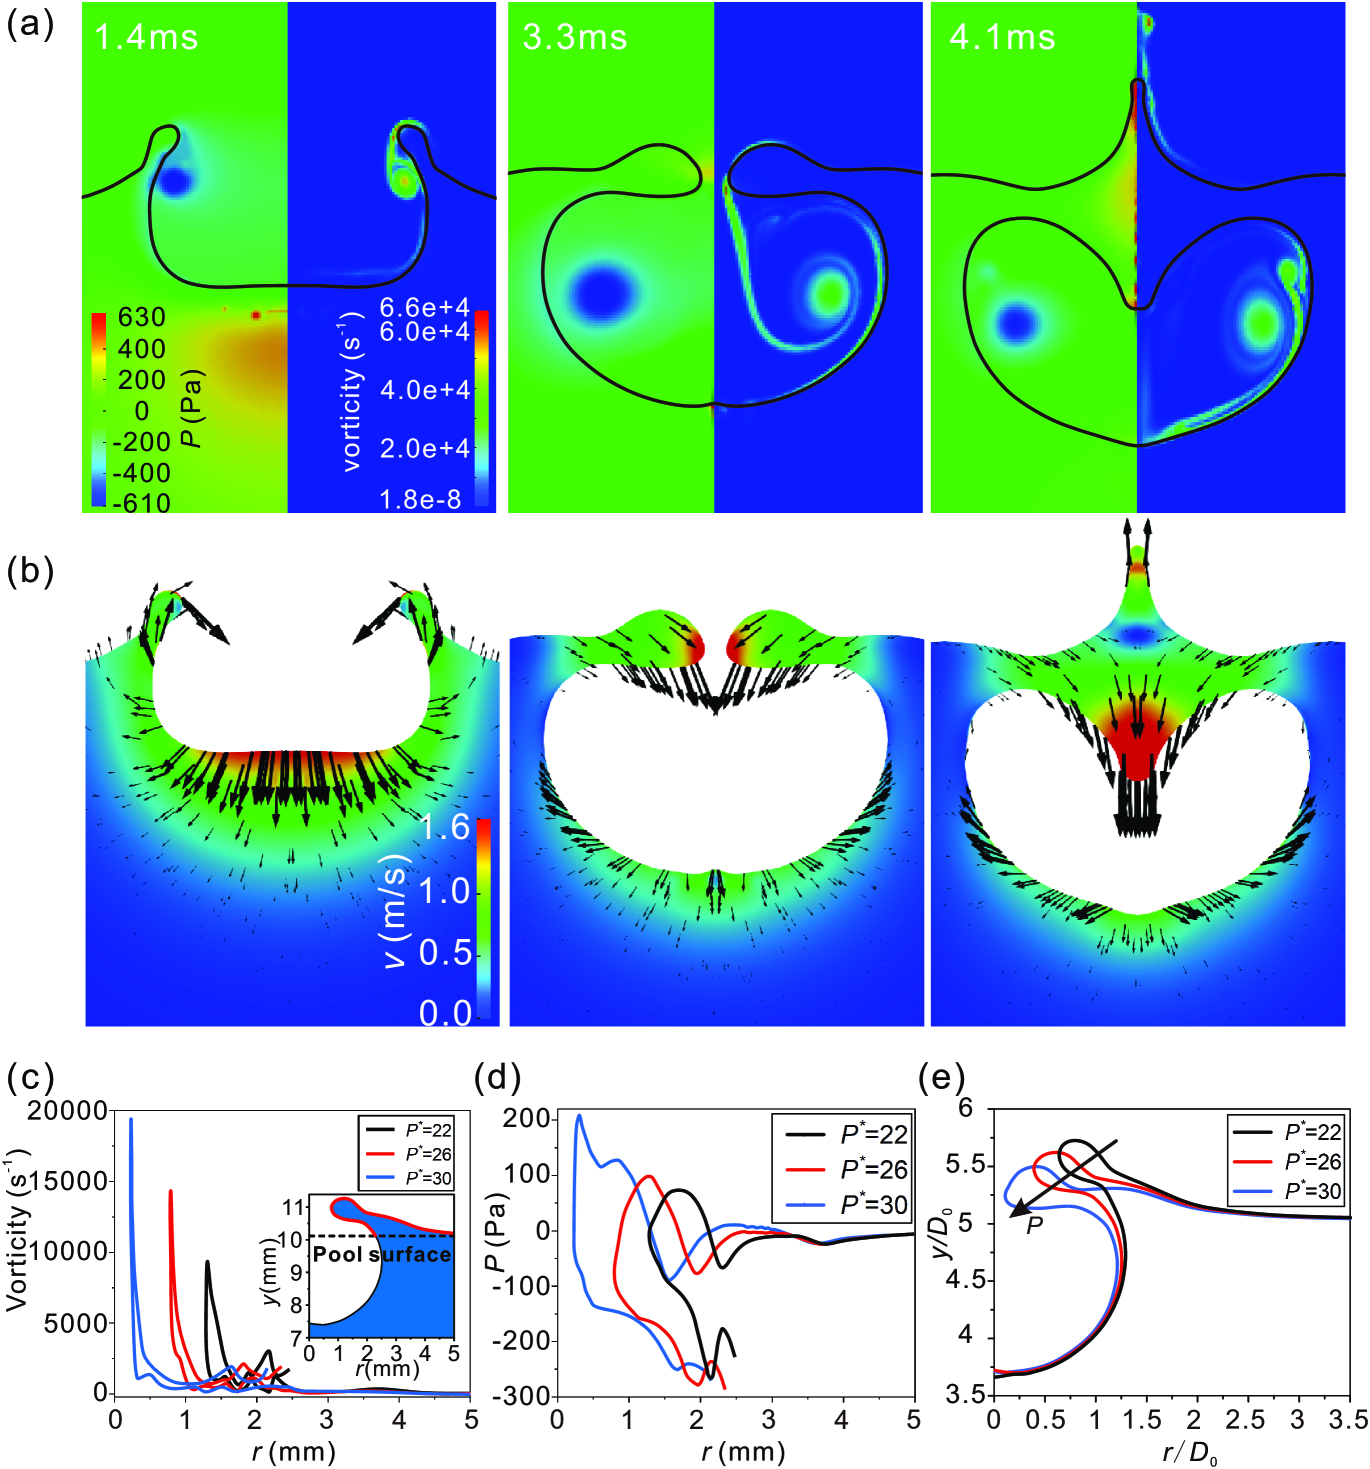
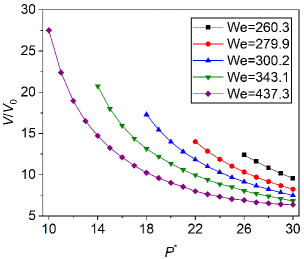
To characterize the entrapped large bubbles, we plot the volumes of large bubbles at different environmental pressures in Fig. 11. The bubble can be much larger than the initial droplet size. For example, at and , the volume of the large bubble is almost 27.5 times the initial droplet volume. The volume of the large bubble decreases with increasing environmental pressure. As environmental pressure increases, vorticity becomes stronger, and the pressure difference between the two sides of the crown rim becomes larger. The stronger vortex and the larger pressure difference push the crown to bend inward and downward. The bending degree of the crown increases with the environmental pressure (see Fig. 10e). Thus, the volume of the entrapped large bubble decreases as we increase the environmental pressure. The maximum volume of the large bubble occurs at the left end of each curve for a fixed We, as shown in Fig. 11. If the environmental pressure decreases further, the transition from large bubble to regular bubble occurs. The threshold for the transition will be discussed later in this section.
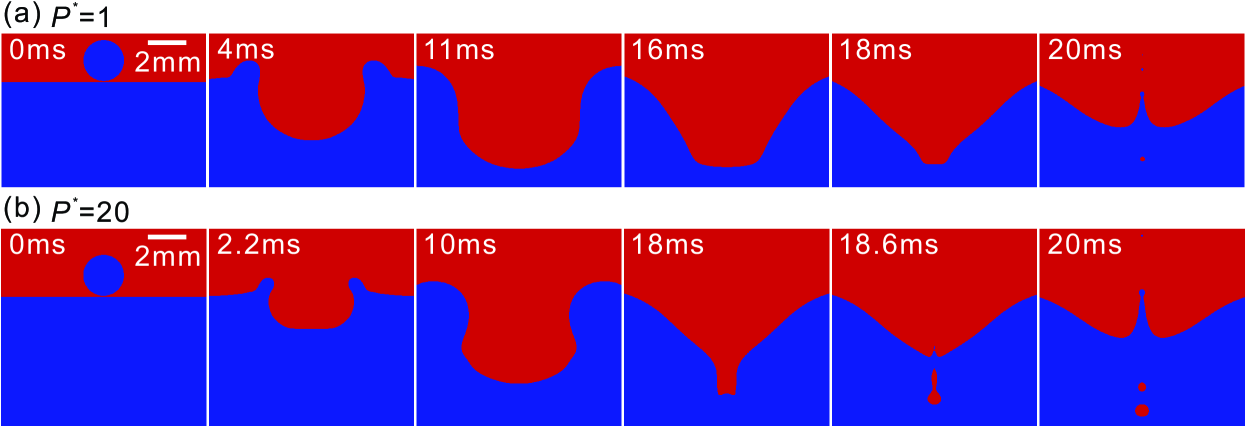
At high environmental pressure, it is also possible to entrap two bubbles after the impact. The evolution of the cavity for two-bubble entrapment in a typical case is compared with that for single bubble entrapment in Fig. 12. At the standard environmental pressure, a regular bubble is pinched off at 20 ms, as shown in Fig. 12a. In contrast, when the relative pressure is 20, two bubbles were pinched off as shown at 20 ms in Fig. 12b. As the capillary wave propagates inward along the interface of the cavity, a cylinder of air is formed at 18 ms. By comparing with the air cylinder at , we can see that the air cylinder at is much longer than that at (see the size of the air cylinder at 18 ms in Fig. 12a and 12b). Therefore, when the mouth of the air cylinder closes, the air bubble produced from the cylinder is very long. Consequently, the long bubble further pinches off into two bubbles by collapsing at the waist, as shown at 18.6 ms and 20 ms in Fig. 12b.
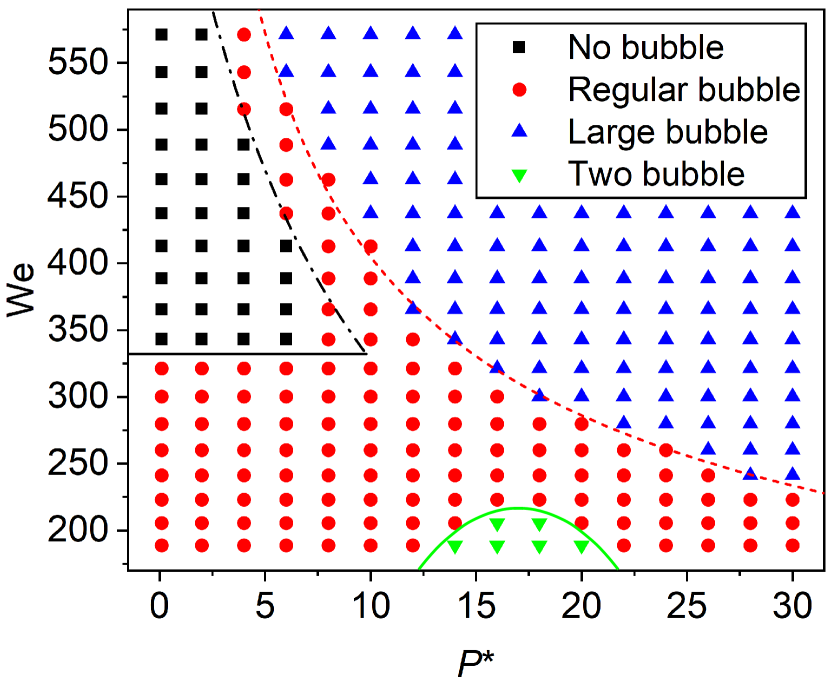
To determine the conditions of different regimes of bubble entrapment, we produce a regime map of the impact outcomes by varying the droplet speed and the environmental pressure. Large bubble entrapment occurs under a wide range of environmental pressure, as shown in Fig. 13. A threshold for the transition from regular bubble pinch-off to large bubble entrapment is found, which is indicated by the red dashed line. Pan et al. Pan and Hung (2010) studied the effect of the liquid viscosity on droplet impact and found that the threshold for the large bubble occurrence was almost not affected by the liquid viscosity. Therefore, the pressure threshold P for the large bubbles occurrence at different environmental pressures can be expressed as a function of the liquid density , the droplet diameter , and the droplet speed , i.e., . Xu et al. Xu et al. (2017) studied the threshold for the large bubble occurrence based on dimensional analysis and suggested a power function of , i.e., , where a is constant. Substituting it into , the threshold for large bubble occurrence at different environmental pressures can be expressed as
| (16) |
where is constant for this study, which can be obtained by fitting. As shown in Fig. 13, the scaling agrees well with the numerical simulation.
Figure 13 also shows the transition threshold from no bubble to the regular bubble pinch-off. At , there is only a narrow range of pressure for regular bubble pinch-off. As mentioned above, the pinch-off of a regular bubble occurs if the timescale for the cavity to achieve its maximum depth is smaller than the timescale of the capillary wave . Chen et al. Chen, Mandre, and Feng (2006) found that the density of the ambient fluid played an important role in capillary wave propagation when droplets impact a liquid surface. In our previous study Xu et al. (2022), we found that the environmental pressure mainly affected the density of the ambient gas during the droplet impact. We introduce the effect of the environmental pressure on the capillary wave propagation, and the minimum speed of the capillary-gravity surface wave can be expressed as , where is the effective density with is the density of the ambient gas and m is a constant coefficient. From Eq. (14), the timescale of the capillary wave is . Therefore, the threshold of regular bubble pinch-off can be obtained when the timescale for the cavity to achieve its maximum depth is equal to the timescale of the capillary wave: . Since the air density is proportional to the environmental pressure, , after rearrangement, the threshold for the transition from no bubble to the regular bubble pinch-off can be expressed in dimensionless form as
| (17) |
where is a constant coefficient, which can be obtained by fitting. As shown in Fig. 13, the scaling agrees well with the numerical simulation.
However, at , as the environmental pressure increases, the process changes from regular bubble pinch-off to large bubble entrapment. When the Weber number is less than 320 at low environmental pressure, the timescale for the cavity to achieve its maximum depth is all smaller than the timescale of the capillary wave, , so the regular bubble pinch-off occurs. For example, when at the standard environmental pressure (see Fig. 9a), the time for the cavity to reach its maximum depth is about 15.1 ms, and the time of the capillary wave is about 21.8 ms (), thus the regular bubble pinch-off occurs. The phenomenon of two-bubble pinch-off occurs at low Weber number and moderate environmental pressure, as shown in Fig. 13. When the environmental pressure is moderate, the liquid crown moves upward, and then sinks into the pool owing to the gravity and the surface tension force because the vorticity and the pressure difference are not enough to push the crowns to move inward to contact. As the capillary wave propagates inward along the cavity interface, a long cylinder of air is formed. Finally, two bubbles are produced when the mouth of the long cylinder of air closes and the waist pinches off.
V Conclusions
In this study, the cavity deformation and bubble entrapment after the impact of droplets on a liquid pool are studied by combined experimental measurements and numerical simulations. The numerical simulations are validated against experimental results by comparing the evolution of the cavity. The regular bubble pinch-off is the result of the capillary wave propagating downward along the surface of the cavity and merging at the bottom of the cavity. The large bubble entrapment is the result of the liquid crowns merging at the mouth of the cavity. Gravity and environmental pressure play important roles in cavity deformation and bubble entrapment. The maximum depth of the cavity decreases as the gravitational effect becomes stronger. A regime map of bubble entrapment is obtained at different gravities. The phenomenon of regular bubble pinch-off may disappear as the gravity decreases. As the environmental pressure is increased, the regular bubble pinch-off is transformed into the large bubble entrapment. The process of the large bubble entrapment is controlled by the vortex ring at the gas-liquid interface and the pressure difference between the two sides of the liquid crown. The volume of the large bubble entrapped decreases with increasing the environmental pressure. A regime map of bubble entrapment is obtained at different environmental pressures. When the environmental pressure is high and the Weber number is large, the strong vorticity at the gas-liquid interface and the large pressure difference between the two sides of the rim make the crown rim collide to entrap a large bubble. When the environmental pressure is low, a regular bubble is pinched off at the bottom of the cavity due to the propagation of the capillary waves. Finally, the thresholds for the transitions from no bubble to regular bubble and to large bubble regimes are analyzed.
This paper reports an experimental and numerical study of a droplet impacting a liquid pool. There are still many open questions for the impact process, such as the subsequent dynamics of the entrapped bubble and the dynamics of the liquid jet produced after bubble entrapment. This study of the impact of droplets on a liquid pool will not only deepen our understanding of the impact dynamics but also will be useful for the optimization of the relevant applications.
Acknowledgements
This work is supported by the National Natural Science Foundation of China (Grant Nos. 51676137, 51921004).
Conflict of interest
The authors have no conflicts to disclose.
Data Availability Statement
The data that support the findings of this study are available from the corresponding author upon reasonable request.
References
- Raes et al. (2000) F. Raes, R. Van Dingenen, E. Vignati, J. Wilson, J. P. Putaud, J. H. Seinfeld, and P. Adams, “Formation and cycling of aerosols in the global troposphere,” Atmospheric Environment 34, 4215–4240 (2000).
- Guo, Lian, and Sussman (2016) Y. S. Guo, Y. S. Lian, and M. Sussman, “Investigation of drop impact on dry and wet surfaces with consideration of surrounding air,” Physics of Fluids 28, 073303 (2016).
- Moreira, Moita, and Panão (2010) A. L. N. Moreira, A. S. Moita, and M. R. Panão, “Advances and challenges in explaining fuel spray impingement: How much of single droplet impact research is useful?” Progress in Energy and Combustion Science 36, 554–580 (2010).
- Horacek, Kiger, and Kim (2005) B. Horacek, K. T. Kiger, and J. Kim, “Single nozzle spray cooling heat transfer mechanisms,” International Journal of Heat and Mass Transfer 48, 1425–1438 (2005).
- Kim, You, and Choi (2004) J. H. Kim, S. M. You, and S. U. S. Choi, “Evaporative spray cooling of plain and microporous coated surfaces,” International Journal of Heat and Mass Transfer 47, 3307–3315 (2004).
- Shedd and Pautsch (2005) T. A. Shedd and A. G. Pautsch, “Spray impingement cooling with single- and multiple-nozzle arrays. part ii: Visualization and empirical models,” International Journal of Heat and Mass Transfer 48, 3176–3184 (2005).
- Xie et al. (2012) J. L. Xie, R. Zhao, F. Duan, and T. N. Wong, “Thin liquid film flow and heat transfer under spray impingement,” Applied Thermal Engineering 48, 342–348 (2012).
- Tang et al. (2019) X. Y. Tang, A. Saha, C. K. Law, and C. Sun, “Bouncing drop on liquid film: Dynamics of interfacial gas layer,” Physics of Fluids 31, 013304 (2019).
- Wang, Feng, and Zhao (2008) F. C. Wang, J. T. Feng, and Y. P. Zhao, “The head-on colliding process of binary liquid droplets at low velocity: High-speed photography experiments and modeling,” Journal of Colloid and Interface Science 326, 196–200 (2008).
- Beesabathuni et al. (2015) S. N. Beesabathuni, S. E. Lindberg, M. Caggioni, C. Wesner, and A. Q. Shen, “Getting in shape: Molten wax drop deformation and solidification at an immiscible liquid interface,” Journal of Colloid and Interface Science 445, 231–242 (2015).
- Blanchette and Bigioni (2009) F. Blanchette and T. P. Bigioni, “Dynamics of drop coalescence at fluid interfaces,” Journal of Fluid Mechanics 620, 333–352 (2009).
- Geri et al. (2017) M. Geri, B. Keshavarz, G. H. McKinley, and J. W. M. Bush, “Thermal delay of drop coalescence,” Journal of Fluid Mechanics 833, 686 (2017).
- Kulkarni et al. (2021) V. Kulkarni, V. Y. Lolla, S. R. Tamvada, N. Shirdade, and S. Anand, “Coalescence and spreading of drops on liquid pools,” Journal of Colloid and Interface Science 586, 257–268 (2021).
- Agbaglah et al. (2015) G. Agbaglah, M. J. Thoraval, S. T. Thoroddsen, L. V. Zhang, K. Fezzaa, and R. D. Deegan, “Drop impact into a deep pool: vortex shedding and jet formation,” Journal of Fluid Mechanics 764, 723 (2015).
- Liu et al. (2018) X. N. Liu, A. Wang, S. Wang, and D. Dai, “Effects of wind on the dynamics of the central jet during drop impact onto a deep-water surface,” Physical Review Fluids 3, 053602 (2018).
- Pan and Hung (2010) K. L. Pan and C. Y. Hung, “Droplet impact upon a wet surface with varied fluid and surface properties,” Journal of Colloid and Interface Science 352, 186–193 (2010).
- Blanco-Rodriguez and Gordillo (2021) F. J. Blanco-Rodriguez and J. M. Gordillo, “On the jets produced by drops impacting a deep liquid pool and by bursting bubbles,” Journal of Fluid Mechanics 916, A37 (2021).
- Das, Breuer, and Biswas (2022) S. K. Das, M. Breuer, and G. Biswas, “Evolution of jets during drop impact on a deep liquid pool,” Physics of Fluids 34, 022110 (2022).
- Lee et al. (2015) J. S. Lee, S. J. Park, J. H. Lee, B. M. Weon, K. Fezzaa, and J. H. Je, “Origin and dynamics of vortex rings in drop splashing,” Nature Communications 6, 9187 (2015).
- Leng (2001) L. J. Leng, “Splash formation by spherical drops,” Journal of Fluid Mechanics 427, 73–105 (2001).
- Motzkus, Gensdarmes, and Gehin (2011) C. Motzkus, F. Gensdarmes, and E. Gehin, “Study of the coalescence/splash threshold of droplet impact on liquid films and its relevance in assessing airborne particle release,” Journal of Colloid and Interface Science 362, 540–552 (2011).
- Deng, Anilkumar, and Wang (2007) Q. Deng, A. V. Anilkumar, and T. G. Wang, “The role of viscosity and surface tension in bubble entrapment during drop impact onto a deep liquid pool,” Journal of Fluid Mechanics 578, 119–138 (2007).
- Oguz and Prosperetti (1990) H. N. Oguz and A. Prosperetti, “Bubble entrainment by the impact of drops on liquid surfaces,” Journal of Fluid Mechanics 219, 143–179 (1990).
- Haldar and Chakraborty (2018) K. Haldar and S. Chakraborty, “Effect of liquid pool concentration on chemically reactive drop impact gelation process,” Journal of Colloid and Interface Science 528, 156–165 (2018).
- Rein (1996) M. Rein, “The transitional regime between coalescing and splashing drops,” Journal of Fluid Mechanics 306, 145–165 (1996).
- Deane and Stokes (2002) G. B. Deane and M. D. Stokes, “Scale dependence of bubble creation mechanisms in breaking waves,” Nature 418, 839–844 (2002).
- Franz (1959) G. J. Franz, “Splashes as sources of sound in liquids,” The Journal of the Acoustical Society of America 31, 1080–1096 (1959).
- Pumphrey and Elmore (1990) H. C. Pumphrey and P. A. Elmore, “The entrainment of bubbles by drop impacts,” Journal of Fluid Mechanics 220, 539–567 (1990).
- Pumphrey and Walton (1988) H. C. Pumphrey and A. J. Walton, “Experimental study of the sound emitted by water drops impacting on a water surface,” European Journal of Physics 9, 225–231 (1988).
- Chen and Guo (2014) S. L. Chen and L. J. Guo, “Viscosity effect on regular bubble entrapment during drop impact into a deep pool,” Chemical Engineering Science 109, 1–16 (2014).
- Ray, Biswas, and Sharma (2012) B. Ray, G. Biswas, and A. Sharma, “Bubble pinch-off and scaling during liquid drop impact on liquid pool,” Physics of Fluids 24, 082108 (2012).
- Morton, Rudman, and Liow (2000) D. Morton, M. Rudman, and J. L. Liow, “An investigation of the flow regimes resulting from splashing drops,” Physics of Fluids 12, 747–763 (2000).
- Ray, Biswas, and Sharma (2015) B. Ray, G. Biswas, and A. Sharma, “Regimes during liquid drop impact on a liquid pool,” Journal of Fluid Mechanics 768, 492–523 (2015).
- Deng, Anilkumar, and Wang (2009) Q. Deng, A. V. Anilkumar, and T. G. Wang, “The phenomenon of bubble entrapment during capsule formation,” Journal of Colloid and Interface Science 333, 523–532 (2009).
- Berberovic et al. (2011) E. Berberovic, I. V. Roisman, S. Jakirlic, and C. Tropea, “Inertia dominated flow and heat transfer in liquid drop spreading on a hot substrate,” International Journal of Heat and Fluid Flow 32, 785–795 (2011).
- Xu et al. (2018) M. J. Xu, J. Q. Zhang, Q. Li, and S. X. Lu, “The influence of liquid pool temperature on the critical impact weber number for surface bubble formation,” International Journal of Heat and Mass Transfer 127, 677–682 (2018).
- Bisighini et al. (2010) A. Bisighini, G. E. Cossali, C. Tropea, and I. V. Roisman, “Crater evolution after the impact of a drop onto a semi-infinite liquid target,” Physical Review E 82, 036319 (2010).
- Zou et al. (2012) J. Zou, C. Ji, B. G. Yuan, Y. L. Ren, X. D. Ruan, and X. Fu, “Large bubble entrapment during drop impacts on a restricted liquid surface,” Physics of Fluids 24, 057101 (2012).
- Deka et al. (2017) H. Deka, B. Ray, G. Biswas, A. Dalal, P. H. Tsai, and A. B. Wang, “The regime of large bubble entrapment during a single drop impact on a liquid pool,” Physics of Fluids 29, 092101 (2017).
- Thoraval, Li, and Thoroddsen (2016) M. J. Thoraval, Y. F. Li, and S. T. Thoroddsen, “Vortex-ring-induced large bubble entrainment during drop impact,” Physical Review E 93, 033128 (2016).
- Zeff et al. (2000) B. W. Zeff, B. Kleber, J. Fineberg, and D. P. Lathrop, “Singularity dynamics in curvature collapse and jet eruption on a fluid surface,” Nature 403, 401–404 (2000).
- Panao and Moreira (2005) M. R. O. Panao and A. L. N. Moreira, “Flow characteristics of spray impingement in pfi injection systems,” Experiments in Fluids 39, 364–374 (2005).
- Singh et al. (2007) S. S. Singh, R. D. Reitz, M. P. Musculus, and T. Lachaux, “Validation of engine combustion models against detailed in-cylinder optical diagnostics data for a heavy-duty compression-ignition engine,” International Journal of Engine Research 8, 97–126 (2007).
- Zhang, Ma, and Liu (2020) H. Zhang, Y. Ma, and Q. F. Liu, “Droplet impaction in nuclear installations and safety analysis: Phenomena, findings and approaches,” Nuclear Engineering and Design 366, 110757 (2020).
- Kanazawa et al. (1995) T. Kanazawa, T. Nagayoshi, T. Kawasaki, and K. Amano, “Analysis of turbulence intensity and coolant droplet behavior around bwr fuel spacers,” Journal of Nuclear Science and Technology 32, 1061–1063 (1995).
- Okawa et al. (2007) T. Okawa, T. Fujita, J. Minamitani, and I. Kataoka, “On the deposition rate of droplets in annular flow around a flow obstacle,” Multiphase Science and Technology 19, 305–321 (2007).
- Tao et al. (2013) J. J. Tao, J. Qin, X. Han, and Y. M. Zhang, “Numerical investigation of water droplet impact on solid surface in microgravity,” Applied Mechanics and Materials 390, 65–70 (2013).
- Han, Tao, and Qin (2014) X. Han, J. J. Tao, and J. Qin, “Numerical study of water mist centerline velocity in microgravity,” Chinese Science Bulletin 59, 3222–3226 (2014).
- Xu, Barcos, and Nagel (2007) L. Xu, L. Barcos, and S. R. Nagel, “Splashing of liquids: Interplay of surface roughness with surrounding gas,” Physical Review E 76, 066311 (2007).
- Xu, Zhang, and Nagel (2005) L. Xu, W. W. Zhang, and S. R. Nagel, “Drop splashing on a dry smooth surface,” Physical Review Letters 94, 184505 (2005).
- Klyuzhin et al. (2010) I. S. Klyuzhin, F. Ienna, B. Roeder, A. Wexler, and G. H. Pollack, “Persisting water droplets on water surfaces,” Journal of Physical Chemistry B 114, 14020–14027 (2010).
- Marcotte et al. (2019) F. Marcotte, G. J. Michon, T. Seon, and C. Josserand, “Ejecta, corolla, and splashes from drop impacts on viscous fluids,” Physical Review Letters 122, 014501 (2019).
- Waller (2008) H. G. Waller, “A new approach to vof-based interface capturing methods for incompressible and compressible flow,” OpenCFD Ltd (2008), 10.1103/PhysRev.72.433.
- Gupta and Kumar (2020) G. Gupta and P. Kumar, “Splashing dynamics of a drop impact onto a deep liquid pool with moving film interface,” Physics of Fluids 32, 012102 (2020).
- Hoang et al. (2013) D. A. Hoang, L. M. Portela, C. R. Kleijn, M. T. Kreutzer, and V. van Steijn, “Dynamics of droplet breakup in a t-junction,” Journal of Fluid Mechanics 717, R4 (2013).
- Damian (2013) S. M. Damian, “An extended mixture model for the simultaneous treatment of short and long scale interfaces,” Ph.D. thesis (2013), 10.13140/RG.2.1.3182.8320.
- Boris and Book (1973) J. P. Boris and D. L. Book, “Flux-corrected transport,” Journal of Computational Physics 11, 38–69 (1973).
- (58) “See supplemental material at [url will be inserted by publisher] for several movies of the impact processes.” .
- Jian et al. (2020) Z. Jian, M. A. Channa, A. Kherbeche, H. Chizari, S. T. Thoroddsen, and M. J. Thoraval, “To split or not to split: Dynamics of an air disk formed under a drop impacting on a pool,” Physical Review Letters 124, 184501 (2020).
- Qi, Wang, and Che (2020) H. C. Qi, T. Y. Wang, and Z. Z. Che, “Air layer during the impact of droplets on heated substrates,” Physical Review E 101, 043114 (2020).
- Tran et al. (2013) T. Tran, H. de Maleprade, C. Sun, and D. Lohse, “Air entrainment during impact of droplets on liquid surfaces,” Journal of Fluid Mechanics 726, R3 (2013).
- Lo, Liu, and Xu (2017) H. Y. Lo, Y. Liu, and L. Xu, “Mechanism of contact between a droplet and an atomically smooth substrate,” Physical Review X 7, 021036 (2017).
- Langley, Li, and Thoroddsen (2017) K. Langley, E. Q. Li, and S. T. Thoroddsen, “Impact of ultra-viscous drops: air-film gliding and extreme wetting,” Journal of Fluid Mechanics 813, R2 (2017).
- Berberovic et al. (2009) E. Berberovic, N. P. van Hinsberg, S. Jakirlic, I. V. Roisman, and C. Tropea, “Drop impact onto a liquid layer of finite thickness: Dynamics of the cavity evolution,” Physical Review E 79, 036306 (2009).
- Oǧuz and Prosperetti (1991) H. N. Oǧuz and A. Prosperetti, “Numerical calculation of the underwater noise of rain,” Journal of Fluid Mechanics 228, 417–442 (1991).
- Mohamed-Kassim and Longmire (2004) Z. Mohamed-Kassim and E. K. Longmire, “Drop coalescence through a liquid/liquid interface,” Physics of Fluids 16, 2170–2181 (2004).
- Engel (1966) O. G. Engel, “Crater depth in fluid impacts,” Journal of Applied Physics 37, 1798–1808 (1966).
- Xu et al. (2017) M. J. Xu, J. Q. Zhang, C. P. Wu, C. H. Li, X. Chen, and S. X. Lu, “Impact behavior of single water drop impacting onto burning ethanol surface,” Industrial Engineering Chemistry Research 56, 14686–14693 (2017).
- Chen, Mandre, and Feng (2006) X. P. Chen, S. Mandre, and J. J. Feng, “Partial coalescence between a drop and a liquid-liquid interface,” Physics of Fluids 18, 051705 (2006).
- Xu et al. (2022) Z. G. Xu, L. L. Wang, T. Y. Wang, and Z. Z. Che, “Crown rupture during droplet impact on a dry smooth surface at increased pressure,” Physics of Fluids 33, 122105 (2022).