A Shared Cluster-based Stochastic Channel Model for Joint Communication and Sensing Systems
Abstract
Joint communication and sensing (JCAS) has been recognized as a promising technology in the sixth generation (6G) communication. A realistic channel model is a prerequisite for designing JCAS systems. Most existing channel models independently generate the communication and sensing channels under the same framework. However, due to the multiplexing of hardware resources (e.g., antennas) and the same environment, signals enabled for communication and sensing may experience some shared propagation scatterers. This practical sharing feature necessities the joint generation of communication and sensing channels for realistic modeling, where the shared clusters (contributed by the shared scatterers) should be jointly reconstructed for both channels. In this paper, we first conduct communication and sensing channel measurements for an indoor scenario at 28 GHz. The power-angular-delay profiles (PADPs) of multipath components (MPCs) are obtained, and the shared scatterers by communication and sensing channels are intuitively observed. Then, a stochastic JCAS channel model is proposed to capture the sharing feature, where shared and non-shared clusters by the two channels are defined and superimposed. To extract those clusters from measured JCAS channels, a KPowerMeans-based joint clustering algorithm (KPM-JCA) is novelly introduced. Finally, stochastic channel characteristics are analyzed, and the practicality and controllability of the proposed model are validated based on the measurements and empirical simulations. The proposed model can realistically capture the sharing feature of JCAS channels, which is valuable for the design and deployment of JCAS systems.
Index Terms:
Joint communication and sensing, channel measurements and modeling, shared cluster, joint clustering, sharing degree.I Introduction
Nowadays, joint communication and sensing (JCAS) has been recognized as a promising technology to achieve ubiquitous sensing and digital twin for the sixth generation (6G) systems [1]. The communication purpose is to transmit information, while sensing aims at the detection and identification of the targets. Compared to conventional systems with separate devices, JCAS technology realizes the capability of integrating functions into one system, enabling the base stations or terminals to communicate while sensing the surrounding environment [2, 3, 4]. By sharing a majority of the software, hardware, and information resources, JCAS systems bring tremendous advantages to improving spectral efficiency and reducing costs [5, 6, 7, 8].
Realistic channel modeling is the prerequisite for the design and deployment of JCAS systems [9, 10]. In the existing research, JCAS channel models are widely utilized in JCAS systems to evaluate upper-level technology development and system design [11, 12, 13, 14], where communication and sensing channels are generated independently. However, due to the multiplexing of hardware resources (e.g., antennas) and the same environment, some objects might serve as shared propagation scatterers for both the communication and sensing channels. This sharing feature has been observed in several multi-link channel measurements, and the effects on correlation and capacity of the shared clusters (contributed by the shared scatterers) are studied [15, 16]. Hence, unlike the existing models independently generating communication and sensing channels, the observed sharing feature of scatterers and clusters should be carefully considered in JCAS channel modeling.
The relationship between communication and sensing channels has attracted attention in a few existing JCAS research. In [17], communication scatterers are assumed to be part of the sensing targets, and a dual-functional JCAS system framework at millimeter wave (mmWave) bands is proposed for unifying sensing and communication operations. In [18], the sensing echo path is simply assumed to be the round trip of the communication path, with the delay and Doppler of sensing channels defined as twice that of the communication channels. Based on the consideration of the sharing feature in JCAS systems, the similarity of the azimuth power spectrum of communication and sensing is studied by Ray-tracing simulations in [19, 20]. In order to investigate the realistic sharing feature of JCAS channels, a measurement campaign for both communication and sensing channels is performed in [21]. The spatial congruence between the two channels is observed and analyzed, demonstrating the potential to realize the mutual auxiliary functions in JCAS systems.
Although the above efforts have been done to investigate the sharing feature in JCAS systems, this feature has not been taken into JCAS channel modeling. Most state-of-the-art JCAS channel models simply perform the generation procedure twice under the same framework for communication and sensing channels, which leads to the independence between both channels. It is actually contradictory to the practical channels with the sharing feature, where some clusters in both channels should co-exist or disappear. Therefore, a realistic JCAS channel model with the sharing feature considered is still missing in the literature, and the corresponding clustering algorithms to extract those shared clusters have not been investigated. Moreover, model validation based on practical channel measurements is required to examine the practicality and effectiveness of the channel model for JCAS channel simulations.
To bridge the above gaps, we conduct an indoor JCAS channel measurement campaign at 28 GHz, and then propose a shared cluster-based stochastic channel model based on measurement observations. Our major contributions and novelties are summarized as:
-
•
A JCAS channel measurement campaign with horn antenna rotation is performed in typical line of sight (LOS) and non-LOS (NLOS) indoor scenarios at 28 GHz. The shared scatterers of JCAS channels can be intuitively observed by comparing the power-angular-delay profiles (PADPs) of communication and sensing measured multipath components (MPCs).
-
•
A shared cluster-based stochastic model is proposed to capture the observed sharing feature of the JCAS channels. Specifically, the shared clusters (contributed by the shared scatterers) and the non-shared ones are defined and superimposed, resulting in the joint generation of communication and sensing channels. Besides, a corresponding clustering algorithm operating on the joint channels is novelly introduced, which aims to extract those shared and non-shared clusters for the model parameterization.
-
•
Stochastic cluster parameters, including the delay spread (DS), angle spread (AS), and sharing degree (SD), are extracted from the measurement data for the model parameterization. In addition, the model empirical implementations are performed, validating the capability to realistically capture the sharing feature.
The remainder of this paper is outlined as follows. In Section II, detailed descriptions of the measurement facilities and environment are presented, and the characteristics of shared scatterers are analyzed. In Section III, a shared cluster-based JCAS channel model and a novel joint clustering algorithm are proposed. Then, parameterized analysis and validation of the proposed channel model are accomplished in Section IV. Finally, Section V concludes the work.
II Channel Measurements
II-A Measurement Description
The measurements for communication and sensing channels are conducted in a typical indoor hall with the dimension of 20.216.2 in Beijing University of Posts and Telecommunications. The illustration of the measurement scenario layout and the realistic measurement surroundings are presented in Fig. 1.
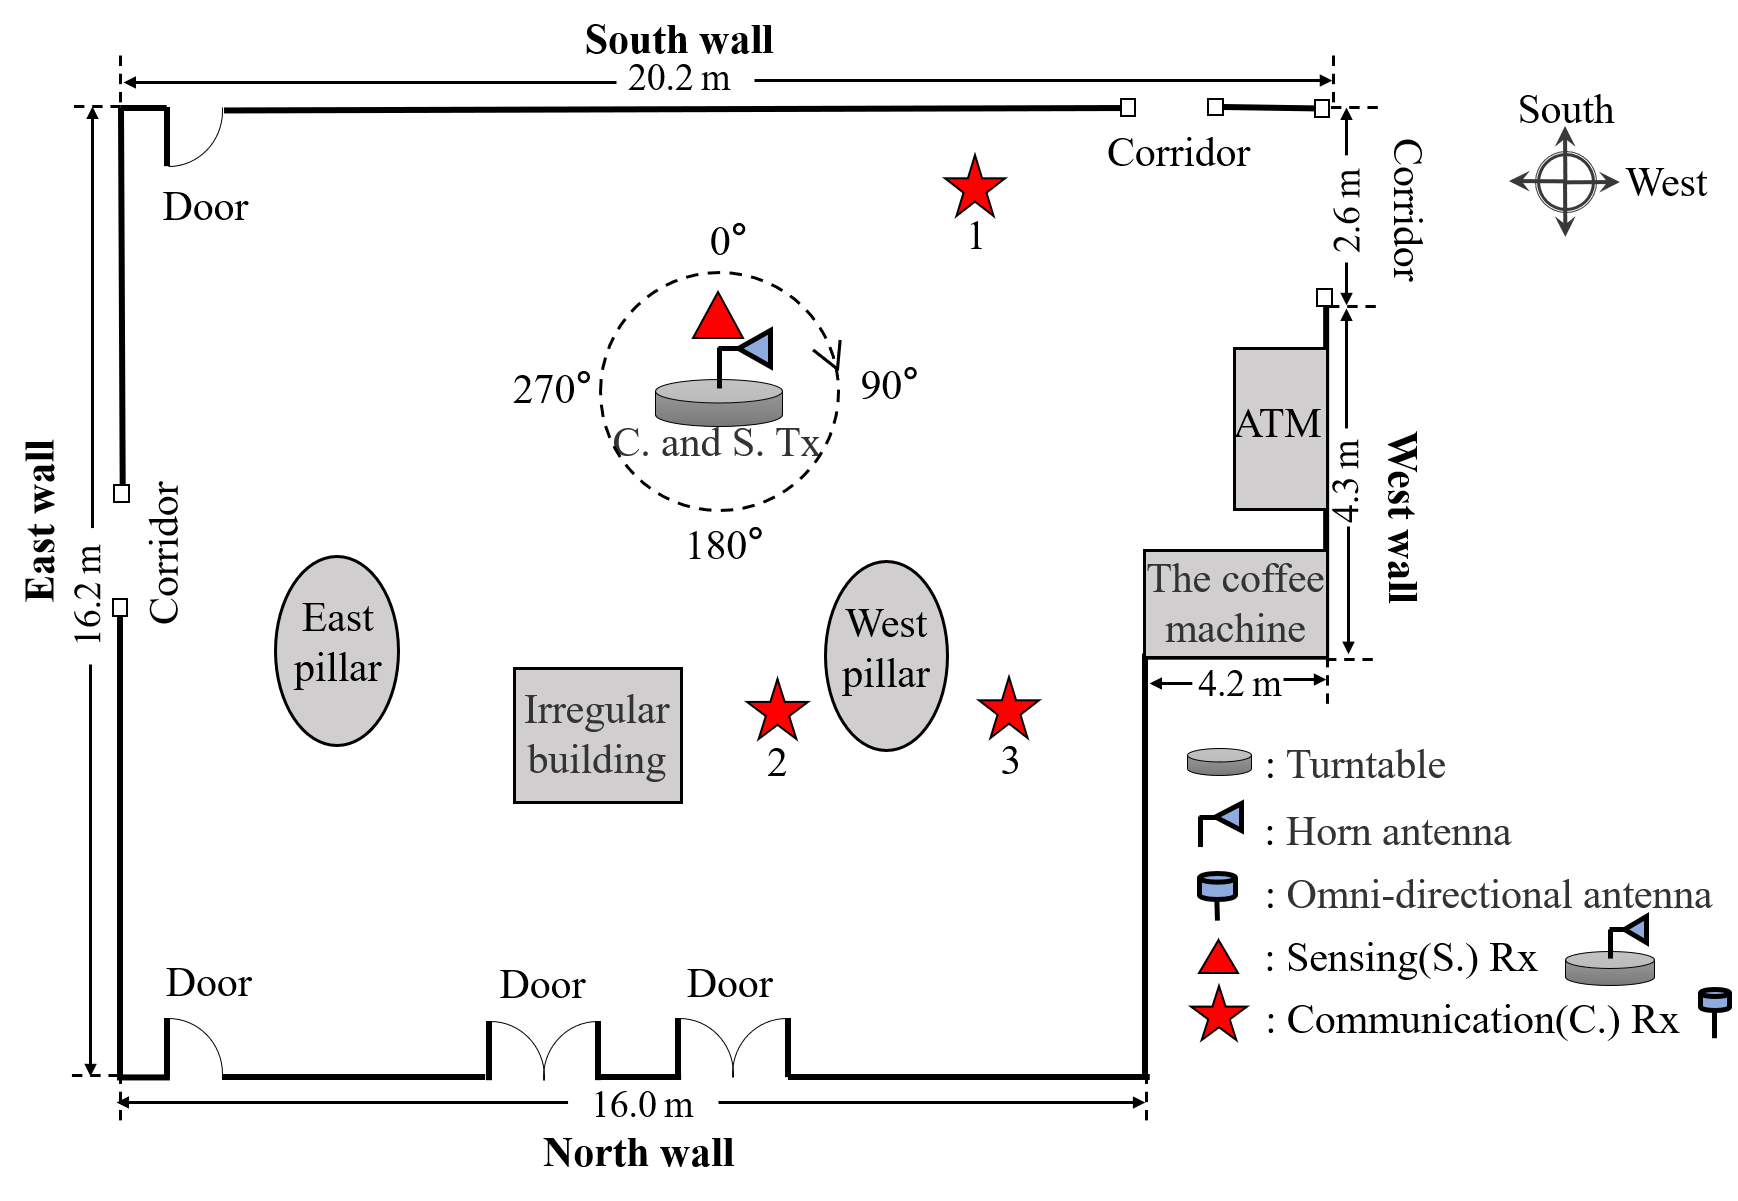
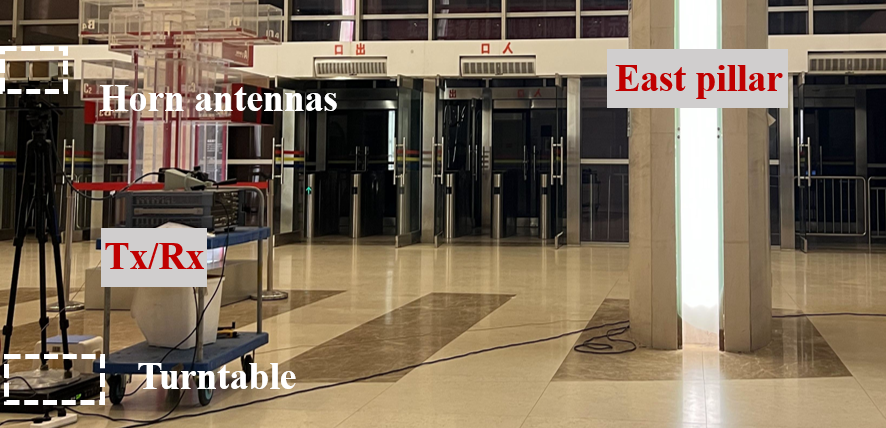
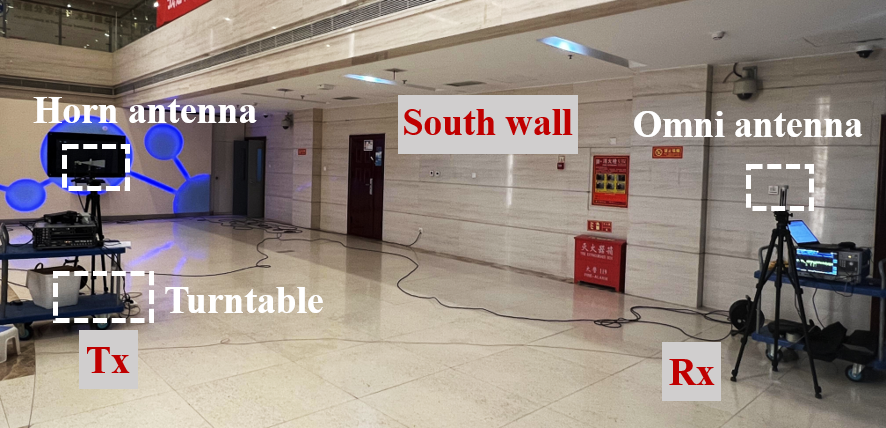
As demonstrated in Fig. 1(b), the sensing horn antennas at the transmitter (TX) and receiver (RX) sides are fixed on a bracket with a horizontal interval of 10 cm, pointing in the same direction to detect the echo process of sensing signals. The bracket is equipped on a turntable in the center of the hall, as denoted by the circular dashed area in Fig. 1(a). The height of the antennas is 1.47 m. In order to obtain the omni-directional channel information, sensing antennas are rotated horizontally clockwise from the south through the turntable with a step of 5∘. And the channels of 72 angles can be sounded from the measurement campaign. In the communication measurements, shown in Fig. 1(c), the rotated horn antenna is still applied as the TX antenna in the hall’s center. Moreover, the omni-directional RX antenna, which can receive reflected waves from all directions, is placed in three measured positions, respectively, as presented by the red star in Fig. 1(a). Positions 1 and 2 are at the LOS condition, and position 3 is at the NLOS condition.
In this paper, a wideband channel sounder at mmWave bands is exploited to extract the JCAS channel characteristics. At the TX side, a vector signal generator (RS SMW 200A) is used to generate a Pseudo Noise (PN) sequence with a code rate of 500 Msym/s and a length of 511. In the baseband, the PN sequence is modulated as a mmWave probing signal at 28 GHz. The modulation type is Binary Phase Shift Keying (BPSK), and the zero-to-zero bandwidth of the transmitted signal is 1 GHz. To ensure a better signal-to-noise ratio (SNR) for the received signal, a power amplifier with 25 dBm saturation power and 35 dB gain is applied. Then, a horn antenna with high gain is equipped to transmit the amplified signal over the air. At the RX side, a spectrum analyzer (RS FSW 43) is utilized to demodulate the mmWave signal received by antennas. 1022 IQ samples are obtained with a sample rate of 1 GHz, and the delay resolution is 1 ns. Finally, the channel impulse responses (CIRs) of the measurement scenarios can be derived through data processing on the laptop.
| Parameter | Values |
| Central frequency | 28 GHz |
| Symbol rate | 500 Msym/s |
| Bandwidth | 1 GHz |
| PN sequence | 511 |
| Sampling rate | 1 GHz |
| Sensing Tx / Rx antenna type | Horn / Horn |
| Communication Tx / Rx antenna type | Horn / Omni |
| Horn antenna azimuth HPBW | 10∘ |
| Horn antenna gain | 25 dBi |
| Omni-directional antenna gain | 3 dBi |
| Antenna height | 1.47 m |
In the channel measurements, multiple channel samplings are realized, which are expressed as sampling cycles (snapshots). The maximum detectable delay of a snapshot is 1022 ns, and the maximum sounding distance is (the speed of electromagnetic waves is ). Moreover, we connect the spectrum analyzer and the signal generator with sync lines during the measurements to acquire the same center frequency and absolute delay information. Details of the channel sounder configuration are listed in Table I.
II-B PADP Analysis
Before conducting measuring, we perform a back-to-back calibration to remove the system response from the equipment and cable [22]. CIRs at each communication or sensing position for all rotation angles are measured as , where and denote the propagation delay and rotation angle, respectively. Note that the azimuth angle of departure (AOD) of MPCs would be estimated directly according to the rotation angle in the measurements. The power-angular-delay profiles (PADPs) can be written as
| (1) |
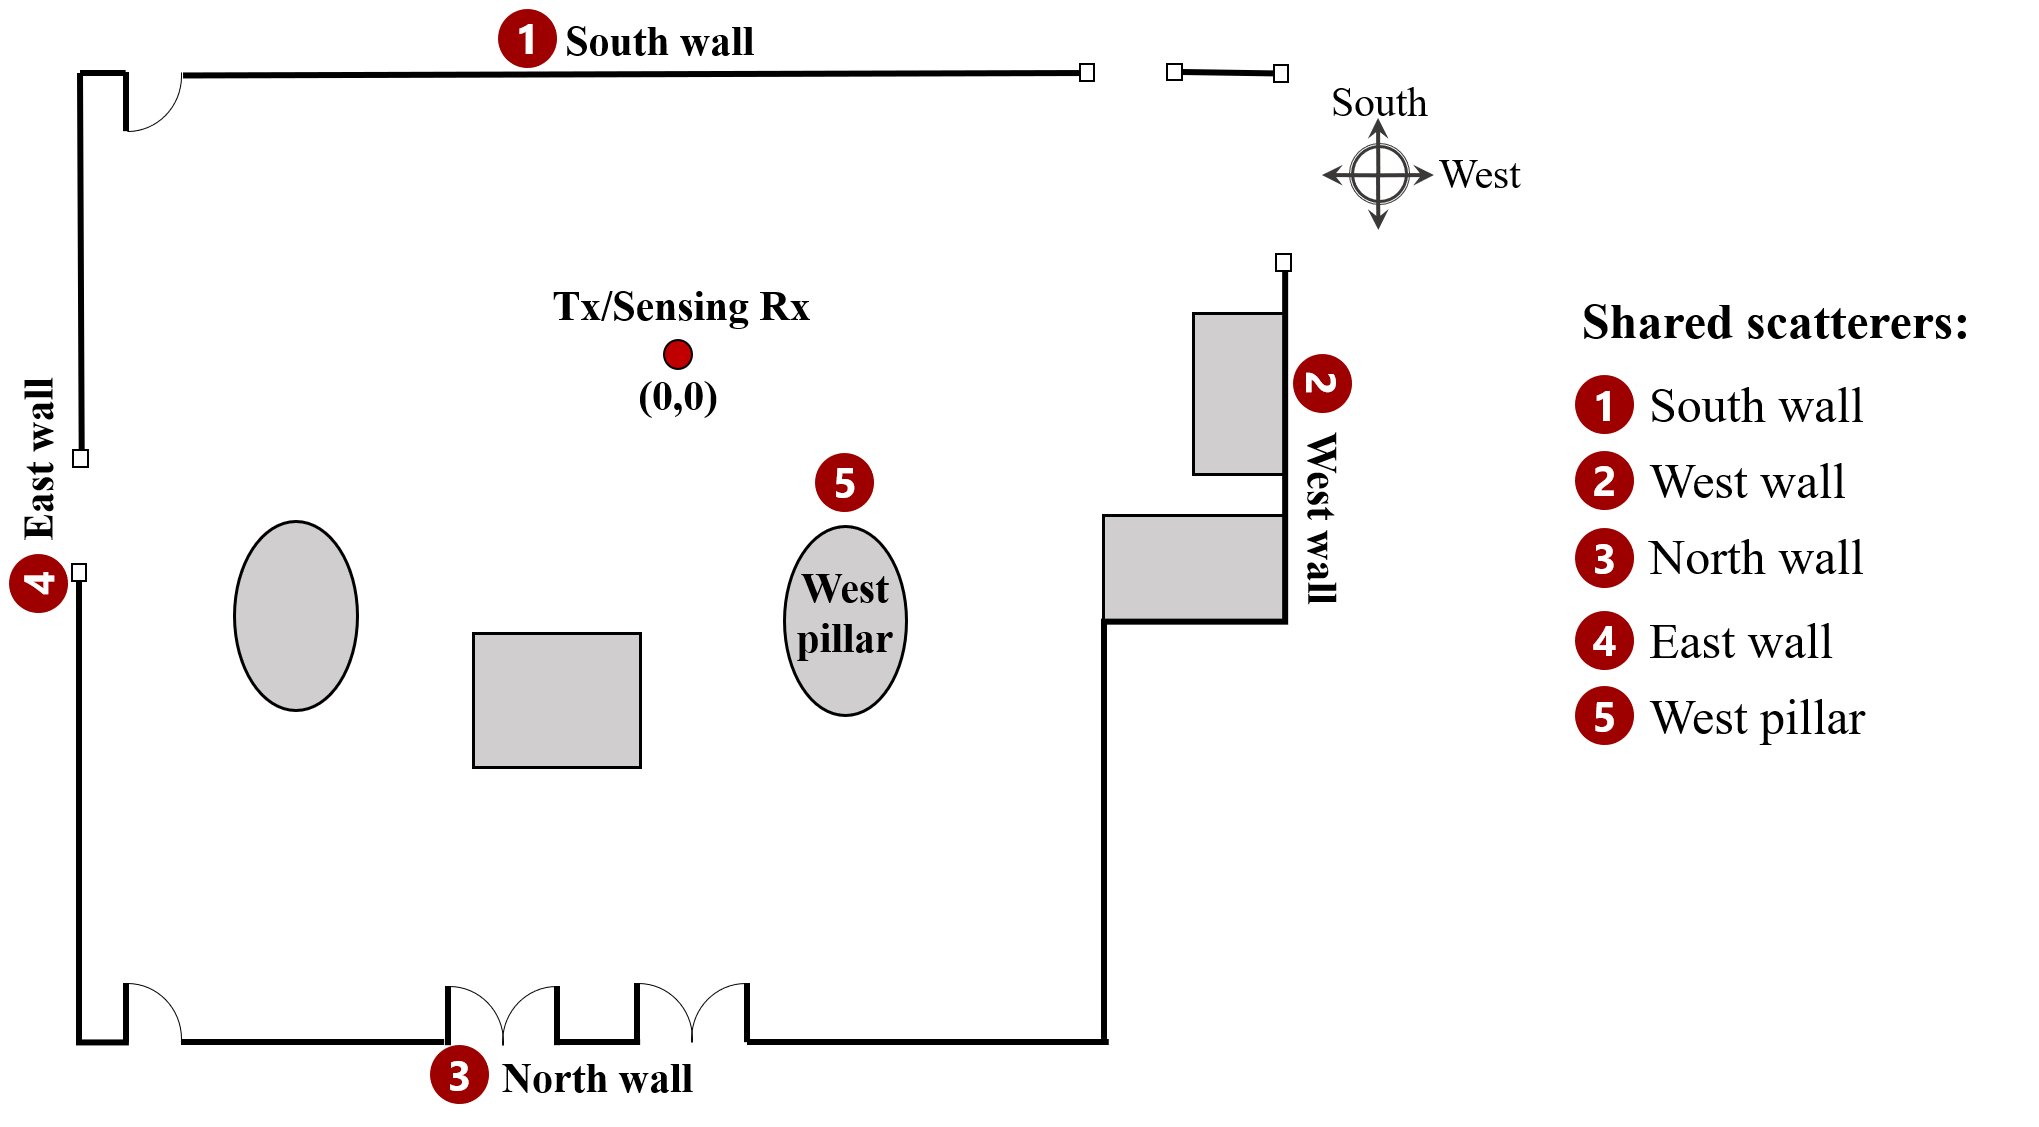
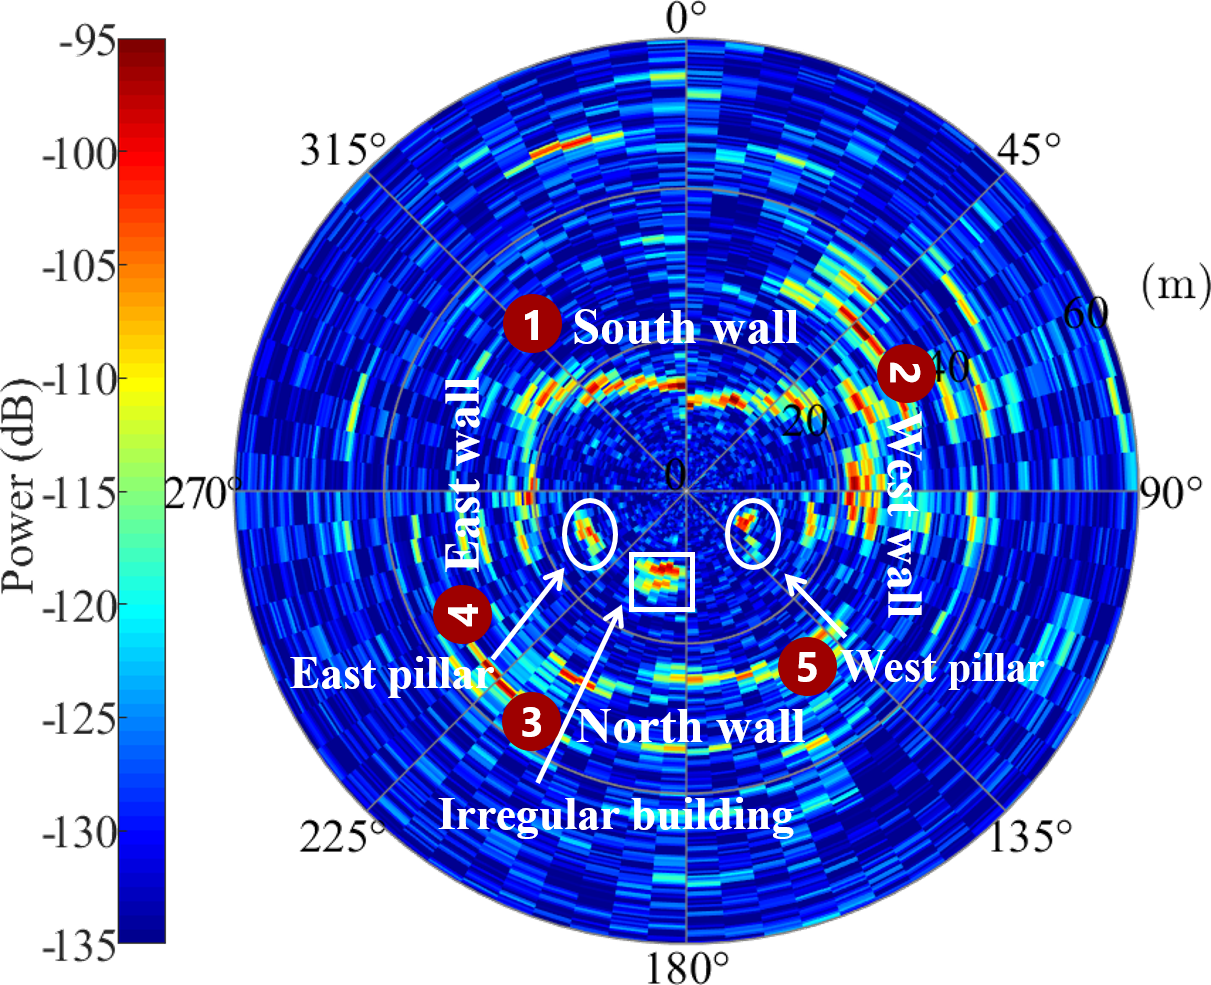
The PADPs of sensing and three communication measured positions are demonstrated in Fig. 2(b), 2(c)-2(e), respectively. In these polar plots, the center of the circle (coordinate of ) is the location of the TX and sensing RX antennas, as shown in Fig. 2(a) (denoted by the circular dashed area in Fig. 1(a)), which is a simplified schematic of Fig. 1(a). The angle of the circle represents the AOD, zero-degree points in the south direction. The radius indicates the absolute propagation distance of the MPCs from the TX antenna, and the depth of color represents the magnitude of the received power (dB). By matching the high-power MPCs with the actual environment, it can be calculated that over 95% of the power in the effective MPCs comes from the single-hop reflection links, in the 30 dB dynamic range of communication and sensing PADPs.
According to the characteristics of the single-hop paths, it can be analyzed that the MPCs with similar angles are contributed by the same propagation scatterer in both communication and sensing PADPs, and the AOD is the actual angle between the scatterer and TX antenna. Moreover, considering the round-trip characteristics of sensing echo paths, the propagation distance acquired through measurements is twice the actual distance from the scatterers to the TX/RX antenna. Therefore, the absolute delay and AOD of sensing MPCs can determine the location of environmental objects, enabling localization. As demonstrated in Fig. 2(b), the scenario distribution, including the walls around the hall, the east and west pillars, and the irregular building, is presented clearly, which can be corresponded to Fig. 1(a). At the location of corridors and doors (e.g., in the area around angle 45∘ in Fig. 2(b)), MPCs are relatively disorderly due to multiple reflections, diffractions, etc., caused by irregular scatterers.
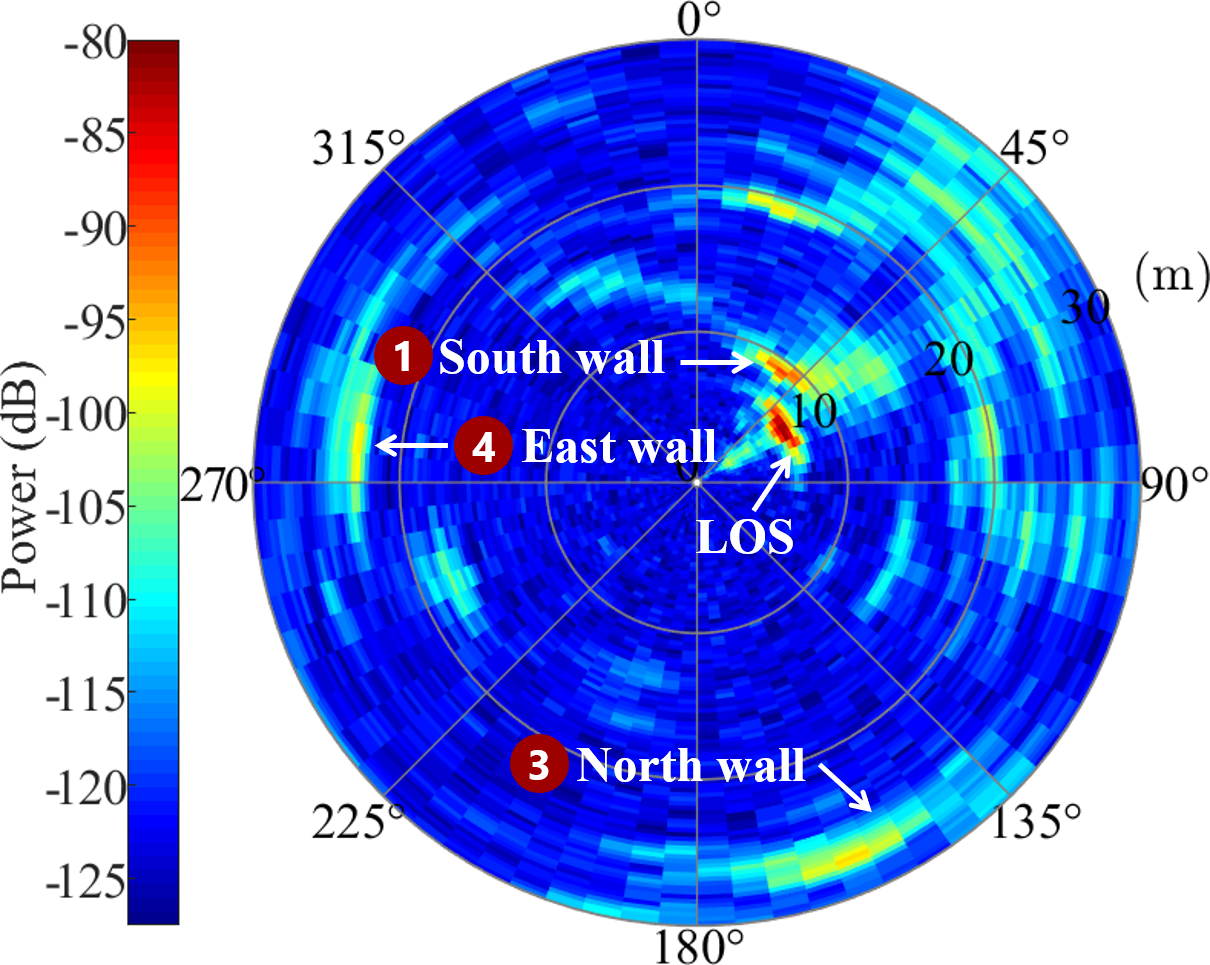
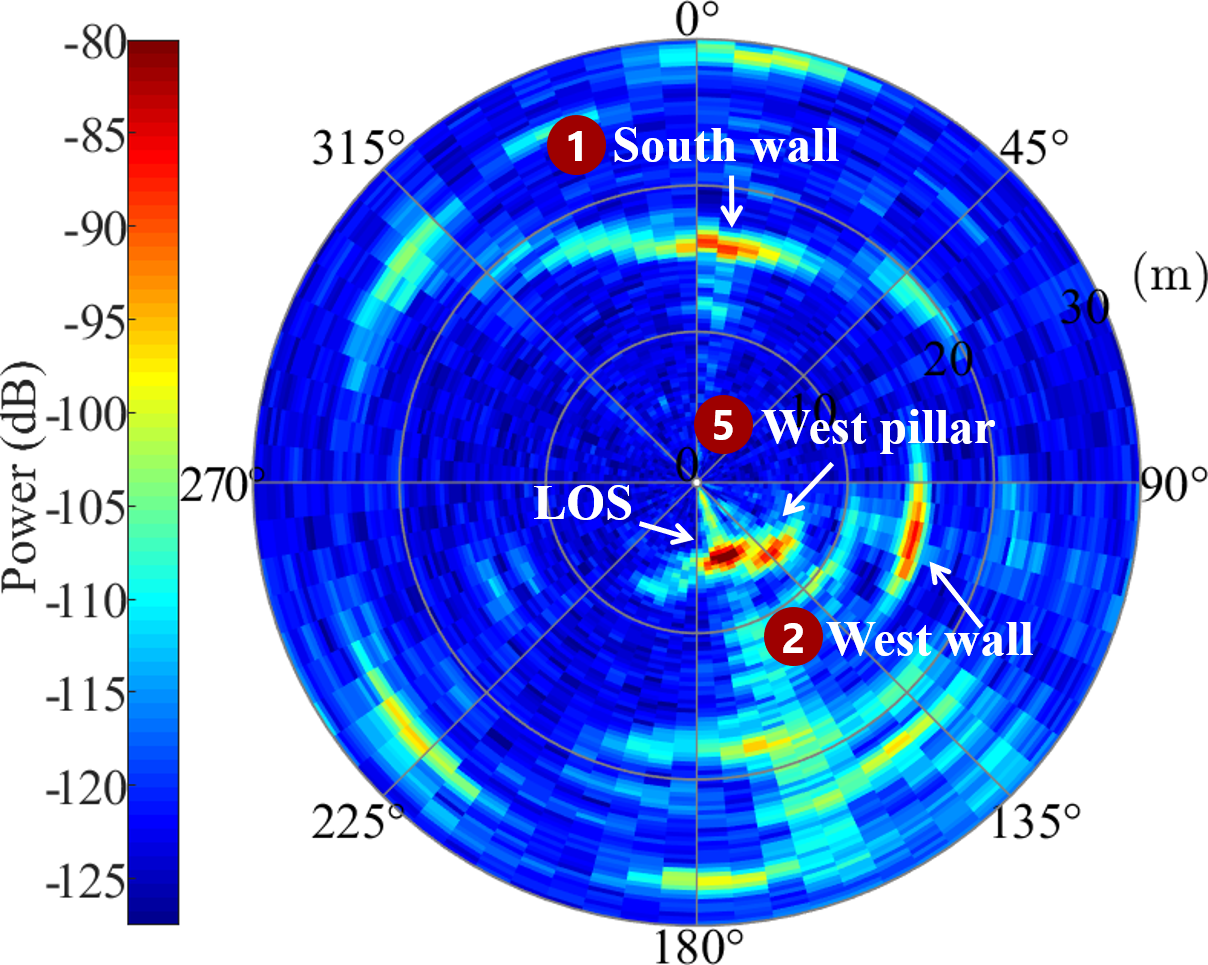
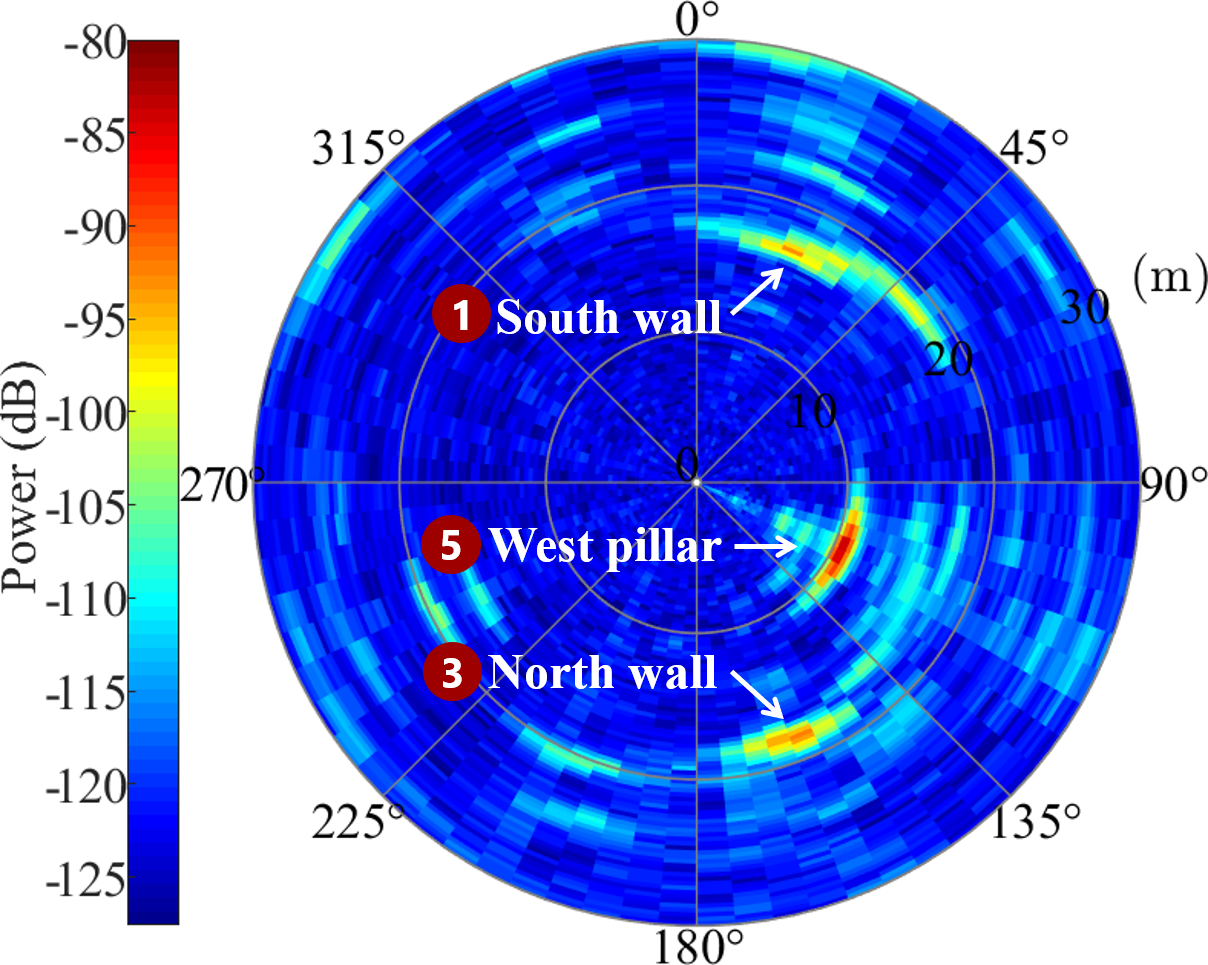
However, the propagation distance in the communication NLOS paths could not intuitively mirror the actual distance between the scatterers and the TX antenna, since the reflection location of the propagation paths is unknown. Hence, communication PADPs can only present the scatterer distribution of the angular domain. In PADP of communication position 1, as illustrated in Fig. 2(c), the high-power MPCs are reflected by partial south, north, and east walls, and the power of the LOS path is the most dominant. Moreover, the major channel scatterers, corresponding to high-power MPCs, are also marked in PADPs of communication position 2 (in Fig. 2(d)) and position 3 (in Fig. 2(e)). Note that some MPCs with lower power are not marked one by one in these figures.
When we analyze the PADPs of communication and sensing channels, it can be observed that some environmental objects (marked with red sequence labels in Fig. 2) are not only the sensing targets but also assist in communication transmission. (Note that we only focus on the scatterers that work in channels other less the whole objects with large physical sizes.) For instance, the partial south wall (label 1), north wall (label 3), and east wall (label 4) when the communication RX is set in position 1 (compared Fig. 2(b) with Fig. 2(c)). In this paper, we define these scatterers as shared scatterers. Compared Fig. 2(b) with Fig. 2(d), the partial south wall (label 1), west wall (label 2), and west pillar (label 5) become shared scatterers in channels. Compared Fig. 2(b) with Fig. 2(e), shared scatterers are the partial south wall (label 1), north wall (label 3), and west pillar (label 5). Due to the different beam widths and transceiver locations, communication and sensing MPCs naturally exhibit different propagation distances and certain angular deviations, but this does not affect the fact that the objects serve as the shared propagation scatterers by the communication and sensing channels.
Here, the sensing process covers all scatterers around the environment, for the reason of the echo detection paradigm and strong diffuse reflection mechanisms of the rough surfaces (i.e., waves propagating to the scatterers will always return a portion of the energy) in sensing channels. Therefore, the shared scatterers of three JCAS channels can be intuitively observed in communication PADPs (Fig. 2(c)-2(e)), respectively. These shared scatterers corresponding to the MPCs reflect the realistic propagation paths of the electromagnetic waves, revealing the sharing feature of JCAS channels, which is a physical environment factor that cannot be ignored in channel modeling.
| (2a) | ||||
| (2b) | ||||
III JCAS Channel Modeling
In this section, a shared cluster-based stochastic JCAS channel model is first proposed to capture the observed sharing feature in the measurements. The shared clusters (contributed by the shared scatterers) are jointly generated for both the communication and sensing channels, while the non-shared ones are independently constructed. In addition, to extract the defined shared and non-shared clusters, a clustering algorithm operating on the integrated communication and sensing channels is introduced.
III-A Channel Modeling
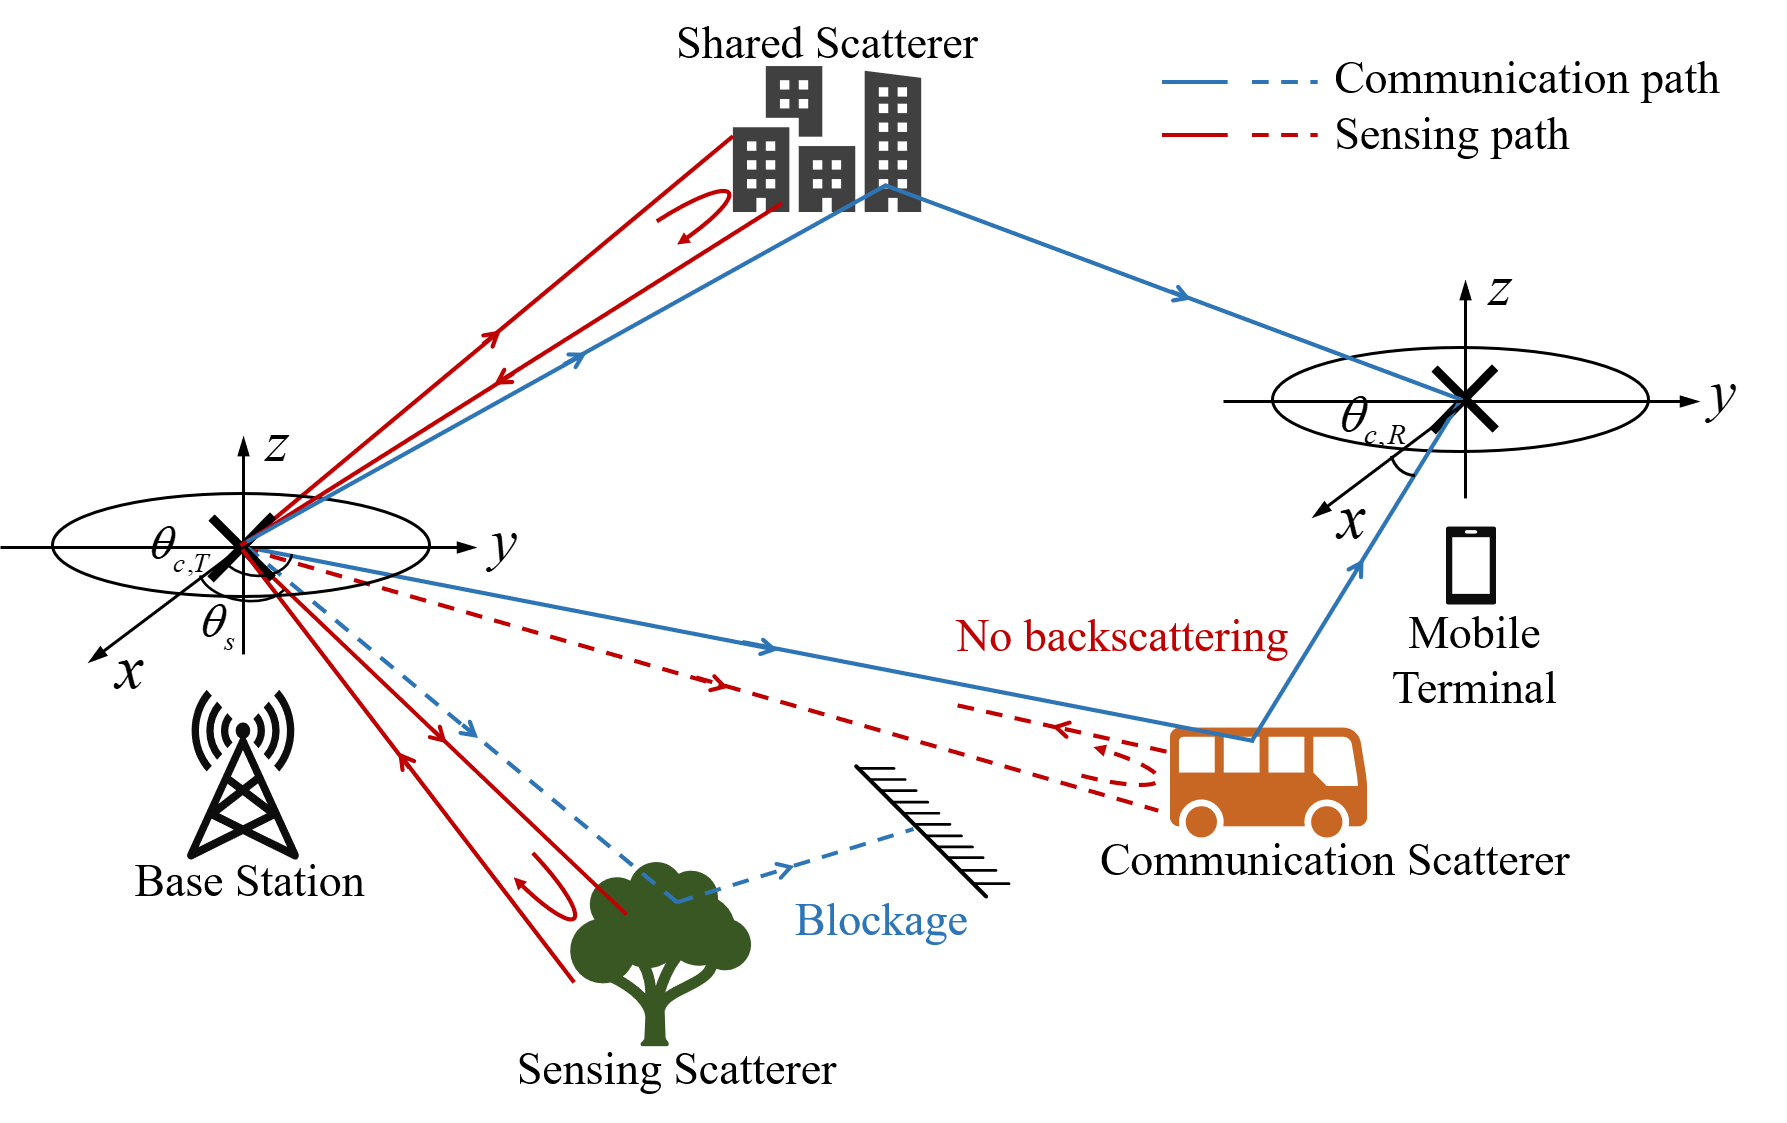
This paper considers a wideband JCAS channel with one TX antenna and one RX antenna, under frequency-selective fading, as shown in Fig. 3. The scatterers are randomly distributed in the environment. The definition of the communication process is based on the conventional configuration in which the transceiver antennas are separated. As shown by the blue lines in Fig. 3, the communication signals are sent from the base station and received by the mobile terminal after experiencing the channel scatterers. Meanwhile, the base station senses the ambient environment through the form of radar echoes, where the signals are reflected back to itself for reception, as shown by the red lines in Fig. 3.
We define the clusters which experience the shared scatterers in both the communication and sensing channels as shared clusters of the JCAS channels. A shared cluster-based stochastic channel model for JCAS systems is proposed, where the communication and sensing channels are generated by the superposition of shared and non-shared clusters, respectively. The channel model of all resolvable paths at time is expressed as formula (2). In this model, and denote the CIR of communication and sensing, which are the general expression expanded in Section II. The subscripts, and , denote the communication and sensing parameters, respectively. The subscript stands for the transmitting process, and stands for the receiving process. , , and denote the indexes of clusters contributed by the shared, communication, and sensing scatterers. , , and denote the indexes of the MPCs within the corresponding clusters. The total number of communication and sensing clusters can be given as and , and the joint cluster number is . denotes the Dirac Delta function. and are employed to describe the complex amplitude and time delay of communication and sensing MPCs, respectively. denotes azimuth transceiver angle of MPCs, where represents the AOD, represents the angle of arrival (AOA).
The purpose of communication is to transfer information without regard to the scatterers of intermediate processes. On the other hand, sensing aims at the detection and identification of environmental objects. Therefore, the properties of the sensing scatterers should be additionally described when denoting the sensing CIRs. The radar cross section (RCS), whose value is affected by the object’s area, material, etc., has been introduced in the research of sensing channels [23]. In model (2), the RCS coefficient, , is adopted to describe the fading of the cluster power by the sensing scatterers. Note that the model in this paper simplifies the consideration of some issues, such as the vertical angles and multiple input and multiple output (MIMO) antenna elements, in comparison to ITU-R M.2412 [24]. This simplification allows us to investigate the sharing feature of JCAS channels more clearly. When we superimpose or extend these factors, model (2) remains without loss of generality.
Theoretically, both the communication and sensing processes follow the physical electromagnetic propagation mechanisms. As displayed in Fig. 3, the communication signal transmitted from the base station to the mobile terminal is reflected by the buildings, while the sensing signal transmitted to the buildings is reflected back to the base station itself for receiving. Therefore, the buildings acting on both the communication and sensing channels become shared scatterers, by which the shared clusters (denoted as in model (2)) with similar delay or angular characteristics are generated. In the proposed model, the shared clusters in communication and sensing channels are represented as shared sub-clusters, which are marked with braces in model (2). The shared sub-clusters of communication and sensing channels have differences in certain parameters. Although the angles of the sub-cluster centroids are roughly consistent, the delays should be considered separately or mathematically calculated according to the transceiver position. Moreover, the dispersion of the shared sub-clusters also deviates, due to the different propagation paths and beam widths of communication and sensing.
The physical propagation paths experienced by reflection, scattering, diffraction, etc., are subject to complex environmental conditions, and not all objects can be detected and act in both communication and sensing channels. As illustrated in Fig. 3, some sensing scatterers (indicated by the tree) will only contribute sensing clusters (denoted as in model (2)), when they are in the vicinity of the communication TX (i.e., the base station) and the path to the RX (i.e., the mobile terminal) is blocked. On the other hand, only the specific directed paths to the mobile terminal are generated and with difficulty having a backscattering path to the base station in the following potential circumstances: The scatterer surface has significant specular properties. The angle between the incident electromagnetic wave and the scatterer surface is too small, such as in a narrow corridor scene. The scatterer is close to the communication RX and affects the channels of communication, but it is challenging to detect due to the low echo power of the sensing process.
In the above cases, the scatterers (indicated by the car in Fig. 3) only contribute communication clusters (denoted as in model (2)). In this section, only the dominant single-hop paths are considered, and retaining multi-hop analysis will result in a more complex sharing relationship for JCAS channels. Moreover, it should be noted that this paper investigates the omni-directional channels of communication and sensing. When the communication and sensing beams are directed to different regions through beamforming [25, 20], shared and non-shared scatterers and clusters will naturally appear depending on the beam coverage.
To measure the sharing feature of the JCAS channels, we define the sharing degree (SD) metric by power description for communication and sensing channels, respectively. Based on the proposed model, the sensing SD is expressed as
| (3) |
where and are the power of shared sensing sub-clusters and total clusters () in model (2), respectively. Similarly, the communication SD is expressed as . In these formulas, stands for the proportion of shared parts in the respective received power.
III-B Joint Clustering for Communication and Sensing Channels
Existing clustering algorithms operate on a single channel. However, the shared clusters in the proposed model are contributed by both the communication and sensing channels. To extract those clusters (shared and non-shared ones), a joint clustering with both channels integrated is necessary. In this part, a novel KPowerMeans-based joint clustering algorithm (KPM-JCA) is introduced in the following to address this issue.
Firstly, the PADP of the measured communication or sensing channel is denoised with the dynamic range of power, , and the parameter set of effective MPCs is expressed as
| (4) |
where the subscript denotes communication or sensing. and are the index and the total number of valid MPCs at all rotation angles in the measurement, respectively. denotes the power of the MPC. and have the same meanings as in formula (1).
Then, unlike traditional clustering algorithms applied for a single channel, we merge the MPC parameter sets from the sensing channel, , and communication channel, , with additionally marking the source of each data. The joint effective parameter set of JCAS channel, , is acquired. Note that although the functions and devices in JCAS systems are integrated, communication and sensing channels are essentially two links with potentially different propagation power losses. When there is a significant variance in the path loss, it will be challenging to efficiently extract the shared clusters served for both two channels. Therefore, to balance and normalize the power impact between the communication and sensing MPCs in the subsequent KPowerMeans algorithm, this paper introduces a power compensation coefficient, , for communication MPCs. The calculation is represented as , .
Considering the complexity and practicality, we utilize the Multipath Component Distance (MCD) of the delay and angle dimension to weigh MPC similarity and apply the classic KPowerMeans algorithm for clustering [26, 27]. To improve the certainty and accuracy of clustering results, a step in [28] is adopted to get initial centroid positions with distance checking. Moreover, a range for the expected number of clusters, , should be specified first for automatic clustering.
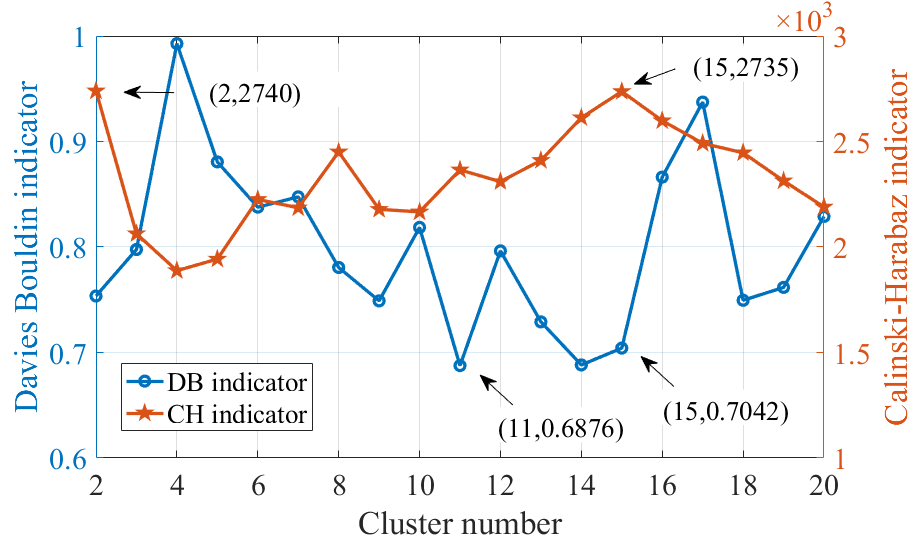
For clustering performance evaluation, the Davies Bouldin (DB) and Calinski-Harabaz (CH) are two well-known indicators [27, 26]. The lower value of the DB indicator stands for closer paths within clusters, while the higher value of the CH indicator stands for more separate clusters. According to the echo detection mode, the sensing process has a relatively uniform information acquisition capability for all indoor scatterers. Therefore, the measured MPCs do not have distinct centralized clustering characteristics (as corroborated in Fig. 2(b)), which brings uncertainties and challenges to the evaluation of clustering performance and the selection of optimal cluster numbers in JCAS channels.
Taking the measured data of JCAS channel 1 (the communication RX antenna is set at position 1) as an example, we set the range of as . Fig. 4(a) shows the DB and CH values for each cluster number, which are the average results of multiple snapshots. It can be observed that the DB and CH curves are non-convex functions with large volatility. When , the optimal value of DB is 0.6876, and when , the optimal value of CH is 2740. The optimal numbers of clusters revealed by the two classic indicators are not consistent, and the values of the other indicator are not ideal at the single optimal points.
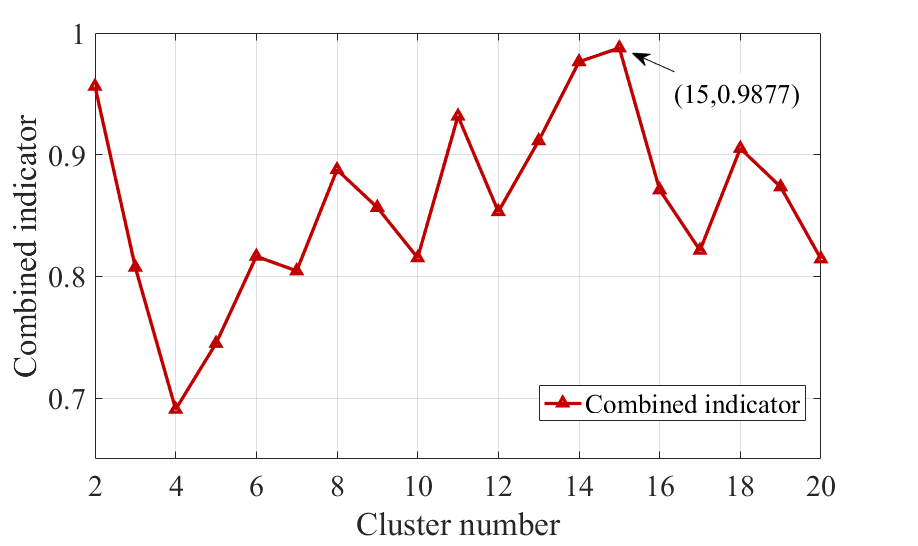
In the literature, some work has been done to combine these two classic metrics. For instance, a cluster validation method with a DB threshold is proposed in [26], and the maximizes CH within the DB threshold is selected as the optimal cluster number. However, in the fluctuating data of measured JCAS channels, as expounded in Fig. 4(a), even different thresholds of the same set of data will lead to various cluster number selection results. To obtain the desired clustering results, the threshold usually needs to be subjectively adjusted according to the specific values, which is inefficient when the amount of data is large. Therefore, this paper introduces a trade-off method for DB and CH indicators to automatically evaluate and select the optimal number of clusters, which is calculated by
| (5) |
where and denote the DB and CH values, respectively, when the cluster number is . and are the corresponding optimal values, traversing . The value range of the combined indicator in is , and the optimal number of clusters is , which maximizes the combined indicator.
The quantified results of JCAS channel 1 applying the formula (5) are shown in Fig. 4(b). When , the combined indicator is optimal, where both the DB and CH indicators have sub-optimal values (0.7042 and 2735), as shown in Fig. 4(a). In this case, there is indeed a more reasonable visual clustering result, which has been presented in subsequent Fig. 5(a). Note that while this trade-off selection method of cluster number is proposed for JCAS channel MPCs with insignificant clustering characteristics, it is also applicable to regular data.
IV Model Parameterized Analysis and Validation
IV-A Clustering Results of Measured MPCs
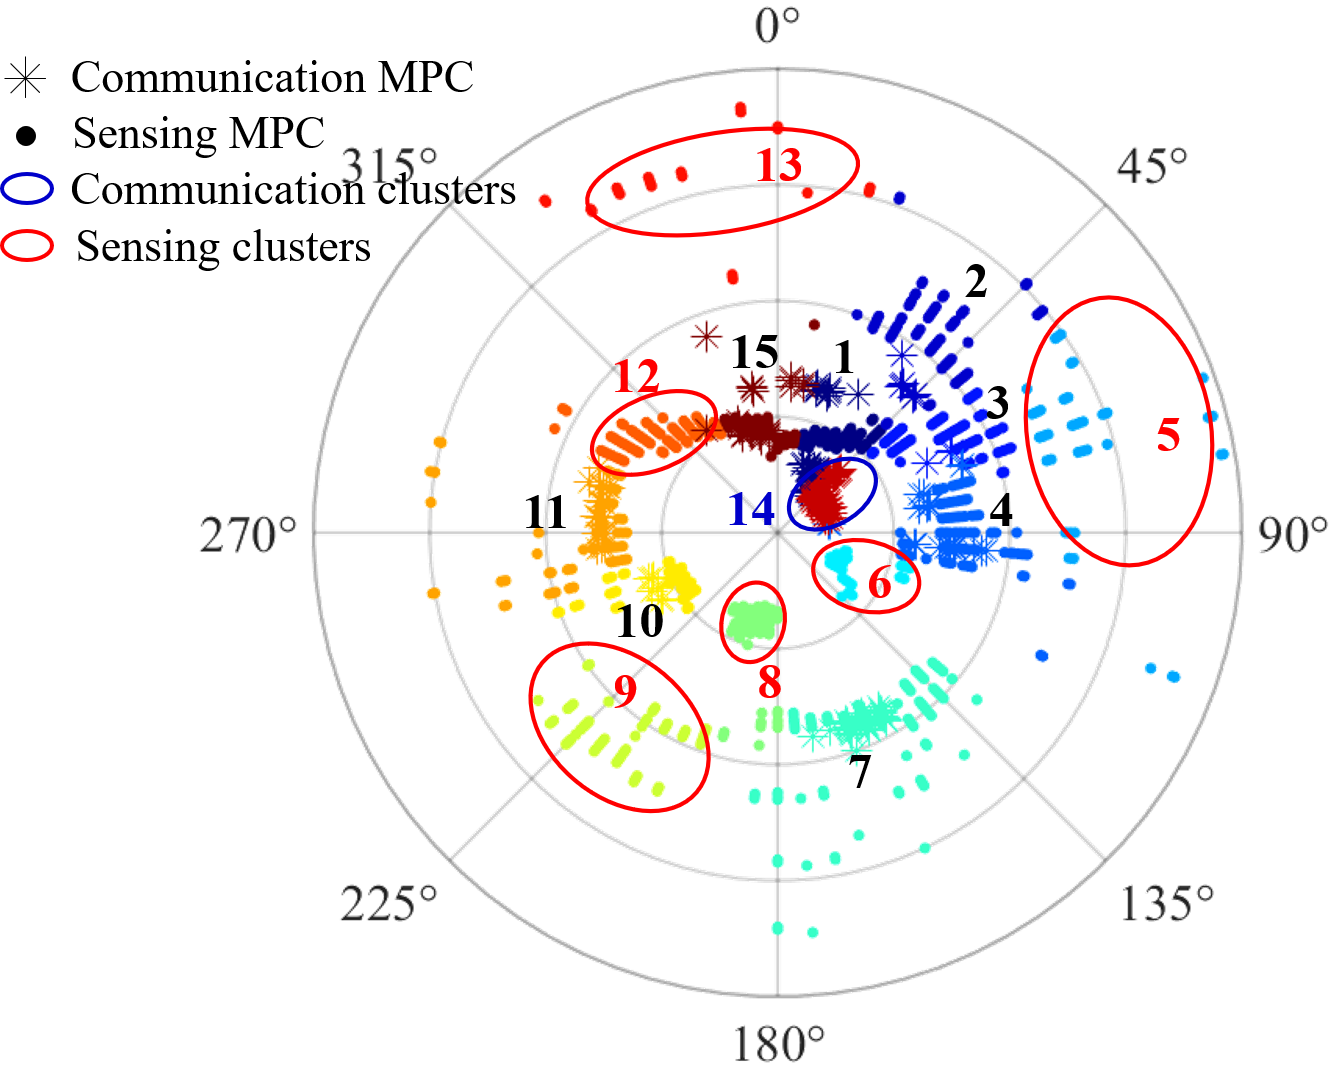
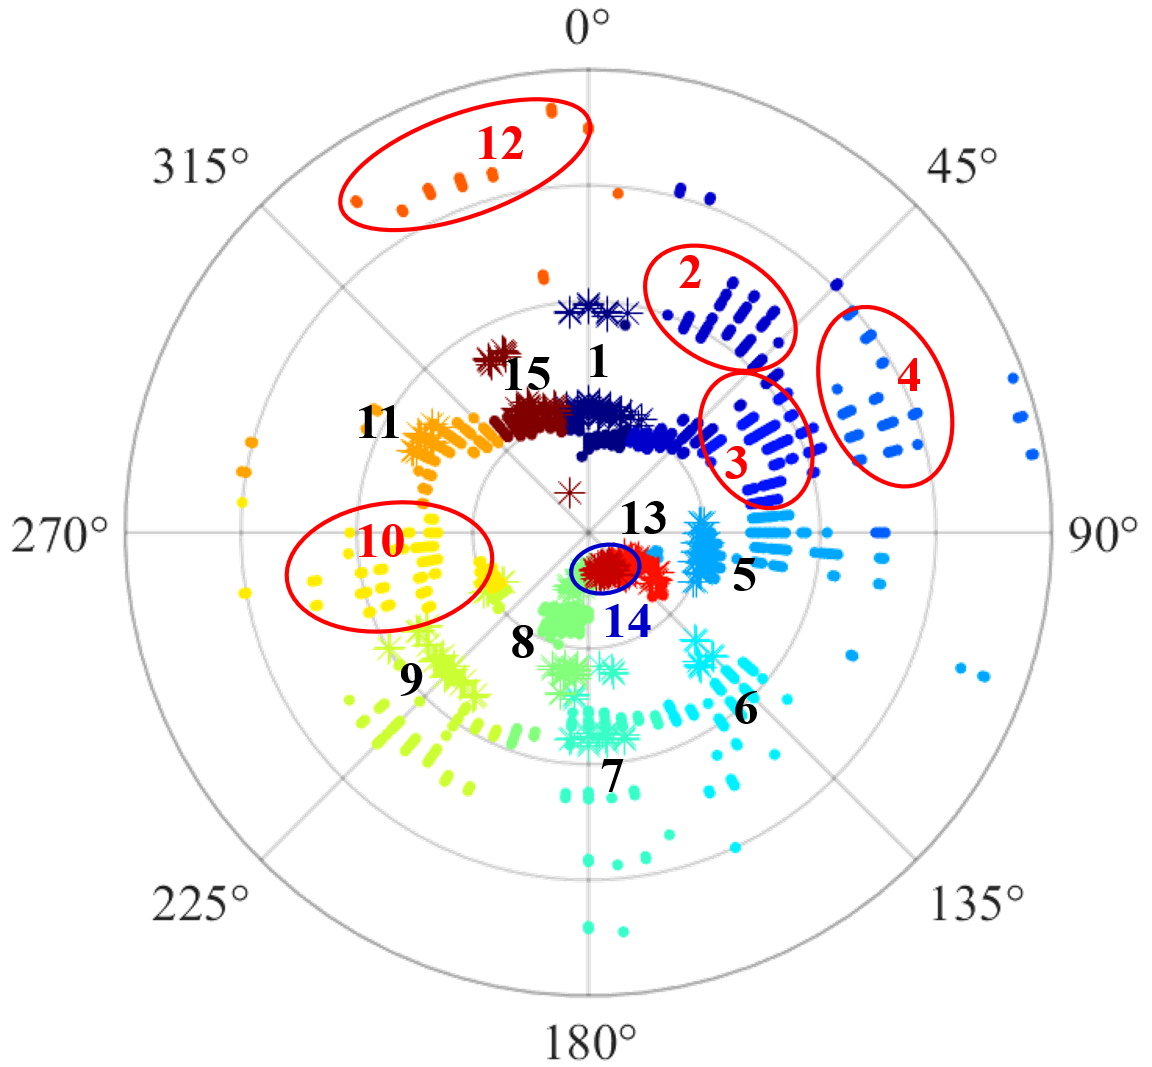
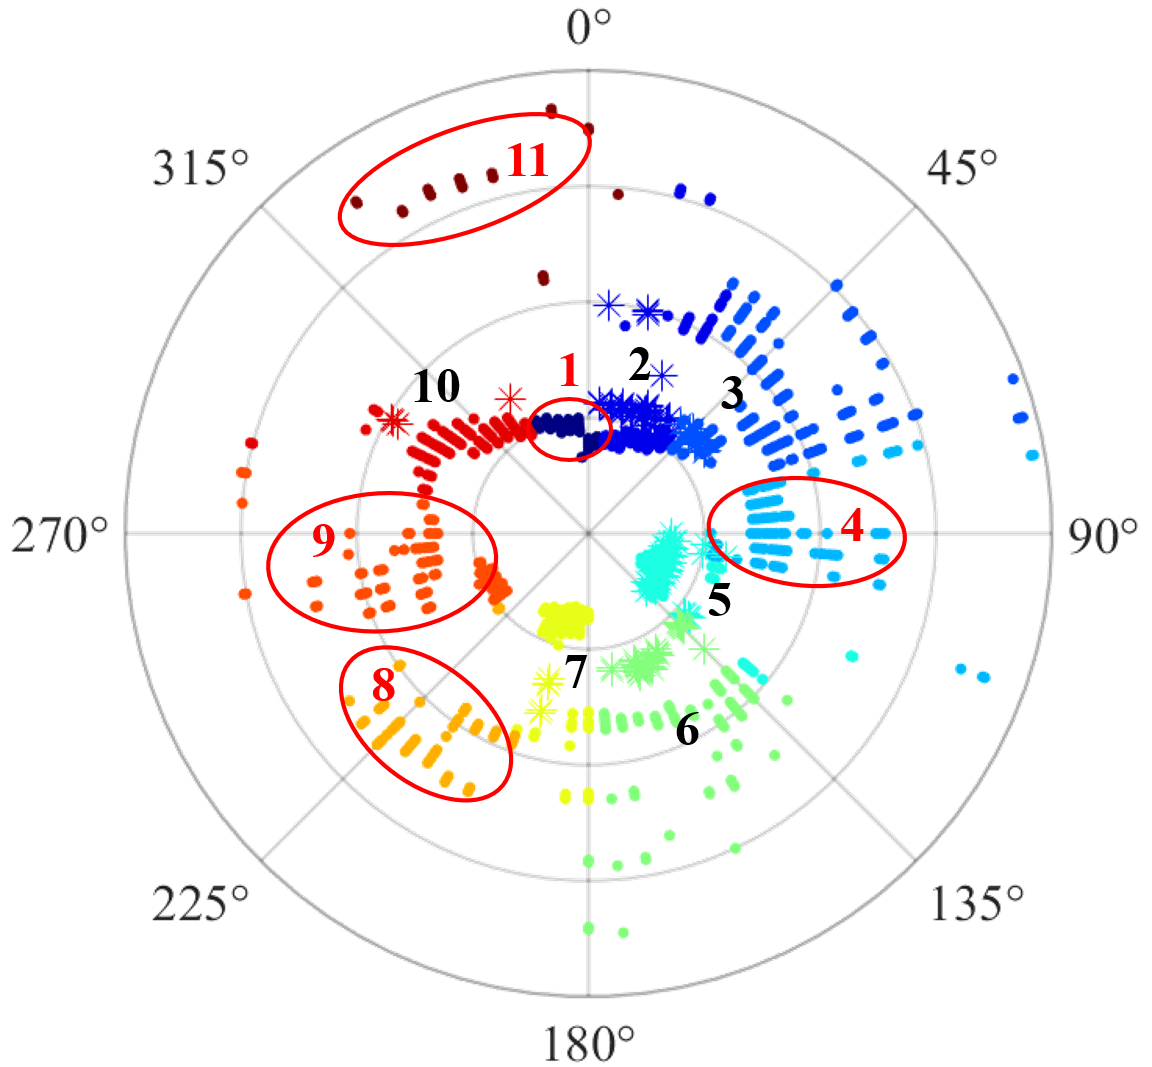
Fig. 5(a)-5(c) show the KPM-JCA results of measured MPCs for three JCAS channels, where the communication RX antenna is at position 1, 2, and 3 (as shown in Fig. 1(a)), respectively. The circle’s center, angle, and radius meanings are the same as in Fig. 2, and different clusters are marked with different serial numbers and colors. As demonstrated in Fig. 5, some clusters contain communication and sensing MPCs with similar attributes (i.e., angle and delay) at the same time, which are labeled by black numbers in these figures. For example, the clusters 1-4, 7, 10-11, and 15 in Fig. 5(a). Clusters 1-4 and 15 are contributed by the shared south wall (compared with Fig. 2(b) and Fig. 2(c)), cluster 7 corresponds to the shared north wall, and clusters 10-11 are associated with the east pillar and wall. These measured clusters validate the realistic shared clusters expressed as in model (2). Similarly, clusters 1, 5-9, 11, 13, and 15 are shared clusters in Fig. 5(b). In Fig. 5(c), clusters 2-3, 5-7, and 10 are shared clusters. Although the parameters and dispersion of communication and sensing MPCs within these clusters differ to some extent, they are all contributed by the same shared scatterer and map the scatterer properties in terms of delay and angle. Moreover, the clusters containing only communication or sensing MPCs, besides shared clusters, are annotated by the red and blue circles in Fig. 5.
As corroborated in Fig. 5, the sensing clusters are more numerous and more discretely distributed, whereas communication clusters are fewer in number and have a more concentrated and sparse distribution. This observation is determined by the communication and sensing channel characteristics, and it corresponds to the channel scatterer distribution depicted in Fig. 2. As previously stated, almost all scatterers in our measurement scenarios can be sensed, consequently, sensing clusters also cover information about the entire environment. However, in JCAS channels 1 and 2, as shown in Fig. 5(a) and 5(b), cluster 14 only contains communication MPCs, which is at LOS condition. This is due to the communication RX not being located in the sensing measurement environment. The shared and communication cluster sets are equivalent in the case of NLOS condition, as shown in Fig. 5(c).
| Channels | Cluster number | Sensing cluster number (label) | Communication cluster number (label) | Shared cluster number (label) | |
| 1 (LOS) | 15 | 14 (1-13,15) | 9 (1,2,3,4,7,10,11,14,15) | 8 (1,2,3,4,7,10,11,15) | 0.65 |
| 2 (LOS) | 15 | 14 (1-13,15) | 10 (1,5,6,7,8,9,11,13,14,15) | 9 (1,5,6,7,8,9,11,13,15) | 0.64 |
| 3 (NLOS) | 11 | 11 (1-11) | 6 (2,3,5,6,7,10) | 6 (2,3,5,6,7,10) | 0.54 |
Due to the sensing mechanism in our measurements covering all environmental scatterers, can be used as a benchmark to measure the degree of JCAS channel similarity. The values of in three measured JCAS channels are 0.65, 0.64, and 0.54, respectively. These values depend on the realistic various channel environment and are higher at typical communication LOS conditions (e.g., channels 1 and 2) than at typical NLOS conditions (e.g., channel 3). Specifically, the SD metric can be applied to guide the power configuration of the JCAS channels in modeling simulation. When the SD value is greater, the correlation of JCAS channels increases, and there is more potential to be tapped to realize the mutual auxiliary functions of communication and sensing in JCAS systems. More quantitative results of joint clustering are given in Table II.
IV-B Stochastic Characteristic Analysis
Based on the joint clustering results, we further acquire the stochastic intra- and inter- cluster parameters, including the path number, the root mean square delay spread (rms DS), and the angle spread (rms AS) on all snapshots of JCAS measurements. For example, the rms DS in cluster is calculated as
| (6) | |||
| (7) |
where indicates the mean delay of the cluster. and are respectively the delay and normalized power of the MPC. is the total number of the MPCs in the cluster. Replacing with in the above formulas, the azimuthal AS can be calculated similarly. Besides, a method proposed in [29] is utilized here to avoid angular ambiguity.
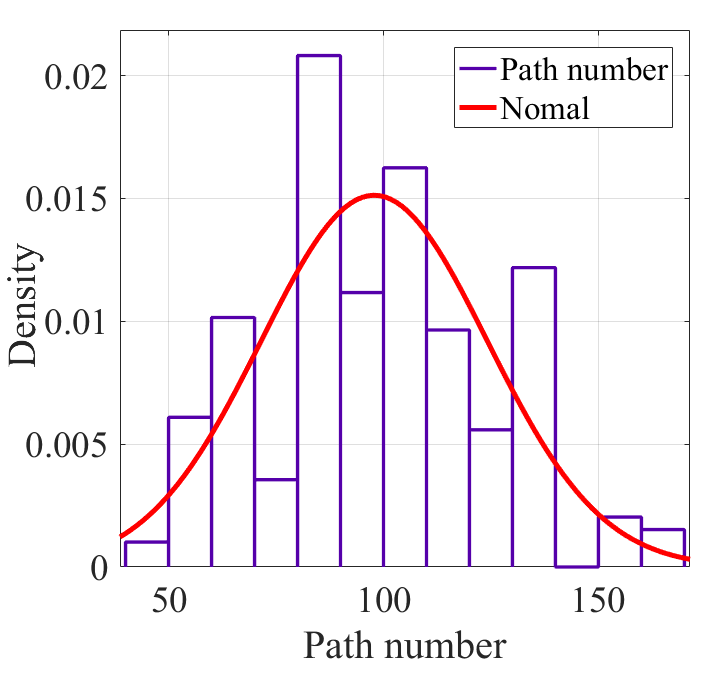
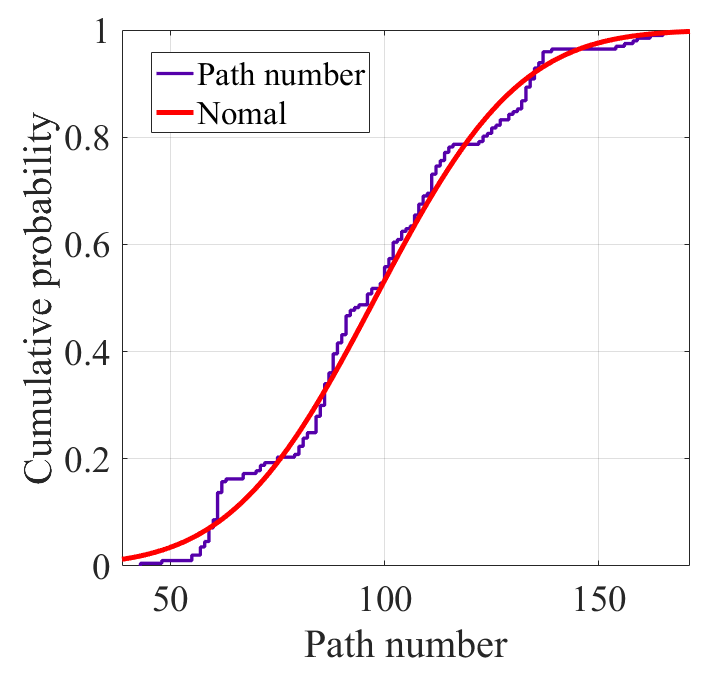
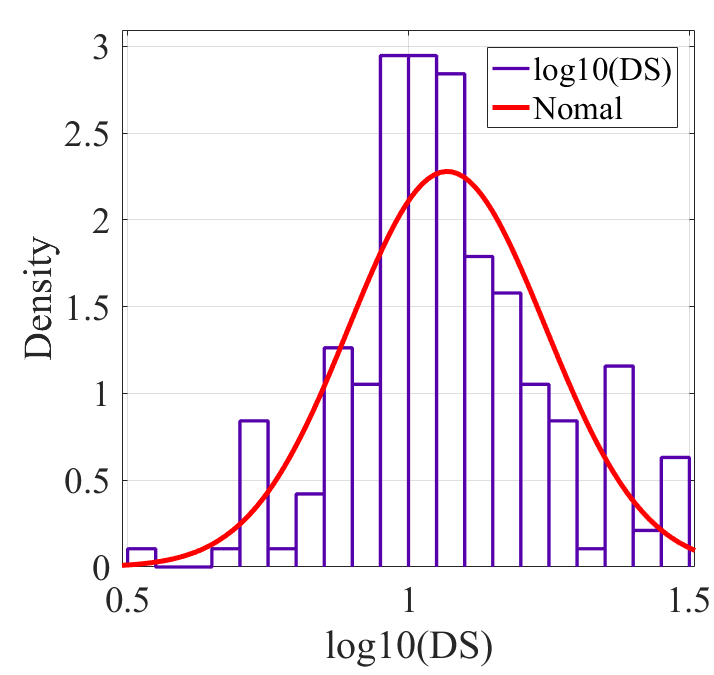
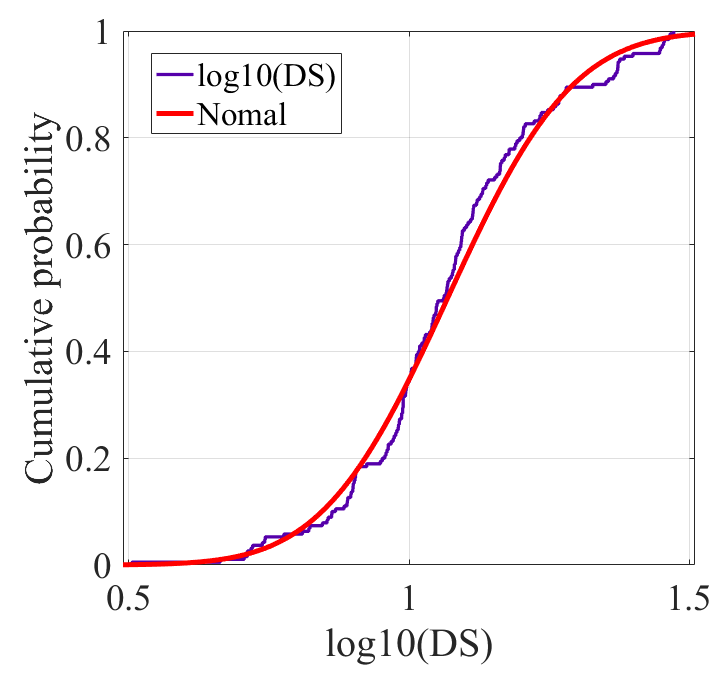
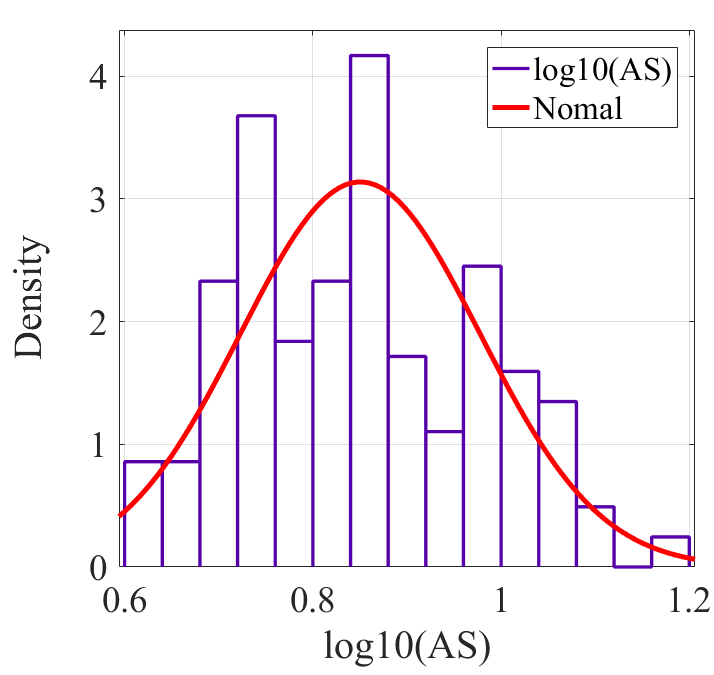
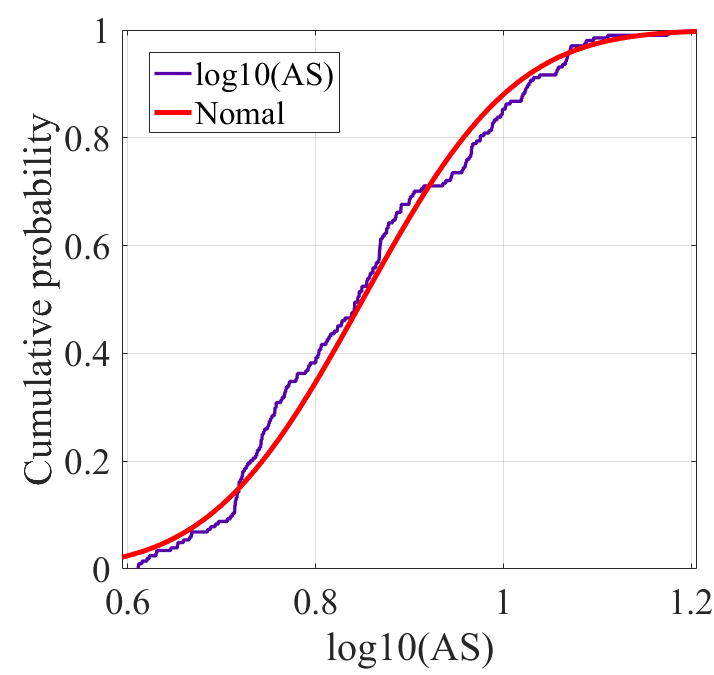
In terms of the intra-cluster parameters, this paper primarily focuses on the research of shared clusters (i.e., in model (2)), given that the independent communication or sensing clusters would follow the traditional rules. The probability density function (PDF) and cumulative distribution function (CDF) of intra-cluster path numbers, , and are drawn in Fig. 6. These distributions are fitted through the normal distribution , which is the same as ITU-R M.2412 [24]. The mean values (i.e., ) of the distribution are 98, 1.07 (11.75 ns), and 0.85 (7.08∘), respectively. The greater the variance (i.e., ), the more dynamic the parameter value. Moreover, the stochastic parameters of shared sub-clusters (marked with braces in model (2)) are further extracted and listed in Table III.
By plugging all cluster centroid parameters from a single clustering result into formulas (6) and (7), the inter-cluster parameters can be calculated. The inter-cluster DS and AS reflect the cluster distribution of the delay and angular domain, respectively. The higher the value, the more discrete the distribution. The rms DS and AS averages of joint, communication, and sensing clusters (i.e. , and in model (2)) are shown in Table IV. Based on the quantitative results above, the stochastic characteristics presented by the clusters in the delay and angular dimensions are analyzed below.
1) Delay characteristics: As can be seen from the mean inter-cluster parameters in Table IV, the rms DS value of sensing clusters (28.82 ns) is roughly twice the corresponding value of communication clusters (13.87 ns), and the value of joint clusters (24.77 ns) reflects the average effect of communication and sensing. These numerical results demonstrate the discrete properties of sensing clusters as well as the centrality and sparsity of communication clusters in the delay domain.
The stochastic parameters within shared clusters and sub-clusters in Table III demonstrate that the of the shared sensing sub-clusters in DS fitted distribution (1.08) is higher while the (0.06) is lower than that of shared communication sub-clusters (0.55 and 0.19). It corroborates that the MPCs within shared sensing sub-clusters have a more discrete distribution but a more stable structure than that of communication in the delay domain. Furthermore, due to the larger path number, the shared sensing sub-clusters have a greater impact on the overall, and their parameter values are closer to the shared clusters’ (1.07 and 0.03).
| Parameter | Shared clusters (,) | Shared sub-clusters | |
| Communication (,) | Sensing (,) | ||
| Path number | (98,695) | (24,153) | (75,867) |
| (1.07,0.03) | (0.55,0.19) | (1.08,0.06) | |
| (0.85,0.02) | (0.73,0.03) | (0.88,0.04) | |
| Cluster categories | rms DS (ns) | rms AS (∘) |
| Total joint clusters | 24.77 | 62.35 |
| Communication clusters | 13.87 | 38.66 |
| Sensing clusters | 28.82 | 91.29 |
2) Angular characteristics: As shown in Table IV, the mean inter-cluster AS values of communication and sensing clusters (38.66∘ and 91.29∘) prove the centralized and discrete distribution in the angular domain, respectively. The value of sensing clusters is about 2.4 times more than communication’s, and they balance the value of the joint clusters (62.35∘).
The results in Table III show that the and of the shared sensing sub-clusters in AS fitted distribution (0.88 and 0.04) are higher than that of communication sub-clusters (0.73 and 0.03). It corroborates that, when compared to sensing, the MPC distribution within shared communication sub-clusters is more concentrated and sparse in the angular domain, and the structure is more stable. Moreover, the of all distributions in Table III are close and relatively low, and the shared sensing sub-clusters have a somewhat higher impact on the overall value of shared clusters (0.85).
When the rms AS values for all types of clusters are compared to the DS values, the inter-cluster AS is relatively larger, while the intra-cluster AS is relatively smaller, indicating that the measured JCAS clusters have better aggregation characteristics in the angle domain.
IV-C Simulation Validation
This paper develops and performs preliminary simulations based on the measurement results to validate the practicality and controllability of the proposed model. We consider the Indoor Hotspot (InH) scenario in ITU-R M.2412 [24] as the baseline scenario, which adapts to this paper’s measurement environment. The single base station and user terminal, both equipped with a single antenna, are used in the simulation configuration. The center frequency is set as 28 GHz, and the system bandwidth is set as 1 GHz, consistent with our measurement campaign.
Based on the same set of environment layouts, the JCAS model implementation steps are summarized as follows.
1) Generate stochastic parameters of sensing clusters. The clustering results of measured sensing channels, such as DS and AS values, are applied in simulation to generate stochastic parameters of sensing clusters with the number . The other configurations adopt the default values of the standards.
2) Generate shared parameters of communication clusters. clusters are randomly selected from the sensing clusters generated in the previous step as shared sub-clusters, whose cluster centroid angles are multiplexed as the values of the shared communication sub-clusters. The other parameters of shared communication sub-clusters continue to be generated stochastically based on the standards and measured data.
3) Generate stochastic parameters of communication clusters. Similarly to step 1), the measured results are applied to generate stochastic parameters of non-shared communication clusters with the number . The other configurations adopt the default values of the standards.
4) Generate JCAS channel response. The global JCAS channel response is generated by superposing channel responses of all the above clusters.
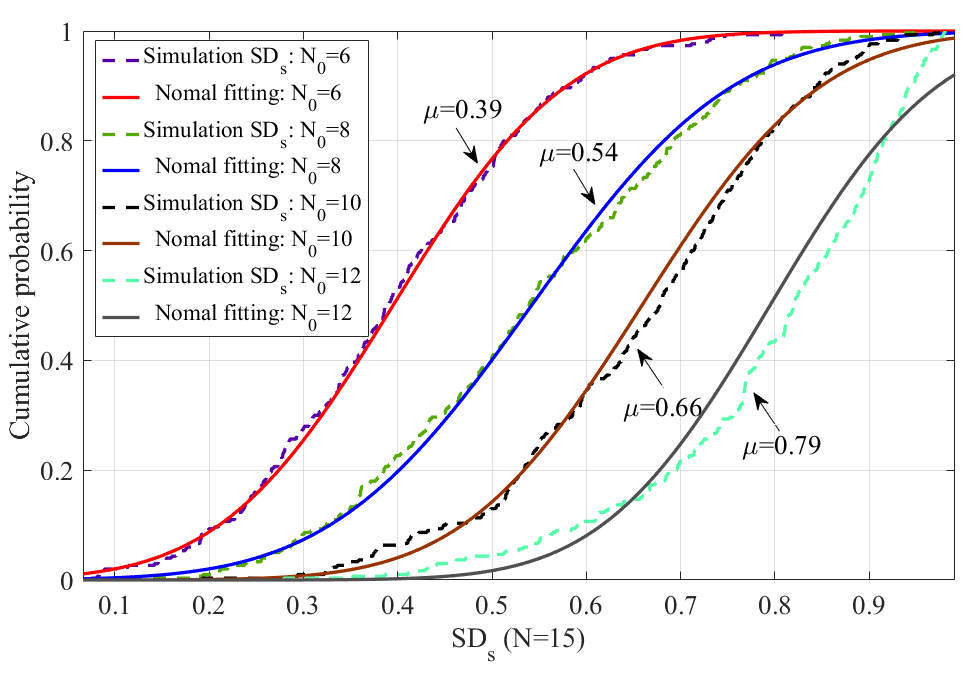
Firstly, we set the total cluster number , and disregard the generation of non-shared communication clusters in simulation step 3) (i.e., and ), which is adapted to the measurements in this paper. Fig. 8 presents the CDFs of when the number of shared clusters (i.e., communication clusters ) is 6, 8, 10, and 12. The dashed lines depict 300 sets of simulation results, and the solid lines are the fitting curves of the normal distribution. These CDFs corroborate that the larger the proportion of , the higher the value of . The desired value can be obtained by controlling the appropriate . When , the mean value of () is close to the results of measured JCAS channels 1 (0.65) and 2 (0.64), as listed in Table II. As for JCAS channel 3, the proportion of is , whose realistic value is the same as curve (). The proportion of the curve is , which is close to the proportion of channel 3.
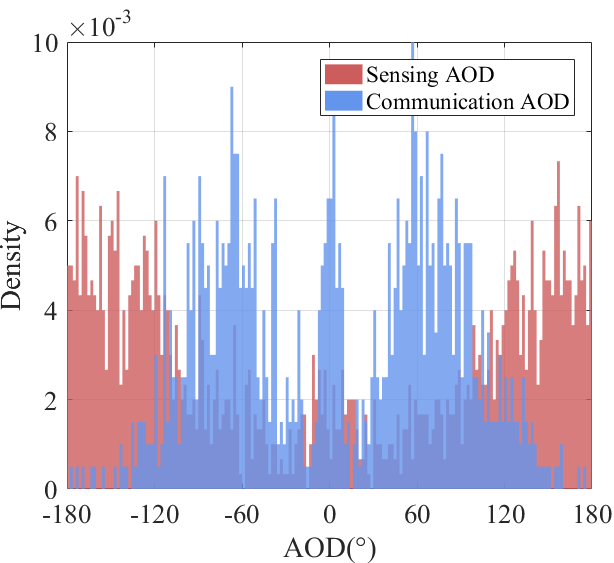
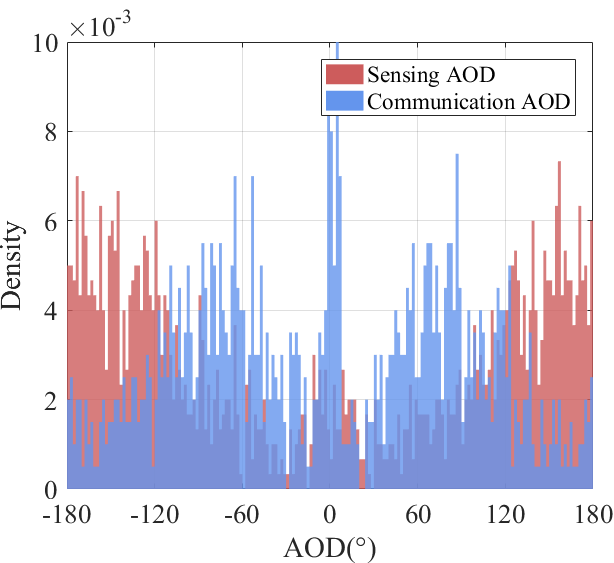
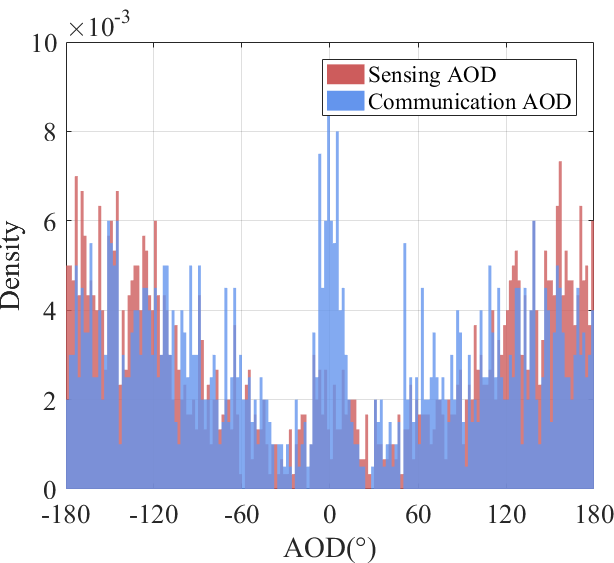
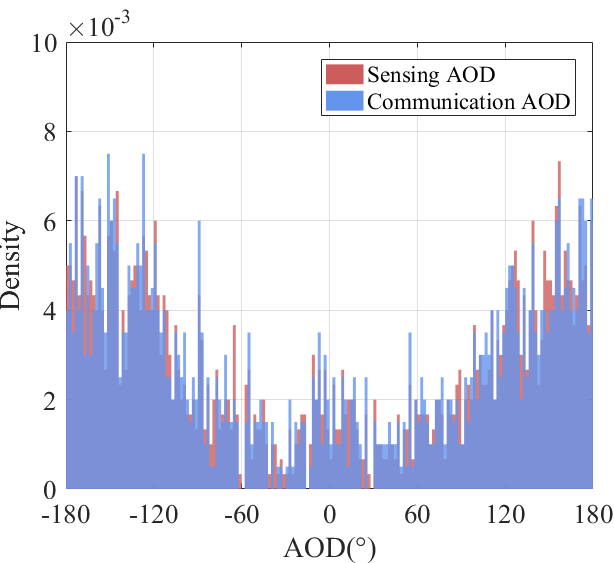
The non-shared communication clusters should be considered in the simulation, although they are not intuitively represented in the measurement results of this paper. In Section III, the possible situations for different types of scatterers and clusters have been analyzed. Since the shared sub-clusters are directly associated with the cluster centroid angles in the simulation configuration, we examine the effect of changing the shared cluster settings on the JCAS channels using the cluster centroid AOD as an example. Here, we set the total cluster number of communication and sensing as and , respectively. The LOS angle is set as zero-degree. We perform 100 sets of simulations by applying the inter-cluster AS of stochastic sensing and communication clusters as 91.29∘ and 38.66∘, respectively, based on the measured clustering results in Table III. For each simulation, the stochastic parameters of sensing clusters are generated according to the simulation step 1). Then, communication parameters are simulated when the shared cluster number, , is 0, 2, 6, and 10 (according to the steps 2) and 3)).
The PDFs of communication and sensing AODs are shown in Fig. 7, where the sensing PDF (indicated by the red area) is repeated as a benchmark in these figures. Fig. 7(a) shows the random generation result of communication and sensing AODs with respective AS values. As the proportion increases (from Fig. 7(a) to Fig. 7(d)), the PDF of communication AODs (indicated by the blue area) gradually converges with the sensing one, and channels will exhibit more similar characteristics in the angular domain.
V Conclusion
This paper proposes a shared cluster-based stochastic channel model for JCAS systems and validates it according to realistic channel measurements and simulations. Firstly, we conduct the channel measurement campaign in typical LOS and NLOS indoor scenarios at 28 GHz and obtain the PADPs. The scatterers shared by communication and sensing channels are intuitively observed. Based on the concept of shared clusters (contributed by the shared scatterers), a stochastic channel model expressed by the superposition of shared and non-shared clusters is proposed to capture the sharing feature. The SD metric is also introduced to define the power ratio of the shared clusters in the channels. Correspondingly, the KPM-JCA is novelly introduced, which enables extracting the shared and non-shared clusters for JCAS channels. Finally, based on the proposed model and clustering algorithms, stochastic inter- and intra- cluster parameters, including the DS, AS, and SD, are acquired from the measurement results. And the experimental validation of the proposed model with parameterization is performed. The results demonstrate that the communication clusters have a more concentrated and sparse distribution while sensing clusters are distributed more discretely. In addition, the shared MPCs have stronger clustering features in the angular domain than in the delay domain. The clustering results of measured MPCs confirm and quantify the realistic characteristics of shared clusters in JCAS channels, where the SD is calculated as 0.65, 0.64, and 0.54 in the two LOS and one NLOS measurements, respectively. The simulation work validates the practicality and controllability of the proposed model, which applies to the development of JCAS systems.
Acknowledgments
This research is supported in part by National Natural Science Foundation of China (No.92167202), National Science Foundation for Distinguished Young Scholars of China (No.61925102), National Natural Science Foundation of China (No.62201087), and BUPT-CMCC Joint Innovation Center.
References
- [1] G. Liu, Y. Huang, N. Li, J. Dong, J. Jin, Q. Wang, and N. Li, “Vision, requirements and network architecture of 6G mobile network beyond 2030,” China Communications, vol. 17, no. 9, pp. 92–104, 2020.
- [2] P. Kumari, J. Choi, N. González-Prelcic, and R. W. Heath, “IEEE 802.11 ad-based radar: An approach to joint vehicular communication-radar system,” IEEE Trans. Veh. Technol., vol. 67, no. 4, pp. 3012–3027, 2017.
- [3] G. Nie, J. Zhang, Y. Zhang, L. Yu, Z. Zhang, Y. Sun, L. Tian, Q. Wang, and L. Xia, “A predictive 6G network with environment sensing enhancement: From radio wave propagation perspective,” China Communications, vol. 19, no. 6, pp. 105–122, 2022.
- [4] J. A. Zhang, X. Huang, Y. J. Guo, J. Yuan, and R. W. Heath, “Multibeam for joint communication and radar sensing using steerable analog antenna arrays,” IEEE Trans. Veh. Technol., vol. 68, no. 1, pp. 671–685, 2018.
- [5] A. Liu, Z. Huang, M. Li, Y. Wan, W. Li, T. X. Han, C. Liu, R. Du, D. K. P. Tan, J. Lu et al., “A survey on fundamental limits of integrated sensing and communication,” IEEE Commun. Surveys Tuts., vol. 24, no. 2, pp. 994–1034, 2022.
- [6] Y. Cui, F. Liu, X. Jing, and J. Mu, “Integrating sensing and communications for ubiquitous IoT: Applications, trends, and challenges,” IEEE Network, vol. 35, no. 5, pp. 158–167, 2021.
- [7] J. A. Zhang, F. Liu, C. Masouros, R. W. Heath, Z. Feng, L. Zheng, and A. Petropulu, “An overview of signal processing techniques for joint communication and radar sensing,” IEEE J. Sel. Topics Signal Process., 2021.
- [8] L. Pucci, E. Paolini, and A. Giorgetti, “System-level analysis of joint sensing and communication based on 5G new radio,” IEEE J. Sel. Areas Commun., 2022.
- [9] J. Zhang, P. Tang, L. Yu, T. Jiang, and L. Tian, “Channel measurements and models for 6G: current status and future outlook,” Frontiers of information technology & electronic engineering, vol. 21, no. 1, pp. 39–61, 2020.
- [10] Z. Yuan, J. Zhang, Y. Ji, G. F. Pedersen, and W. Fan, “Spatial non-stationary near-field channel modeling and validation for massive MIMO systems,” IEEE Trans. Antennas Propag., 2022.
- [11] T. T. Nguyen, K. Elbassioni, N. C. Luong, D. Niyato, and D. I. Kim, “Access management in joint sensing and communication systems: Efficiency Versus Fairness,” IEEE Trans. Veh. Technol., vol. 71, no. 5, pp. 5128–5142, 2022.
- [12] M. L. Rahman, J. A. Zhang, X. Huang, Y. J. Guo, and R. W. Heath, “Framework for a perceptive mobile network using joint communication and radar sensing,” IEEE Trans. Aerosp. Electron. Syst., vol. 56, no. 3, pp. 1926–1941, 2019.
- [13] R. Zhang, B. Shim, W. Yuan, M. Di Renzo, X. Dang, and W. Wu, “Integrated sensing and communication waveform design with sparse vector coding: Low sidelobes and ultra reliability,” IEEE Trans. Veh. Technol., vol. 71, no. 4, pp. 4489–4494, 2022.
- [14] X. Yuan, Z. Feng, J. A. Zhang, W. Ni, R. P. Liu, Z. Wei, and C. Xu, “Spatio-temporal power optimization for MIMO joint communication and radio sensing systems with training overhead,” IEEE Trans. Veh. Technol., vol. 70, no. 1, pp. 514–528, 2020.
- [15] J. Poutanen, K. Haneda, J. Salmi, V.-M. Kolmonen, F. Tufvesson, T. Hult, and P. Vainikainen, “Significance of common scatterers in multi-link indoor radio wave propagation,” in Proceedings of the Fourth European Conference on Antennas and Propagation. IEEE, 2010, pp. 1–5.
- [16] J. Poutanen, F. Tufvesson, K. Haneda, V.-M. Kolmonen, and P. Vainikainen, “Multi-link MIMO channel modeling using geometry-based approach,” IEEE Trans. Antennas Propag., vol. 60, no. 2, pp. 587–596, 2011.
- [17] F. Liu, C. Masouros, A. P. Petropulu, H. Griffiths, and L. Hanzo, “Joint radar and communication design: Applications, state-of-the-art, and the road ahead,” IEEE Trans. Commun., vol. 68, no. 6, pp. 3834–3862, 2020.
- [18] X. Chen, Z. Feng, Z. Wei, P. Zhang, and X. Yuan, “Code-division OFDM joint communication and sensing system for 6G machine-type communication,” IEEE Internet Things J., vol. 8, no. 15, pp. 12 093–12 105, 2021.
- [19] A. Ali, N. González-Prelcic, and A. Ghosh, “Passive radar at the roadside unit to configure millimeter wave vehicle-to-infrastructure links,” IEEE Trans. Veh. Technol., vol. 69, no. 12, pp. 14 903–14 917, 2020.
- [20] N. Gonzalez-Prelcic, R. Méndez-Rial, and R. W. Heath, “Radar aided beam alignment in mmWave V2I communications supporting antenna diversity,” in 2016 Information Theory and Applications Workshop (ITA). IEEE, 2016, pp. 1–7.
- [21] A. Graff, A. Ali, and N. González-Prelcic, “Measuring radar and communication congruence at millimeter wave frequencies,” in 2019 53rd Asilomar Conference on Signals, Systems, and Computers. IEEE, 2019, pp. 925–929.
- [22] T. Jiang, J. Zhang, M. Shafi, L. Tian, and P. Tang, “The comparative study of S-V model between 3.5 and 28 GHz in indoor and outdoor scenarios,” IEEE Trans. Veh. Technol., vol. 69, no. 3, pp. 2351–2364, 2019.
- [23] Y.-H. Noh, H. R. Im, W. Kim, I.-P. Hong, and J.-G. Yook, “Bistatic rcs estimation using monostatic scattering centers with compressive sensing,” IEEE Trans. Antennas Propag., 2022.
- [24] “Guidelines for evaluation of radio interface technologies for IMT-2020,” ITU-R, M.2412., Oct. 2017. [Online]. Available: www.itu.int.
- [25] P. Kumari, N. J. Myers, and R. W. Heath, “Adaptive and fast combined waveform-beamforming design for mmwave automotive joint communication-radar,” IEEE J. Sel. Topics Signal Process., vol. 15, no. 4, pp. 996–1012, 2021.
- [26] N. Czink, P. Cera, J. Salo, E. Bonek, J.-P. Nuutinen, and J. Ylitalo, “A framework for automatic clustering of parametric MIMO channel data including path powers,” in IEEE Vehicular Technology Conference. IEEE, 2006, pp. 1–5.
- [27] Y. Li, J. Zhang, Z. Ma, and Y. Zhang, “Clustering analysis in the wireless propagation channel with a variational gaussian mixture model,” IEEE Transactions on Big Data, vol. 6, no. 2, pp. 223–232, 2020.
- [28] C. Huang, J. Zhang, X. Nie, and Y. Zhang, “Cluster characteristics of wideband mimo channel in indoor hotspot scenario at 2.35 GHz,” in 2009 IEEE 70th Vehicular Technology Conference Fall. IEEE, 2009, pp. 1–5.
- [29] W. Dong, J. Zhang, X. Gao, P. Zhang, and Y. Wu, “Cluster identification and properties of outdoor wideband MIMO channel,” in 2007 IEEE 66th Vehicular Technology Conference. IEEE, 2007, pp. 829–833.