Investigating Fairness Disparities in Peer Review:
A Language Model Enhanced Approach
Abstract.
Double-blind peer review mechanism has become the skeleton of academic research across multiple disciplines including computer science, yet several studies have questioned the quality of peer reviews and raised concerns on potential biases in the process. In this paper, we conduct a thorough and rigorous study on fairness disparities in peer review with the help of large language models (LMs). We collect, assemble, and maintain a comprehensive relational database111See https://cogcomp.github.io/iclr_database. for the International Conference on Learning Representations (ICLR) conference from 2017 to date by aggregating data from OpenReview, Google Scholar, arXiv, and CSRanking, and extracting high-level features using language models. We postulate and study fairness disparities on multiple protective attributes of interest, including author gender, geography, author, and institutional prestige. We observe that the level of disparity differs and textual features are essential in reducing biases in the predictive modeling. We distill several insights from our analysis on study the peer review process with the help of large LMs. Our database also provides avenues for studying new natural language processing (NLP) methods that facilitate the understanding of the peer review mechanism. We study a concrete example towards automatic machine review systems and provide baseline models for the review generation and scoring tasks such that the database can be used as a benchmark.

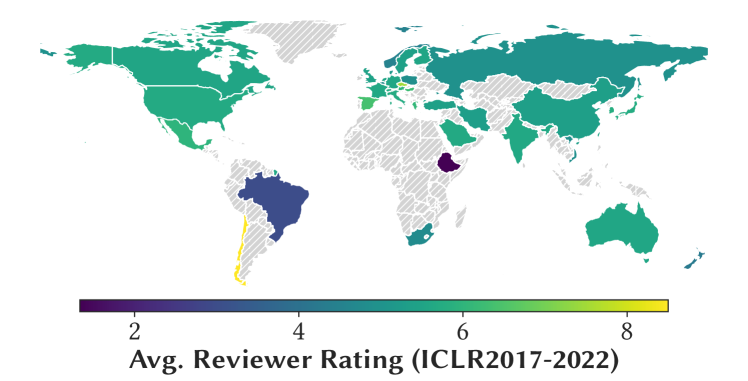
There is a parity of submissions across different geographies.
| Recency | Venue | # Papers | # Reviews | \stackanchorAuthorFeatures | \stackanchorReviewFeatures | \stackanchorTextualFeatures | \stackanchorPredictiveModel | \stackanchorGenerationModel | \stackanchorFairnessAnalysis | |
| Kang et al. (2018) | 2017 | ICLR, ARR, arXiv | 586 | 1618 | ✗ | ✓ | ✓ | ✓ | ✗ | ✗ |
| Tran et al. (2021) | 2020 | ICLR | 5569 | - | ✓ | ✓ | ✗ | ✓ | ✗ | ✗ |
| Dycke et al. (2022) | 2021 | ARR | 567 | 1053 | - | - | - | - | - | - |
| This Paper | 2022 | ICLR | 10289 | 36453 | ✓ | ✓ | ✓ | ✓ | ✓ | ✓ |
1. Introduction
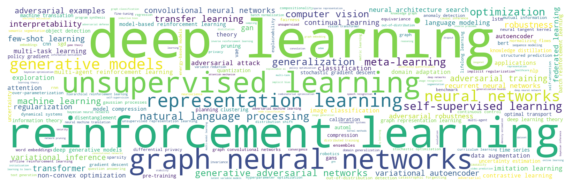
The current scientific development relies heavily on the peer review mechanism for authors to publish and share their research. With the sheer number of submissions, many venues have experienced an extremely large demands for reviewers, and many authors have complained they have received unfair or bogus reviews. Indeed, the famous NeurIPS experiments (Cortes and Lawrence, 2021)222Both in 2014 (Cortes and Lawrence, 2021) and 2021, see https://blog.neurips.cc/2021/12/08/the-neurips-2021-consistency-experiment/. assigned a different set of reviewers to the same submissions, and found the reviewer ratings are sometimes strikingly different. In parallel, algorithmic fairness has attracted attention of practitioners of various domains to analyze the intrinsic bias of either the dataset or the model trained on the dataset. It is thus natural to wonder, whether one could use lessons from fairness to analyze the peer review process? For example, in Figure 1, we note north America (NA) has the most accepted papers of all year, and in Figure 2, we note “reinforcement learning” and “graph neural networks” are much more popular, does this mean ICLR favors authors in the US and/or working on those popular topics? In order to study questions of this flavor, a comprehensive dataset, proper fairness formulations, and principled application of language modeling techniques are needed.
As the first step, we assemble a database consisting of submissions to the International Conference on Learning Representations (ICLR) that is most comprehensive and up-to-date. Our database contains submissions, reviews, author responses, together with author/institution profiles and extracted high-level features such as submission complexity, review sentiment, etc. We decompose the peer review process into two stages and study them separately. The first stage is the review stage where reviewers assign scores to submissions; and the second being the decision stage where area chairs or meta reviewers provide recommendation for the submission based on all information available. In the decision process, we use predictive models as surrogates to study fairness disparities. We find that simple linear models can perform well, and the use of language models features allow the model to reduce its fairness violations.
Our database also motivates important new tasks relevant to the NLP community: in the review stage, as one way to decipher its underlying mechanism, can we build models that generate reviews and score the submissions? These tasks are themselves important for building automatic reviewing systems, and we find it to be very challenging, even using the current state-of-the-art language model. We analyze the challenges and discuss desiderata of such tasks.
Contributions.
(1) We collect and maintain a comprehensive peer review dataset. (2) We initiate the study of fairness disparities in peer-review with the help of language model, and demonstrate that the importance of using textual features in investigating disparities in peer review. (3) We demonstrate how the dataset can be used as a benchmark for automatic machine review systems.
Summary of findings.
(1) Through association analysis, we observe disparities of several sensitive attributes. However, we do not have compelling evidence that those differences are significant. (2) The inclusion of high-level textual features from large LMs helps in both increasing predictive power as well as reducing fairness disparities. (3) The review process is harder to study compared with the decision process. Current state-of-the-art pre-trained large LMs have difficulty in completing tasks defined therein.
2. Background
2.1. Problem Formulation
We investigate several commonly used fairness notion, including demographic disparity (DP), equalized odds difference (EO), and AUC difference (AUC). For a given sensitive attribute taking values from , these measures are defined as
| (1) |
where is the binary label (e.g., either accept or reject), is the sensitive attribute, and computes the area under curve (AUC) of the receiver operating characteristic (ROC) curve of the subgroup . This formulation allows us to assess disparities in both data itself (by setting to be the true label) as well as in predictive models (by setting as the predictors). Although our database allows investigations on various disparities, we zoom in the following three that we think might be the most crucial. (i) Geographical disparity: is the set of the (dominant) geography of the authors in a submission. (ii) Gender disparity: represents the gender of the authors of a submission (mode, or whether a certain gender is present). (iii) Prestige disparity: represents the prestige of the authors of a submission (citation count, institution ranking).
A popular criticism of peer review is that the reviewer rating is somewhat “random” as demonstrated by the NeurIPS experiments. To assess such randomness at different peer review stages quantitatively, we assess the goodness-of-fit when fitting predictive models such as logistic regression on the dataset. We found that in general, simple models can fit the decision stage well but even more complicated models fail to capture the essence of the reviewing stage. This suggests that the randomness sentiment many authors have echoed might be mainly from the reviewing stage.
This observation naturally motivate us to set foot in evaluating existing large language models (or their fine-tuned variants) on their ability to approximate human-reviewers. This is by definition a very challenging problem and we observe that more efforts need to be taken towards automatic machine reviewing systems.
2.2. Related Work
Fairness disparities.
In modern data science, it is increasingly important for models to be non-discriminatory or fair with respect to some sensitive attributes (e.g., race or gender). Many fairness notions have been proposed to regularize models to mitigate the bias of models, both from individual level (Dwork et al., 2012; Burhanpurkar et al., 2021) and group level (Hardt et al., 2016; Feldman et al., 2015). Among them, demographic parity (Feldman et al., 2015) and equalized odds (Hardt et al., 2016) are arguably two of the most popular fairness notions. Demographic parity states that the proportion of each segment of a protected group (e.g. gender) should receive the positive outcome (e.g. making a loan) at equal rates. On the other hand, a classifier satisfies equalized odds if the subjects in the protected and unprotected groups have equal true positive rate and equal false positive rate. Although being of great academic and social interest, there are very few studies on fairness disparities and equalized odds in the peer review mechanism, especially when textual features are present.
Peer review analysis
As an important social network, the peer review network has attracted more and more attentions in the community. For example, Kang et al. (2018) proposed a high-quality dataset contains paper from ACL, NeurIPS (formerly NIPS), and ICLR. Plank and van Dalen (2019) create a large-scale dataset that covers over 3,000 papers from machine learning conferences. Gao et al. (2019) create a dataset that focuses on investigating the effect of rebuttals in NLP conferences. On top of these datasets, many recent research has been proposed to investigate the bias inside the review process (Stelmakh et al., 2019; Manzoor and Shah, 2021), argument mining (Hua et al., 2019), automatically review generation (Yuan et al., 2021), improved review process (Rogers and Augenstein, 2020; Jecmen et al., 2020), and review explanation (Wang et al., 2020). Nonetheless, none of the existing work has investigated the fairness violation or worked through the lens of large language models. We summarize key differences between the most relevant datasets and ours in Table 1. Notably, to the best of our knowledge, our dataset is the most comprehensive one, backed up by various off-the-shelf features extracted from large language models for downstream analysis.
3. Database Construction
3.1. ICLR Data
We use the OpenReview333https://api.openreview.net/api/ Python API444https://pypi.org/project/openreview-py/ to crawl conference data from OpenReview, which include submissions, author profiles, reviews, rebuttals, and decisions in ICLR 2017-2022. We are able to obtain in total 10289 submissions, 21808 distinct authors, 36453 reviews, 68721 author responses, and 4436 public comments. The crawling process is done in Feb 2022 after ICLR2022 announced its decisions. We exclude desk-rejected or author-withdrawn submissions from the dataset. We tabulate per-year counts in Table 2. Note that from table we note the natural distributional differences across gender groups of authors. We next briefly describe the schema for each data entity while the full Entity-Relation (ER) diagram and the covariate table are given in the Appendix.
| 2017 | 2018 | 2019 | 2020 | 2021 | 2022 | |
| Submissions | 490 | 911 | 1419 | 2213 | 2595 | 2670 |
| Oral | 15 | 23 | 24 | 48 | 53 | 54 |
| Spotlight | 0 | 0 | 0 | 108 | 114 | 176 |
| Poster | 183 | 313 | 478 | 531 | 693 | 865 |
| Workshop* | 47 | 89 | 0 | 0 | 0 | 0 |
| Reject | 245 | 486 | 917 | 1526 | 1735 | 1574 |
| Author | 1416 | 2703 | 4286 | 6807 | 7968 | 8654 |
| Female | 81 | 162 | 298 | 503 | 529 | 770 |
| Male | 769 | 1565 | 2527 | 3951 | 3992 | 5524 |
| Non-Binary | 1 | 2 | 2 | 2 | 3 | 6 |
| Unspecified | 565 | 974 | 1458 | 2351 | 2125 | 2354 |
| Review | 1489 | 2748 | 4332 | 6721 | 10026 | 10401 |
| Response | 2811 | 4404 | 9504 | 11350 | 18896 | 21756 |
| Comment | 750 | 1002 | 1354 | 816 | 376 | 133 |
Submission.
Each submission entity contains a paper number (unique within the same conference), a title, an abstract, a link to its pdf file, an one-sentence summary (tldr), a list of self-provided paper keywords, and a list of author identifiers referring to the authors in author table.
Author.
Author entities contain the author names, their emails (only domain is visible), and optionally, self-reported gender, homepage, Google Scholar, DBLP, LinkedIn, Semantic Scholar, Wikipedia, and ORCID. In addition, authors can optionally report their current and past affiliations with corresponding positions.
Review.
Although the specific review format changes each year, there is generally a textual review, a numerical rating (usually in the range of to ), and a numerical confidence score (usually in the range of to ). In certain years, there are more specific scores such as technical soundness, novelty, etc. In total, there are reviews corresponding to 10289 submission with an average number of reviews per submission being .
Author responses, public comments, and decisions.
Author response, public comment, and decision entities include a title, a comment, a forum field that refers to the submission it points to, and a “reply-to” field that points to its parent node in a discussion thread.
3.2. Academic Profile Data
To complement the author information, we obtain academic profiles using the scholarly API555https://pypi.org/project/scholarly for Google Scholar666https://scholar.google.com, which include the citation counts (as of Feb 2022), five-year citation counts, -index, five-year -index, -index, five-year -index, and per-year citation counts, -index, and -index. Among all 21808 distinct authors, we are able to find 21031 associated Google Scholar profiles. There are 4180 authors report their Google Scholar profile in their OpenReview profile. For other authors, we concatenate their name with their latest institution (if reported) to form the search string, and select the most relevant query result from Google Scholar, which results in 3566 matches. If no results are found, we remove the institution string, search again, and select the most relevant query result. We are able to find another 4180 matches.
3.3. Institution Ranking
We obtain institutional rankings from CSRankings777https://csrankings.org/, a metric-based ranking of computer science institutions based on per-year citations counts of publications in various venues that are divided into areas (Artificial Intelligence, Systems, Theory, and Interdisciplinary Areas) and sub-areas. We match the reported institution from author profiles with those in the CSRanking by thresholding the normalized Levenshtein distance at between institution names (both are uncased). We find matches out of unique institutions.
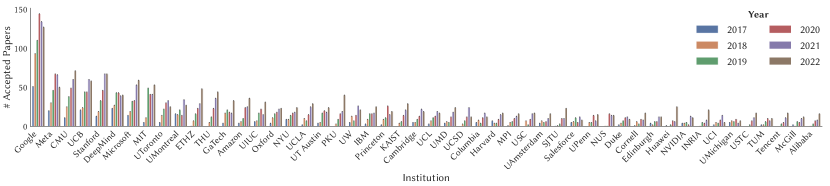
Nonetheless, since the ranking from CSRanking is the aggregated ranking weighting all sub-domain of computer science equally, it might not be the most representative; furthermore, the institutions available in the CSRanking only cover about institutions authors reported in OpenReview. To this end, we also consider a data-driven ranking that ranks each institute at a particular year by the total number of accepted papers in all previous years, which we refer to as the “ICLR ranking.” We show the top- institutions with highest ranks as of , grouped by their per-year acceptance counts in Figure 3.
3.4. arXiv Matching
A crucial component in the analysis of reviewing stage bias is whether a submission is put onto the arXiv before the review releasing date. This provides us with a proxy to assess whether there might be a possible mechanism for the reviewers to gain information on authors’ identities. We use the python wrapper for the arXiv API888https://pypi.org/project/arxiv/ to obtain the five most relevant results based on the title of the submission for subsequent filtering. Similar to Kang et al. (2018), we compute Jacard similarity and normalized Levenshtein similarity between authors; in additional, we also use the Specter model999https://huggingface.co/allenai/specter developed by Cohan et al. (2020) to compute the cosine-similarity of the title-abstract embedding. We fine-tune the filtering threshold to be for all similarity measures such that the number of the matched papers are approximately the same as in Tran et al. (2021).
4. Language Model Enhancements
In this section, we describe how we augment the dataset by extracting various high-level features, mostly with the help of large language models.
4.1. Submission Features
We process all submissions in pdf format in the dataset, with a total of 36GB to extract full texts.
Summary statistics.
We use Grobid101010https://github.com/kermitt2/grobid to extract bibliographical data and obtain sections/figures/tables with their corresponding headings. We are able to obtain the counts of figures, tables, and sections in this way.
Keywords.
Authors can optionally provide a list of keywords alongside with their submission. There are submissions that provide a total of keywords and among them on average keywords are provided per submission. On top of the raw keywords provided by authors, we also cluster keywords together by thresholding the Levenshtein distance (Levenshtein et al., 1966). Note that processed keyword clusters may correspond to different but relevant research topics (e.g., convex optimization vs. non-convex optimization).
Textual complexity.
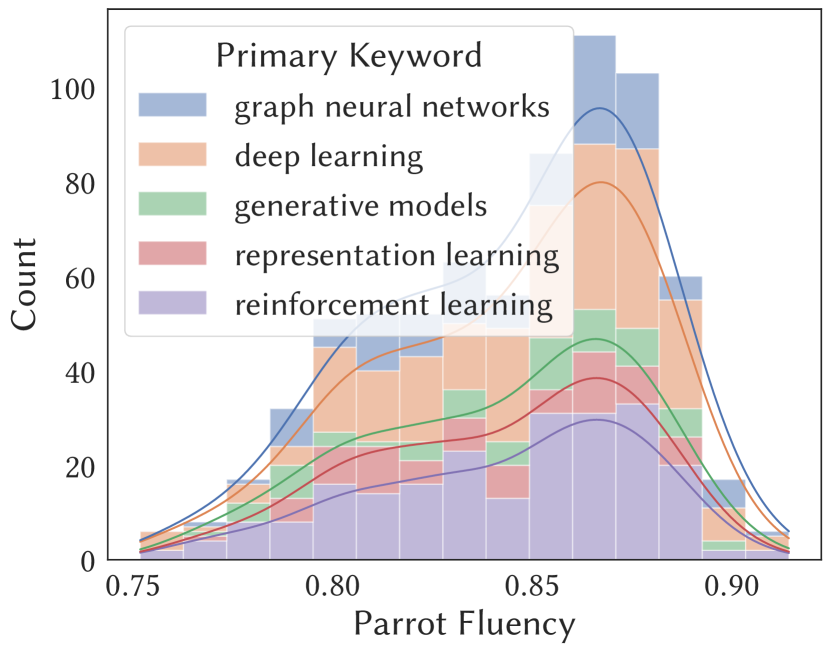
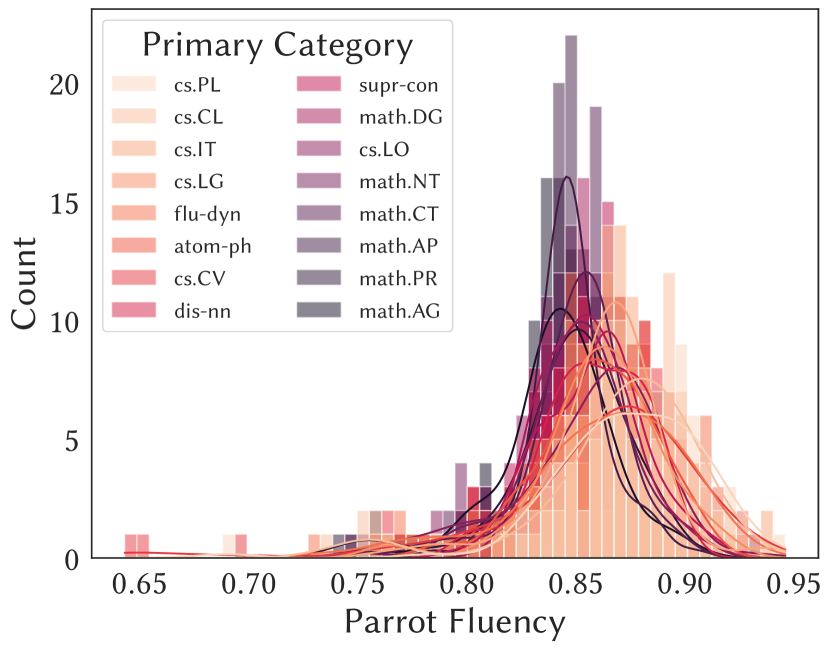
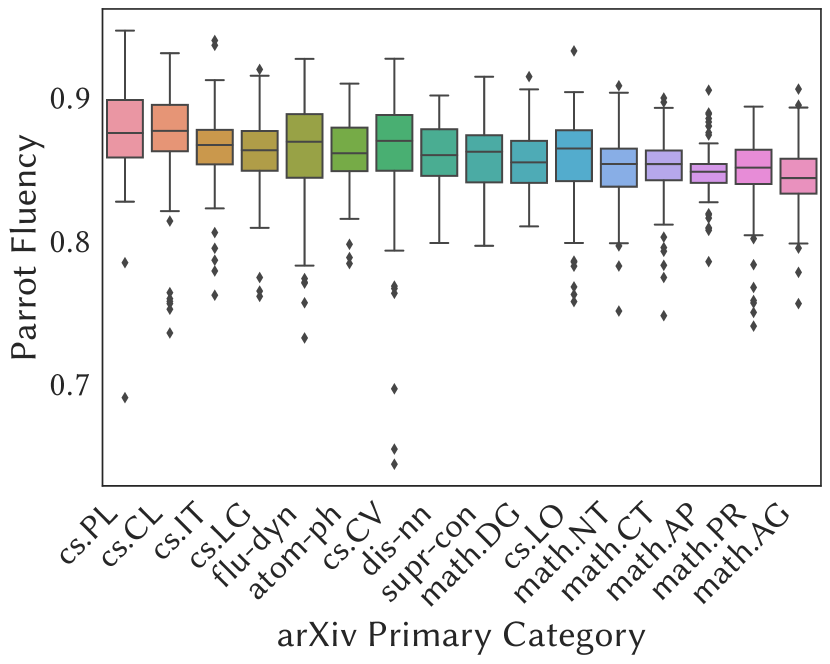
An essential problem is to quantify the mathematical complexity of a paper. A “superficial” way of doing this is to assess how well the texts of the paper aligns with English grammar since equations and mathematical symbols usually violate it. We used a pre-trained RoBERTa model used for assessing text fluency called Parrot111111https://huggingface.co/prithivida/parrot_paraphraser_on_T5for this purpose. The fluency score ranges from to , with a higher score represents less complicated texts. As a sanity check, we compute this fluency score on randomly drawn papers from different arXiv categories spanning pure mathematics, physics, and various domains of computer science. In Figure 4(m) and Figure 4(n), we plot the histogram of complexity scores against categories. We note that the bulk of the scores concentrate around and the distributional difference is aligned with intuition (harder subjects such as algebraic geometry have a generally lower complexity score).
Specter embedding.
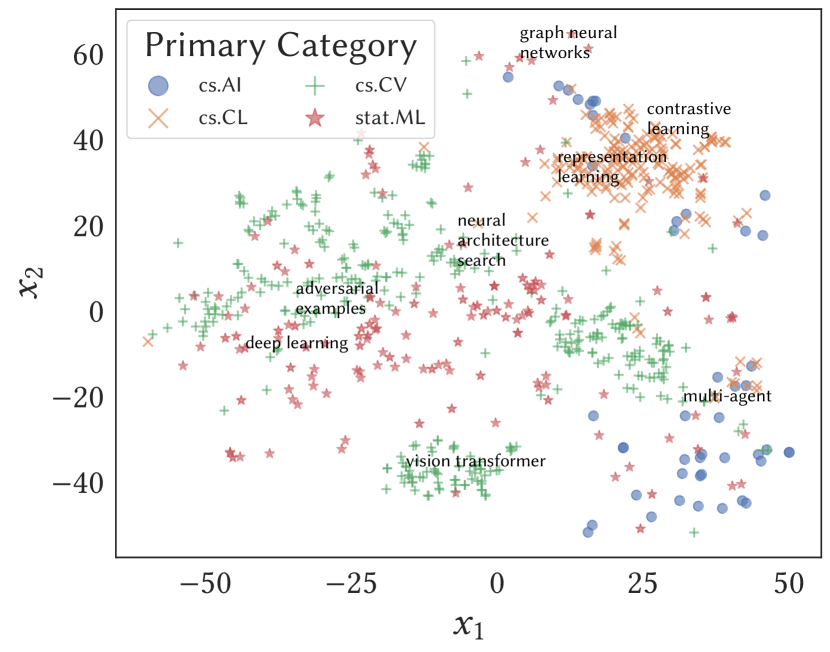
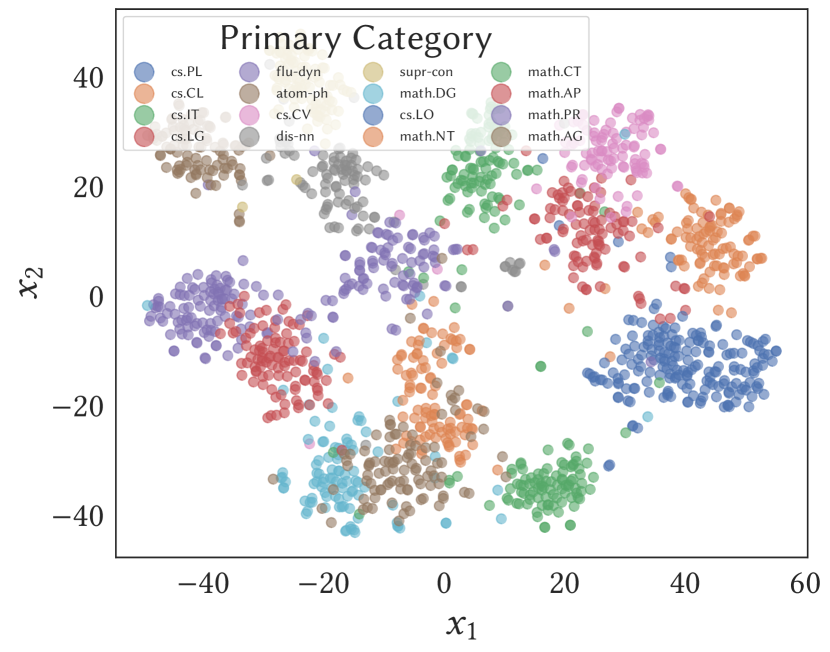
The Specter embedding provides us a means of clustering submissions into different cluster through spectral clustering (Cohan et al., 2020). We show the -SNE (Van der Maaten and Hinton, 2008) plot in Figure 4(o), where each color/marker corresponds to a different arXiv primary category; we also show altogether the primary category of a few random data points. We observe the clusters are interpretable: “language modelling” and “contrastive learning” are far away from each other while “deep learning” are prevalent in many clusters. On a practical note, this embedding can be used to assess the relevance among submissions.
4.2. Review Features
Tone and sentiment.
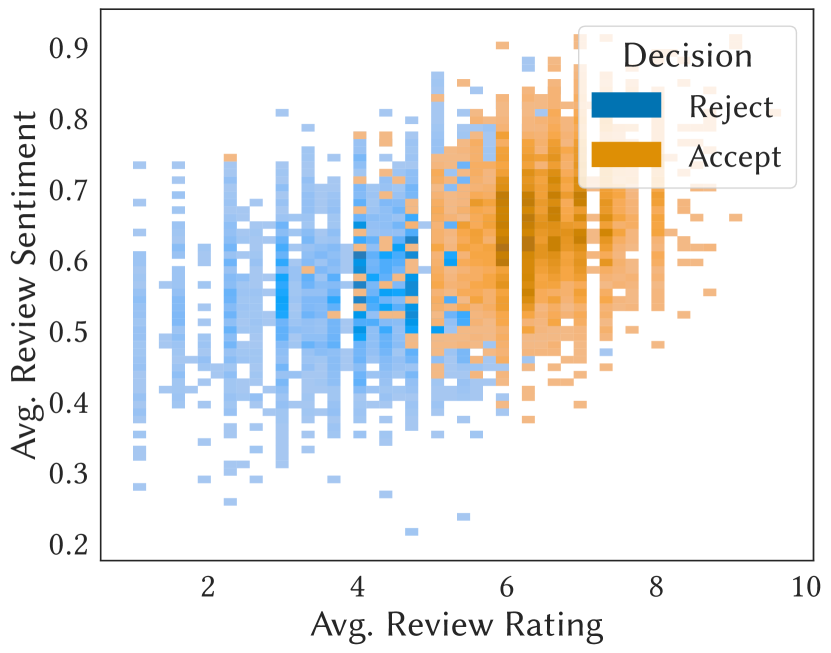
Aside from integer-valued rating and confidence (and sometimes more aspects such as technical soundness), the tone or sentiment of the review may also affect the decision stage. We use the RoBERTa model trained on Twitter sentiment121212https://huggingface.co/cardiffnlp/twitter-roberta-base-sentiment to extract a sentiment score ranges between and for each review ( signifies most positive). Although this model was trained on Twitter, we found the sentiments it generates are highly correlated with the review rating, indicating a good representation, as shown in Figures 4(h) and 4(g).
4.3. Author Features
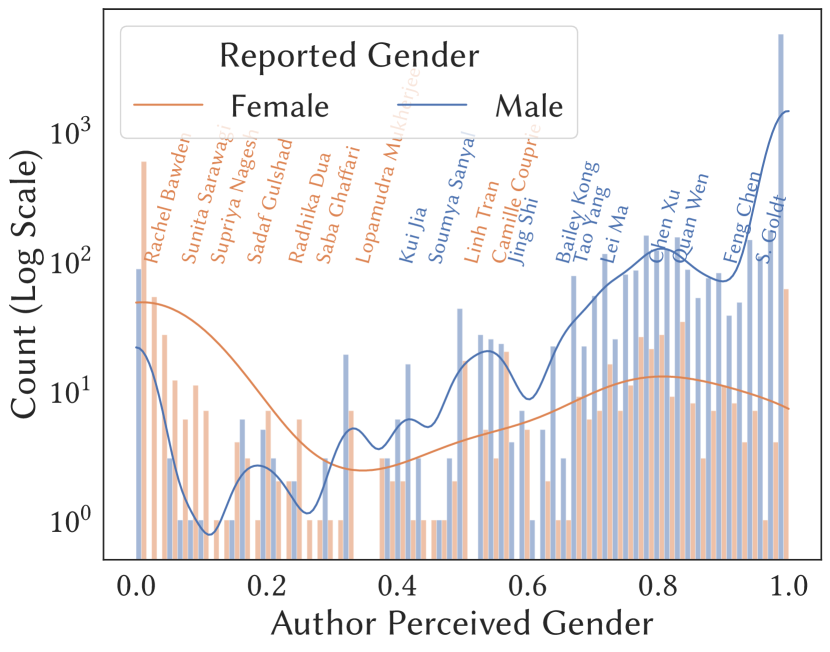
Reported and perceived gender.
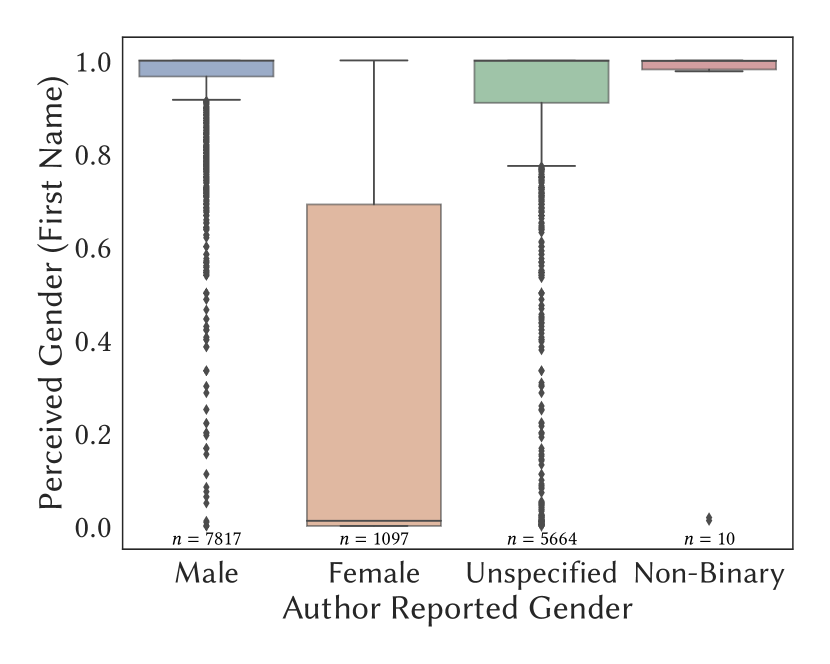
Although each author may optionally report their gender information in their OpenReview profiles, this reported gender may not be the same as the perceived gender We use the first name gender dictionary appraoch appeared in (Tsai et al., 2016), which assigns a “male” score ranging from to to each first name according to its frequency on Wikipedia.
Geographical information.
We use the domain name from the email addresses of author profile to identify the geographical information of each author. Since the author affiliation might change over time, if the author provides its affiliation history, we use the email record at the year of the conference submission to identify the author’s geography, and thus the same author’s geography might change for different submissions.
5. Investigating Fairness Disparities
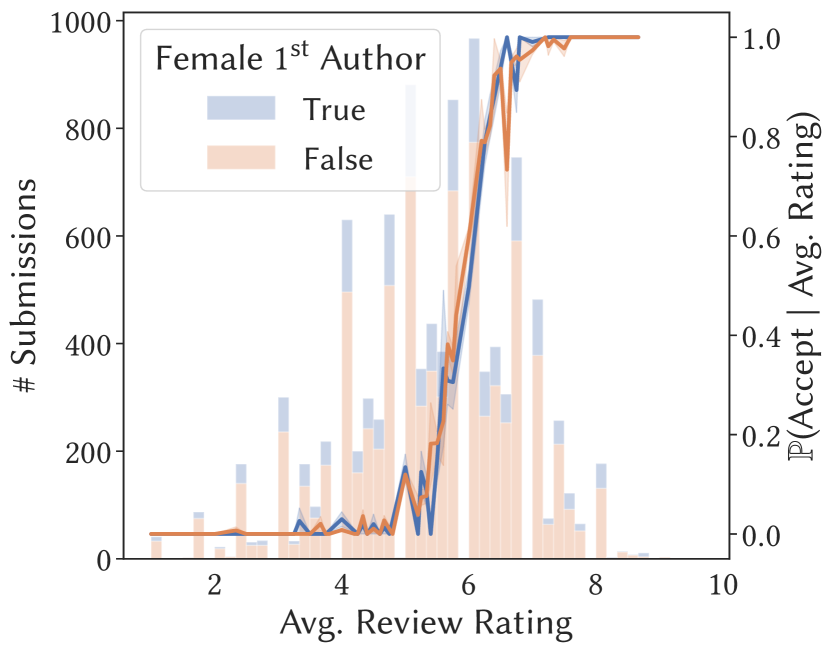
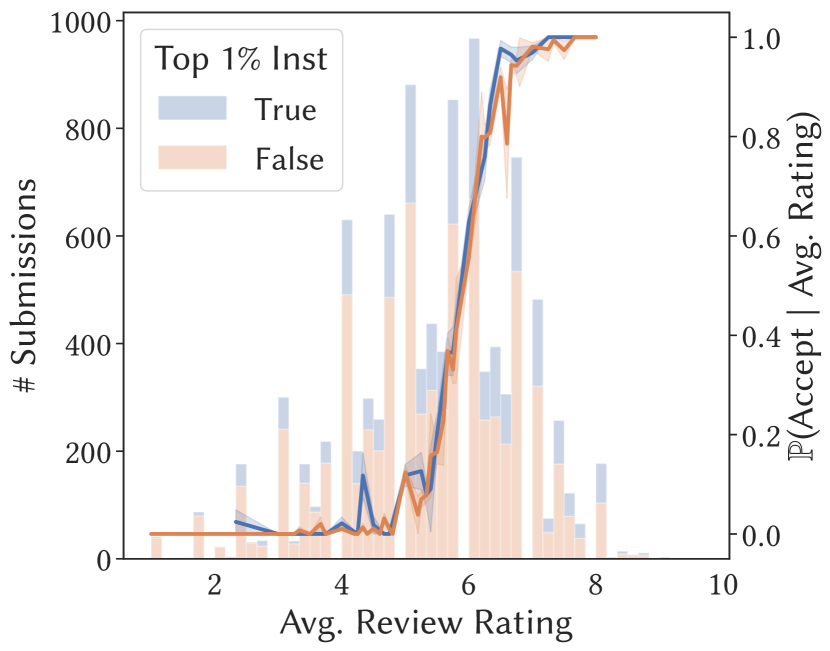
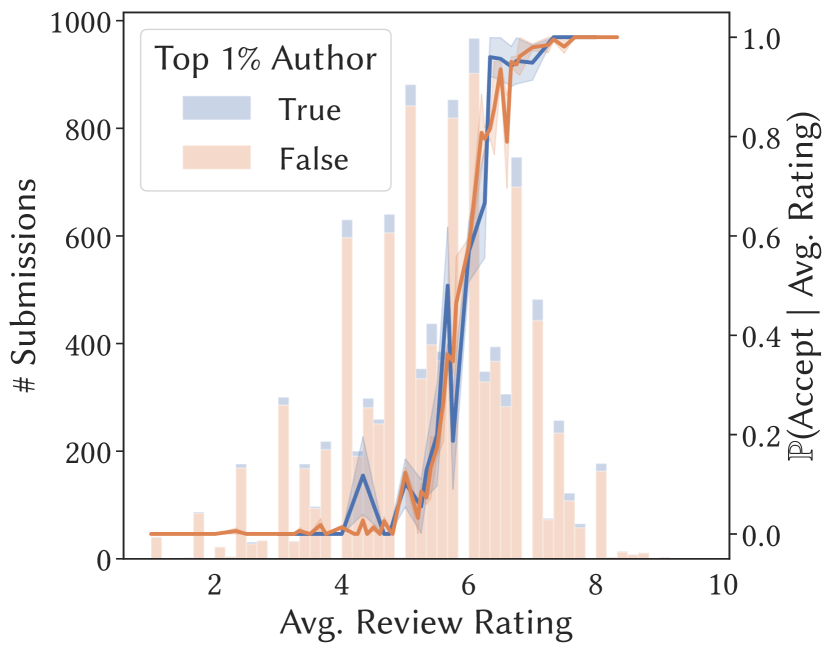
In this section, we investigate fairness disparities in the decision process. For the ease of exposition, we dichotomize the sensitive attributes as (i) whether a paper’s majority of authors are from north America; (ii) whether a paper’s leading author is Female; (iii) whether a paper’s most highly-cited authors falls in the top authors. We will first perform exploratory data analysis to explore potential fairness disparities in the data. We then zoom in several sensitive attributes of interest and study their marginal effects on the submission acceptance. To imitate the decision process, we fit predictive models given various features to predict acceptance probability. If the model captures this process well, we may use it as a surrogate to study the existence of fairness disparities and trace their roots.
5.1. Exploratory Data Analysis
We first explore the dataset among various dimensions and provide intuitive insights into the dataset (Tukey et al., 1977). We select several features of interest and plot their relationships in Figure 4.
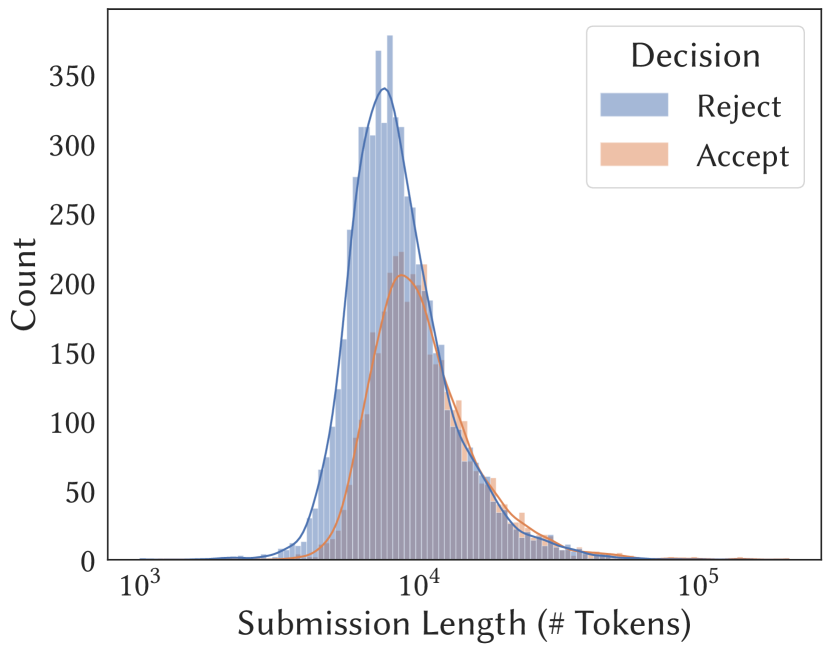
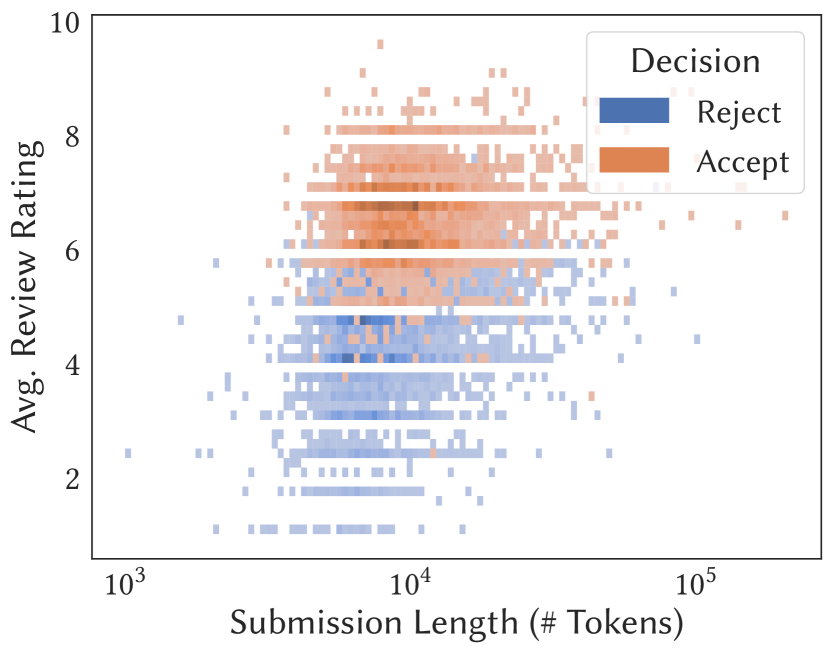
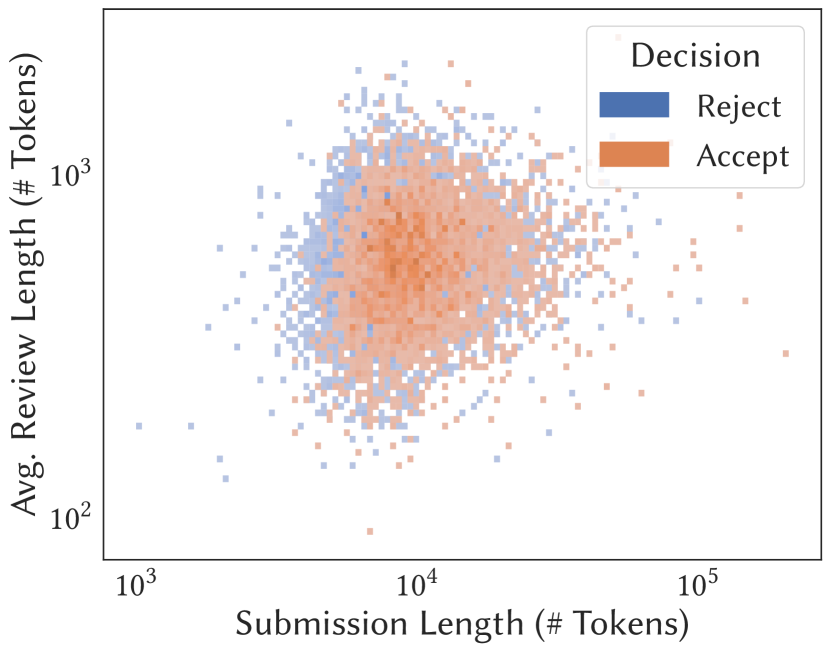
Submission.
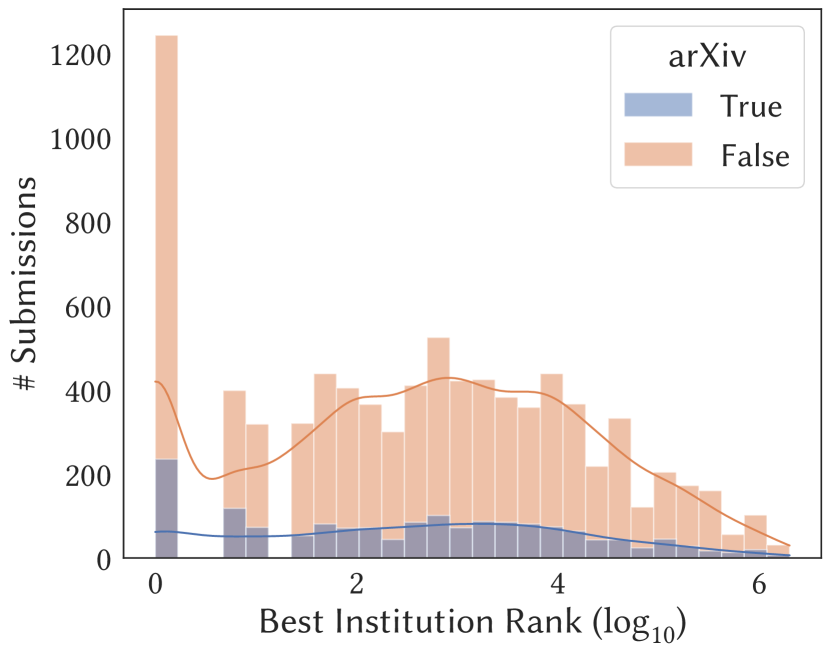
In Figures 4(a), 4(b) and 4(c), we plot the histograms of the length of all submissions (counting number of tokens using the Longformer tokenizer developed Beltagy et al. (2020)), across different decisions, average review rating and average review length. The rejected papers as a whole are generally slightly shorter, while the review lengths do not differ much for submissions of various lengths. The derived features for submissions, fluency scores and Specter embeddings are plotted in Figures 4(k) and 4(l) across different submission keywords. We observe that the paper complexity varies little across the five most common keywords. In Figure 4(l), we select a subset of submissions that have a arXiv counterpart, and visualize the -SNE plot of their Specter embeddings. We mark the top keywords of a random subset of the samples and observe the similarities of submissions defined by primary categories or keywords are well captured. Finally, in Figure 4(d), we plot the histogram of the best institution rank of a paper, grouped by whether the submissions was on arXiv prior to review release.
Reviews
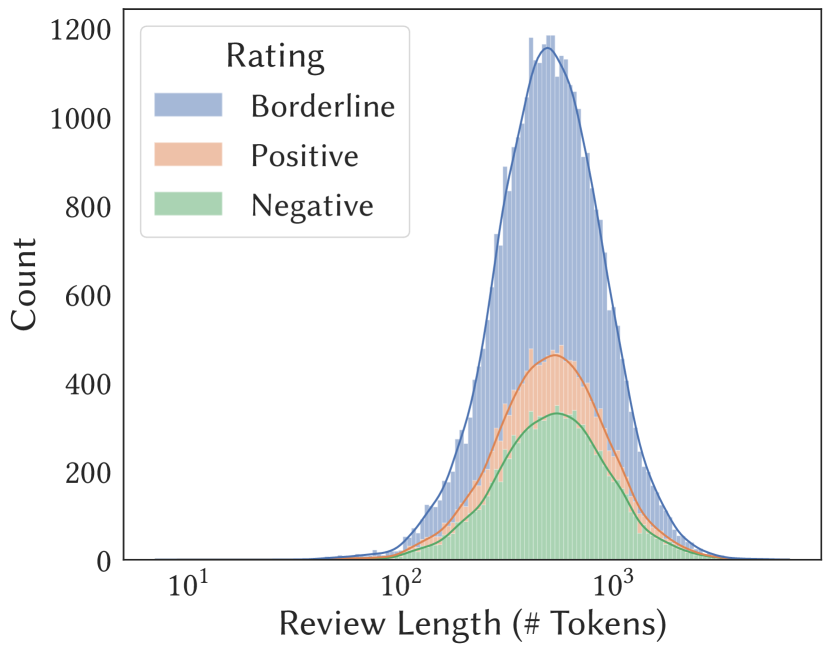
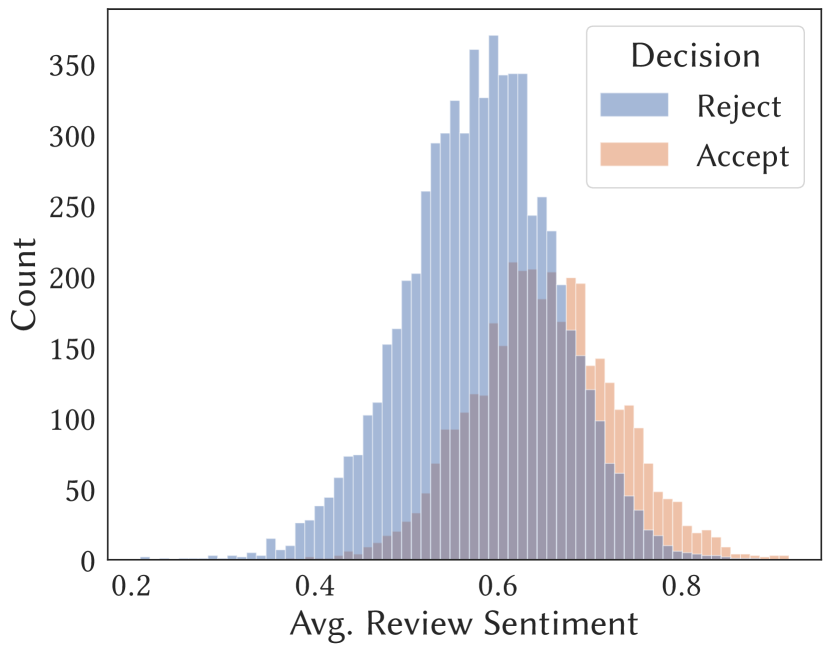
We observe that the review rating type (negative, borderline, or above) does not have a significance difference across reviews of various lengths (Figure 4(f)). The extracted review sentiment feature, however, has a distributional difference across accept/reject groups (Figure 4(g)), and is correlated with average review rating (Figure 4(h)), which aligns with our intuition.
Author.
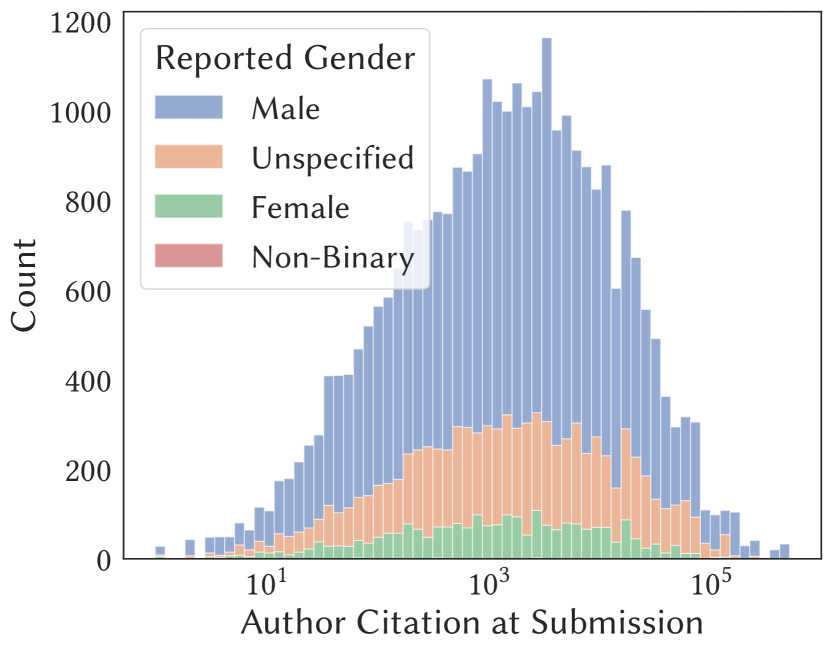
As shown in Table 2, the distribution across gender groups in all authors differ significantly, which is further quantified in Figure 4(i). Together with Figure 4(j), which shows the histogram of perceived gender across reported gender groups with random examples shown, we observe the perceived gender is in general aligned with reported gender, and is more preferable in downstream analyses due to its higher coverage. Finally in Figure 4(e), we note the distribution of citation counts of authors in different gender groups are similar.
5.2. Marginal Disparity Analysis
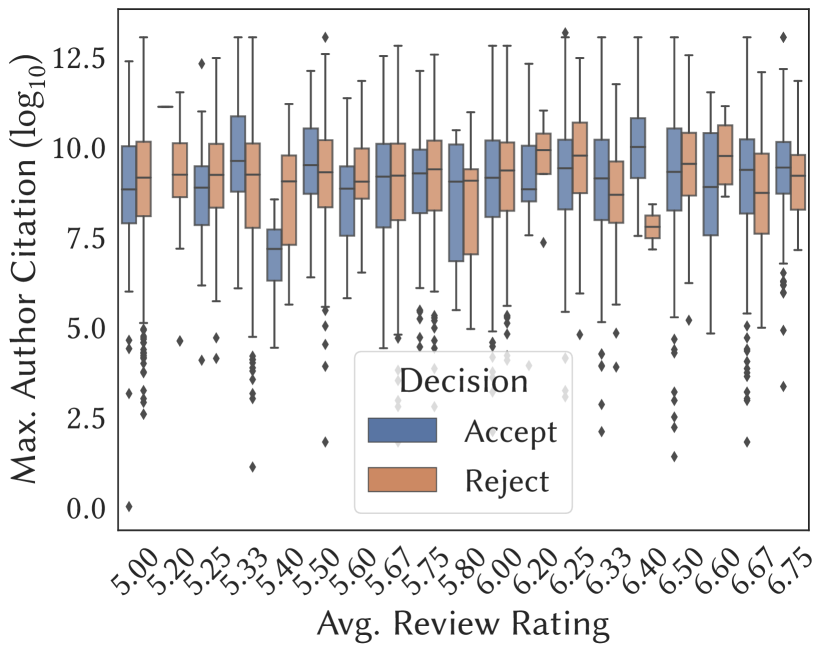
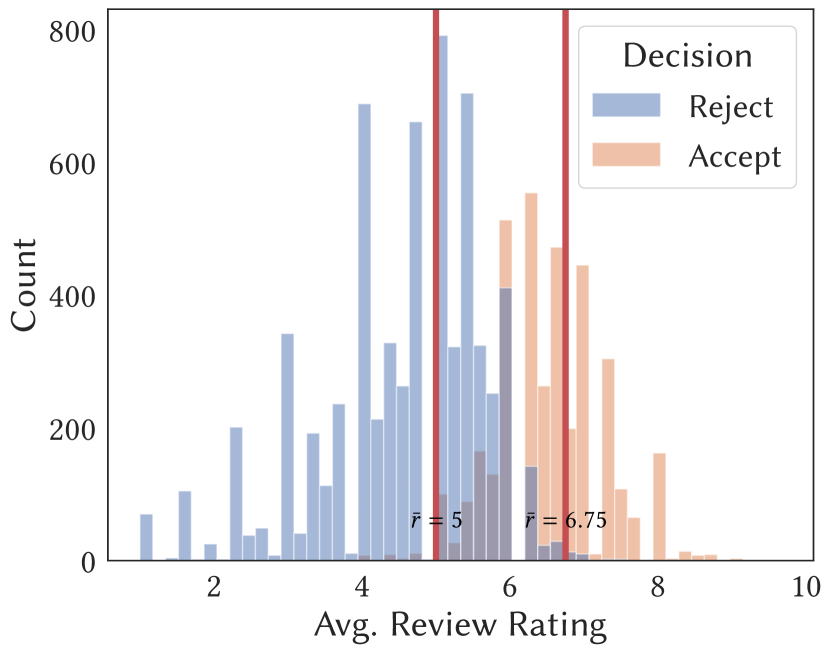
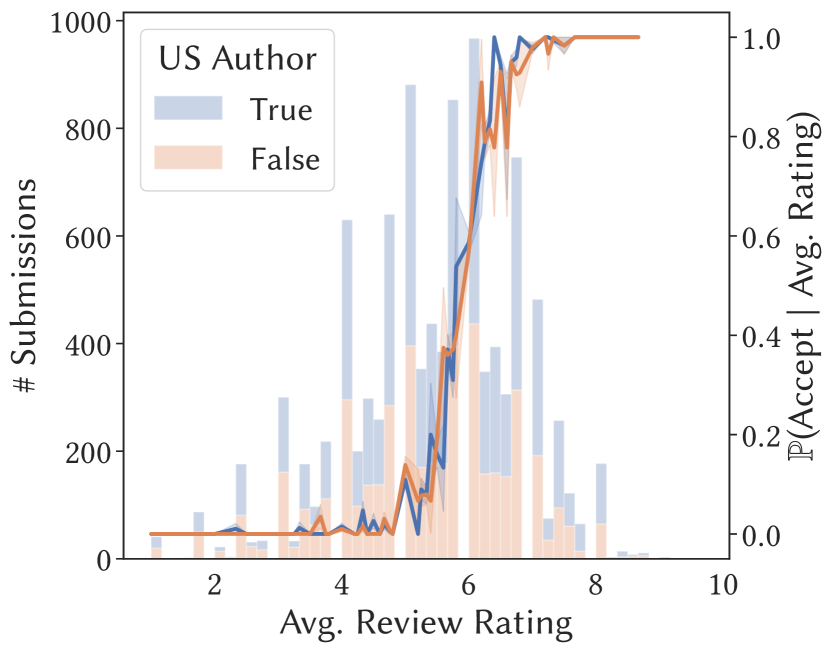
We first study fairness disparities based on the marginals of various sensitive attributes while averaging out all other factors given reviewer ratings. In this setup, we estimate the (empirical) marginal probability of a acceptance at each average rating level and construct confidence bands based on sample variances. We summarize the results in Figures 5 and 6. We note that the empirical acceptance probabilities are visually similar across four sensitive attributes considered. Nonetheless, we note at certain level of average rating (mostly borderline ratings between to ), some sensitive attributes exhibit statistically significant difference (e.g., in Figure 5(b) around rating ). In Figure 6, we zoom in to the borderline papers for the prestige disparity (measured by author institution ranking and citation count at the year of submission). We found that although the ranges of accepted/rejected papers overlap, their means can be strikingly different. Marginal analysis provides us with rough idea of when disparities may occur but falls short of providing explanations, which will be the focus of the next subsection.
5.3. Joint Disparity Analysis
Although the estimations of the marginal probability and their confidence bands are non-parametric thus not relying on any modelling assumptions, it is inconvenient to condition on multiple factors simultaneously. In this subsection, we aim at studying fairness violations in the decision stage using predictive models, which also brings the additional benefits of selecting the most important features for the prediction.
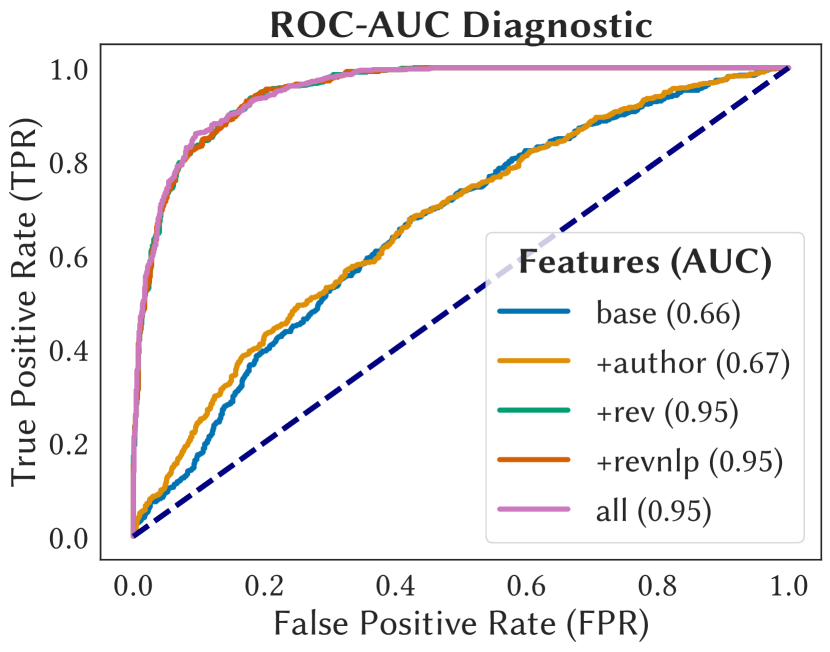
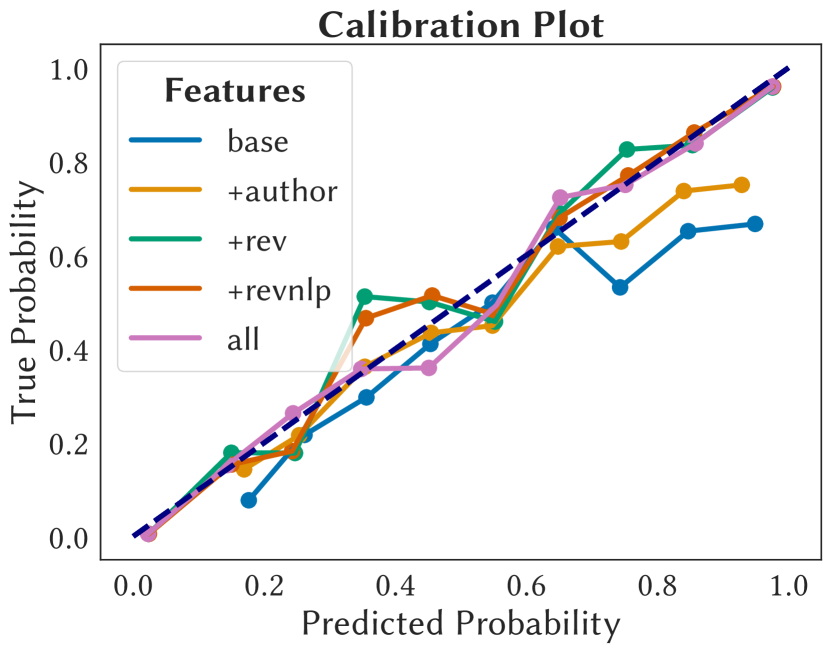
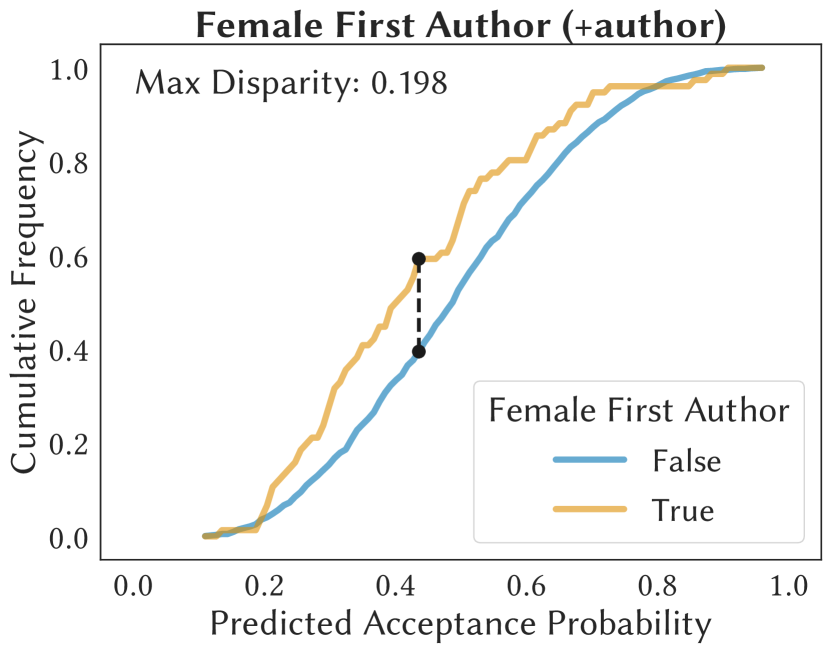
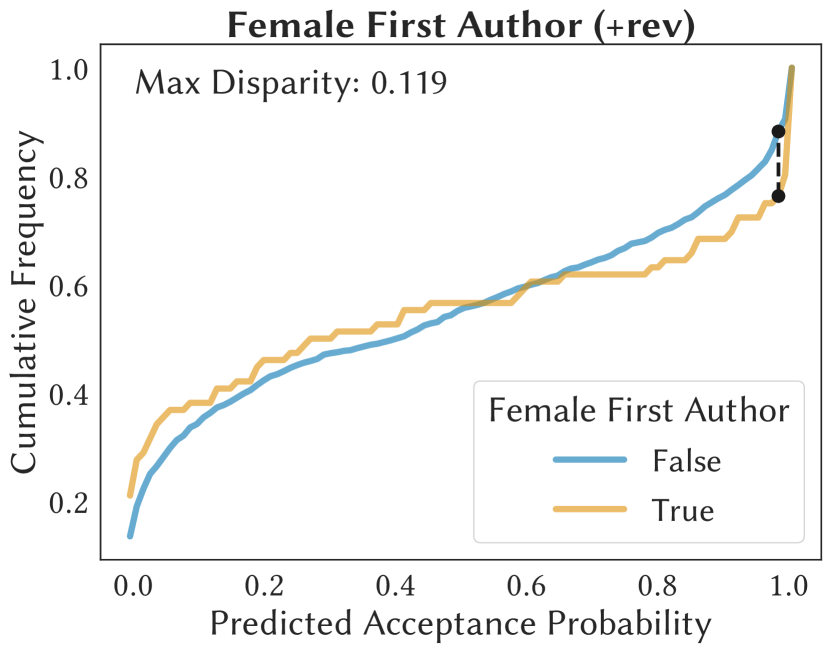
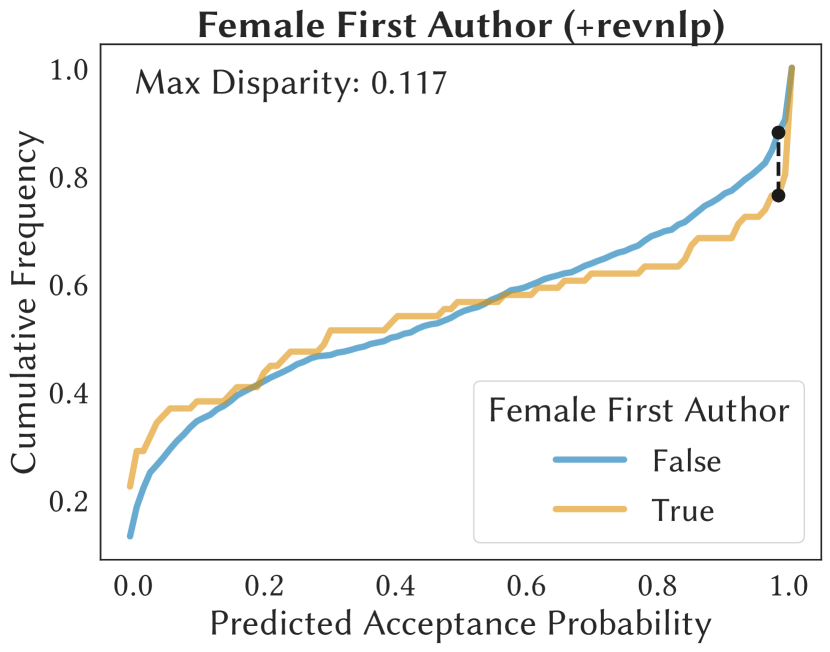
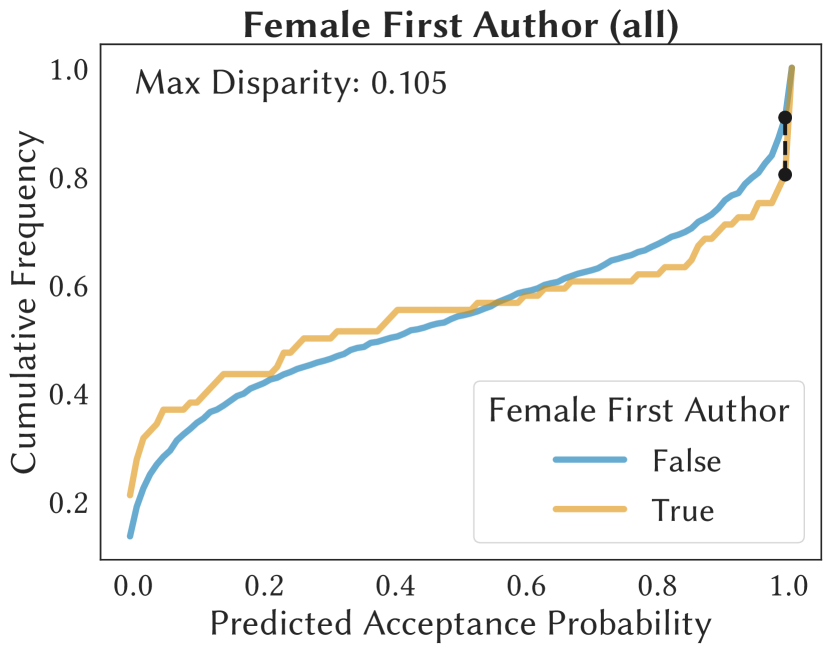
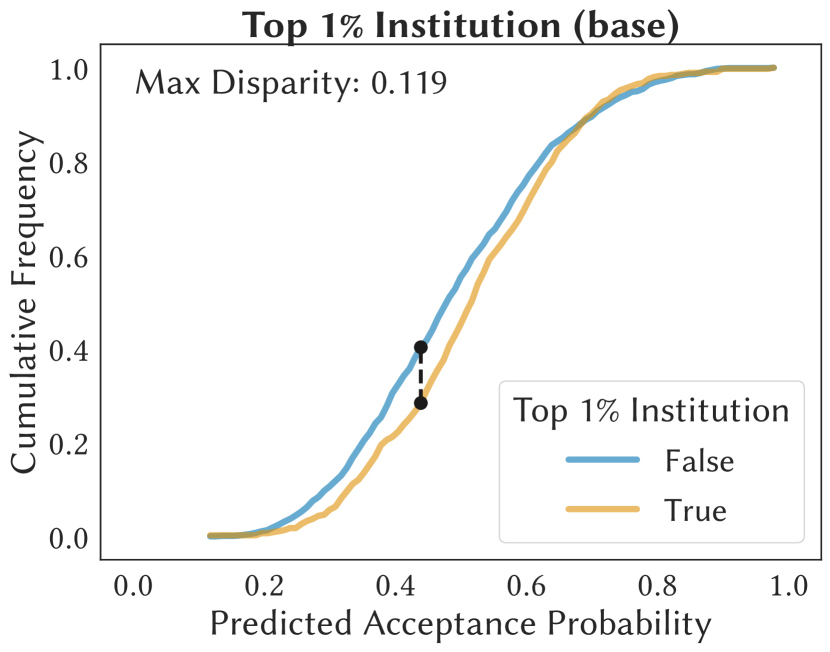
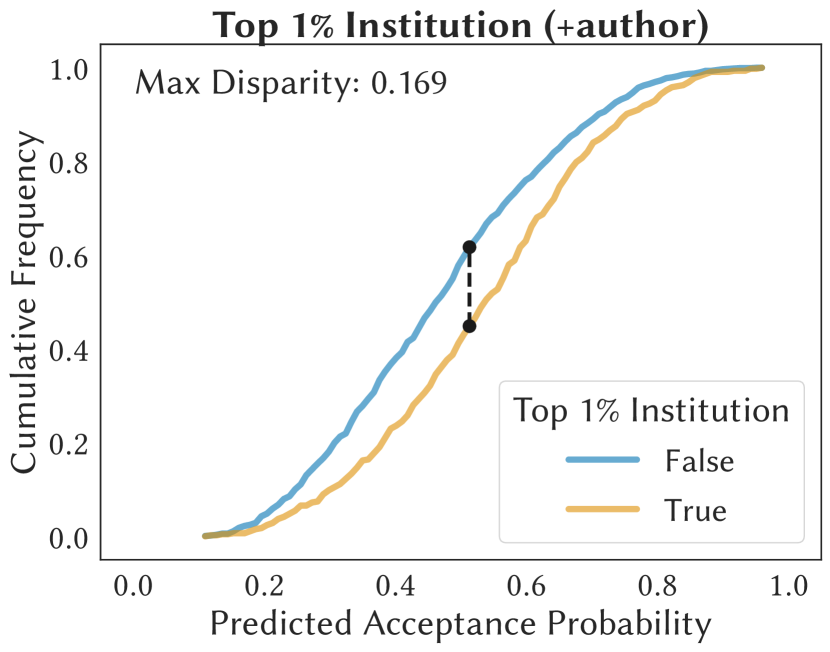
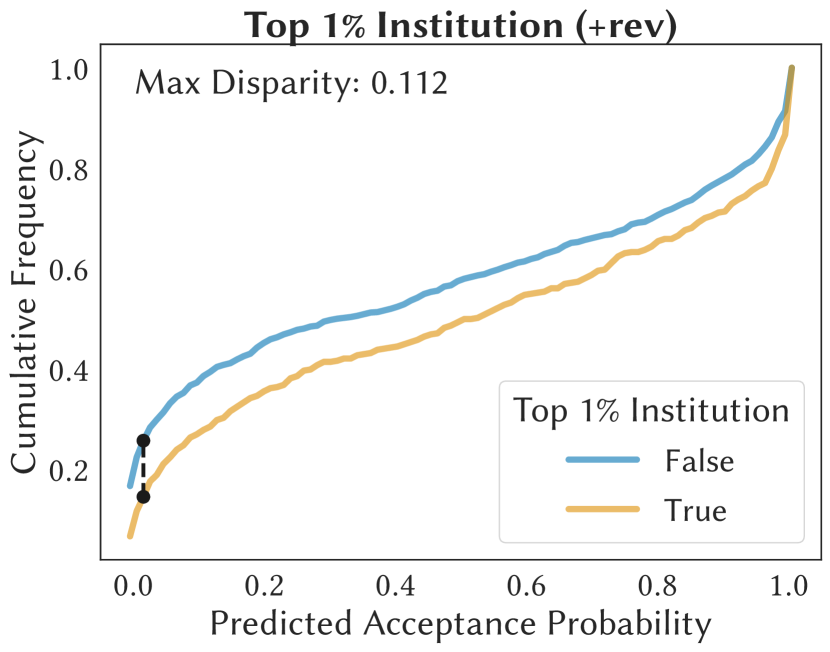
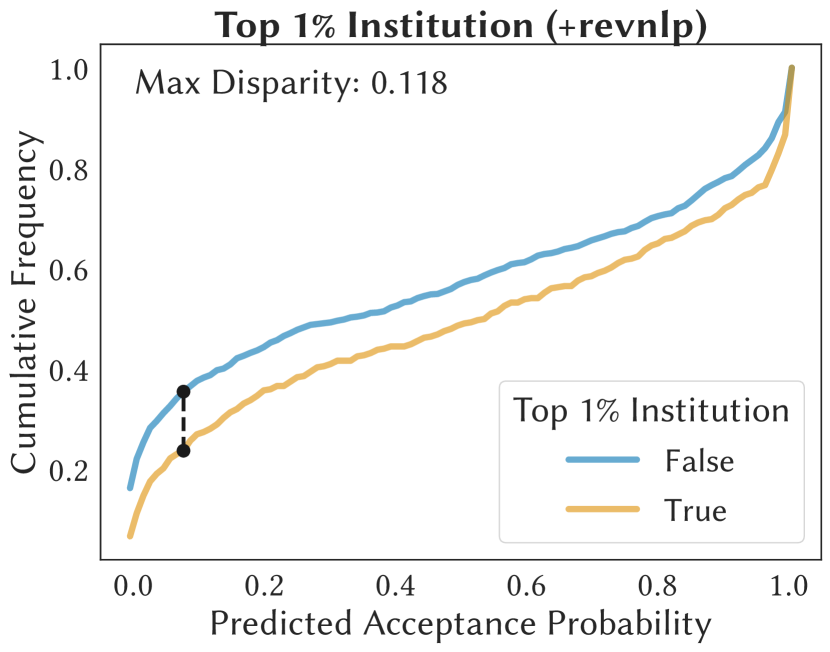
We use the submission data form 2017-2021 as the training set and data in 2022 as the test set to fit a logistic regression model using the combination of the following sets of features: (i) base: submission features (including textual features); (ii) +author: base features plus all author features; (iii) +rev base features plus review ratings and confidences; (iv) +revnlp base features plus all review features including sentiment and length. Specifically, for submission features, we also assign a cluster number to each submission by running spectral clustering using cosine similarity on the specter embeddings. We show the diagnosis curves in Figure 7 including the receiver operating characteristics (ROC) curve and the calibration curves of the models trained on different sets of features when evaluating on the test set. In Table 3, we tabulate several disparity measures on models trained using different sets of features and in Figure 8 we plot the distributional disparity across the sensitive attributes. In what follows we discuss in greater detail the results.
Decision stage is less noisy.
The ROC curve together with its area under the curve (AUC) capture the discrimination power of classifier. Notice that after review features are added, the ROC curve is close to the diagonal and its AUC is around . In Figure 7(b), we plot the calibration curve with true probabilities and predicted probabilities. A well-calibrated model should be centered around the main diagonal. We found that although the model is simple, after including review features, it can capture the most of the variations in the dataset and generalizes well. This implies that the biases and noises in the decision process are low given the review ratings.
Fairness violations differ.
Together with DP, we also compute two other commonly used fairness metrics, equalized odds difference (EO) and AUC difference (AUC). We tabulate the violations on both +rev and +revnlp (marked by +R) in Table 3. We note that the violations are relatively mild (mostly less than ). Together with Figure 7, we see that in the decision stage, a simple model can capture both the discriminatory power as well as fairness constraints. Nonetheless, the level of disparity varies across sensitive attributes: geographical disparity appears to be generally higher than gender disparity.
Large language models help explain disparities.
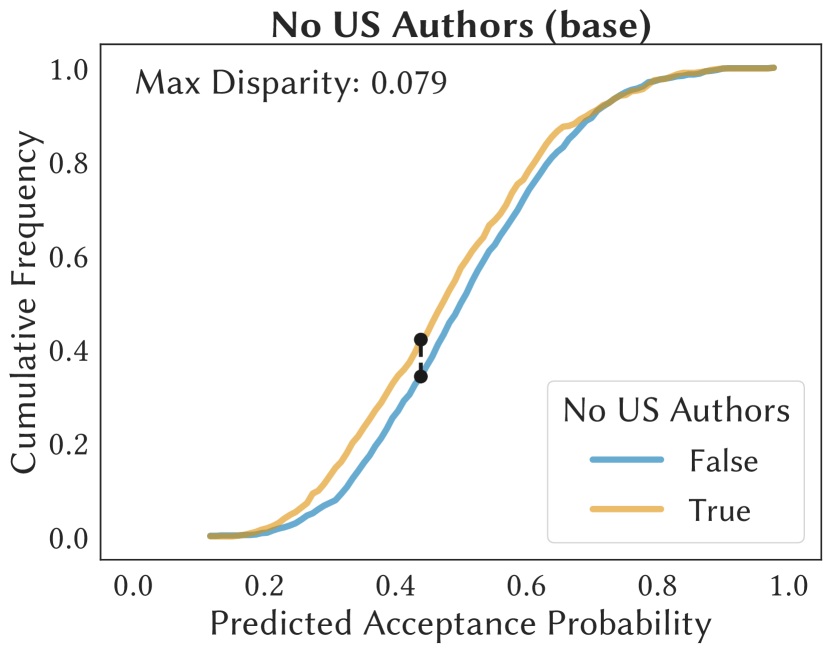
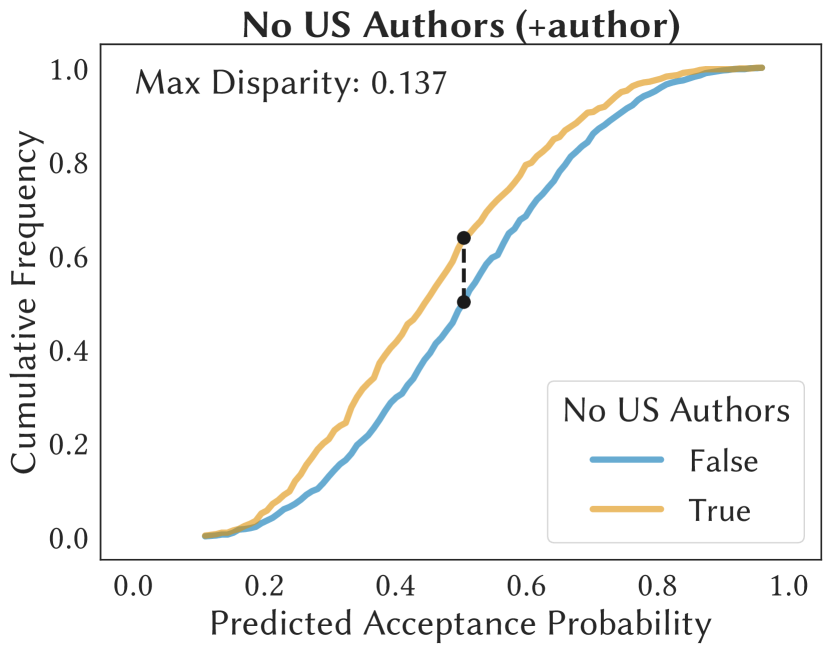
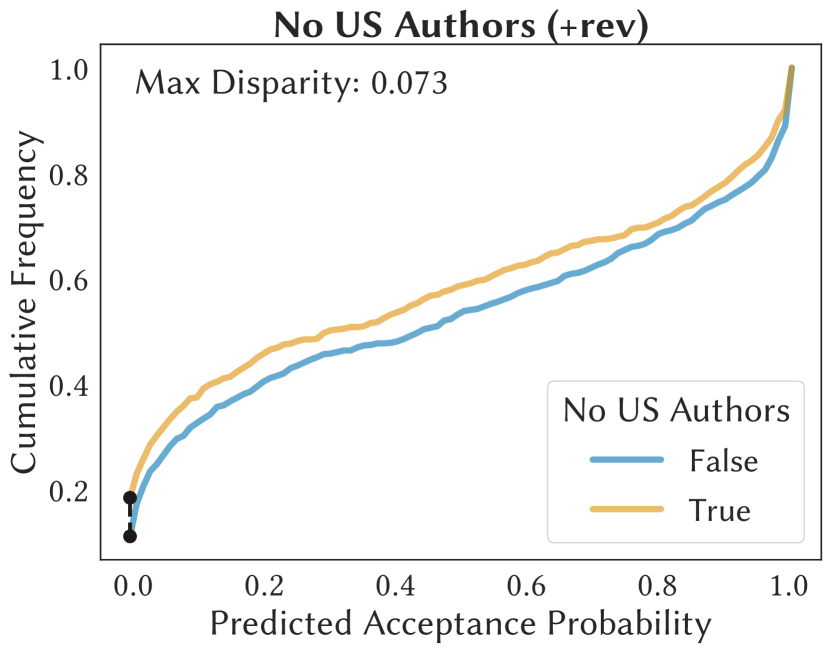
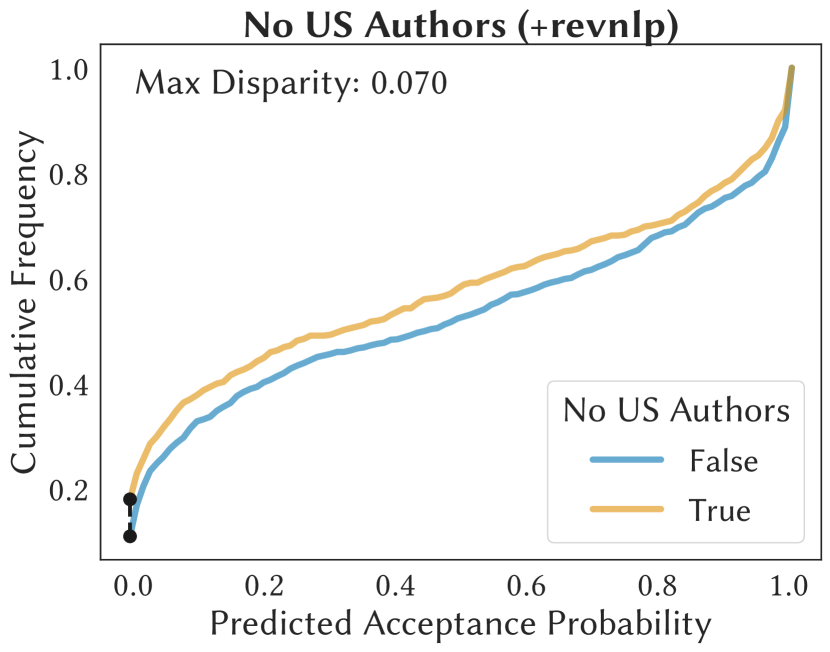
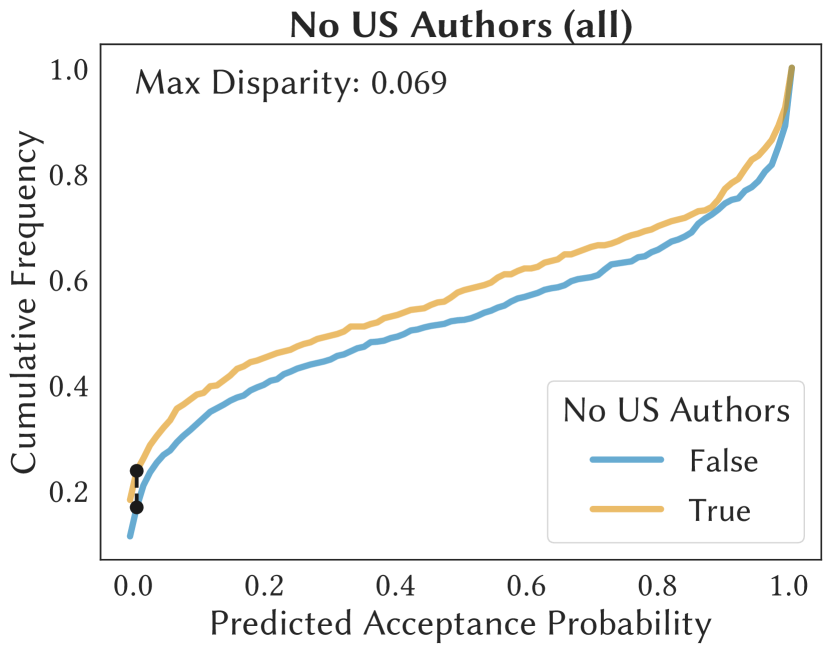
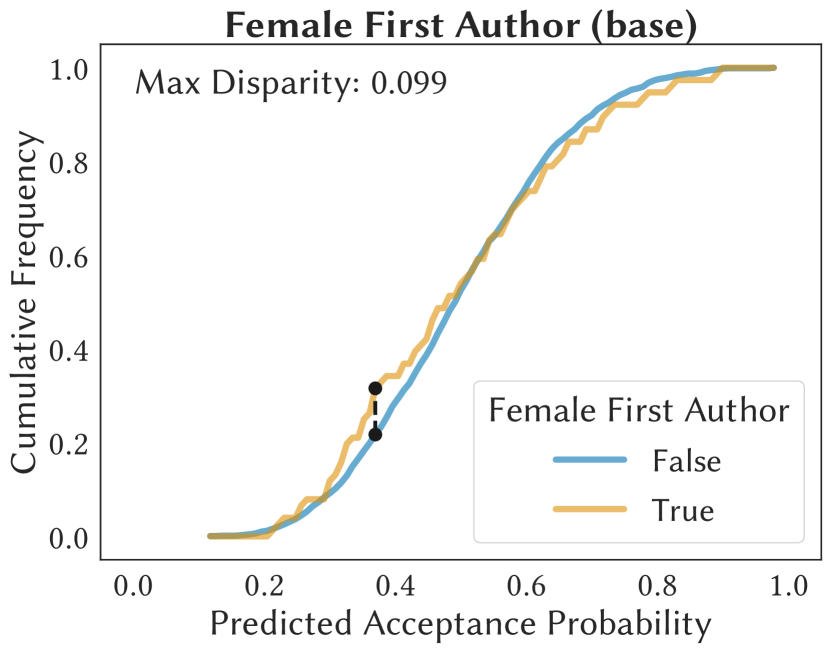
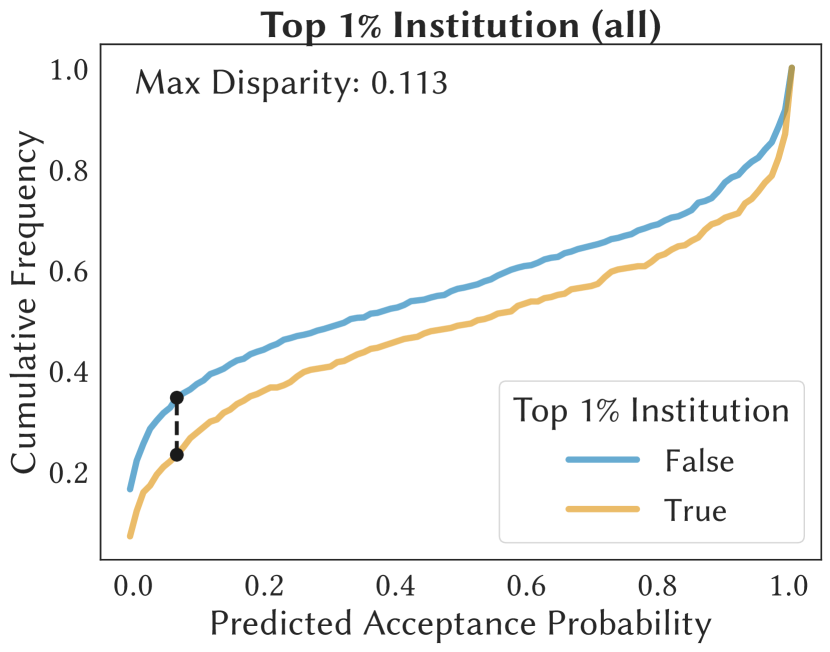
In Figure 7, we note that the ROC behavior of both +rev and +revnlp models are similarly good but the latter generally has smaller fairness violations (columns marked with +R in Table 3). This implies that textual features produced by large LMs are helpful in assessing fairness disparities, and thus should be incorporated into other related analyses. The same observation can be drawn from Figure 8, where we plot the cumulative probability function of the predicted acceptance probability across different sensitive attribute groups. A fair classifier would not distinguish the two curves and the maximum disparity between the two curves is used to measure distributional disparity. We observe that the inclusion of textual features (+revnelp) often helps in reducing the disparity.
5.4. Summary
In this section we perform fairness analysis on models trained to mimic the decision process in peer-review. Although fairness disparities often exist as a result of the underlying data distribution being imbalanced, the inclusion of high-level textual features generated by LMs can often help to ameliorate such parities.
| Disparity | DP | DP (+R) | EO | EO (+R) | AUC | AUC (+R) |
| Geographical | 0.050 | 0.050 | 0.025 | 0.029 | 0.069 | 0.068 |
| Gender | 0.022 | 0.014 | 0.108 | 0.087 | 0.121 | 0.119 |
| Author Prestige | 0.107 | 0.101 | 0.031 | 0.024 | 0.138 | 0.138 |
6. Towards Automatic Reviewing Systems
In this section, we discuss concrete examples how our database has the potential of motivating more challenging NLP tasks. Our focus lies in the review stage and we aim at defining tasks that facilitate the understanding of the review process, and more broadly, towards automatic machine reviewing systems. We train all models on NVIDIA RTX 2080 Ti GPUs with 10GB memory, except for the Longformer, which requires 45GB memory to exploit its maximum token limit. All fine-tuning are completed within 12 hours.
| Submission ID | figzpGMrdD |
| LED Output (+) | \mintedtext Summary:n\nThispaper studies the continual learning problem in PLMs. The authors analyze the performance of different combinations of PLMs and CL methods on 3 benchmark datasets, including task-incremental learning and class-incremental learning.n\nStrengths:nn1. The paper is well-written and easy to follow.nn2. The paper is well-motivated and easy to follow.n\nWeaknesses:nn1. The paper does not provide a thorough analysis of the continual learning problem in PLMs.nn2. The paper does not provide a thorough analysis of the continual learning problem in PLMs. \endminted |
| LED Output (-) | \mintedtext This paper conducts a comparative study of the performance of different continual learning methods and CL methods. The authors conduct experiments on three continual learning settings, namely task-incremental learning, class-incremental learning, and class-incremental learning.n\nThepaper is well written and easy to follow. However, I have several concerns:nn1. The paper is not well organized. For example, in section 3.1, the authors claim that "the continual learning problem with the PLM’s ability to retrain the inner representations, which leads to catastrophic forgetting". However, in section 3.2, the authors claim that \endminted |
| Review Sample | \mintedtext This paper explores the continual learning performance when combining different PLMs and common continual learning methods with 3 challenging NLP classification tasks.n\nTobenchmark these combinations the methods are evaluated in task-incremental and class-incremental learning settings over various NLP end-tasks, which covers common learning settings in continual learning and NLP… \endminted |
Review Generation
The first step of an automatic reviewing system is generating reviews from the submission. There has been a large literature on using LMs for summarization tasks ((Tas and Kiyani, 2007)); the difference here is that in the review generation task, the desirable output is the opinions rather than summaries of the paper. To this end, we fine-tune Longformer Encoder-Decoder (LED) models for conditional generation tasks on submission and review samples. Generated reviews are tabulated in Section 6, where (+) and (-) signify whether the model is trained on positive or negative samples. We note that the generated sample contain not only summaries, but also opinions and comments of the paper.
Review Score Prediction
Directly predicting the quality of a submission is a daunting task even for human reviewers. To this end, we can construct a two-stage model to generate reviews and score the reviews. The predicted scores can then be used as a surrogate for the paper quality. We fine-tune RoBERTa and Longformer models on the 2017-2021 submissions and evaluate them on the 2022 submissions, which achive and F1 scores respectively.
7. Discussions and Conclusions
We assemble a comprehensive data of peer-reviews and postulate the study of fairness violations using three commonly used fairness metrics. We observe that in the decision stage, such violations differ for sensitive attributes, and language model features help alleviate disparities in the decision stage models. Yet, we do not find compelling eveidence that such differences are significant. We also demonstrate the potential of our database to be used in benchmarking new and important NLP tasks, we provide baseline models for the example of automatic machine review tasks.
Limitations and Future Work.
(i) Move beyond association analysis: the fairness analysis we considered are by nature association analysis and we are not able to draw any causal conclusion. (ii) Choice of statistical parity measures: there are various type of statistical parity measures, and we believe there may be more interesting conclusions could be drawn for other measures besides those we chose.
Acknowledgements.
J.Z. and D.R. conceived of the presented idea. J.Z. collected the database and performed analysis. H.Z. advised on natural language processing techniques and Z.D. advised on algorithmic fairness techniques. H.Z. and Z.D. verified the methodology, results, and analysis. All authors discussed the results and contributed to the writing and polishing of the manuscript. D.R. supervised and oversaw the whole project. The authors would like to thank Bo Zhang from the Fred Hutchinson Cancer Center and Jennifer Sheffield from the University of Pennsylvania for stimulating discussions and helpful suggestions. This work is in part supported by the Sponsor US Defense Advanced Research Projects Agency (DARPA) https://www.darpa.mil/ under Contract Grant #FA8750-19-2-1004; the Sponsor Office of the Director of National Intelligence (ODNI) https://www.dni.gov/, Sponsor Intelligence Advanced Research Projects Activity (IARPA) https://www.iarpa.gov/, via IARPA Contract No. Grant #2019-19051600006 under the BETTER Program; Sponsor Office of Naval Research (ONR) https://www.nre.navy.mil/ Contract Grant #N00014-19-1-2620; Sponsor National Science Foundation (NSF) https://www.nsf.gov/ under Contract Grant #CCF-1934876. The views and conclusions contained herein are those of the authors and should not be interpreted as necessarily representing the official policies, either expressed or implied, of ODNI, IARPA, the Department of Defense, or the U.S. Government. The U.S. Government is authorized to reproduce and distribute reprints for governmental purposes notwithstanding any copyright annotation therein.References
- (1)
- Beltagy et al. (2020) Iz Beltagy, Matthew E. Peters, and Arman Cohan. 2020. Longformer: The Long-Document Transformer. arXiv:2004.05150 (2020).
- Burhanpurkar et al. (2021) Maya Burhanpurkar, Zhun Deng, Cynthia Dwork, and Linjun Zhang. 2021. Scaffolding sets. arXiv preprint arXiv:2111.03135 (2021).
- Cohan et al. (2020) Arman Cohan, Sergey Feldman, Iz Beltagy, Doug Downey, and Daniel S. Weld. 2020. SPECTER: Document-level Representation Learning using Citation-informed Transformers. In ACL.
- Cortes and Lawrence (2021) Corinna Cortes and Neil D. Lawrence. 2021. Inconsistency in Conference Peer Review: Revisiting the 2014 NeurIPS Experiment. https://doi.org/10.48550/ARXIV.2109.09774
- Dwork et al. (2012) Cynthia Dwork, Moritz Hardt, Toniann Pitassi, Omer Reingold, and Richard Zemel. 2012. Fairness through awareness. In Proceedings of the 3rd innovations in theoretical computer science conference. 214–226.
- Dycke et al. (2022) Nils Dycke, Ilia Kuznetsov, and Iryna Gurevych. 2022. Yes-Yes-Yes: Donation-based Peer Reviewing Data Collection for ACL Rolling Review and Beyond. arXiv:2201.11443 [cs.CL]
- Feldman et al. (2015) Michael Feldman, Sorelle A Friedler, John Moeller, Carlos Scheidegger, and Suresh Venkatasubramanian. 2015. Certifying and removing disparate impact. In proceedings of the 21th ACM SIGKDD international conference on knowledge discovery and data mining. 259–268.
- Gao et al. (2019) Yang Gao, Steffen Eger, Ilia Kuznetsov, Iryna Gurevych, and Yusuke Miyao. 2019. Does My Rebuttal Matter? Insights from a Major NLP Conference. In Proceedings of the 2019 Conference of the North American Chapter of the Association for Computational Linguistics: Human Language Technologies, NAACL-HLT 2019, Minneapolis, MN, USA, June 2-7, 2019, Volume 1 (Long and Short Papers), Jill Burstein, Christy Doran, and Thamar Solorio (Eds.). Association for Computational Linguistics, 1274–1290. https://doi.org/10.18653/v1/n19-1129
- Hardt et al. (2016) Moritz Hardt, Eric Price, and Nati Srebro. 2016. Equality of opportunity in supervised learning. Advances in neural information processing systems 29 (2016).
- Hua et al. (2019) Xinyu Hua, Mitko Nikolov, Nikhil Badugu, and Lu Wang. 2019. Argument Mining for Understanding Peer Reviews. In Proceedings of the 2019 Conference of the North American Chapter of the Association for Computational Linguistics: Human Language Technologies, NAACL-HLT 2019, Minneapolis, MN, USA, June 2-7, 2019, Volume 1 (Long and Short Papers), Jill Burstein, Christy Doran, and Thamar Solorio (Eds.). Association for Computational Linguistics, 2131–2137. https://doi.org/10.18653/v1/n19-1219
- Jecmen et al. (2020) Steven Jecmen, Hanrui Zhang, Ryan Liu, Nihar B. Shah, Vincent Conitzer, and Fei Fang. 2020. Mitigating Manipulation in Peer Review via Randomized Reviewer Assignments. In Advances in Neural Information Processing Systems 33: Annual Conference on Neural Information Processing Systems 2020, NeurIPS 2020, December 6-12, 2020, virtual, Hugo Larochelle, Marc’Aurelio Ranzato, Raia Hadsell, Maria-Florina Balcan, and Hsuan-Tien Lin (Eds.). https://proceedings.neurips.cc/paper/2020/hash/93fb39474c51b8a82a68413e2a5ae17a-Abstract.html
- Kang et al. (2018) Dongyeop Kang, Waleed Ammar, Bhavana Dalvi, Madeleine van Zuylen, Sebastian Kohlmeier, Eduard Hovy, and Roy Schwartz. 2018. A Dataset of Peer Reviews (PeerRead): Collection, Insights and NLP Applications. In Proceedings of the 2018 Conference of the North American Chapter of the Association for Computational Linguistics: Human Language Technologies, Volume 1 (Long Papers). Association for Computational Linguistics, New Orleans, Louisiana, 1647–1661. https://doi.org/10.18653/v1/N18-1149
- Levenshtein et al. (1966) Vladimir I Levenshtein et al. 1966. Binary codes capable of correcting deletions, insertions, and reversals. In Soviet physics doklady, Vol. 10. Soviet Union, 707–710.
- Manzoor and Shah (2021) Emaad A. Manzoor and Nihar B. Shah. 2021. Uncovering Latent Biases in Text: Method and Application to Peer Review. In Thirty-Fifth AAAI Conference on Artificial Intelligence, AAAI 2021, Thirty-Third Conference on Innovative Applications of Artificial Intelligence, IAAI 2021, The Eleventh Symposium on Educational Advances in Artificial Intelligence, EAAI 2021, Virtual Event, February 2-9, 2021. AAAI Press, 4767–4775. https://ojs.aaai.org/index.php/AAAI/article/view/16608
- Plank and van Dalen (2019) Barbara Plank and Reinard van Dalen. 2019. CiteTracked: A Longitudinal Dataset of Peer Reviews and Citations. In Proceedings of the 4th Joint Workshop on Bibliometric-enhanced Information Retrieval and Natural Language Processing for Digital Libraries (BIRNDL 2019) co-located with the 42nd International ACM SIGIR Conference on Research and Development in Information Retrieval (SIGIR 2019), Paris, France, July 25, 2019 (CEUR Workshop Proceedings, Vol. 2414), Muthu Kumar Chandrasekaran and Philipp Mayr (Eds.). CEUR-WS.org, 116–122. http://ceur-ws.org/Vol-2414/paper12.pdf
- Rogers and Augenstein (2020) Anna Rogers and Isabelle Augenstein. 2020. What Can We Do to Improve Peer Review in NLP?. In Findings of the Association for Computational Linguistics: EMNLP 2020, Online Event, 16-20 November 2020 (Findings of ACL, Vol. EMNLP 2020), Trevor Cohn, Yulan He, and Yang Liu (Eds.). Association for Computational Linguistics, 1256–1262. https://doi.org/10.18653/v1/2020.findings-emnlp.112
- Stelmakh et al. (2019) Ivan Stelmakh, Nihar B. Shah, and Aarti Singh. 2019. On Testing for Biases in Peer Review. In Advances in Neural Information Processing Systems 32: Annual Conference on Neural Information Processing Systems 2019, NeurIPS 2019, December 8-14, 2019, Vancouver, BC, Canada, Hanna M. Wallach, Hugo Larochelle, Alina Beygelzimer, Florence d’Alché-Buc, Emily B. Fox, and Roman Garnett (Eds.). 5287–5297. https://proceedings.neurips.cc/paper/2019/hash/d3d80b656929a5bc0fa34381bf42fbdd-Abstract.html
- Tas and Kiyani (2007) Oguzhan Tas and Farzad Kiyani. 2007. A survey automatic text summarization. PressAcademia Procedia 5, 1 (2007), 205–213.
- Tran et al. (2021) David Tran, Alexander V Valtchanov, Keshav R Ganapathy, Raymond Feng, Eric Victor Slud, Micah Goldblum, and Tom Goldstein. 2021. An Open Review of OpenReview: A Critical Analysis of the Machine Learning Conference Review Process. https://openreview.net/forum?id=Cn706AbJaKW
- Tsai et al. (2016) Chen-Tse Tsai, Stephen Mayhew, and Dan Roth. 2016. Cross-Lingual Named Entity Recognition via Wikification. In Proceedings of The 20th SIGNLL Conference on Computational Natural Language Learning. Association for Computational Linguistics, Berlin, Germany, 219–228. https://doi.org/10.18653/v1/K16-1022
- Tukey et al. (1977) John W Tukey et al. 1977. Exploratory data analysis. Vol. 2. Reading, MA.
- Van der Maaten and Hinton (2008) Laurens Van der Maaten and Geoffrey Hinton. 2008. Visualizing data using t-SNE. Journal of machine learning research 9, 11 (2008).
- Wang et al. (2020) Qingyun Wang, Qi Zeng, Lifu Huang, Kevin Knight, Heng Ji, and Nazneen Fatema Rajani. 2020. ReviewRobot: Explainable Paper Review Generation based on Knowledge Synthesis. In Proceedings of the 13th International Conference on Natural Language Generation, INLG 2020, Dublin, Ireland, December 15-18, 2020, Brian Davis, Yvette Graham, John D. Kelleher, and Yaji Sripada (Eds.). Association for Computational Linguistics, 384–397. https://aclanthology.org/2020.inlg-1.44/
- Yuan et al. (2021) Weizhe Yuan, Pengfei Liu, and Graham Neubig. 2021. Can We Automate Scientific Reviewing? CoRR abs/2102.00176 (2021). https://arxiv.org/abs/2102.00176
Appendix A Database Details
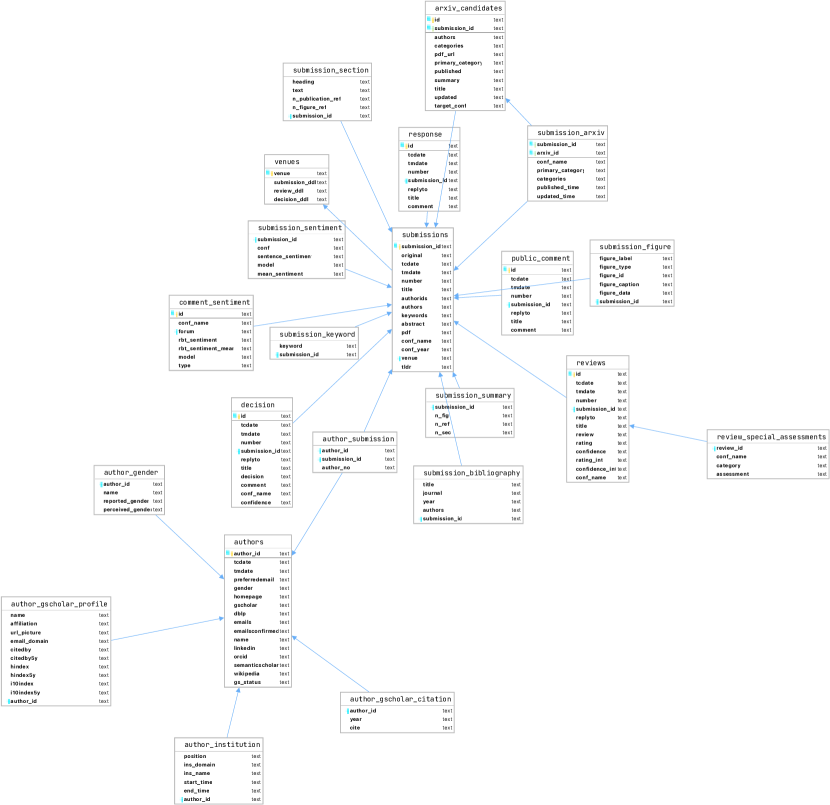
The summary of all covariates of the database is given in Table 5; we also include the entity-relation (ER) diagram in Figure 9. All collected data are open data, which are granted access by the owner.
| Conference Year | ||||||||||
| Missing | Overall | 2017 | 2018 | 2019 | 2020 | 2021 | 2022 | P-Value | ||
| Submission Covariates | ||||||||||
| n | 10297 | 490 | 910 | 1419 | 2213 | 2595 | 2670 | |||
| decision, n (%) | Accept (Oral) | 0 | 169 (1.6) | 15 (3.1) | 23 (2.5) | 24 (1.7) | 53 (2.0) | 54 (2.0) | <0.001 | |
| Accept (Poster) | 3063 (29.7) | 183 (37.3) | 313 (34.4) | 478 (33.7) | 531 (24.0) | 693 (26.7) | 865 (32.4) | |||
| Accept (Spotlight) | 398 (3.9) | 108 (4.9) | 114 (4.4) | 176 (6.6) | ||||||
| Accept (Talk) | 48 (0.5) | 48 (2.2) | ||||||||
| Invite to Workshop Track | 136 (1.3) | 47 (9.6) | 89 (9.8) | |||||||
| Reject | 6483 (63.0) | 245 (50.0) | 485 (53.3) | 917 (64.6) | 1526 (69.0) | 1735 (66.9) | 1575 (59.0) | |||
| input_len, mean (SD) | 62 | 10077.0 (6857.5) | 7304.6 (2810.6) | 8183.9 (3996.5) | 9247.6 (6404.0) | 9483.9 (5411.8) | 10432.7 (7730.6) | 11827.2 (8001.7) | <0.001 | |
| n_review, mean (SD) | 0 | 3.4 (0.7) | 3.0 (0.5) | 3.0 (0.2) | 3.0 (0.3) | 3.0 (0.4) | 3.9 (0.5) | 3.8 (0.7) | <0.001 | |
| rating_avg, mean (SD) | 0 | 5.3 (1.4) | 5.7 (1.3) | 5.4 (1.2) | 5.4 (1.2) | 4.4 (1.7) | 5.5 (1.0) | 5.5 (1.3) | <0.001 | |
| rating_max, mean (SD) | 0 | 6.4 (1.5) | 6.5 (1.5) | 6.4 (1.4) | 6.3 (1.3) | 5.7 (2.0) | 6.6 (1.2) | 6.7 (1.4) | <0.001 | |
| rating_min, mean (SD) | 0 | 4.2 (1.6) | 4.9 (1.4) | 4.5 (1.4) | 4.6 (1.3) | 3.1 (1.9) | 4.4 (1.2) | 4.3 (1.6) | <0.001 | |
| confidence_avg, mean (SD) | 0 | 3.6 (0.6) | 3.8 (0.5) | 3.8 (0.5) | 3.8 (0.5) | 3.1 (0.8) | 3.7 (0.5) | 3.7 (0.5) | <0.001 | |
| confidence_max, mean (SD) | 0 | 4.3 (0.7) | 4.3 (0.6) | 4.4 (0.6) | 4.4 (0.6) | 4.1 (1.0) | 4.4 (0.6) | 4.3 (0.6) | <0.001 | |
| confidence_min, mean (SD) | 0 | 2.8 (0.9) | 3.3 (0.7) | 3.2 (0.8) | 3.1 (0.8) | 2.1 (1.0) | 3.0 (0.7) | 3.0 (0.7) | <0.001 | |
| sentiment_avg, mean (SD) | 0 | 0.6 (0.1) | 0.6 (0.1) | 0.6 (0.1) | 0.6 (0.1) | 0.6 (0.1) | 0.6 (0.1) | 0.6 (0.1) | <0.001 | |
| sentiment_max, mean (SD) | 0 | 0.7 (0.1) | 0.7 (0.1) | 0.7 (0.1) | 0.7 (0.1) | 0.7 (0.1) | 0.7 (0.1) | 0.7 (0.1) | <0.001 | |
| sentiment_min, mean (SD) | 0 | 0.5 (0.1) | 0.5 (0.1) | 0.5 (0.1) | 0.5 (0.1) | 0.5 (0.1) | 0.5 (0.1) | 0.5 (0.1) | <0.001 | |
| rlen_avg, mean (SD) | 62 | 585.5 (220.4) | 393.8 (161.2) | 504.4 (188.5) | 552.6 (214.2) | 559.8 (219.6) | 653.4 (222.2) | 620.9 (205.8) | <0.001 | |
| rlen_max, mean (SD) | 62 | 918.5 (468.8) | 591.7 (287.3) | 768.4 (365.2) | 846.6 (431.7) | 851.9 (442.9) | 1049.6 (517.0) | 995.4 (457.6) | <0.001 | |
| rlen_min, mean (SD) | 62 | 325.3 (144.0) | 225.4 (121.2) | 281.0 (129.9) | 310.4 (154.2) | 320.6 (143.0) | 357.6 (142.9) | 338.9 (135.1) | <0.001 | |
| sub_fluency, mean (SD) | 58 | 0.8 (0.0) | 0.9 (0.0) | 0.9 (0.0) | 0.9 (0.0) | 0.9 (0.0) | 0.8 (0.0) | 0.9 (0.0) | <0.001 | |
| n_fig, mean (SD) | 62 | 12.5 (7.3) | 9.2 (4.9) | 9.5 (4.9) | 11.1 (6.1) | 11.8 (6.4) | 13.3 (7.5) | 14.8 (8.5) | <0.001 | |
| n_ref, mean (SD) | 62 | 40.3 (17.0) | 30.0 (11.5) | 32.2 (12.7) | 35.6 (14.4) | 38.1 (14.7) | 43.3 (17.5) | 46.3 (18.5) | <0.001 | |
| n_sec, mean (SD) | 62 | 19.0 (7.2) | 16.2 (5.6) | 16.8 (6.0) | 17.8 (6.3) | 18.3 (6.6) | 19.3 (7.4) | 21.4 (7.9) | <0.001 | |
| arxiv_first, n (%) | False | 0 | 8704 (84.5) | 490 (100.0) | 889 (97.7) | 1359 (95.8) | 1675 (75.7) | 2062 (79.5) | 2229 (83.5) | <0.001 |
| True | 1593 (15.5) | 21 (2.3) | 60 (4.2) | 538 (24.3) | 533 (20.5) | 441 (16.5) | ||||
| n_author, mean (SD) | 0 | 4.1 (2.0) | 3.7 (1.7) | 3.8 (1.8) | 4.0 (1.9) | 4.1 (1.9) | 4.2 (2.0) | 4.4 (2.1) | <0.001 | |
| any_reported_f, n (%) | False | 0 | 7547 (73.3) | 405 (82.7) | 726 (79.8) | 1084 (76.4) | 1631 (73.7) | 1859 (71.6) | 1842 (69.0) | <0.001 |
| True | 2750 (26.7) | 85 (17.3) | 184 (20.2) | 335 (23.6) | 582 (26.3) | 736 (28.4) | 828 (31.0) | |||
| cnt_reported_f, mean (SD) | 0 | 0.3 (0.6) | 0.2 (0.5) | 0.2 (0.5) | 0.3 (0.5) | 0.3 (0.6) | 0.3 (0.6) | 0.4 (0.7) | <0.001 | |
| any_perceived_f, n (%) | False | 0 | 8251 (80.1) | 409 (83.5) | 751 (82.5) | 1160 (81.7) | 1767 (79.8) | 2041 (78.7) | 2123 (79.5) | 0.020 |
| True | 2046 (19.9) | 81 (16.5) | 159 (17.5) | 259 (18.3) | 446 (20.2) | 554 (21.3) | 547 (20.5) | |||
| cnt_perceived_f, mean (SD) | 0 | 0.2 (0.5) | 0.2 (0.4) | 0.2 (0.4) | 0.2 (0.5) | 0.2 (0.5) | 0.2 (0.5) | 0.3 (0.6) | <0.001 | |
| demo_no_us, n (%) | False | 0 | 6191 (60.1) | 312 (63.7) | 586 (64.4) | 910 (64.1) | 1336 (60.4) | 1525 (58.8) | 1522 (57.0) | <0.001 |
| True | 4106 (39.9) | 178 (36.3) | 324 (35.6) | 509 (35.9) | 877 (39.6) | 1070 (41.2) | 1148 (43.0) | |||
| ins_rank_max, mean (SD) | 855 | 118.8 (133.6) | 37.1 (34.6) | 61.0 (60.9) | 83.5 (84.1) | 114.1 (118.0) | 131.0 (134.7) | 159.9 (169.4) | <0.001 | |
| ins_rank_avg, mean (SD) | 855 | 73.3 (86.8) | 27.0 (27.5) | 42.1 (46.6) | 54.3 (59.8) | 71.7 (78.5) | 79.2 (85.6) | 95.5 (110.6) | <0.001 | |
| author_cite_max, mean (SD) | 700 | 23020.8 (44860.0) | 16049.3 (26747.9) | 20957.1 (35040.7) | 21761.0 (41772.0) | 21904.6 (44486.5) | 27168.5 (49593.9) | 22208.8 (46597.3) | <0.001 | |
| author_cite_avg, mean (SD) | 700 | 8692.5 (15223.8) | 7179.0 (10922.5) | 8551.9 (13674.7) | 8575.7 (14236.6) | 9111.5 (18693.2) | 8832.7 (13247.4) | 8581.9 (15584.7) | 0.267 | |
| Review Covariates | ||||||||||
| n | 35717 | 1489 | 2748 | 4332 | 6721 | 10026 | 10401 | |||
| rating_int, mean (SD) | 0 | 5.3 (1.8) | 5.7 (1.6) | 5.4 (1.5) | 5.4 (1.5) | 4.4 (2.2) | 5.5 (1.4) | 5.5 (1.7) | <0.001 | |
| confidence_int, mean (SD) | 0 | 3.6 (0.9) | 3.8 (0.8) | 3.8 (0.8) | 3.8 (0.8) | 3.1 (1.3) | 3.7 (0.8) | 3.7 (0.8) | <0.001 | |
| sentiment, mean (SD) | 1 | 0.6 (0.1) | 0.6 (0.2) | 0.6 (0.2) | 0.6 (0.1) | 0.6 (0.1) | 0.6 (0.1) | 0.6 (0.1) | <0.001 | |
| review_len, mean (SD) | 222 | 592.5 (380.0) | 393.8 (253.5) | 504.7 (320.3) | 553.2 (364.4) | 559.7 (367.8) | 653.6 (409.0) | 622.7 (377.0) | <0.001 | |
| review_type, n (%) | Borderline | 0 | 17213 (48.2) | 593 (39.8) | 1181 (43.0) | 1985 (45.8) | 2393 (35.6) | 4932 (49.2) | 6129 (58.9) | <0.001 |
| Negative | 10649 (29.8) | 392 (26.3) | 825 (30.0) | 1232 (28.4) | 3486 (51.9) | 2533 (25.3) | 2181 (21.0) | |||
| Positive | 7855 (22.0) | 504 (33.8) | 742 (27.0) | 1115 (25.7) | 842 (12.5) | 2561 (25.5) | 2091 (20.1) | |||
| Author Covariates | ||||||||||
| n | 31780 | 1416 | 2703 | 4286 | 6807 | 7914 | 8654 | |||
| author_no, mean (SD) | 0 | 2.9 (2.0) | 2.6 (1.7) | 2.7 (1.8) | 2.7 (1.8) | 2.8 (1.9) | 2.9 (2.0) | 3.1 (2.4) | <0.001 | |
| reported_gender, n (%) | Female | 0 | 2470 (7.8) | 81 (5.7) | 162 (6.0) | 298 (7.0) | 503 (7.4) | 656 (8.3) | 770 (8.9) | <0.001 |
| Male | 19099 (60.1) | 769 (54.3) | 1565 (57.9) | 2527 (59.0) | 3951 (58.0) | 4763 (60.2) | 5524 (63.8) | |||
| Non-Binary | 18 (0.1) | 1 (0.1) | 2 (0.1) | 2 (0.0) | 2 (0.0) | 5 (0.1) | 6 (0.1) | |||
| Unspecified | 10193 (32.1) | 565 (39.9) | 974 (36.0) | 1459 (34.0) | 2351 (34.5) | 2490 (31.5) | 2354 (27.2) | |||
| perceived_gender, mean (SD) | 10077 | 0.9 (0.3) | 0.9 (0.3) | 0.9 (0.3) | 0.9 (0.3) | 0.9 (0.3) | 0.9 (0.3) | 0.9 (0.3) | <0.001 | |
| country, n (%) | Australia | 9998 | 318 (1.5) | 18 (1.1) | 42 (1.5) | 72 (1.6) | 93 (1.7) | 93 (1.4) | <0.001 | |
| Austria | 72 (0.3) | 6 (0.8) | 10 (0.6) | 4 (0.1) | 8 (0.2) | 23 (0.4) | 21 (0.3) | |||
| Bangladesh | 1 (0.0) | 1 (0.0) | ||||||||
| Belgium | 9 (0.0) | 1 (0.1) | 3 (0.1) | 5 (0.1) | ||||||
| Brazil | 2 (0.0) | 1 (0.1) | 1 (0.0) | |||||||
| Canada | 1111 (5.1) | 55 (6.9) | 111 (6.6) | 167 (5.9) | 215 (4.8) | 258 (4.7) | 305 (4.7) | |||
| Chile | 7 (0.0) | 1 (0.0) | 5 (0.1) | 1 (0.0) | ||||||
| China | 2443 (11.2) | 10 (1.3) | 75 (4.5) | 196 (6.9) | 479 (10.8) | 655 (11.8) | 1028 (15.8) | |||
| ⋮ | ⋮ | ⋮ | ⋮ | ⋮ | ⋮ | ⋮ | ⋮ | |||
| United Kingdom | 1290 (5.9) | 60 (7.6) | 100 (6.0) | 178 (6.3) | 262 (5.9) | 329 (5.9) | 361 (5.5) | |||
| United States | 12465 (57.2) | 590 (74.3) | 1116 (66.8) | 1750 (61.9) | 2562 (57.8) | 3102 (56.0) | 3345 (51.3) | |||
| Viet Nam | 6 (0.0) | 1 (0.0) | 5 (0.1) | |||||||
| ins_cum_cnt, mean (SD) | 7717 | 77.3 (124.7) | 13.9 (16.4) | 31.1 (43.6) | 51.1 (72.3) | 69.3 (106.6) | 87.4 (131.5) | 104.1 (155.7) | <0.001 | |
| ins_per_year_rank, mean (SD) | 7717 | 77.4 (110.6) | 27.6 (31.3) | 42.4 (53.8) | 55.8 (73.1) | 76.1 (100.6) | 79.6 (106.7) | 99.8 (139.8) | <0.001 | |
| ins_per_year_rank_pct, mean (SD) | 7717 | 0.2 (0.2) | 0.2 (0.2) | 0.2 (0.2) | 0.2 (0.2) | 0.2 (0.2) | 0.2 (0.2) | 0.2 (0.2) | <0.001 | |
| author_year_citation, mean (SD) | 11503 | 6280.0 (18896.5) | 5212.4 (14413.0) | 5952.3 (16494.4) | 5475.2 (15299.4) | 5986.7 (17614.4) | 7146.3 (21546.8) | 6016.7 (18943.9) | <0.001 | |
| author_year_rank, mean (SD) | 11503 | 0.5 (0.3) | 0.5 (0.3) | 0.5 (0.3) | 0.5 (0.3) | 0.5 (0.3) | 0.5 (0.3) | 0.5 (0.3) | 0.866 | |