An initial Theory to Understand and Manage Requirements Engineering Debt in Practice
Abstract
Context: Advances in technical debt research demonstrate the benefits of applying the financial debt metaphor to support decision-making in software development activities. Although decision-making during requirements engineering has significant consequences, the debt metaphor in requirements engineering is inadequately explored. Objective: We aim to conceptualize how the debt metaphor applies to requirements engineering by organizing concepts related to practitioners’ understanding and managing of requirements engineering debt (RED). Method: We conducted two in-depth expert interviews to identify key requirements engineering debt concepts and construct a survey instrument. We surveyed 69 practitioners worldwide regarding their perception of the concepts and developed an initial analytical theory. Results: We propose a RED theory that aligns key concepts from technical debt research but emphasizes the specific nature of requirements engineering. In particular, the theory consists of 23 falsifiable propositions derived from the literature, the interviews, and survey results. Conclusions: The concepts of requirements engineering debt are perceived to be similar to their technical debt counterpart. Nevertheless, measuring and tracking requirements engineering debt are immature in practice. Our proposed theory serves as the first guide toward further research in this area.
keywords:
Requirements Engineering , Requirements Engineering Debt , Interview Study , Online Survey , Theory1 Introduction
Over the past decade, Technical Debt (TD) has emerged as a popular research area [1] and a useful model to support decision-making in software development [2]. The concept of TD leverages the financial metaphor of debt to model trade-offs between short-term benefits and long-term effects. For example, shortcuts in software development reduce time-to-market but require increasingly expensive future refactoring to address quick-and-dirty solutions.
The TD metaphor extends to a range of software engineering (SE) activities. The tertiary study by Rios et al. [1] shows that the concept of debt is applicable to and researched in the fields of—amongst others—software architecture, design, and quality assurance, effectively establishing concepts such as Architecture Debt, Design Debt, Test Debt, and others. In Requirements Engineering (RE), Ernst [3] proposed an initial application of the debt metaphor—i.e., requirements engineering debt (RED). Subsequently, Lenarduzzi and Fucci [4] provided a vision for a broader definition of how debt can be accumulated in requirements engineering activities.
Despite these initial contributions that recognized RED as one of the different types of debt , gaps in research persist. First and foremost, we lack a deep understanding of how and to what extent RED is perceived and addressed in the industry. Similar to its code-related counterpart, RED is a complex concept characterizing practical phenomena that cannot exist in a vacuum and that can only be observed in practical contexts. Consequently, understanding and further refining the concept of RED requires studying it in the real world. In contrast, TD research has progressed towards establishing such an empirically grounded understanding through a strong community of researchers and practitioners exemplified by the InsighTD project111http://www.td-survey.com/.
Without a comparable understanding of RED from a practical viewpoint, the relevance of future research is questionable. In this paper, we argue that RED as decision-making support in practice needs to consider practitioners’ perspectives. The necessity to fill the research gap and advance RED research is exacerbated by the impact RE has on subsequent software development activities [5]. It is desirable not only to detect and manage these issues as early as possible but also to understand their consequences properly. We argue that RED has the potential to model such a relationship. Given the viability of the debt metaphor at code level to support decision-making, studying the metaphor in the RE context potentially yields even larger benefits in terms of, for example, cost avoidance. Since defects introduced during the RE phase of the software development process tend to scale approximately by a factor of 10 [6], the cost avoidance through supported decision-making in the form of RED has great potential.
We performed a three-step empirical study as a starting point for addressing the existing gaps. First, we conducted expert interviews to derive an initial set of themes related to the debt metaphor in the RE context. Second, we developed a questionnaire based on the interview results and conducted an online survey to gauge practitioners’ perceptions of the identified RED concepts. Third, we used the 69 survey responses from practitioners to develop a descriptive, evidence-based theory of RED serving as the conceptual foundation for further research.
We make the following contributions:
-
1.
Conceptualization: A refined map of key concepts from the TD metaphor to the RE domain.
-
2.
Analytical theory: An analytical theory that describes the notion of RED based on our empirical studies. The theory supports decision-making in RE by leveraging the debt metaphor.
-
3.
Data: The material necessary to replicate the interview and survey studies.222Accessible in our replication package, currently at https://www.dropbox.com/s/zbz7zjnwn62x87a/ured-replication.zip?dl=0. The data will be stored permanently on Zenodo upon acceptance.
To the best of our knowledge, this is the first empirical work explicitly tackling the understanding of RED in practice.
In the rest of the manuscript, Section 2 presents the current state of TD and RED research. Section 3 presents the study design for the interview study, the online survey, and the subsequent theory development. The results of these studies are presented in Section 4. Finally, Section 5 discusses the results, including their limitations, and maps them to the existing TD theory in. Section 6 concludes with an outline of future work.
2 Background and Related Work
Section 2.1 discusses the fundamental terminology used in the context of TD and Section 2.2 further introduces related work.
2.1 Technical Debt Terminology
The term technical debt (TD) has been originally coined by Cunningham to describe short-term decisions at the expense of long-term consequences [7]. In particular, the financial concept of debt—where the total cost is composed of a fixed principal and a time-dependent interest—has been used to describe how these short-term decisions accrue additional cost at an interest rate that ultimately needs to be paid back on top of the principal to remediate the debt [8]. The notion of TD sparked a productive research field, including a dedicated conference venue333https://conf.researchr.org/series/TechDebt and related concepts like the converse technical credit introduced by Berenbach et al., which is defined as the “investment in the engineering, designing and constructing of software or systems over and above the minimum necessary effort, in anticipation of emergent properties paying dividends at a later date.” [9]
A secondary study by Li et al. [10] synthesized existing TD literature to identify the most commonly agreed-upon concepts of the metaphor. TD is composed of items, which are “a unit of TD in a software system” [10]. TD can have several causes and effects, where the latter subdivide into consequences, symptoms, and value:
-
1.
Consequence: “the influences of incurring TD on the software system” [10].
-
2.
Symptom: indicators for the incurred TD.
-
3.
Value: “the potential benefit of incurring TD” [10].
Further concepts like bankruptcy, which “happens when the part of the software system which contains TD is no longer viable to support the development and a complete rewrite, and a new platform are needed” [11], are less commonly explored but still relevant to TD research.
2.2 TD research in RE
Among the fifteen types of TD identified by Rios et al. [1], two types are related to RE: documentation debt and requirements debt.
Documentation debt represents the problems in documentation artifacts produced during various development stages, including requirements specifications. This limits the scope of documentation debt to requirements artifacts, which are only one aspect of RE.
Rios et al. [12] conducted a study focusing on documentation debt. Surveying 39 practitioners and interviewing experts revealed generalized causes, effects, prevention, and repayment practices specific to documentation debt. While the prevention and repayment practices are more focused on code-related documentation (e.g., “[c]omment the code” as a prevention and “[k]eep the documentation updated” as a payment practice [12]), the identified causes of debt are also relevant to RED (e.g., “[d]eadline” and “[i]naccurate time estimate” [13]).
Barbosa et al. [14] specifically investigate a subset of documentation debt in the domain of requirements engineering, which they frame requirements and requirements documentation debt (R2DD). Using an existing data set containing survey responses of 78 practitioners to the global InsighTD survey [15], the authors extracted causes, effects, prevention, and repayment practices relevant to requirements documentation. The resulting occurrences of the observed concepts are presented in Table 1.
| Concepts | Documentation debt [15] | Requirements debt [14] |
| Causes | Deadline, The company does not give value to documentation, Non-adoption of good practices, Inaccurate time estimations, Inappropriate planning. | Deadline, Not effective project management, Change in requirement, Inappropriate planning, High turnover of the team. |
| Effects | Low maintainability, Delivery delay, Rework, Low external quality, Inadequate, non-existing or outdated documentation. | Delivery delay, Rework, Financial loss, Low external quality, Low maintainability. |
| Prevention practices | Comment the code, Create tutorials on how to fill the documentation, Define process and good practices for documentation, Define roles concerning the documentation process, Document the project since it begins. | Well-defined requirement, Follow the project planning, Follow the well-defined project process, Well-defined scope statement, Good allocation of resources in the team. |
| Repayment practices | Adopt TD payment prioritization criteria, Keep the documentation updated, Review outdated documentation. | Code refactoring, Monitor and control project activities, Design refactoring, Investing effort on TD repayment activities, Changing project scope. |
These two previous studies [12, 14] constitute the empirical body of knowledge of TD applied to RE. Even though their scope is limited to documentation, their results are relevant to RED and we discuss their alignment in Section 5.2.
Ernst [3] presents one of the first definitions of technical debt in requirements as “the distance between the optimal solution to a requirements problem and the actual solution, with respect to some decision space.” The distance results from decisions trading immediate gains for future costs, which corresponds to the notion of intentional TD. Similarly to unintentional TD, the distance can also increase due to unforeseen or unintended changes in the context of the requirements problem [3]. Accordingly, the interest on the debt is the rate of increase of such distance [3].
This definition exceeds the perspective of requirements documentation and considers general requirements problems. Whereas debt applying to the requirements documentation only refers to requirements artifacts, the scope of RED extends to the whole RE process. However, the definition of RED is still limited to only one specific requirements problem—i.e., what Lenarduzzi and Fucci [4] refer to as mismatch implementation. The latter extends the definition of RED by including two additional requirements problems related to stakeholder discovery—i.e., the debt accrued by involving only part of the stakeholders in the RE process, and requirements artifact smells—i.e., the debt accrued due to quality violation in the requirements specification, such as using ambiguous language.
More recently, a systematic literature review by Melo et al. [16] covered the causes of RED as well as methods to identify and manage it. They identified 66 primary studies that, although not explicitly focusing on RED, contained instances of investigations addressing activities related to RE, for instance, in design and documentation. Their results show 33 causes for RED divided according to their level of intentionality and 16 strategies to identify and manage RED, including nine issues arising in such a process. Moreover, inspired by TD research, they provide metrics to assess RED principal, interests, and payback.
Through the application of the TD metaphor first to requirements documentation [14, 12] and later to requirements engineering in general [3, 4, 16], the research community established a conceptual foundation of RED. However, an empirical perspective on RED in practice is still a gap that we address in this study.
3 Study Design
In this study, we answer the following research questions:
-
1.
RQ1: How do practitioners understand RED?
-
2.
RQ2: How do practitioners manage RED?
Similar to previous studies related to TD in RE [14, 12], we are interested in understanding the concepts of RED and how to manage it. In contrast to previous studies on RED [3, 4, 16], we focus on the view of practitioners.
Our study is divided into three stages: (1) expert interviews, (2) a questionnaire-based online survey, and (3) the inference of a theory. The interview study is a first and in-depth investigation of practitioners’ perspectives on RED, while the online survey scales up the involvement of practitioners. As a final step, we synthesize our results into an initial theory of RED. This theory serves as a foundation for supporting decision-making in RE utilizing the debt metaphor and provides a starting point for empirically grounded follow-up research.
We present the overall study design in Section 3.1 and explain the three individual steps in more detail in Sections 3.2, 3.3 and 3.4.
3.1 Research Pipeline
We visualize the overall research process in Figure 1. We initially identified common concepts from the TD literature and mapped them to the RE domain. This mapping was aligned with the theoretical contributions to RED literature (e.g., [3, 4]). The concepts guided the design of the interview study and resulted in a set of themes to structure the interview protocol. We used the transcripts produced during the interviews as input to design the online survey instrument. We used the responses to the survey and the interview topics to derive the propositions and explanations in our theory. Where applicable, we used existing literature to support our explanations.
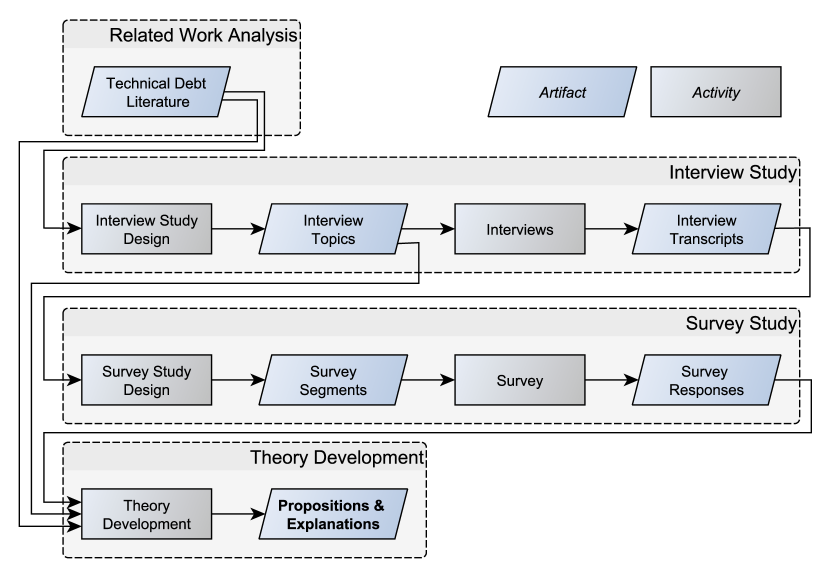
Table 2 lists all relevant concepts used within the TD domain and connects them to their respective counterparts in the three steps of this study.
| TD Literature | Interview topics | Survey segment |
| Debt Item [10] | Debt Item | — |
| Value [17] | Value-cost tradeoff | Value |
| Principal & interest [17] | Cost structure | — |
| Bankruptcy [11] | Cost Structure | Bankruptcy |
| Impact [18] | TD Properties | Propagation |
| Symptoms [10] | TD Properties | Symptoms |
| Causes [13] | Causes | Causes |
| Effects [13] | Effects | Effects |
| Awareness [19] | Awareness | Intentionality |
| Management [8] | Management | Remediation |
| Tracking [20, 21] | Monitoring | Detecting, Measuring, Tracking |
3.2 Interview Study
The goal of the interviews was to collect guiding themes and constructs for creating the survey questionnaire (see Section 3.3). We used the key informant technique [22] to collect valuable evidence from experts on a specific topic. In particular, we selected experts with the following characteristics, the participants (1) have a role in the RE community which exposes them to the kind of information we sought, (2) are knowledgeable in the field of RE and TD, and (3) are willing to communicate their knowledge.
Participants
The first participant is the co-founder of a company that provides services, including training, in the area of RE quality improvement with seven years of practical experience. The other two are product managers in a large software service provider with over 20 years of experience. All participants are also active researchers in the areas of RE and SE. We used convenience sampling [23] as we recruited the interview participants from our personal networks. After noticing convergence of the guiding themes and constructs elicited by all three interview participants, we deemed the data collection of the interview study sufficiently complete.
Interview protocol
We selected the topics for the interview study—and, accordingly, the interview script—around themes mapped and adapted from the TD literature (see Table 2). In particular, we (1) extended the concept of Value to include an explicit discussion of its trade-off with costs; (2) organized the concepts of Principal&Interest and Bankruptcy around the theme Cost structure; (3) addressed Impact and Symptoms together in the TD properties theme; (4) used the term Monitoring—as suggested by Rios et al. [1]—to include the several activities (e.g., detecting, measuring) that fall under the Tracking concept.
Before the interviews, we communicated our research objectives to the participants. We conducted the interviews remotely over video between 2020-04-21 and 2020-06-25. The second author acted as the interviewer, and the first and the third author supported the process by taking notes and prompting visualization material to aid the main interviewer.
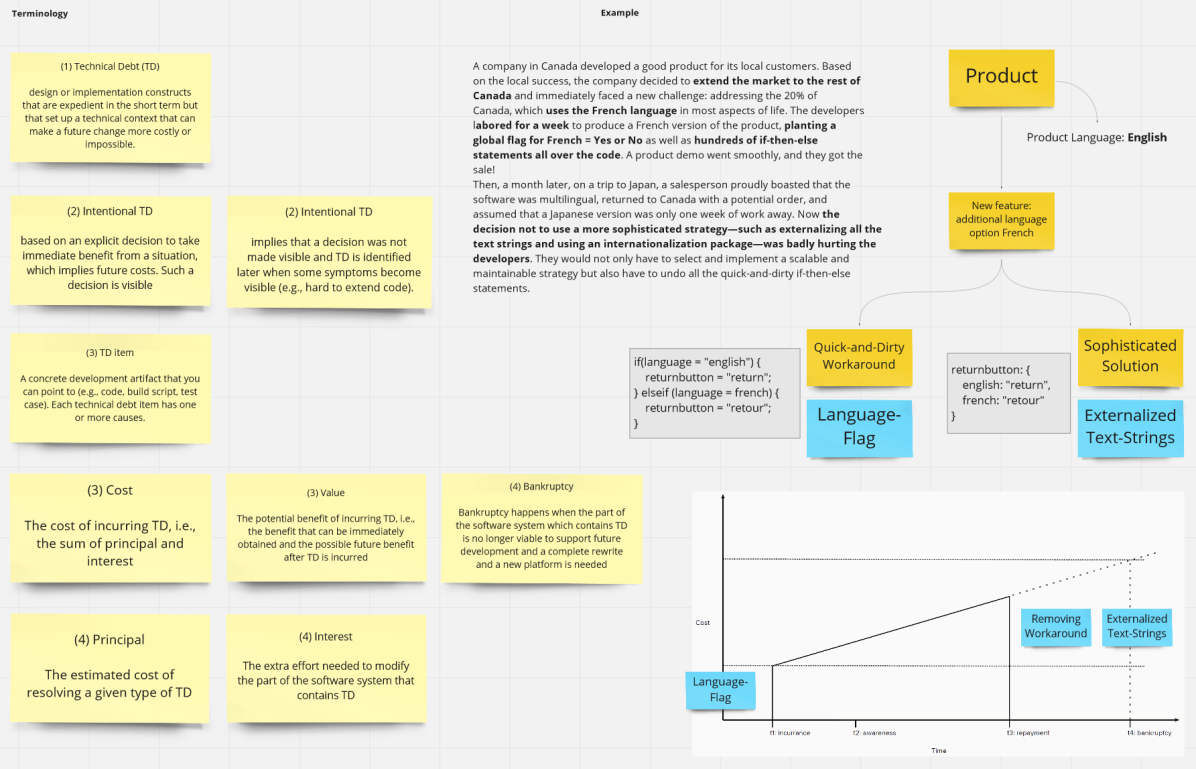
We used a semi-structured interview approach. In particular, we focused on understanding whether and how the participants apply the TD metaphor to RE in practice (for instance, how they understand a debt item in RE or what is the cost of a debt item in RE) and what strategies they use to manage it. We used a shared online whiteboard as support to drive the interviews, clarify the constructs, and provide examples to elicit participants’ perspectives as shown in Figure 2. Each interview lasted approximately 70 minutes and was voice recorded. We then used the transcription of the recording for thematic analysis [24].
Analysis
The first two authors independently read the entire transcript of each interview and conducted, during a first analysis instance, deductive coding [25] against interview topics to identify, for example, causes, effects, and properties of RED. In a second analysis instance, the same authors performed inductive coding to avoid missing relevant aspects related to the RED metaphor and ensure completeness of the coding. In total, the two authors generated 114 codes. After comparing individual codes, agreeing on common labels, and performing axial coding, they yield the 13 themes reported in Figure 3. For example, under Project failure/bankruptcy, we coded the following statement by P2: “So you have written down stuff and you realize that maintaining this documentation, as it may be, is too expensive. Let’s just drop it. That happens.” as maintenance. Also, P3 stated: “You accept too many requirements and at the end you have a very complicated system that tries to enforce a process that nobody wants to use in practice and the market fights against it as they don’t want to use it. I think this system is in a bankruptcy situation because of bad requirements engineering.” which we coded as gold plating under the same theme. The complete codebook is available in the replication package; verbatim quotes were removed due to non-disclosure agreement.

3.3 Online Survey
We developed an online questionnaire based on the themes identified when analyzing the interviews to scale up the insights gained through the practitioners’ perspectives on RED.
Target Population and Sampling
The target population of our survey consists of practitioners generally engaged with requirements—whether as part of an explicit requirements engineering phase or not. Here, we applied convenience sampling. We reached out to our target population by contacting experts in RE who are well-connected to the industry in different parts of the world. We did so via our personal contacts, networks, and associations. We complemented this outreach with posts on social media (such as Twitter). Participants acted as multipliers, and each multiplier was encouraged to distribute the survey invitation in their respective networks.
Questionnaire
We designed the survey segments and the questions contained in each segment based on the evaluation of the interview transcripts (see Table 2). In addition, we (1) embedded the concept of debt items into adjacent concepts (causes and consequences) to make them more tangible; (2) disregarded cost structure as the interview revealed that the current lack of quantification for RED makes an assessment of principal and interest unlikely; instead, we focused on bankruptcy as a concept underrepresented in literature; (3) emphasized propagation based on the interview discussions of impact; (4) specified awareness into intentionality (i.e., either intentional or unintentional), which we also consider to be more suitable for analysis in a survey; (5) concretized management and tracking into detecting, measuring, tracking, and remediation. The survey protocol is available in A.
The questionnaire consists of 33 closed and 10 open-ended questions, of which six closed and one open-ended questions were demographic questions. We used closed-ended questions to capture the practitioners’ perceptions regarding RED concepts, which we later included in the theory—for example, the proposition about the most dominant type of causes for RED (P3 in Table 4). Two open-ended questions let respondents provide a rationale for their answers to closed-ended questions. In the other seven open-ended questions, respondents can consider more complex answers requiring them to provide examples based on their experiences. The questionnaire was implemented using a web-based tool and distributed via mail to our contacts who acted as multipliers and posted on social media. We collected a total of 69 complete survey responses in the timeframe between 10.05.2021 and 03.02.2022.
Analysis Procedure
We analyzed the quantitative data from the survey using descriptive statistics and visualizations. However, the sample distribution does not enable meaningful statistical analysis (e.g., a comparison between countries and domains). We focused on qualitative data analysis to answer our research questions. In particular, we use open coding [25] to derive explanations for existing concepts as well as concepts not previously considered.
3.4 Theory Development
Finally, we use the responses from the survey results to build an initial theory of RED. Considering the terminological and conceptual adoption of theory building and evaluation for Software Engineering [26, 27], we constructed an analytical theory focusing on a model that captures a set of propositions that can later serve as a basis to define (falsifiable) hypotheses.
While building the theory, we draw from a similar experience in the context of the Naming the Pain in Requirements Engineering initiative444www.napire.org [5, 28]. However, rather than starting by populating our theory first with constructs and propositions from literature and then corroborating it with the survey results (as done in [5]), we use the survey results to build our theory bottom-up and then add explanations, where suitable, by drawing from existing evidence from the literature. We selected this approach due to the scarcity of RED-specific literature.
4 Results
Section 4.1 presents the results from the interview study, Section 4.2 the results of the online survey, and Section 4.3 the results from the theory development.
4.1 Interview Study
The themes derived from coding the interview transcripts showed how existing TD concepts are understood in RE and revealed new concepts that are underrepresented in existing TD literature but are relevant to RED. While the elements of the debt metaphor (e.g., debt item, causes, effects) mostly aligned with existing research, the concepts intentionality and propagation emerged as particularly relevant to RED. Discussions on managing RED revealed some relevant deviations of RED from TD. The interview study confirmed the applicability of the debt metaphor to the RE domain and added valuable, additional concepts to consider in the subsequent survey study.
Elements of the debt metaphor
The interview participants perceived elements like debt item, principal & interest, value, symptoms and effects similarly to how they are understood in TD. One interview participant reports “taking a shortcut in the RE process” as the value of RED, which matches its equivalent definition in TD. Further, the participant reports that “the impact of mistakes in requirements engineering is like a hundred, a thousand times higher than fixing it right away,” which aligns with an exponential interest of the debt item cost structure. The effects of RED are described by one interview participant using a three-tier hierarchy [29]—“if you have a problem in your specification, everybody who is using your specification can make a mistake [due to the first order impact]. Then, second-order impact [affects] the people who use those artifacts that are created based on your requirements. Test cases are based on your requirements, system code is based on your requirements. Everybody who is using those can be impacted by that.” The third tier encompasses everything affected by the deployed product, which maximizes the cost of remediating the debt items. This description aligns with the cost structure of TD and emphasizes the cascading consequences that RED can have. The causes of RED are described by one interview participant as time-related “project pressure” and “lack of understanding of what’s good engineering.” According to these statements, RED must not be limited to documentation but has to consider organizational as well as personal aspects.
Managing RED
The interview participants emphasized that managing RED is not widely established. One interview participant reported “I’ve just seen one company where I looked into these things and they have been systematically documenting the results of the requirements reviews. And most other companies, it’s more like, <<let’s fix the issues.>> That’s all we want to do.” Tool support for managing RED specifically is lacking, with one participant suggesting that “[w]hat you need is an automatic analysis that not just checks your requirements at a specific point in time, but over a period of time.” Another interview participant reports that “the toolset JIRA, Kanban boards and that—they are okay. However, it is more about practice and culture rather than tools.” As “you need to keep track of your debt,” the need for both awareness and an explicit approach to managing RED becomes apparent.
Intentionality
Whether debt is accrued intentionally or unintentionally is an important attribute of TD as well as RED. The interview participants reported that RED is most commonly accrued unintentionally due to a lack of diligence, i.e., being oblivious to a better alternative. In requirements engineering, “one of the main unintentional debts is probably that you don’t ask enough stakeholders”, as reported by one of the interview participants. However, RED can also be accrued intentionally—i.e., a debt item is intentionally created with explicit awareness. This usually happens as a consequence of negligence, as one interview participant reports—“I see it sometimes when we, as consultants, especially when we do audits, we come in and tell people, <<Hey, you need to fix these ten fundamental structural problems>> and nobody fixes them.” Another interview participant confirms that intentional debt is often accrued due to active prioritization—“[the debt item] gets intentionally de-prioritized because other things are just more important.” One interview participant reports that “[the companies] often do not track the intentional [debt]. The unintentional [debt] is something you have to detect and then track, and you have to invest some effort and time to make sure that you detect it.”
Propagation
A less-explored concept in TD and RED literature is the propagation of debt from one debt item to other artifacts, causing them to also accrue debt [30]. Interview respondents reported that one risk associated with RED is that its impact on artifacts in the scope of RE (e.g., specifications or use cases) can cause debt for other artifacts outside the scope of RE. One interview participant reported the potential scope of this affecting even the final product, when saying “this can be […] up to very high levels that you say, <<Actually we can throw the whole product away>>”, which corresponds to the bankruptcy of the product. The propagation of RED can be mitigated by domain knowledge. “[I]f you have a great team who knows the domain, who knows the application, and knows everything about the system, who are users of your system themselves, it’s all there. They’re experts actually for the application. Then you have an okay chance that they will still do a good job. In that case, fixing that technical debt just is within the scope of the requirements.”, one interview participant reported.
4.2 Survey Results
In this section, we present the results of the survey’s quantitative and qualitative questions. While analyzing the qualitative questions, we identified four main themes and several associated sub-themes, summarized in Table 3. The sub-themes are not mutually exclusive—for example, the time pressure sub-theme can apply to more than one of the main themes.
4.2.1 Demographics
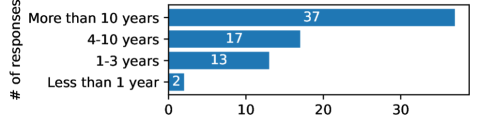
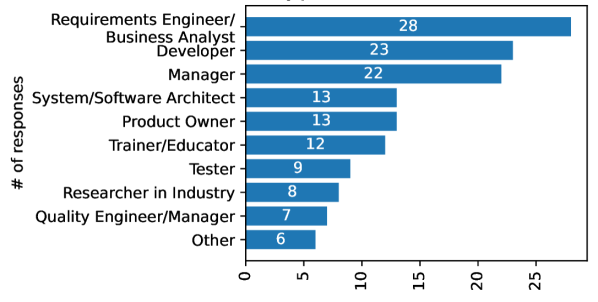
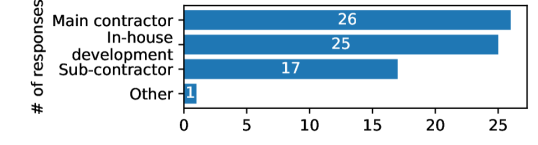
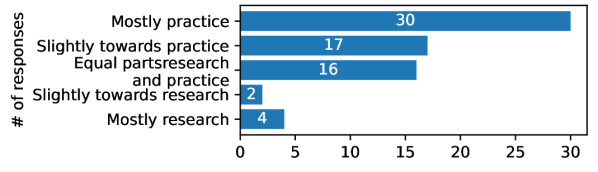
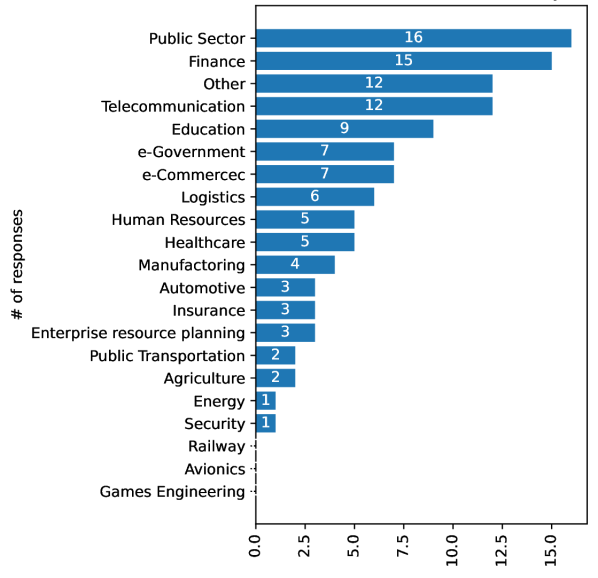
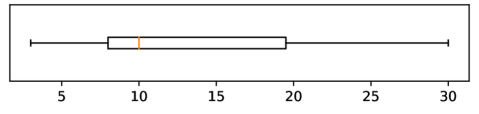
The survey was accessed by 125 potential participants and completed by 69 of them, which yields a completion rate of . For the results, we considered only responses to the entire questionnaire. The majority of participants (n=37) have more than 10 years of experience in requirements engineering, as shown in Figure 4. The primary job functions (see Figure 5) of the respondents are in operational roles, such as requirements engineers (n=28) and developers (n=23), as well as managerial (n=22). The majority of the respondents are performing their job functions (see Figure 6) as the main contractor of a company (n=26) or as part of in-house development (n=25). The majority of respondents rank themselves as rather practice- than research-oriented, as shown in Figure 7. The represented industrial sectors include a variety of domains as shown in Figure 8 with the exception of the railway, avionics, and games engineering domains. The respondents are involved in projects with a median team size of 10 individuals, although some involve up to 30 persons (see Figure 9). Out of the 69 participants, 40 are based in South and 5 in North America, 23 in Europe, and one in Asia.
| Theme | Sub-theme | Description | Occurrences |
| Factors influencing RED | Time pressure | A deadline for release a product or service, or their new version | 28 |
| Competition | Information gathered from external stakeholders in the same market | 13 | |
| Reputation | Internal customers’ complaints and requests | 5 | |
| Economic aspect | Budget adjustments, for example due to loss of sales | 19 | |
| Assessing and remediating RED | Time saving | Assessment of debt is based on the amount of time/effort saved | 25 |
| Customer involvement | The amount of customers, and which customers are impacted | 23 | |
| Agile development | The process models prioritizes other activities than debt assessment and remediation | 11 | |
| Review sessions | Need for ad-hoc review sessions to assess and remediated debt | 7 | |
| Traceability | Links between artifacts support RED assessment | 3 | |
| Process and artefacts in RED | Agile development | Artefacts typical of Agile (e.g., user stories) | 8 |
| Rework | The process includes extra rework due to RED | 8 | |
| Intentionality | Time pressure | A deadline for releasing a product or service, or their new version | 11 |
| Skill/knowledge | Lack of skills, knowledge, or due diligence | 9 |
4.2.2 Causes
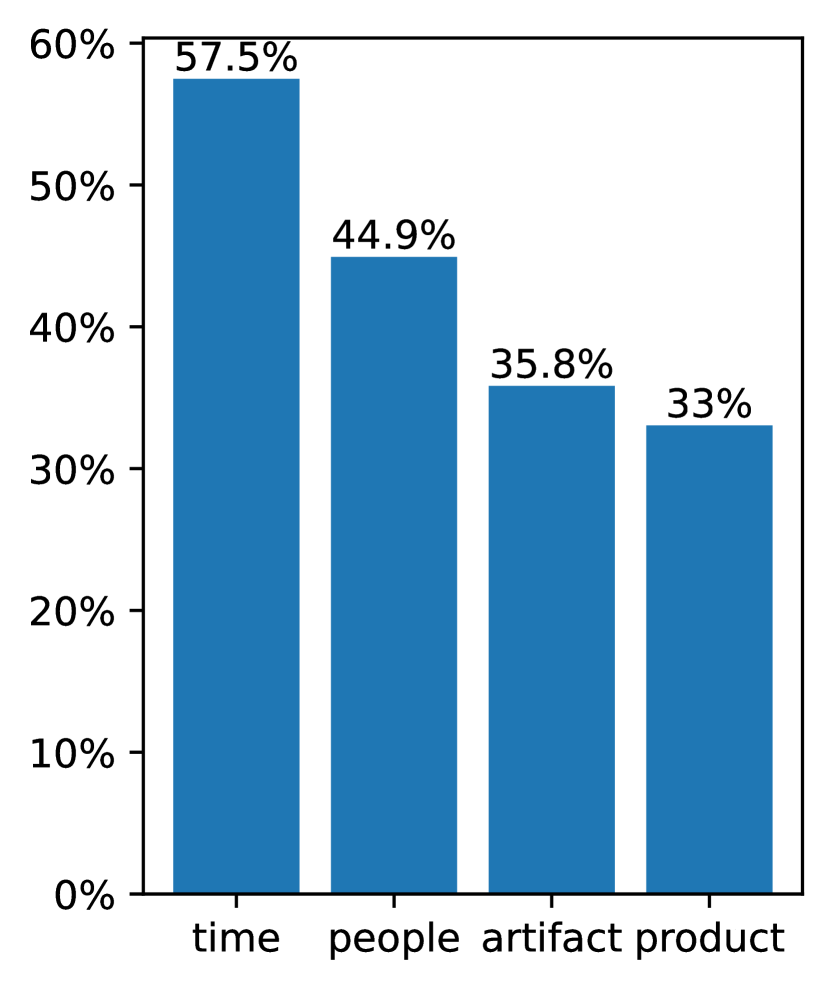
The first two authors manually categorized the RED causes that emerged from the interview study into requirements artifact-, time-, people-, and product-related. The full list of potential causes and their categorization can be found in the Appendix in Table 17. In the survey, we ask respondents to indicate one or more causes for RED from this list. Figure 10(a) shows the support for the categories of Causes averaged over all answers within a single category. For example, the causes in the time-related category, on average, were agreed upon by 57.5% of the survey participants. Respondent showed a strong agreement with time-related answers like time pressure to deliver a feature and time pressure to finalize the (systematic) requirements specification. People-related answers received the next-strongest support, with lack of domain knowledge and lack of communication between stakeholders being the most prominent. Requirements artifact- and product-related answers share comparable support as valid causes of RED. Requirements not documented—a property of the requirements artifacts potentially causing costly rework due to the lack of a tangible document to refer to—is the most agreed upon artifact-related cause for RED, corroborating the findings of Wagner et al. [5] that requirements incompleteness remains one of the most critical aspects of requirements engineering. Answers in the product-related category include technical complexity of the project, which is still deemed influential but less so compared to the aforementioned causes. The respondents also point specifically to the lack of skills resulting in accruing RED items. For example, one survey respondent commented on their answer that “decisions are made by product and business people without the background to realize their consequences. They know they are cutting corners and creating the debt on purpose (to speed up delivery usually).” Others pointed out the lack of knowledge regarding what the professional figure of a requirements engineer entails, as people without such knowledge unintentionally introduce debt. For example, one respondent commented: “Organizations have been trying to document less than necessary and having people engage in conversations and meetings to cover for the gaps, creating RE debt intentionally. When organizations are asked to document their requirements properly, they often don’t know how to do it or create low-quality requirements, creating debt unintentionally.”
The last comment stresses the role of the utilized process model and its influence in causing the accumulation of RED. When specifically asked about this, the respondents tend to agree that the process model impacts the likelihood of introducing RED (see Figure 11). They acknowledge that characteristics of Agile (e.g., focus on the customer, lightweight requirement format, communication) impose trade-offs when managing RED. For example, one respondent mentioned, “I believe that in the Agile model we can achieve faster results, but in compensation for the lack of formalization of requirements, it can end up generating requirements engineering debt.” and also “Agile projects suffer more requirements engineering debt due to the prioritization of good team communication instead of detailed requirements documentation.”

Furthermore, participants agreed that requirements engineering debt could be introduced both intentionally and unintentionally, as shown in Figure 12. We identified themes related to time pressure and skills and knowledge as the main drivers for the decision to introduce RED. Some respondents mention time pressure as the reason to intentionally introduce RED at the very initial phase of RE, such as requirements gathering (e.g., “Requirements engineering debt may be intentionally introduced if interested parties reduce the time required to gather requirements.”); whereas others acknowledge that time pressure is the results of external factors, such as customers demands (e.g., “it is needed to accelerate the development of a feature (or fix) to please a customer. In these cases, RED can be introduced intentionally. The attention point is: It needs to be paid later.”).

The analysis of the answers to qualitative questions revealed that companies consider several more factors when accruing RED. Some of these are the benefits against which debt is traded off. For example, themes such as beating the competition emerged. As a survey respondent reported, “If we will [lose] a big opportunity of product launching before another company, then there is a value in introducing RED.”, and—connected to it—reputation, especially when fulfilling legal obligations (e.g., “we simply have to focus on requirements that are considered as a potentially high risk of fines, in order to keep the company reputation”). Another important theme is the economic aspect which needs to be saved from parts of the RE process and allocated to activities that can push the product on the market faster.
4.2.3 Value
The first two authors manually categorized a list of values that emerged from the analysis of the interview (see Table 18). Figure 10(b) shows the average support for each category.
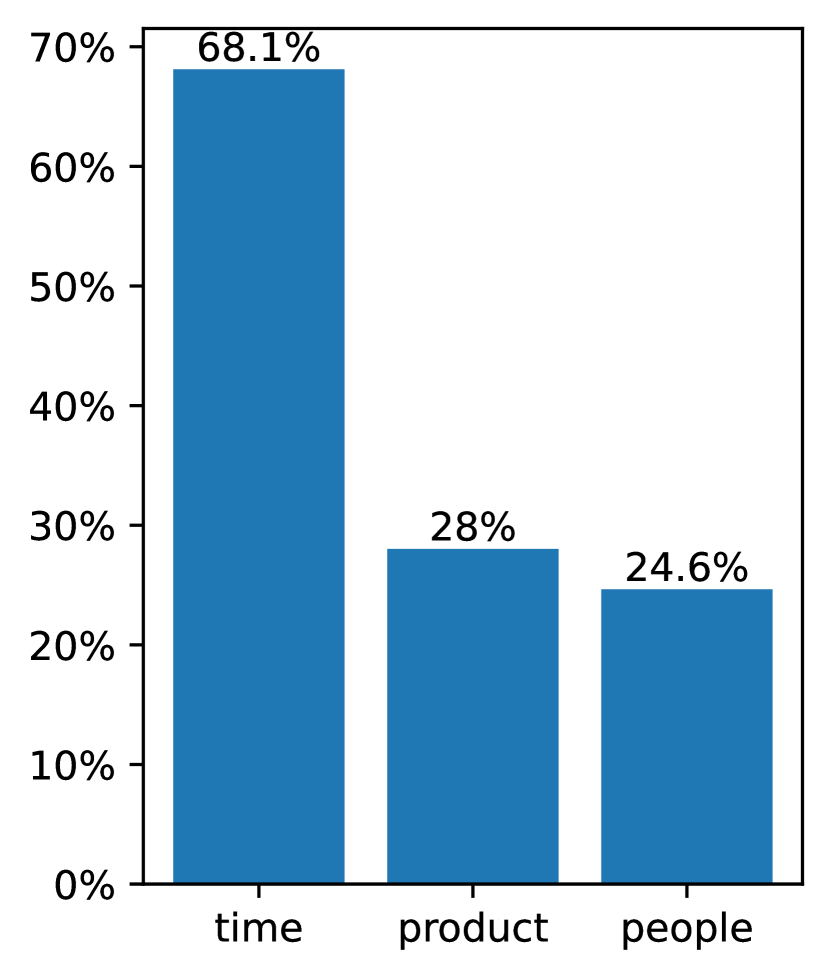
Time-related value like faster time to market receives the largest amount of agreement among all potential values for accruing requirements engineering debt. However, only 17% of the survey respondents report explicitly calculating the value of requirements engineering debt (Q12).
Most respondents did not pinpoint specific artifacts impacted by RED but agreed that RED cost is perceived in terms of the rework such artifacts undergo. For example, one respondent commented: “I believe it [RED] generates a great deal of rework. I’ve participated in projects where we had to redo several features due to lack of knowledge of the requirements on the part of the responsible stakeholder.” Other respondents mentioned that RED impacts the rework of other artifacts down the line, such as source code, which aligns with established findings by Boehm et al. [6]. For example, they said: “[paying back RED has] Additional costs on re-design, refactoring of the code.”
4.2.4 Symptoms
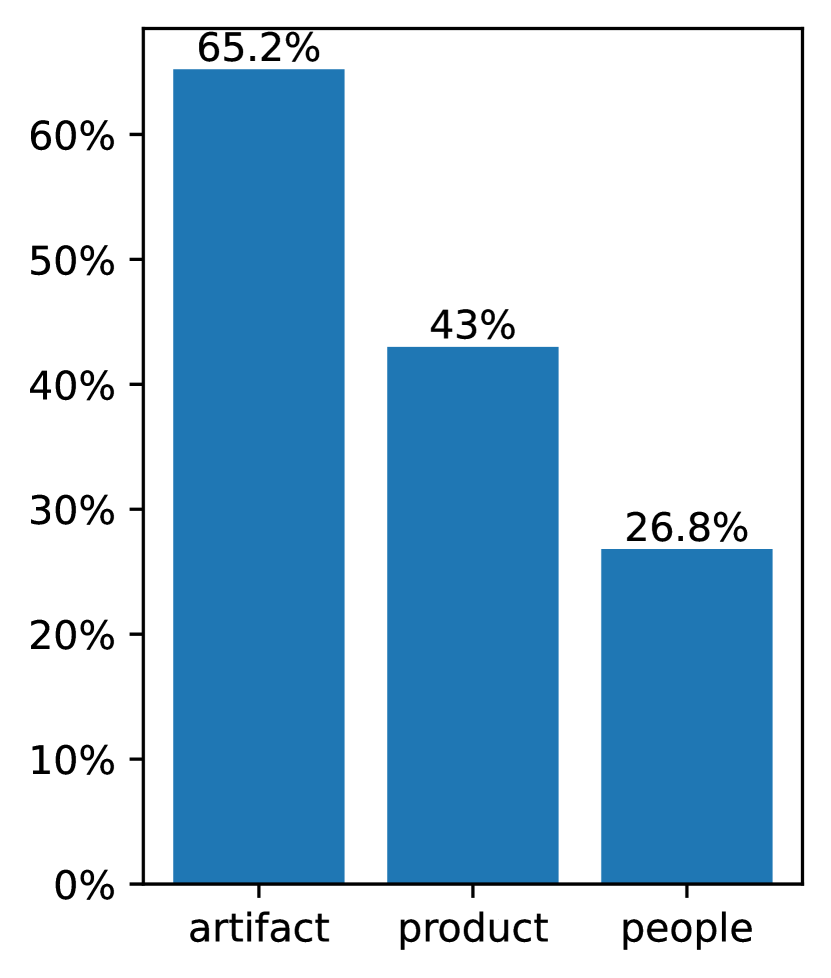
The first two authors manually categorized the symptoms which we obtained from the analysis of the interview study (see Table 19). Figure 10(c) shows the support the categories received on average. Requirements artifact-related symptoms received the strongest support overall, as survey participants agree upon incompleteness of requirements being the strongest symptom of requirements engineering debt. Product-related symptoms like additional operational cost of the product and not implementing requirements follow, while people-related symptoms like not involving all relevant stakeholders receive the least support. In addition, respondents agreed with the statement that requirements engineering debt could cause bankruptcy for products and requirements specifications, respectively (see Figure 13). However, the support for the bankruptcy of the product is greater. Figure 14 shows which ones, among the items the respondents reported as symptoms of RED, are likely to indicate impending bankruptcy.

4.2.5 Propagation
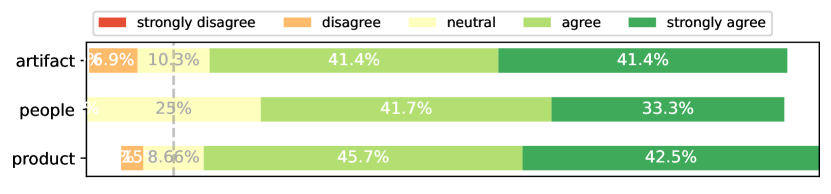
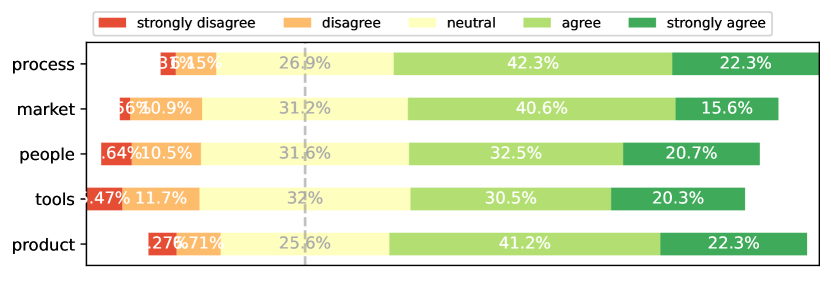
Figure 15 shows the distribution of agreement about which context factor categories—derived from the list by Petersen et al. [31]—increases the likelihood of RED further propagating. The figure shows that process- and product-related context factors are perceived to have the strongest influence on the propagation of RED, though the difference between groups is marginal. The strong support for the context factors maturity, quality, and size of the product is offset by the comparably weaker support for type and customization of the product.555The complete list of context factors and their categories is available in B, Table 20 Therefore, a sub-group of product-related context factors (containing maturity, quality, and size of the product) is dominant over all others.
4.2.6 Management
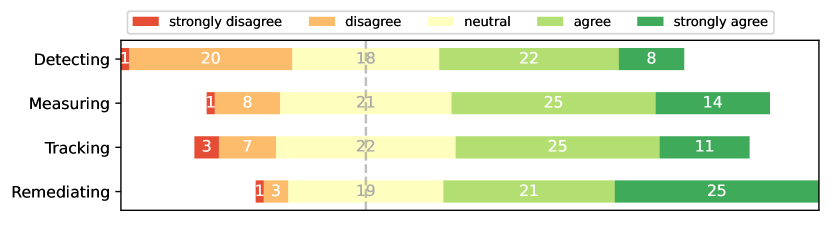
We survey four types of interaction with RED items; detecting, measuring, tracking, and remediating RED. While about one-third of the respondents report explicitly detecting (34%) and remediating (34%) RED items, a smaller fraction claims measuring (13%) and tracking (22%) them.
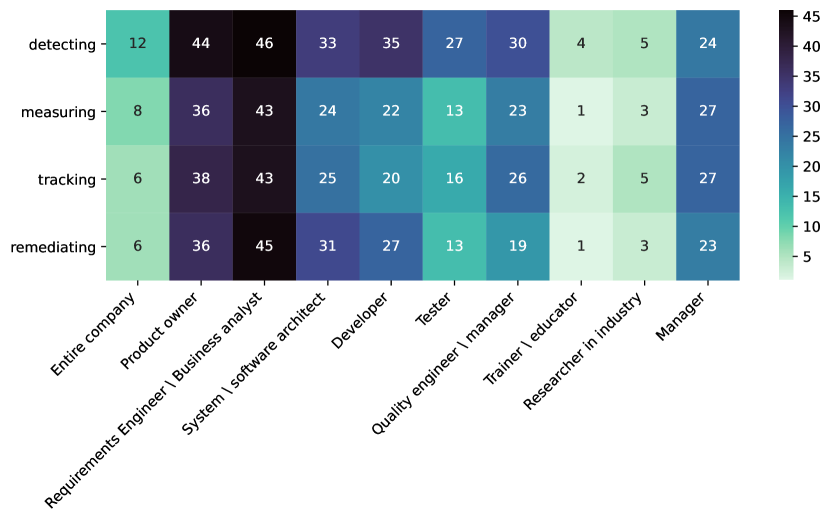
Detecting RED is perceived to be comparably the least expensive of the four activities while remediating is the most expensive (see Figure 16). In general, requirements engineers and product owners are perceived to hold the highest responsibility for interacting with RED, followed by stakeholders in downstream development activities, such as architects, developers, testers, and quality engineers. Figure 17 visualizes the agreement of the survey respondents regarding which role (on the x-axis) is responsible for an activity (on the y-axis). For example, 46 respondents agree that a requirements engineer/business analyst is responsible for detecting RED, while only 12 respondents agree that it should be the responsibility of the entire company.
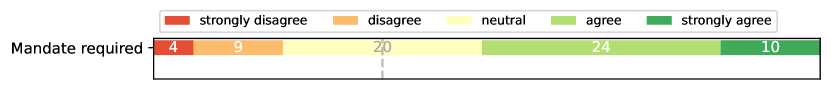
Moreover, 34 out of 69 respondents agree that remediating RED requires a mandate, as shown in Figure 18.
For most companies that measure RED, its actual value is related to time, such as the number of days saved by taking debt in order to release a feature more quickly. These measurements apply exclusively to intentional as well as unintentional-but-already-detected RED, as they presuppose an awareness of the debt items.
Another measure is reported to be the number of users (or customers) involved when taking debt, as a survey respondent reported: “the rule is usually no users, then zero value. So, any time spent on a requirement for an unused feature is debt.” Others recognize that calculating RED is often difficult, as not only the number of customers but also their expectations need to be taken into account—one respondent reported that “calculating RED value is often related to customer expectations, so it’s hard to do.” Conversely, customer dissatisfaction is perceived as the main “external” (i.e., not related to processes or stakeholders within the company) symptom of RED.
Customers and their involvement are also at the center of detecting the presence of unintentional RED. According to the respondents, some process models, such as Agile, are better at supporting RED detection (e.g., one respondent pointed out “Communication is probably the single most important in my opinion. Agile helps with that since you have frequent sprint cycles and small deliveries with valuable feedback that can help raise awareness of what is going wrong; notice that Agile mainly facilitates communication here.”).
Internally to a company, the main way to detect RED is to have systematic review sessions of the requirement artifacts (e.g., “Review of product requirement documents by peers/other stakeholders.”, as one respondent put it). However, the respondents revealed that RED is often detected only during development. This is in line with established literature which consequently formulated the need for “early error detection” [6].
In this case, the symptom of debt is perceived as the lack of (or hard-to-manage) traceability between requirements and other artifacts. RED items are tracked the same way that technical debt items are tracked, using issue trackers—for example, one survey respondent pointed out “[RED items] can be tracked as research/investigation issues/tickets similarly to how one might track technical debt items.” Remediation of the tracked RED items seems to be an ad-hoc process, which relies on specific indications provided by customers as indicated by this respondent—“we don’t explicitly remediate requirements debt, but we do spend a lot of time redesigning and reworking requirements from users complaints. The key component I see is having actionable feedback on what needs to change as early as possible.”
4.3 Resulting Theory
Our RED theory is organized around propositions and explanations. Propositions and explanations about causes, intentionality, and roles are reported in Table 4. Table 5 covers symptoms and factors influencing RED, while Table 6 reports aspects related to managing RED, including detecting, measuring, tracking, and remediating it.
| ID | Proposition | Source |
| P1 | RED items can have artifact-, time-, people-, and/or product-related causes. | Interviews, Literature |
| P2 | RED items can have time-, product-, and/or people-related value | Interviews, Literature |
| P3 | Time-related causes are most relevant. | Survey |
| P4 | Time-related value is the most relevant. | Survey |
| P5 | Agile facilitates the introduction of RED items and at the same time their detection. | Survey |
| P6 | The value of RED is rarely calculated in practice. | Survey |
| P7 | The responsibility of estimating the value of RED lies with requirements engineers or high-level stakeholders. | Survey |
| P8 | RED can be accrued both intentionally and unintentionally. | Survey |
| P9 | Time-related causes are predominantly intentional, people-related causes are mostly unintentional. | Survey |
| ID | Explanation | Prop. |
| E1 | Among the time-related reasons for accruing RED, beating competitors to market is what incentivizes to accrue RED. | P3, P4 |
| E1.1 | Companies accrue RED when reputation is at stake, especially when fulfilling legal obligation. | P3, P4 |
| E2 | Although Agile lacks formalization, which increases the likelihood of introducing (unintentional) RED, its focus on stakeholders communication and reviews helps uncovering RED. | P5 |
| E3 | There are causes that are more likely to be intentional and some that are rather unintentional. | P8 |
| E4 | Time-related causes accrue RED intentionally to achieve the time-saving values. People-related causes accrue RED unintentionally, since it is difficult/hard to pinpoint people-related shortcomings (like lack of diligence) | P9 |
| ID | Proposition | Source |
| P10 | RED items can have artifact-, time-, people-, and/or product-related symptoms. | Interviews, Literature |
| P11 | Incompleteness of requirements is the strongest symptom of RED. | Survey, Literature |
| P12 | Customer dissatisfaction is a strong symptom of RED. | Survey |
| P13 | RED can cause bankruptcy of both the SRS and the product. | Survey |
| P14 | Artifact- and product-related symptoms are most likely to lead to bankruptcy. | Survey |
| P15 | Context factors influence the likelihood of propagation of RED. | Survey |
| ID | Explanation | Propositions |
| E5 | Missing requirements remains one of the strongest indicators for accrued debt in RE [5] | P11 |
| E6 | Among the people-related symptoms, customer-related symptoms have two dimensions: not only do they need to be reached out to or involved, but also their relationship maintained. | P12 |
| E7 | There is a point of cumulative RED that makes a SRS or product unusable, forcing the company to discard the current assets and start anew. | P13 |
| E8 | Especially properties of the product (size, maturity and quality) under development influence how RED propagates from one item to another. | P15 |
| ID | Proposition | Source |
| P16 | The interactions with RED items are detecting, measuring, tracking, and remediating. | Interviews, Literature |
| P17 | It is more expensive to measure, track, and remediate RED items than detect them. | Survey |
| P18 | RED is more often detected and remediated than tracked or measured | Survey |
| P19 | RED items are tracked using issue trackers similarly to TD items | Survey |
| P20 | The remediation strategy is heavily dependent on the customer’s perspective on the RED item. | Survey |
| P21 | RED is often calculated considering the number of affected customers. | Survey |
| P22 | The responsibility of acting upon RED lies with requirements engineers or high-level stakeholders. | Survey |
| P23 | Remediating sometimes requires a mandate. | Survey |
| ID | Explanation | Propositions |
| E9 | Consequences of RED are often detected during downstream activities involving non-RE stakeholders. | P17 |
| E10 | RED items can be detected during requirements validation systematically, or ad-hoc by downstream stakeholders | P17 |
| E11 | While RED is often detected ad-hoc and remediated via systematic review sessions, there is a lack of techniques and tools to track and measure RED. | P18 |
| E12 | There is a lack of tooling tailored towards RED, forcing companies to adapt other tracking tools for this purpose. There might also not be a need for differentiation. | P19 |
| E13 | There is a lack of systematic remediation approaches, motivating companies’ remediation strategies to depend on customers perspectives. | P20 |
| E14 | There is no straight-forward, established way of calculating RED as it depends on features/characteristics of customers such as their expectations, which are hard to assess. | P21 |
| E15 | Requirements engineers who are most involved with the requirements and high-level stakeholders are expected to have a sufficient overview over the accumulated RED. | P22 |
| E16 | The responsibility of interacting with RED is diffused. The responsibility of detecting RED lies with high-level stakeholders, low-level stakeholders—which would enact the remediation—are hesitant to remediate RED items without a mandate. | P23 |
4.3.1 Propositions
We follow a conservative approach without any assumptions on the theoretical robustness in parts of the theory—i.e., the lack of sufficient quantitative data does not allow us to make claims about which propositions are more relevant than others. Further, we do not describe context conditions for the individual propositions. While such information can be valuable for inferring conditional hypotheses, our data does not allow for a balanced contextualization (e.g., regarding roles or industry sectors) across all propositions.
4.3.2 Explanation
This empirically grounded theory is aimed to serve as decision support in understanding and managing RED. Tables 4 and 5 guide the understanding of RED by characterizing the concepts contained in the RED metaphor. P3 and P4 emphasize that RED is mostly connected to time-related aspects, both in the form of cause and value. The potential value of accruing RED—reducing time to market—is commonly accepted as a sufficient reason for accruing it. Value is rarely calculated in practice (P6) since it is difficult to measure and track RED in detail, which aligns to prominent research on the challenge of measuring software-related quality [32, 6]. Although governance around RED is not clear, organizations avail stakeholders in management positions to estimate the value of RED (P7).
RED can be accrued both intentionally and unintentionally (P8), both bearing individual risks as cautioned during the interviews (see Section 4.1). While unintentional RED can go undetected and have a scaling impact on subsequent software development activities, intentional RED can simply be accepted and actively neglected. Different causes are more likely to be intentional; for instance, time-related causes are predominantly intentional, while people-related causes are mostly unintentional. The analysis of open-ended survey questions suggests that organizations are hesitant to blame individuals for accruing RED.
Missing or incomplete requirements are the strongest symptom of RED (P11), which aligns with findings in literature [5], as they escalate to customer dissatisfaction when left untreated (P12). This can ultimately result in the bankruptcy of a requirements specification and, in the long run, the product as a whole (P13), which emphasizes the scope of RED impact.
Context factors influence the likelihood of propagation of RED (P15). Among commonly known context factors, the size, maturity, and quality of the product under development strongly influence the propagation of debt.
Table 6 shows managing RED, which is decomposed into detecting, measuring, tracking, and remediating (P16) according to the interview results. Detecting RED items is less expensive than measuring, tracking, and remediating (P17) since detecting may happen ad-hoc. This corroborates the generally agreed upon notion of scaling cost models, e.g., the spiral model of software cost [6]. Among the four activities, measuring and tracking RED are the least common (P18), which is explained by a lack of specific tooling (P19) and the difficulty of properly quantifying RED (P21).
5 Discussion
Section 5.1 answers the research questions and discuss the relevance of this research. In particular, Section 5.2 discusses the results in relation to existing evidence and the general notion of TD. Finally, Section 5.3 addresses threats to validity.
5.1 Answers to the Research Questions
5.1.1 RQ1: How do practitioners understand RED?
The concepts of RED—e.g., the notion of TD applied to RE—are perceived to be similar to TD. These concepts consist of causes, items, effects, symptoms, and value. Most concepts can be categorized to be artifact-, time-, people-, or product-related (P1, P2). Time-related causes and value are most relevant (P3, P4), highlighting the motivation behind accruing RED to be time-savings. RED can be accrued intentionally and unintentionally (P7), though certain categories of concepts are strongly associated with either. For example, time-related causes are predominantly intentional, while people-related causes are mostly unintentional (P9).
A strong symptom of RED encountered during the development process is the incompleteness of requirements (P11), whereas customer dissatisfaction (P12) is a post-release symptom. RED can ultimately cause the bankruptcy of both the requirements specification and the product (P13), representing a point where the respective entity must be discarded completely. Context factors, especially the size, maturity, and quality of the product under development, influence the likelihood of RED propagation to other artifacts or processes (P15).
5.1.2 RQ2: How do practitioners manage RED?
The interviews presented in Section 4.1 show that the management of RED is composed of detecting, measuring, tracking, and remediating RED (P16). Detection is both the least expensive (P17) and most common (P18) type of interaction, likely because we lack specific tools for tracking (P19) and measuring RED (P21) in the industry. The responsibility of addressing RED is perceived to lie with requirements engineers and high-level stakeholders (P22) and requires an explicit mandate (P23).
5.1.3 Relevance to Research and Practice
Technical debt is no longer limited to source code. The metaphor has evolved to characterize circumstances where developers make compromises or take shortcuts throughout the development process, including when dealing with requirements. The practical manifestation and understanding of RED has an impact on both theory and practice.
In particular for researchers, this work scopes a RE-specific theory to the vast TD literature and harmonizes the vocabulary used to address RED. We see this empirically grounded theory as a fundamental basis to encourage and guide further RED research. The initial propositions serve as a set of falsifiable hypotheses, which invite follow-up, in-depth research on specific aspects of RED. Furthermore, the theory can be expanded by adding further empirically grounded propositions or specializing existing propositions by contextualization; for example, whether the way RED items are tracked (P19) depends on specific Agile practices, such as backlog management. Finally, researchers are invited to address gaps confirmed by propositions, for example, by devising a method to reliably measure RED (E14).
Practitioners can use the resulting theory to compare their own experiences and practices against the provided propositions. Although in the current form the theory is not intended to be prescriptive, practitioners can reflect upon the corresponding explanations, contextualize them to their settings, and devise their own initiatives to manage RED.
5.2 Relations to the Related Work and General Notion of TD
We discuss how existing literature corroborates the propositions by highlighting categories and concept occurrences identified in this and other studies.
Proposition 1 (P1) suggests that RED items can have time, people, artifact, and/or product-related causes. These categories were also identified in studies by Rios et al. [12] and Barbosa et al. [14] that focused on documentation and requirements debt types, while the example occurrences of these categories are presented in Table 1. Proposition 3 (P3) suggests that time-related causes are the most relevant causes of RED. Time-related causes, conceptualized as deadline, are also identified as the top-ranked cause for documentation and requirements type of debt in related studies [12, 14]. Moreover, an impending deadline is perceived as the most common cause of TD in general [33], indicating that the significance of deadline is also applicable in the RED domain.
Similarly to proposition 1 (P1), proposition 10 (P10) suggests that RED items can have symptoms related to time, people, the product, and/or artifacts. Available studies by Rios et al. [12] and Barbosa et al. [14] corroborate this further. This is also visible in the level of effect occurrences that form these categories. Proposition 11 (P11) suggests that the incompleteness of requirements is the leading symptom of RED, while the following is the customer dissatisfaction, as suggested in Proposition 12 (P12). From Table 1, we observed that both previous studies [12, 14] support P12 by discussing low external quality—interpreted as customer dissatisfaction—as one of the leading effects of documentation and requirement debt. On the other hand, inadequate, non-existing or outdated documentation, identified by Rios et al. [12], directly supports the P11. However, incompleteness of requirements, or documentation of any kind, is not among the top 10 effects of TD in general, whereas the low external quality occupies the fourth place [33]. This shows a misalignment between the top-ranked effects of TD in general and the RED symptoms.
5.3 Threats to Validity
To discuss the threats to validity, we adopt the guidelines proposed by Wohlin et al. [34] and extended by Molléri et al. [35].
External Validity
The online survey sample size limits the study result generalizability. However, it still grants the proposal of an initial theory as a starting point for further development and evaluation as argued in Section 4.3. In addition, we further minimize this threat to validity by including demographic checks in the survey instrument to ensure the representativeness and eligibility of the participants (see Table 7).
Conclusion Validity
We ensured the conclusion validity by carefully aligning the resulting RED theory with the established and more mature TD theory, when possible. The fourth to seventh authors reviewed the resulting propositions based on their involvement in TD research. Confidence in our conclusion depends on the strength of the evidence found in the empirical studies—i.e., interviews and survey. We acknowledge that the results regarding development process models, such as Agile, are based, for the majority, on the answers to two survey questions.
Internal Validity
Both the interview and the survey instrument were designed following established guidelines [35]. We piloted the instrument before deployment to ensure the understandability of the questions. We piloted the survey among the first three authors and with one external senior reviewer to adjust the formulations and ensure unambiguous interpretations.
Interpretive Validity
Responses to open-ended survey questions were coded jointly by the first and second authors and validated by the third author to ensure a reliable inference of the participants’ opinions. However, a significant portion of responses was written in Brazilian Portuguese and translated using Google Translate. The fourth author, fluent in Brazilian Portuguese, confirmed the reliability of the translations by manually assessing a random sample.
6 Conclusion
In this paper, we report on an initial theory of RED. Our theory includes propositions and explanations representing RED understanding and management in practice. We developed the theory based on in-depth interviews with three experts in the area of RED and a global survey with 69 practitioners.
The theory constitutes the first empirical foundation enabling future work on the debt metaphor in requirements engineering. Contributions based on this theory will further the understanding of RED in practice by leveraging the debt metaphor to enable better decision-making in RE. Further research needs to synthesize the insights gained on RED, and the problems and challenges practitioners face in RE, as revealed in the Naming the Pain in Requirements Engineering initiative (see www.napire.org). Such endeavor will allow us to explore further root causes for RED as well as better understand its impact. Additional empirical work must verify or refute the existing propositions and contextualize and extend them. Such endeavor will allow us to further explore root causes for and impacts of RED and will provide a more robust basis for further reasoning about phenomena surrounding RED. These include the notion of intentionality in connection to laziness or upfront lack of commitment to RE, which has not been discussed in the scope of this study, or the impact of the software process model (like Agile), which deserves more attention.
Acknowledgements
This work was supported by the KKS foundation through the S.E.R.T. Research Profile project at Blekinge Institute of Technology. We additionally thank the reviewers for their valuable feedback that helped strengthen the manuscript.
References
- [1] N. Rios, M. de Mendonça Neto, R. Spínola, A tertiary study on technical debt: Types, management strategies, research trends, and base information for practitioners, Information and Software Technology 102 (2018) 117–145.
- [2] C. Siebra, G. Tonin, F. Silva, R. Oliveira, A. Junior, R. Miranda, A. Santos, Managing technical debt in practice: An industrial report, in: Proceedings of the ACM-IEEE international symposium on Empirical software engineering and measurement, 2012, pp. 247–250.
- [3] N. Ernst, On the role of requirements in understanding and managing technical debt, in: 2012 Third International Workshop on Managing Technical Debt (MTD), IEEE, 2012, pp. 61–64.
- [4] V. Lenarduzzi, D. Fucci, Towards a holistic definition of requirements debt, in: 2019 ACM/IEEE International Symposium on Empirical Software Engineering and Measurement (ESEM), IEEE, 2019, pp. 1–5.
- [5] S. Wagner, D. M. Fernández, M. Felderer, A. Vetrò, M. Kalinowski, R. Wieringa, D. Pfahl, T. Conte, M.-T. Christiansson, D. Greer, et al., Status quo in requirements engineering: A theory and a global family of surveys, ACM Transactions on Software Engineering and Methodology (TOSEM) 28 (2) (2019) 1–48.
- [6] B. Boehm, P. Papaccio, Understanding and controlling software costs, IEEE transactions on software engineering 14 (10) (1988) 1462–1477.
- [7] W. Cunningham, The WyCash portfolio management system, ACM SIGPLAN OOPS Messenger 4 (2) (1992) 29–30.
- [8] P. Kruchten, R. Nord, I. Ozkaya, Managing technical debt: Reducing friction in software development, Addison-Wesley Professional, 2019.
- [9] B. Berenbach, On technical credit, Procedia Computer Science 28 (2014) 505–512.
- [10] Z. Li, P. Avgeriou, P. Liang, A systematic mapping study on technical debt and its management, Journal of Systems and Software 101 (2015) 193–220.
- [11] D. O’Connor, Technical debt in semiconductor equipment: it’s time to pay it down, Solid State Technology 53 (7) (2010) 34–36.
- [12] N. Rios, L. Mendes, C. Cerdeiral, A. P. F. Magalhães, B. Perez, D. Correal, H. Astudillo, C. Seaman, C. Izurieta, G. Santos, et al., Hearing the voice of software practitioners on causes, effects, and practices to deal with documentation debt, in: International Working Conference on Requirements Engineering: Foundation for Software Quality, Springer, 2020, pp. 55–70.
- [13] N. Rios, R. O. Spínola, M. Mendonça, C. Seaman, The most common causes and effects of technical debt: first results from a global family of industrial surveys, in: Proceedings of the 12th ACM/IEEE International Symposium on Empirical Software Engineering and Measurement, 2018, pp. 1–10.
-
[14]
L. Barbosa, S. Freire, N. Rios, R. Ramač, N. Taušan,
B. Pérez, C. Castellanos, D. Correal, A. Pacheco, G. López,
Others, Organizing the TD
management landscape for requirements and requirements documentation debt,
in: Workshop on Requirements Engineering (WER2022), Maryland Shared Open
Access Repository, Brazil, 2022, p. 123.
URL http://hdl.handle.net/11603/25249 - [15] N. Rios, R. Spínola, M. Mendonça, C. Seaman, The practitioners’ point of view on the concept of technical debt and its causes and consequences: a design for a global family of industrial surveys and its first results from brazil, Empirical Software Engineering 25 (5) (2020) 3216–3287.
- [16] A. Melo, R. Fagundes, V. Lenarduzzi, W. Santos, Identification and measurement of Requirements Technical Debt in software development: A systematic literature review, Journal of Systems and Software 194 (2022) 111483. doi:10.1016/j.jss.2022.111483.
- [17] B. Curtis, J. Sappidi, A. Szynkarski, Estimating the principal of an application’s technical debt, IEEE software 29 (6) (2012) 34–42.
- [18] N. Brown, Y. Cai, Y. Guo, R. Kazman, M. Kim, P. Kruchten, E. Lim, A. MacCormack, R. Nord, I. Ozkaya, et al., Managing technical debt in software-reliant systems, in: Proceedings of the FSE/SDP workshop on Future of software engineering research, 2010, pp. 47–52.
- [19] N. Ernst, S. Bellomo, I. Ozkaya, R. Nord, I. Gorton, Measure it? manage it? ignore it? software practitioners and technical debt, in: Proceedings of the 2015 10th Joint Meeting on Foundations of Software Engineering, 2015, pp. 50–60.
- [20] Y. Guo, C. Seaman, R. Gomes, A. Cavalcanti, G. Tonin, F. Da Silva, A. Santos, C. Siebra, Tracking technical debt—an exploratory case study, in: 2011 27th IEEE international conference on software maintenance (ICSM), IEEE, 2011, pp. 528–531.
- [21] C. Seaman, Y. Guo, Measuring and monitoring technical debt, in: Advances in Computers, Vol. 82, Elsevier, 2011, pp. 25–46.
- [22] M. Marshall, The key informant technique, Family practice 13 (1996) 92–97.
- [23] S. Baltes, P. Ralph, Sampling in software engineering research: A critical review and guidelines, Empirical Software Engineering 27 (4) (2022) 1–31.
- [24] D. Cruzes, T. Dyba, Recommended steps for thematic synthesis in software engineering, in: 2011 international symposium on empirical software engineering and measurement, IEEE, 2011, pp. 275–284.
- [25] J. Saldaña, The coding manual for qualitative researchers, The coding manual for qualitative researchers (2021) 1–440.
- [26] R. J. Wieringa, Design science methodology for information systems and software engineering, Springer, 2014.
- [27] D. Sjøberg, T. Dybå, B. Anda, J. Hannay, Building theories in software engineering, in: Guide to advanced empirical software engineering, Springer, 2008, pp. 312–336.
- [28] D. M. Fernández, S. Wagner, M. Kalinowski, M. Felderer, P. Mafra, A. Vetrò, T. Conte, M.-T. Christiansson, D. Greer, C. Lassenius, et al., Naming the pain in requirements engineering, Empirical software engineering 22 (5) (2017) 2298–2338.
- [29] L. M. Hilty, E. K. Seifert, R. Treibert, Information systems for sustainable development, IGI Global, 2005.
- [30] E. Zabardast, J. Frattini, J. Gonzalez-Huerta, D. Mendez, T. Gorschek, K. Wnuk, Assets in software engineering: What are they after all?, Journal of Systems and Software (2022) 111485.
- [31] K. Petersen, C. Wohlin, Context in industrial software engineering research, in: 2009 3rd International Symposium on Empirical Software Engineering and Measurement, IEEE, 2009, pp. 401–404.
- [32] B. Boehm, J. Brown, M. Lipow, Quantitative evaluation of software quality, in: Proceedings of the 2nd international conference on Software engineering, 1976, pp. 592–605.
- [33] R. Ramač, V. Mandic, N. Taušan, N. Rios, S. Freire, B. Pérez, C. Castellanos, D. Correal, A. Pacheco, G. López, C. Izurieta, C. Seaman, R. Spínola, Prevalence, common causes and effects of technical debt: Results from a family of surveys with the IT industry, Journal of Systems and Software (09 2021). doi:10.1016/j.jss.2021.111114.
- [34] C. Wohlin, P. Runeson, M. Höst, M. C. Ohlsson, B. Regnell, A. Wesslén, Experimentation in software engineering, Springer Science & Business Media, 2012.
- [35] J. S. Molléri, K. Petersen, E. Mendes, An empirically evaluated checklist for surveys in software engineering, Information and Software Technology 119 (2020) 106240.
- [36] V. Larivière, D. Pontille, C. Sugimoto, Investigating the division of scientific labor using the contributor roles taxonomy (CRediT), Quantitative Science Studies 2 (1) (2021) 111–128.
Appendix A Survey Protocol
Questions are marked as single choice (SC) or multiple choice (MC). Single-choice questions answered on the five-point Likert scale are marked as (SCL). Open questions are marked as (O).
Several questions asking respondents to name stakeholders use the following list: Requirements Engineer/Business analyst, product owner, system/software architect, developer, tester, quality engineer/manager, trainer/educator, researcher in industry, manager, other (please specify). This list is hereby referred to as (stakeholders).
A.1 Understanding requirements engineering debt
| ID | Question - Options | Type |
| Q1 | In which country are you working? - (list of countries) | SC |
| Q2 | Which primary job functions did you have in the last years? - (stakeholders) | SC |
| Q3 | Where do you identify your profession on a scale between research and practice? | SCL |
| Q4 | How many years of general experience do you have from working with requirements in any form? | O |
| Q5 | How many people are involved in the latest project you have been working on? | O |
| Q6 | Which organisational role does your project team have in your company? - Main contractor (main responsible for the development), sub-contractor (responsible for part of a larger development project), in-house development, other (please specify) | SC |
| Q7 | Please select the main industrial sector of your project and the application domain of the systems you build. - agriculture, automotive, finance, healthcare, security, manufacturing, energy, logistics, railway, avionics, insurance, education, public sector, enterprise resource planning, human resources, e-Government, telecommunication, games engineering, public transportation, e-Commerce, other (please specify) | SC |
| ID | Question - Options | Type |
| Q8 | In your experience, which of the following options qualify as causes of requirements engineering debt? - taking shortcuts while fixing requirements, business decisions, lack of (domain) knowledge, lack of diligence, tradeoff between cost and benefit, tradeoff between different requirements, requirements documentation in artefacts, information scattered across artefacts, information scattered across stakeholders, lack of requirements elicitation process, inconsistencies between different visions for the same product, lack of tooling support for RE, changes in the market of the product, requirements are only specified at a high level, technical complexity of the project, time pressure to deliver a feature, requirements engineers lack awareness of requirements debt, lack of communication between stakeholders, lack of prioritization, changes in requirements documentation, lack of requirements formalization, specifying cross-cutting features, requirements not documented, lack of requirements traceability, time pressure to finalize the (systematic) requirements specification, other (please specify) | MC |
| Q9 | To what extent do you agree with the statement: “The overall software process model has an influence on the likelihood of introducing requirements engineering debt.” | SCL |
| Q10 | Please motivate your answer to the question above. | O |
| ID | Question - Options | Type |
| Q11 | What of the following qualifies as the value of introducing requirements engineering debt? - faster time to market, advantage over competitors, focus on feature with better return on investment, legal obligations, decisions based on authorative opinions, other (please specify) | MC |
| Q12 | In your projects, do you calculate the value of requirements debt? | SC |
| Q13 | Who estimates the value of requirements engineering debt? - entire company, (stakeholders) | MC |
| Q14 | In your opinion, which factors influence these values? | O |
| Q15 | How is this value calculated? | O |
| ID | Question - Options | Type |
| Q16 | In your experience, which of the following options qualify as a symptom of requirements engineering debt? - not implementing requirements, disregarding automation processes, architectural cost, lack of usage of the product, additional operational cost of the product, decreased reputation of the company/product, sow release of a product, incompleteness of requirements, not involving all relevant stakeholders, others (please specify) | MC |
| Q17 | To what extent do you agree with the statement: “Requirements engineering debt can cause a product to go bankrupt.” | SCL |
| Q18 | Rate your agreement to the statement, that the following symptoms of RED can lead to bankruptcy. (rating all options from Q16) | SCL |
| Q19 | Do you degree with the statement: "Requirements engineering debt can cause a single requirements specification to bankrupt?" | SCL |
| ID | Question - Options | Type |
| Q20 | To what extent do you agree with the statement: “Requirements engineering debt can be introduced intentionally”? | SCL |
| Q21 | To what extent do you agree with the statement: “Requirements engineering debt can be introduced unintentionally”? | SCL |
| Q22 | Can you elaborate on your perception of intentionality for requirements engineering debt? | O |
| ID | Question - Options | Type |
| Q23 | Which of the following context factors increase the likelihood of propagation of requirements engineering debt? - maturity of the product under development (PUD), quality of the PUD, size of the PUD, type of the PUD, customization of the PUD, development process, type of artefacts involved in the development, software development tools and techniques, Other practices and techniques not related to the development process, roles implemented in the company, experience of the people involved, model of the overall organization, distribution of the organization, company strategy in the market, constraints by the market | SCL |
| Q24 | In your opinion, what are the most prominent effects of requirements engineering debt on software development activities and artefacts? | O |
A.2 Managing requirements engineering debt
| ID | Question - Options | Type |
| Q25 | To what extent do you agree with the statement: “Detecting requirements engineering debt is expensive.” | SCL |
| Q26 | Do you explicitly detect requirements engineering debt in your company/project? | SC |
| Q27 | When do you tend to identify requirements engineering debt? - during the requirements validation, explicitly before eliciting requirements for a new feature/release, during the overall risk assessment of the project, other (please specify) | SC |
| Q28 | In your opinion, what techniques can be utilized for detecting requirements engineering debt? | O |
| Q29 | Who is responsible for detecting requirements engineering debt? - entire company, (stakeholders) | SC |
| ID | Question - Options | Type |
| Q30 | To what extent do you agree with the statement: “Measuring requirements engineering debt is expensive.” | SCL |
| Q31 | Do you explicitly measure requirements engineering debt in your company/project? | SC |
| Q32 | In your experience, what techniques are eligible for measuring requirements engineering debt? | O |
| Q33 | Who is responsible for measuring requirements engineering debt? - entire company, (stakeholders) | SC |
| ID | Question - Options | Type |
| Q34 | To what extent do you agree with the statement: “Tracking requirements engineering debt is expensive.” | SCL |
| Q35 | Do you explicitly track requirements engineering debt in your company/project? | SC |
| Q36 | In your experience, what techniques are eligible for tracking requirements engineering debt? | O |
| Q37 | Who is responsible for tracking requirements engineering debt? - entire company, (stakeholders) | SC |
| ID | Question - Options | Type |
| Q38 | To what extent do you agree with the statement: “Remediating requirements engineering debt is expensive.” | SCL |
| Q39 | Do you explicitly remediate requirements engineering debt in your company/project? | SC |
| Q40 | In your experience, what techniques can be utilized for remediating requirements engineering debt? | O |
| Q41 | To what extent do you agree with the statement: “Introducing new debt items precludes clearing old debt items”? | SCL |
| Q42 | Who is responsible for remediating requirements engineering debt? - entire company, (stakeholders) | SC |
| Q43 | To what extent do you agree with the statement: “Remediating requirements engineering debt requires a mandate”? | SCL |
Appendix B Answer categories
For several survey results reported in Section 4, the answers were grouped by categories. The following tables describe all groups and contained answers for causes (Table 17), values (Table 18), symptoms (Table 19), and context factors [31] (Table 20)
| Category | Answers |
| Time | 1. Taking shortcuts while fixing requirements 2. Time pressure to deliver a feature 3. Time pressure to finalize the (systematic) requirements specification |
| Product | 1. Business decisions 2. Trade-off between cost and benefit 3. Changes in the market of the product 4. Technical complexity of the product 5. Specifying cross-cutting features |
| People | 1. Lack of (domain) knowledge 2. Information scattered across stakeholders 3. Inconsistencies between different visions for the same product 4. Requirements engineers lack awareness of requirements debt 5. Lack of communication between stakeholders |
| Artifact | 1. Trade-off between different requirements 2. Requirements documentation in artefacts 3. Information scattered across artefacts 4. Lack of requirements elicitation process 5. Lack of tooling support for RE 6. Requirements are only specified at a high level 7. Lack of prioritization 8. Changes in requirements documentation 9. Lack of requirements formalization 10. Requirements not documented 11. Lack of requirements traceability |
| Category | Answers |
| Time | Faster time to market |
| Product | Advantage over competitors, focus on feature with better return on investment, legal obligations |
| People | Decisions based on authoritative opinions |
| Category | Answers |
| Product | Not implementing requirements, architectural cost, lack of usage of the product, additional operational cost of the product, decreased reputation of the company/product, slow release of a product |
| People | Disregarding automation processes, not involving all relevant stakeholders |
| Artifact | Incompleteness of requirements |
| Category | Answers |
| Product | Maturity of the product under development, Quality of the product under development, Size of the product under development, System type of the product under development, Customization of the product under development |
| Process | Activities of the development process, Artefacts of the development process |
| Tools | Usage of tools for automated software development, Other practices and techniques not related to the development process |
| People | Roles implemented in the company, Experience of people involved, Model of overall organization, Distribution of the organization, Strategy of addressing the market |
| Market | Constraints by the market |
CRediT
We report the contribution of the authors to this manuscript using the Contributor Roles Taxonomy (CRediT) by Larivière et al. [36]:
-
1.
Julian Frattini: Conceptualization (equal), Data curation (lead), Investigation (equal), Methodology (equal), Visualization (lead), Project administration (lead), Writing - Original Draft Preparation (lead), Writing - Review & Editing (supporting)
-
2.
Davide Fucci: Conceptualization (equal), Data curation (supporting), Investigation (equal), Resources (equal), Methodology (equal), Project administration (supporting), Supervision (lead), Writing – Original Draft Preparation (supporting), Writing – review & editing (equal).
-
3.
Daniel Mendez: Conceptualization (supporting), Funding acquisition (lead), Investigation (equal), Methodology (supporting), Resources (lead), Supervision (supporting), Writing – Original Draft Preparation (supporting), Writing – review & editing (supporting).
-
4.
Rodrigo Spinola: Resources (equal), Validation (supporting), Writing - Review & Editing (supporting)
-
5.
Vladimir Mandić: Resources (equal), Writing - Review & Editing (supporting)
-
6.
Nebojša Taušan: Resources (equal), Writing - Original Draft Preparation (supporting), Writing - Review & Editing (supporting)
-
7.
Muhammad Ovais Ahmad: Resources (equal), Writing - Original Draft Preparation (supporting), Writing - Review & Editing (supporting)
-
8.
Javier Gonzalez-Huerta: Conceptualization (supporting), Writing - Review & Editing (supporting)